Article

Analysis of Extreme Temperature Variations on the Yunnan-Guizhou Plateau in Southwestern China over the Past 60 Years

1
School of Management Science and Engineering, Guizhou University of Finance and Economics, Guiyang 550025, China
2
Guizhou Green Development Strategy High-End Think Tank, Guizhou University of Finance and Economics, Guiyang 550025, China
*
Authors to whom correspondence should be addressed.
Sustainability 2022, 14(14), 8291; https://doi.org/10.3390/su14148291
Submission received: 8 June 2022 / Revised: 2 July 2022 / Accepted: 4 July 2022 / Published: 6 July 2022
(This article belongs to the Section Air, Climate Change and Sustainability)

Abstract

:
Analysis of variations in 12 extreme temperature indices at 68 meteorological stations on the Yunnan-Guizhou Plateau (YGP) in southwestern China during 1960–2019 revealed widespread significant changes in all temperature indices. The temperature of the hottest days and coldest nights show significantly increasing trends, and the frequencies of the warm days and nights also present similar trends. The temperature of the coldest night has a significant and strong warming trend (0.38 °C/decade), whereas the frequency of frost days shows the fastest decrease (1.5 days/decade). Increases in the summer days are statistically significant, while a decreasing trend for the diurnal temperature range is not significant. Furthermore, there were significant differences in the changes of temperature indices between 1960–1989 and 1990–2019. Most parts of the YGP underwent significant warning, manifesting that the mountainous regions are relatively sensitive and vulnerable to climate change. The correlation coefficients between the temperature indices and various geographical factors (latitude, longitude, and height) reflect the complexity of regional temperature variability and indicate enhanced sensitivity of extreme temperatures to geographical factors on the YGP. It was also found that extreme temperatures generally had weaker correlations with the El Nino-Southern Oscillation, North Pacific Index, Southern Oscillation Index, North Atlantic Oscillation, and East Asian Summer Monsoon Index than with the South Asian summer monsoon index, Nino4 indices and Arctic Oscillation, and there were more insignificant correlations. Regional trends of the extreme temperature indices reflect the non-uniform temperature change over the YGP, which is due to the complex interaction between atmospheric circulation patterns and local topography. The results of this study have important practical significance for mitigating the adverse effects of extreme climatic changes, in particular for the YGP with its typical karst geomorphology and fragile ecological environment.

1. Introduction

The increasing frequency and intensity of extreme temperatures around the world has led to the repeated occurrence of global climate disasters, which have had serious effects on water resources [1], vegetation growth [2], agricultural productivity [3]. Other important areas are that human society must deal with in the 21st century [4]. At the regional scale, the effects of anthropogenic greenhouse gas forcing on temperature extremes are slowed down or intensified by regional forcing caused by land use/land cover changes, regional processes (e.g., soil moisture or snow/ice-albedo feedback), aerosol concentrations, and interdecadal and multidecadal natural variability [5]. In recent years, changes of extreme temperature in the context of climate warming have attracted considerable attention due to their great impact on ecosystems and mankind for disaster prevention and mitigation [6,7]. Previous studies suggested that an increase in the number of extreme events is roughly proportional to the rate of warming trends, with an increase in both warm and cold extremes [4,8]. IPCC (2021) also reported that climate change is already affecting natural and human systems across all continents and oceans as it has significant local and global impacts [5]. However, the spatial distribution of extreme temperatures is not the same worldwide, due to regional differences in climate system responses to enhanced radiative forcing and complex interactions between nonlinear climate systems and local and regional factors [4,9]. Numerous studies have shown that global extreme warm events of more than 70% have significantly increased, while extreme cold events have significantly decreased, including Australia [10], China [11], Europe [12], and North America [13]. Jiang et al. found that high plateaus and mountainous have complex geological and climatic conditions and are more vulnerable and sensitive to climate change [14].
The Yunnan-Guizhou Plateau (YGP), with lower elevations in the southeast and higher elevations in the northwest, is one of the four plateaus in China. The YGP forms the unique mountain landform of the plateau and results in significant climatic differentiation in the region due to the different topographical characteristics and atmospheric circulation conditions [15,16]. Gu et al. analyzed the temperature variations over the YGP and showed that there had been a remarkable warming trend from 1960 to 2014 and the warming rates had also increased significantly since 1990, with higher rates in the western part and lower in the eastern part [15]. Some studies documented that altitude is one of the most important factors influencing extreme climate change [17] and the local topography and weakening of the Asian summer monsoon strength have contribution to the changes of extreme precipitation [18] in Yunnan province. In recent years, the extreme climatic events in YGP have been addressed in-depth by more and more scholars, but there are still some limitations because of a lack of high-quality data from relatively an insufficient study period and few meteorological stations in this region. There are relatively few studies on the YGP as an independent geomorphic unit, neglecting the analysis of the frequency, and magnitude of extreme climatic events over the whole YGP. Meanwhile, the YGP is a typical region with karst geomorphology and complex climatic conditions, which is a subject worthy of long-term climate research. Additionally, some researchers have shown that regional extreme climate events are likely to be related to the atmospheric circulation pattern anomalies [1,5,19], e.g., the El Nino-Southern Oscillation (ENSO), North Pacific Index (NPI), Pacific Decadal Oscillation (PDO), Nino4 indices, Southern Oscillation Index (SOI), North Atlantic Oscillation (NAO), Arctic Oscillation (AO), South Asian summer monsoon index (SASMI) and the East Asian Summer Monsoon Index (EASMI). Extreme climate variations are a result of the complex impact of geographical factors and atmospheric circulation. Therefore, there is an increasing need for a more comprehensive description and analysis of changes in extreme temperatures in YGP and cover a longer period, especially to investigate the influence of geographical factors and atmospheric circulation patterns.
Given all this, the present study mainly attempted to analyze the spatial-temporal variations of extreme temperature and the influences of geographical parameters (latitude, longitude, and altitude) on extreme temperature indices and to evaluate their relationships with atmospheric circulation patterns (ACPs) over the YGP from 1960 to 2019. The specific objectives of this article are to: (1) present trend analyses of various extreme temperature indices in YGP during 1960–2019, (2) understand the impacts of various geographical factors (longitude, latitude, and elevation) on extreme temperature indices over the YGP, and (3) explore association of variations in the extreme temperatures with ACPs (ENSO, NPI, SOI, NAO, AO, SASMI, EASMI, and Nino4 indices). The results of this study would be of practical and long-run significance in establishing accurate estimates of future climate change projections and meteorological disaster prevention over the YGP of China.

2. Materials and Methods

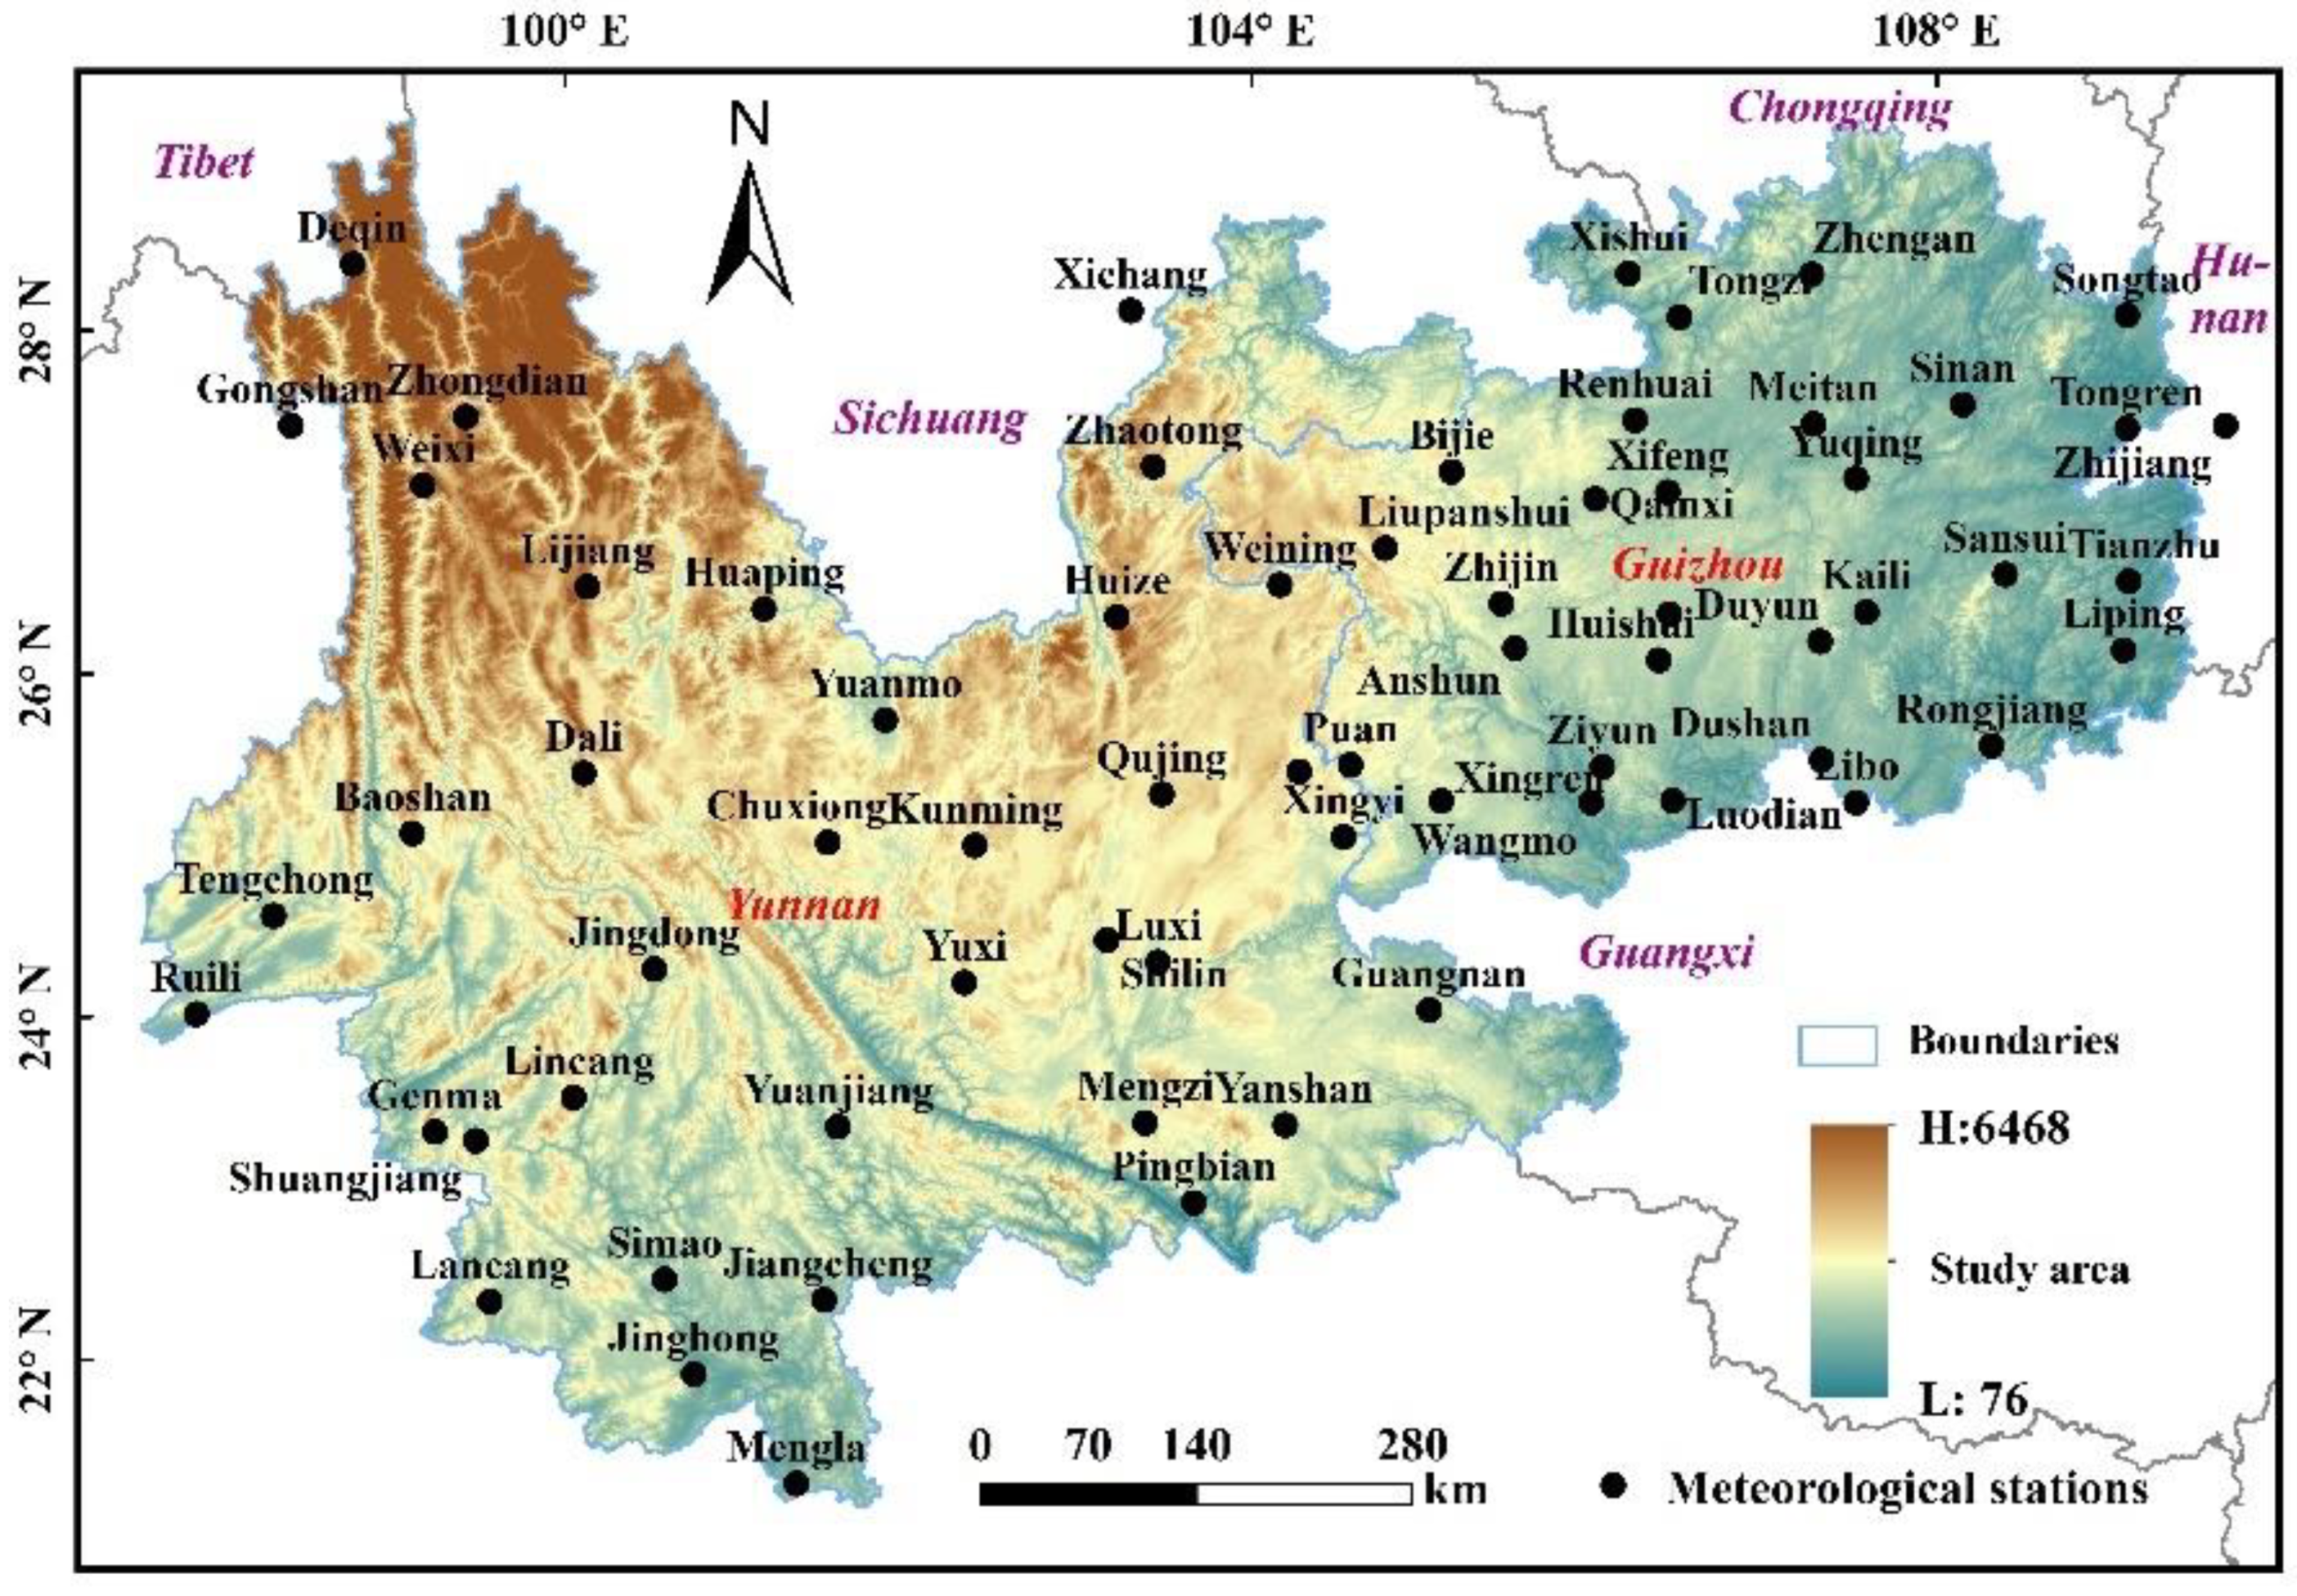
2.1. Study Area and Data Description

The Yunnan-Guizhou Plateau (YGP), including most of Yunnan and Guizhou provinces, and some small regions in Guangxi, Sichuan, and Hunan provinces, is one of the four plateaus in China [20]. Its spatial extent is about 400 to 800 km from the north to the south and 1000 km from the east to the west. The topography of the YGP, with an elevation ranging from 400 to 3500 m, stepped decreases from northwest to southeast (Figure 1). The YGP is a humid subtropical region with a subtropical monsoon climate and is characterized by high mountains, deep valleys, highly dense mountain streams and most abundant types of forest vegetation in China [21]. The climate in this region has significant spatial variability due to the different topographical characteristics and atmospheric circulation conditions. Due to the influence of YGP, the structure of the Kunming quasi stationary front is different from a general cold front in temperature field, humidity field, and other aspects. The present climate of the region is a subtropical plateau climate with an average annual precipitation of 1006 mm and a mean annual temperature of 14.7℃, but it is unevenly distributed in time and space [16,21].
In this study, the original datasets of daily maximum and minimum temperatures from 1960 to 2019 for 68 weather stations were provided by the National Meteorological Information Center of China (http://www.nmic.cn/, accessed on 10 November 2020). In order to ensure the reliability of data, we excluded these stations with missing data for more than one year. When the data missing was less than one year, we interpolated with the most relevant adjacent stations. We carried out data quality control before the calculation of extreme indices due to differences in meteorological data from different stations, instruments and data acquisition procedures. Criteria for quality control included: replacement of all missing values (originally coded as −99.9) with an internal format recognized by the R statistical software; elimination of any negative differences between the daily maximum and minimum temperatures; outlying of a threshold determined by the mean value ± 3 standard deviations [19,22,23]. Once datasets were quality controlled, the spatial coverage, completeness, and homogeneity of the datasets had to be evaluated as climatic time series often modifications in terms of station location, instrumentation, or observation procedures. Data homogeneity was assessed using RH test V4.0 software developed by Wang and Feng at the Climate Research Branch of the Meteorological Service of Canada (https://etccdi.pacificclimate.org/software.shtml, accessed on 10 November 2020). Additionally, the ACPs are main influences on atmospheric conditions [1,11,24,25]. This paper considered eight different ACPs affecting the extreme temperature indices. The ENSO, NPI, SOI, NAO, AO, and Nino4 indices are obtained from the National Centers for Environmental Information (https://www.ncei.noaa.gov/, accessed on 10 November 2020). The South Asian summer monsoon index (SASMI) and East Asian Summer Monsoon Index (EASMI) were derived from http://lijianping.cn/dct/page/1, accessed on 10 November 2020. In this study, the annual mean values are calculated on the basis of the average monthly values.

2.2. Methods

2.2.1. Definition of Extreme Temperature

This study only considered 12 of the temperature-related indices recommended by the Expert Team on Climate Change Detection and Indices (ETCCDI), as some indexes (e.g., ice days, cold and warm spell duration indicator, etc.) are not applicable to this study. During the last several years, these 12 indices have been extensively deployed in the study of extreme temperatures around the world [9,26,27,28]. The indices were calculated at each station using RClimDex 1.9 software (https://etccdi.pacificclimate.org/software.shtml, accessed on 10 November 2020).
The indices are divided into three different categories [26,29]: absolute indices including the hottest day (TXx), warmest day (TXn), coldest night (TNn), and warmest night (TNx); percentile indices including cold days (TX10P), cold nights (TN10P), warm days (TX90P), and warm nights (TN90P); other indices including diurnal temperature range (DTR), frost days (FD), tropical nights (TR), and summer days (SU). A detailed description of these indices is shown in Table 1.

2.2.2. Trend Analysis

To examine the nonlinear trend in each extreme temperature index of each station, the nonparametric Mann-Kendall (M-K) test was employed [30,31]. The M-K test, recommended by the WMO, is a powerful trend detection method that is widely used in meteorological and hydrological time-series analyses in different parts of the world [23,25,32,33]. To further investigate whether there is a change in the variations of temperature extremes in different periods, the whole period (1960–2019) was divided into two periods of 1960–1989 and 1990–2019 in this study. Therefore, the M-K test was computed for each index at three time periods: 1960–2019, 1960–1989, and 1990–2019.
The value of the test statistic Z is used to compute the significance level; Z > 0 indicates upward trend, whereas Z < 0 indicates downward trend. These trends were used at the p < 0.05 and p < 0.01 level of significance if |Z| > 1.96 and |Z| > 2.58, respectively, unless otherwise stated. In present study, significance levels of p < 0.01 and p < 0.05 were used. Furthermore, the nonparametric Sen’s slope estimator is used to determine the magnitudes of the trends for the regional annual mean extreme temperature [25,33]. The temporal and spatial variations in extreme temperature indices were analyzed using Origin Pro 2019, SPSS 26.0, MATLAB R2020a, and ArcGIS 10.2.

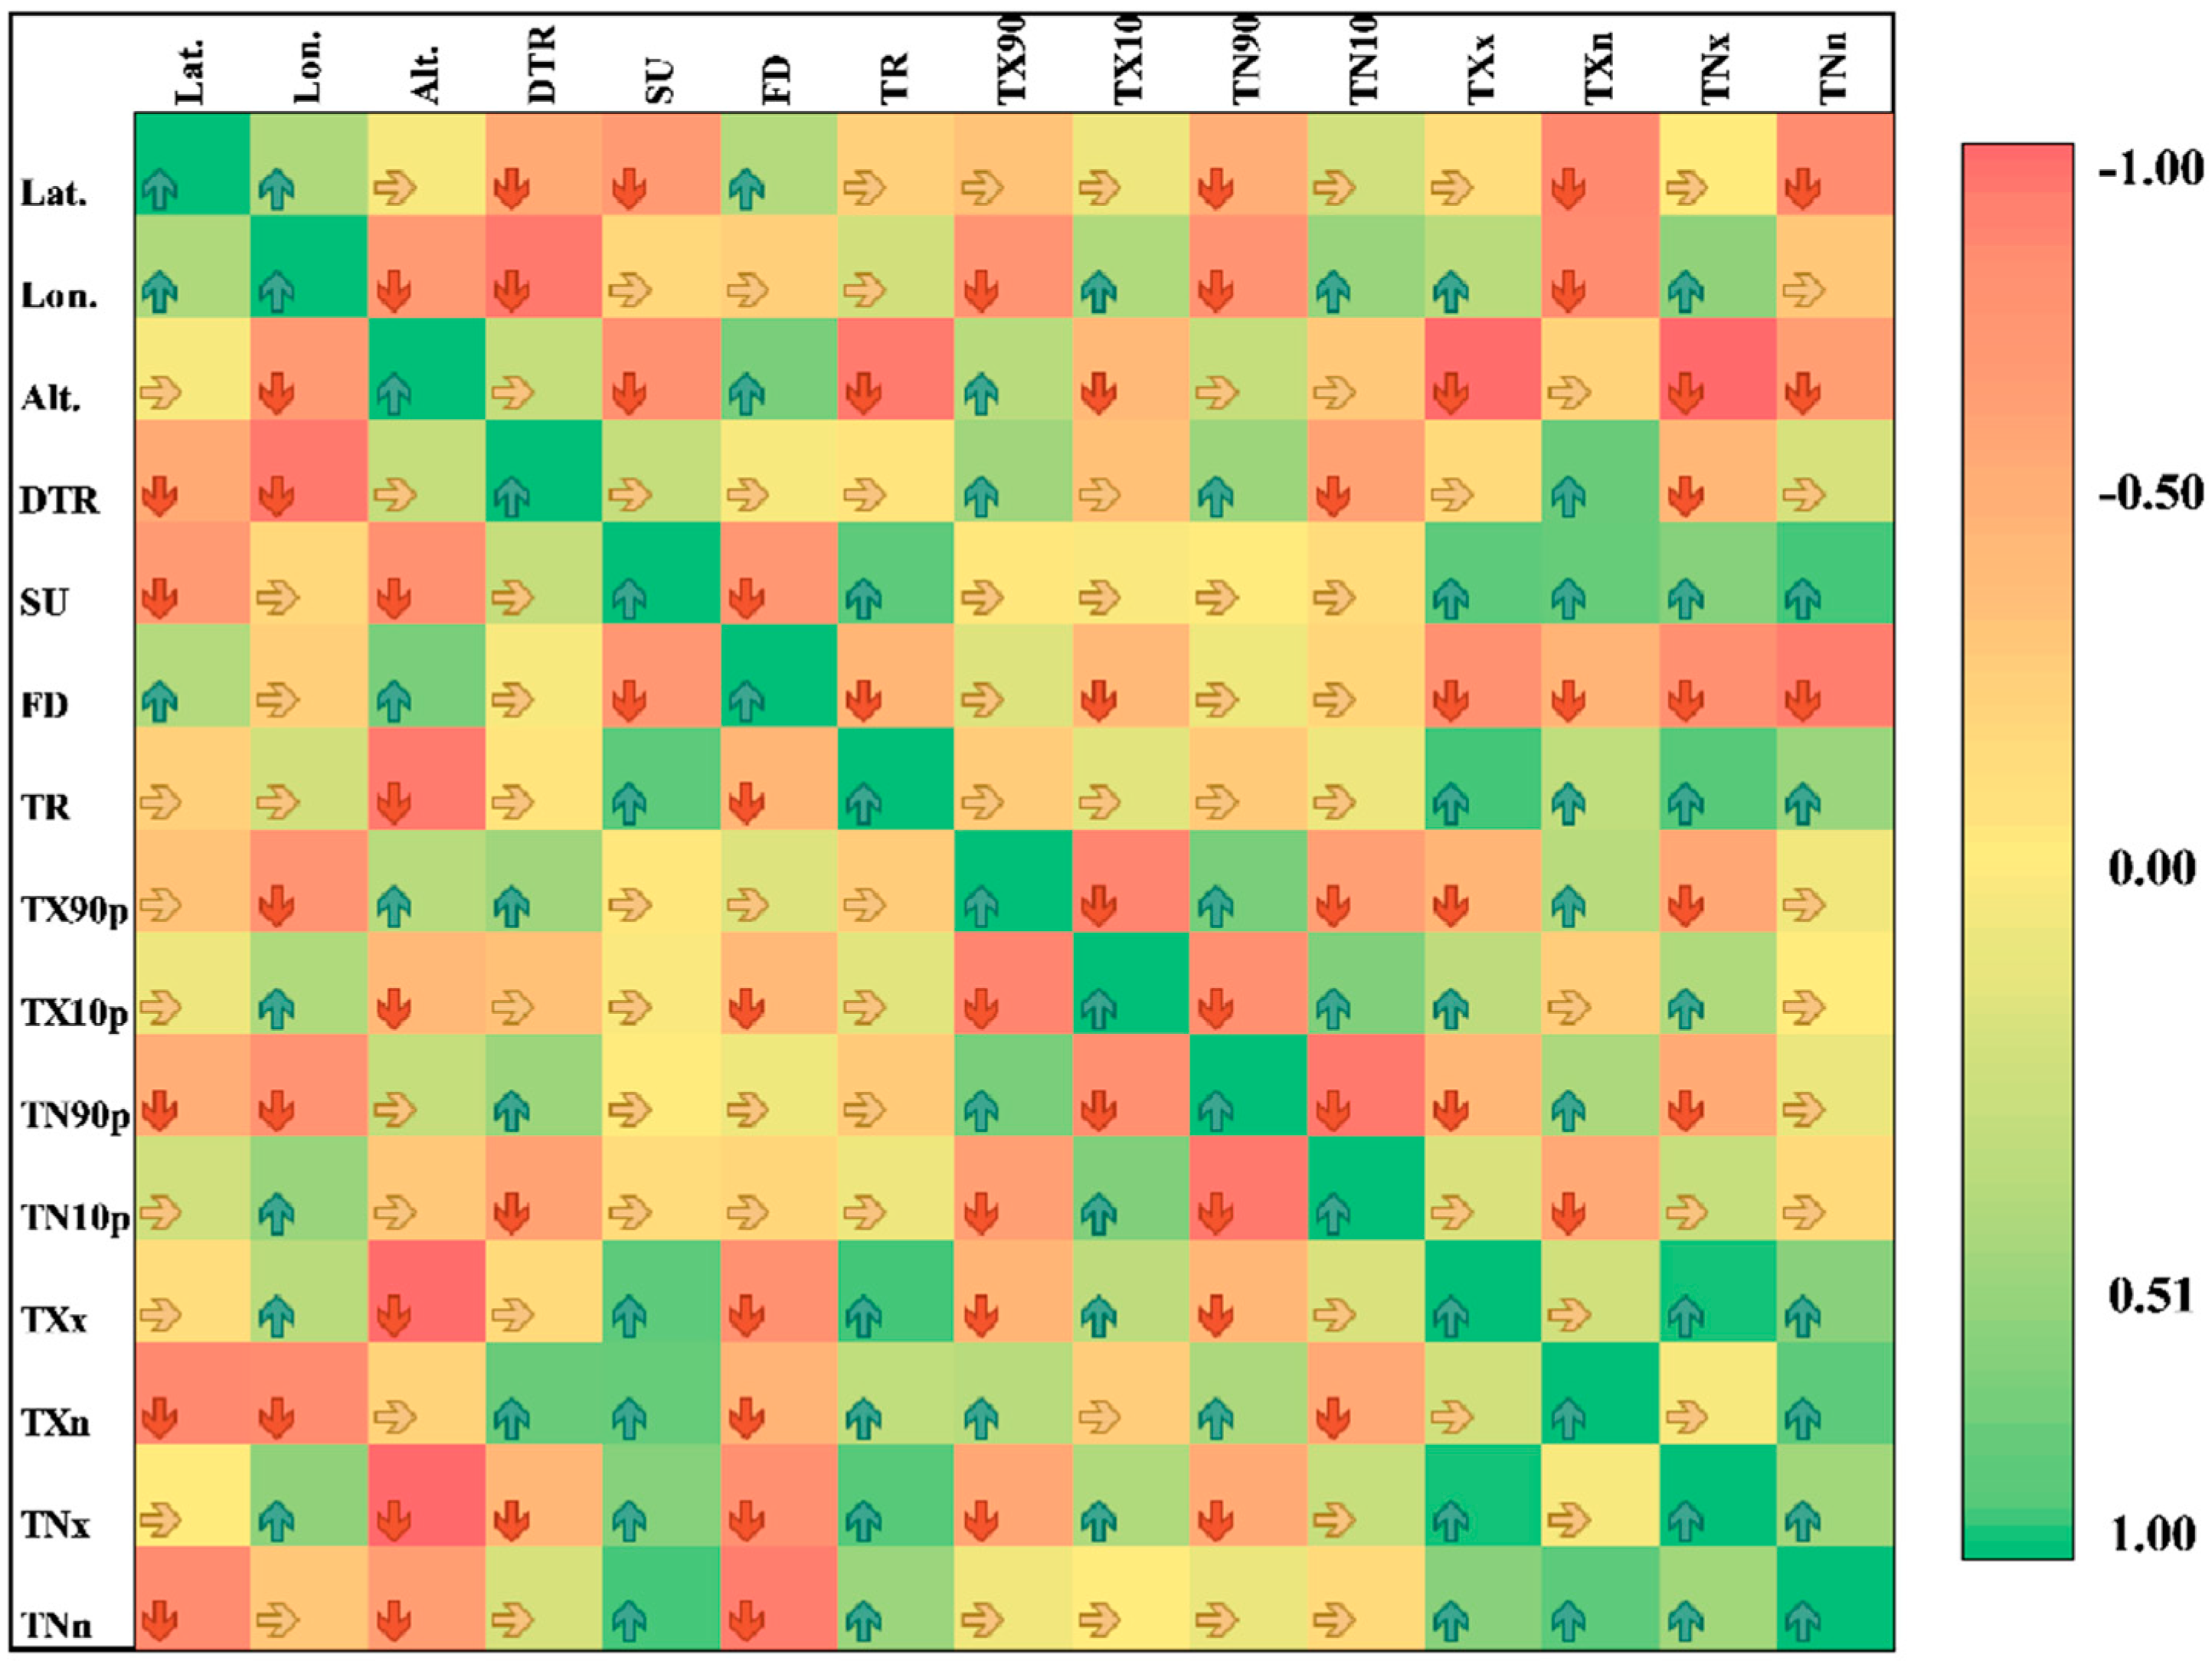
2.2.3. Correlation Analysis

In order to comprehensively investigate the factors that influence extreme temperature indices, the correlations between these temperature-related indices and longitude, latitude, elevation, and the ACPs were obtained by using Spearman’s correlation test. The correlation coefficient ρx can be calculated as,
ρ x = S x y / ( S x * S y ) 0.5
where,
S x = i = 1 n ( x i x ¯ ) 2
S y = i = 1 n ( y i y ¯ ) 2
The two-tailed Student’s t-test at the 5% level of significance was used to check the statistical significance of the correlation coefficients.

3. Results

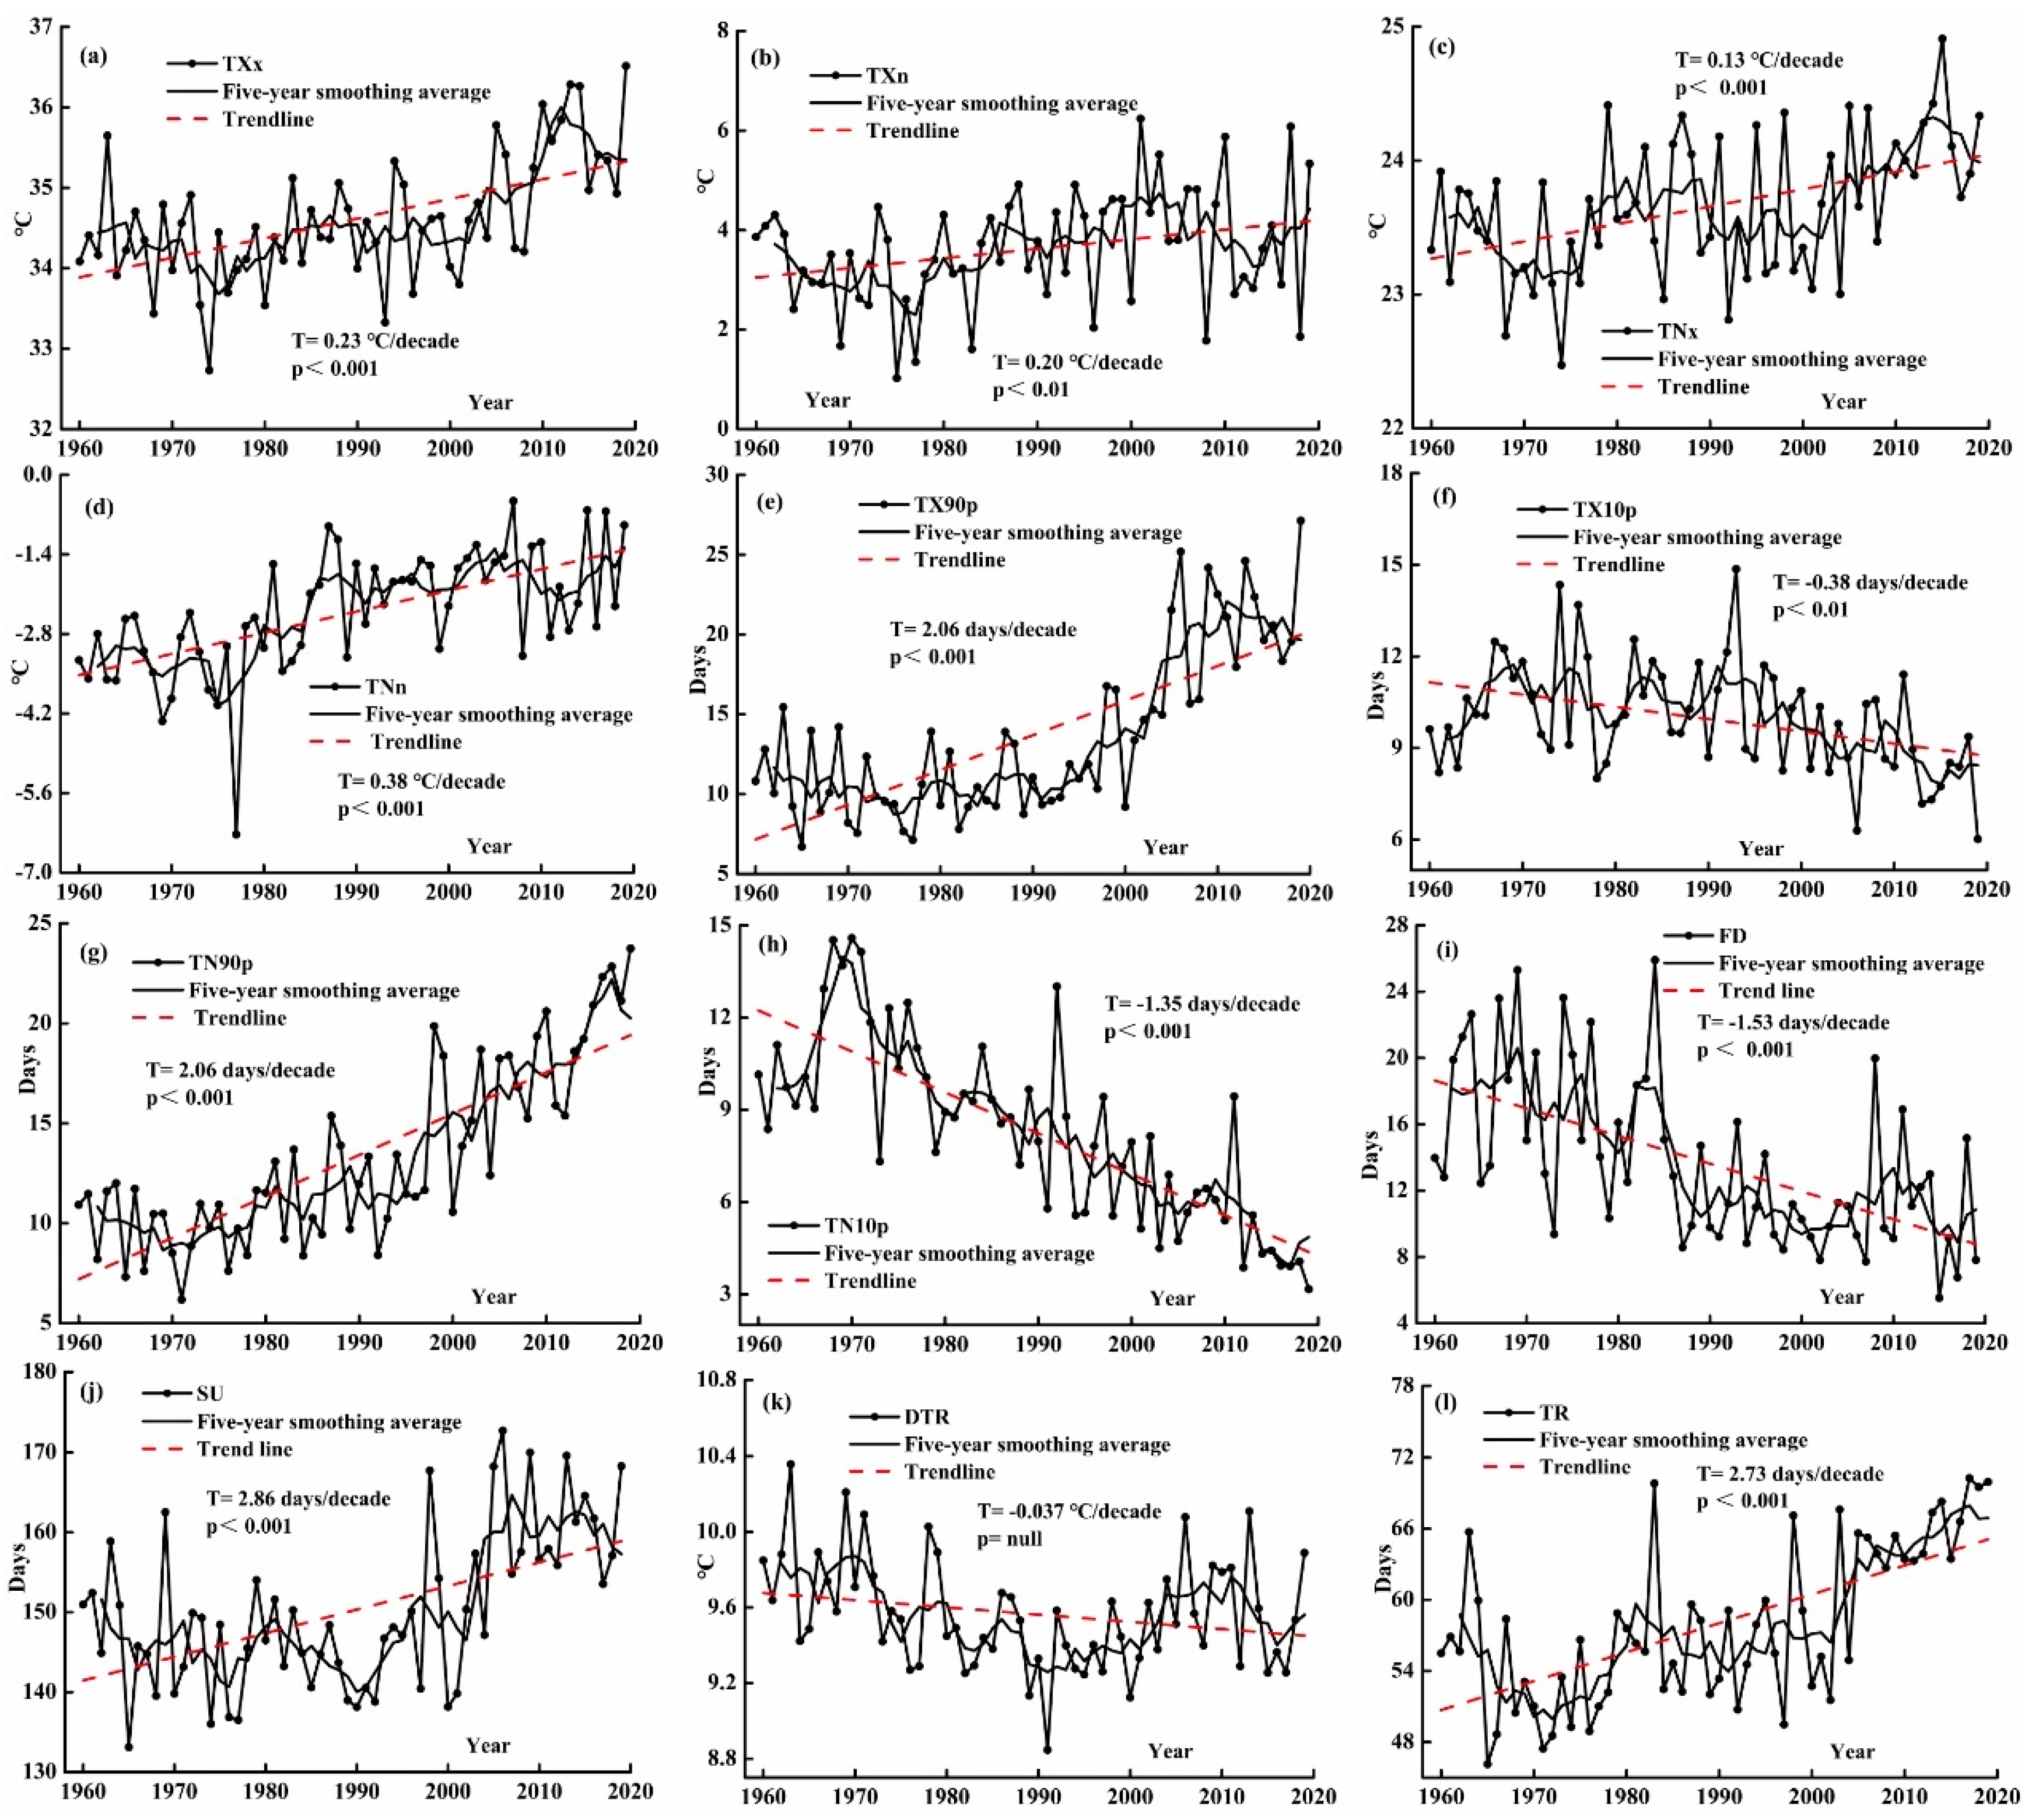
3.1. Temporal Variation in Extreme Temperature Indices

3.1.1. Absolute Indices (TXx, TXn, TNx, and TNn)

For TXx, TXn, TNx, and TNn, the whole YGP exhibited significant increasing trend of 0.23, 0.2, 0.13, and 0.38 °C/decade, respectively (Figure 2a–d). This indicated that the absolute indices for the extreme temperature increased significantly and were sensitive to global warming response. Among them, the increase rate of TXn and TNx was relatively small during 1960–2019 (Figure 2b,c), while the increase rate of TXx and TNn was relatively larger, especially the TNn, which was the fastest, whose annual variation tendency rate reached 0.38 °C/decade (Figure 2d). Several changing phases can also be detected in absolute indices according to their trends of five-year smoothing average and the average decadal values across different decades in YGP (Figure 2a–d, Table 2). It is important to mention here that, from the 1960s to the 1970s, the absolute indices showed a decreasing trend with a small range, and thereafter these indices had large fluctuations and showed a significantly upward trend till the late 2000s. The average decadal value of TXn and TNn were the smallest in the 1970s and the largest in the 2000s, but from then on, they presented decreasing trend in the 2010s (Table 2). From the 1990s to the 2010s, a pronounced increasing trend had been detected for the TXx and TNx series till 2010s. The four indices are basically consistent with each other, which all show increasing trends with fluctuations. These results also indicate that cold nights decreased significantly while hot days show a significantly increasing trend over the YGP in the context of regional warming.

3.1.2. Percentile Indices (TX90p, TX10p, TN90p, and TN10p)

The 1960–2019 trends for the percentile indices and their difference in YGP are presented in Figure 2e–h). There had the same changing tendency in TX90p and TN90p. Both of them presented significant increasing trends with corresponding rates of change of 2.06 days/decade during 1960–2019 (Figure 2e,g), which became increasingly clear after 2000. However, the number of TX10p and TN10p significantly decreased by a rate of 0.38 and 1.35 days/decade (Figure 2f,h) from 1960 to 2019, respectively. The increasing and decreasing trends of TX90p, TN90p, and TN10p were significant at the 0.001 level. As for TX90p and TN90p, the average decadal values were the smallest (about 10 days) in the 1970s and the largest in the 2010s (about 20 and 22 days), and increased from the 1970s to the 2010s with the maximum value of 27 and 23 days which occurred in 2019 (Table 2). TX10p increased significantly from the 1960s to the mid-1980s, and then declined significantly from the 1980s to the 2010s (Figure 2f, Table 2). The decreasing trend of TN10p became more obvious after mid-1970s, indicating an accelerated warming period (Figure 2h, Table 2). The warmest year for TN10P occurred in 2019, with about 3 days less than the mean value (5 days) in 2010–2019.

3.1.3. Other Indices (FD, SU, DTR, and TR)

The regional series of the additional indices and their 5-year moving average from 1960 to 2019 in the study area are depicted in Figure 2i–l). The FD series shows a remarkable decrease trend with a magnitude of 1.53 days/decade (Figure 2i). FD declined dramatically before 2005, and showed a slow upward trend since then. From 1960s to 2010s, the ten-year average for FD showed a declining trend, with a maximum of 18.41 in the first decade of 1960–1969 (Table 2). Then there is a slightly upward trend from 2010 to 2019. According to Figure 2i the maximum annual value for FD occurred in 1984. The trends of SU and TR presented the most significant increasing trend, with a variation trend of 2.86 and 2.73 days/decade during 1960–2019 (Figure 2j,l), respectively. The SU and TR showed general decreasing trends before the mid-1970s and increasing trend since 1980 which became more evident after 2000 (Figure 2j,l and Table 2). Regional DTR exhibited in a small variation trend at a rate of −0.037 ℃/decade (Figure 2k); however, it was not significant. From the 1960s to the 1990s, DTR series had a decreasing trend with a higher decadal mean value of 9.81 ℃ in the 1960s, and a slowly upward was found after 2000s (Table 2).

3.1.4. Temporal Variations of Extreme Temperature Indices during 1960–1989 and 1990–2019

The results above suggested there were differences in the variations of these temperature indices from 1960 to 2019. In this section, the trend and differences of extreme temperature indices during 1960–1989 and 1990–2019 are compared in the study region in order to further explore whether there is a change in the variations of extreme temperatures between the two periods. Change trends and differences of extreme temperature indices in YGP during 1960–1989 and 1990–2019 are shown in Table 3. For the entire study area, TXx and TNx showed a similar trend at 0.1 °C/decade during the first period of 1960–1989, and a significant increasing trend at 0.6 °C/decade and 0.3 °C/decade, respectively, during the second period of 1990–2019 (Table 3). TNn, TXn showed an increasing trend during 1960–1989 and maintained an increasing trend after 1990 (Table 3) but showed a slowly increasing trend from 1990 to 2019. The changing trends of TX90p in the two periods were completely opposite. A decreasing trend for TX90p was shown in the sub-period 1960–1989, while a significant increasing trend at a rate of 4.5 days/decade was presented during 1990–2019 in this region. As for TX10p, the trends between the two periods were still opposite, but there was a synchronous trend in each period (Table 3). So, we can infer that there was a cooling period before 1989 and a warming period after 1990. TN90p showed an increasing trend of 0.6 days/decade during 1960–1989, and a significant increasing trend of 4 days/decade during 1990–2019, indicating accelerated warming after 1990. The changing patterns of TN10p were completely similar in these two periods and displayed a significant warming trend of 0.8 and 1.4 days/decade during 1960–1989 and 1990–2019 for the whole YGP. For FD, no significant trends were showed during the two periods and presented consistent warming with a decreasing trend of 1.5 and 0.2 days/decade in the study area (Table 3). The changing patterns of TR were consistent with that of TN90p. TR showed an increasing trend of 0.9 days/decade during 1960–1989, and a significant increasing trend of 5.2 days/decade during 1990–2019. SU showed a significant increasing trend during 1960–2019 (Figure 2j) and maintained an obviously increasing trend 8.1 days/decade after 1990 but presented a slowly decreasing trend during 1960–1990 (Table 3). The changing patterns of DTR were completely opposite between 1960–1989 and 1990–2019, but very similar to those of SU and TX90p. DTR showed a decreasing trend during 1960–1989 but presented an increasing trend at a rate of 0.1 °C/decade with significance at the 0.05 level from 1990 to 2019 (Table 3). Through the above analysis, we can conclude that significant warming occurred especially during 1989–2019 for SU, TR, TX90p, TXx, and TNx in YGP. In general, there were significant differences in the variations of temperature indexes between 1960–1989 and 1990–2019 (Table 3). Compared with 1990–2019, the changing trends of temperature index during 1960–1989 were more ambiguous.

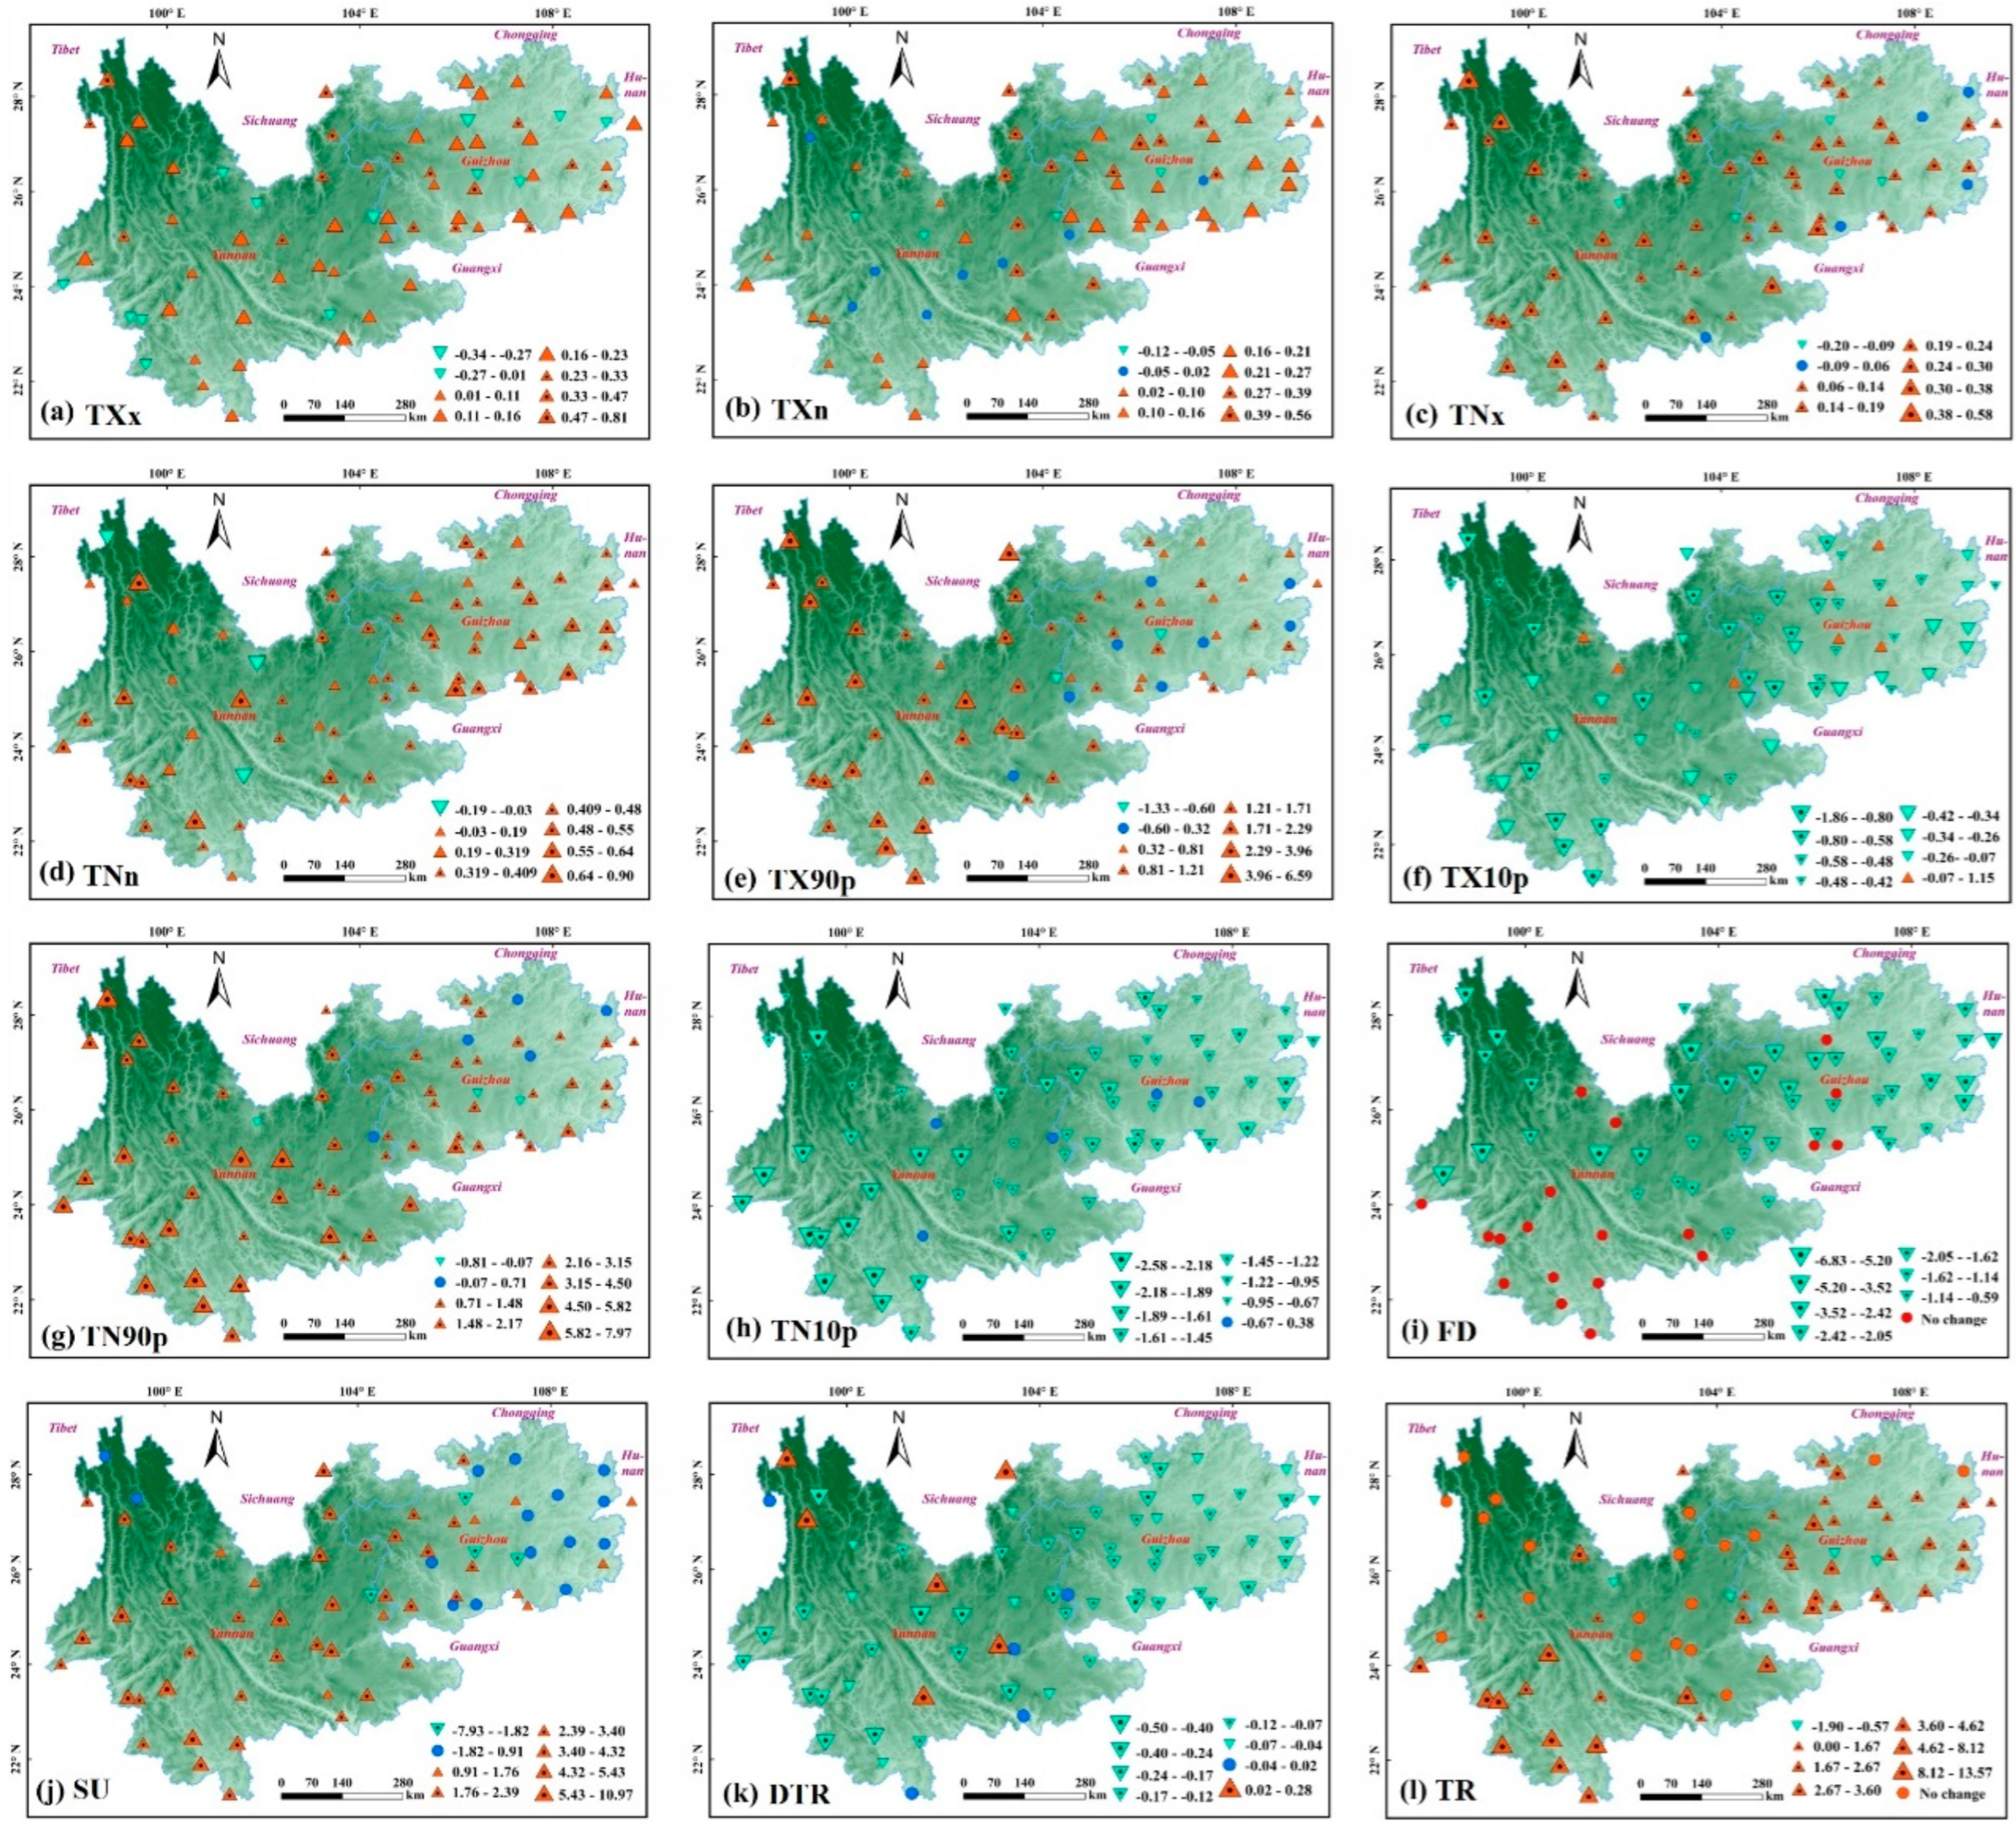
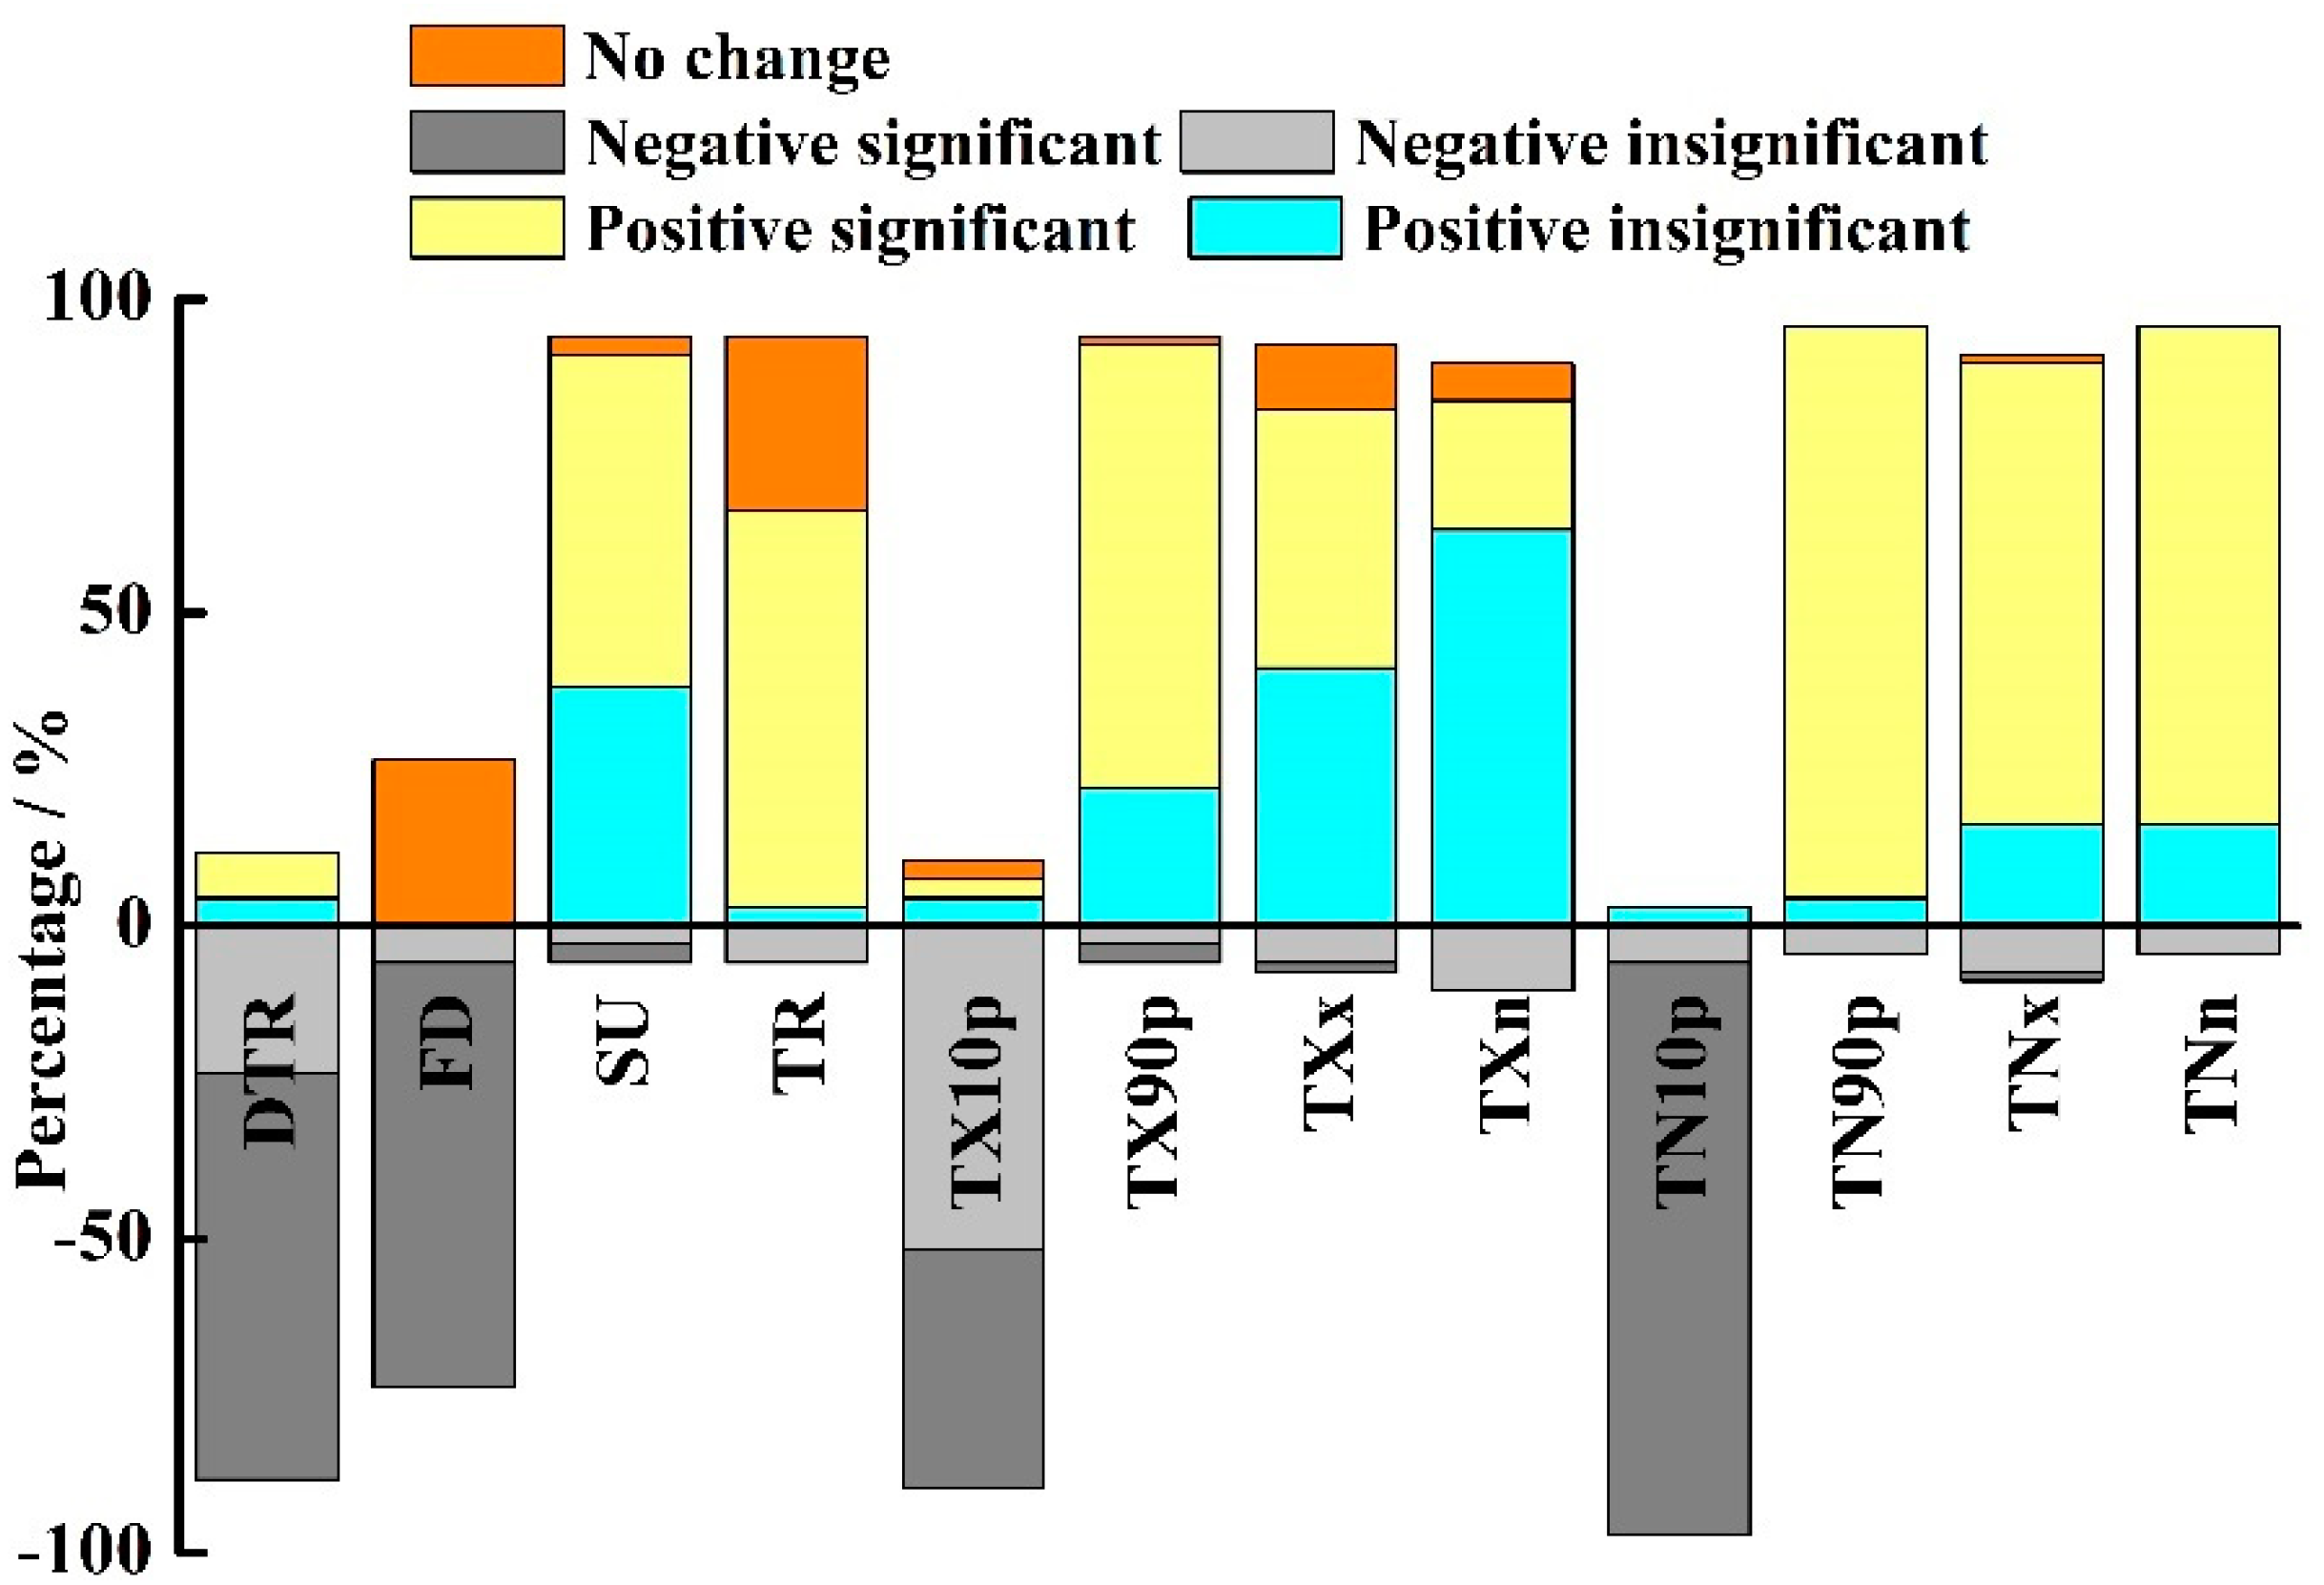
3.2. Spatial Variation in Extreme Temperature

We investigated the spatial distribution of the extreme temperature indices based on each station’s slope value over the YGP during 1960–2019 (Figure 3). Figure 4 shows the percentage of stations with upward and downward trends for 12 indices in the whole YGP. We, therefore, provided more detailed information on how the magnitude of rates changes in the extreme temperature indices in this study.

3.2.1. Absolute Indices (TXx, TXn, TNx, and TNn)

Figure 3a–d shows the spatial distribution of trends for absolute indices in YGP. The absolute indices showed obvious warming trends for the whole YGP during 1960–2019. The increase in TXx and TXn occurred primarily in most parts of YGP and a reduction was sporadically distributed (Figure 3a,b). Regarding TXx and TXn, approximately 41.2% and 20.6% of the stations showed significant increasing trends (Figure 4) and they were distributed mainly in the Hengduan Mountains of the northwest of YGP, Dehong and Lancang in the southwest of Yunnan, and most areas in the central region of YGP. The spatial distributions of the TNx exhibited an increasing trend from northeast to southwest in this area (Figure 3c). The stations with increasing trends for TNx were mainly distributed in the western YGP and fifty stations over the study region were statistically significant at the 0.01 level (Figure 4). The stations with TNn increasing trends were distributed in most parts of YGP (Figure 3d). For TNn, the whole YGP exhibited a significant increasing trend of 0.38 °C/decade, and the percentage of stations showing significant positive trends was about 79.4%. Nevertheless, both the magnitudes and number of stations with significant trends for TXx and TXn were smaller than for TNn and TNx (Figure 4). The warming trends of TXx and TNn are consistent with the overall warming in most regions, among which the TNn warming is particularly high in most of YGP, and the TXx warming is particularly high in the central region.

3.2.2. Percentile Indices (TX90p, TX10p, TN90p, and TN10p)

It can be seen from Figure 3e that approximately 82.7% of the stations experienced an upward trend in TX90p, with the maximum increase rate of 6.59 days/decade occurring in Dali, and 70.6% of the stations are noted to be significant at the 0.01 level (Figure 4). The spatial change trends for TN90p were in line with TX90p, namely, the increasing trends were located in most parts of YGP and only three stations showing decreasing trends for TN90p appeared in Guiyang, Duyun, and Yuanmo (Figure 3g). Spatially, the increasing magnitude of TX90p (TN90p) increased by 1–6 days/decade (2–9 days/decade) in most parts of YGP (Figure 3e,g), and the largest significant increase of 3–5 days/decade for TX90P (TN90P) was observed in the western and southern YPG. The obvious decreases in TN10p and TX10p, accounting for 97.1% and 89.7%, respectively, were distributed in most parts of YGP. The large negative trends of TN10p and TX10p were both found in Simao and Deqin (Figure 3h,f), with maximum decrease rates of 2.6 days and 1.9 days/decade, respectively. In most regions, TN10p decreased significantly at rates of 0.7–2.6 days/decade, accounting for 91.2% of the total number of stations (Figure 4). At 38.2% of the stations, TX10p decreased significantly in YGP, distributed mainly in the central and western regions. TN90p and TX90p showed a significant increasing trend in most areas of YGP, while TN10p and TX10p showed a significant downward trend in most regions of YGP, accounting for more than 38.2% of both the significant upward and downward trends. Consistent with the observed trends in TXx and TNn, the frequency of TN10p has decreased while that of TX90p has increased since the 1960s. TN10p showed a significant decreasing trend in almost all land areas, though trends in TX90p are variable with some decreases in the southeast of YGP.

3.2.3. Other Indices (FD, SU, DTR, and TR)

The number of FD showed a remarkable declining trend for the YGP; with 67.6% of stations presenting statistical significance at the 0.01 level (Figure 3i and Figure 4). Approximately 26.5% of the stations showed no change trends for FD or the FD did not exist in this region. Inversely, SU and TR showed a significant increasing trend in the whole study area, with increasing rates of 2.86 and 2.73 d/decade, respectively (Figure 3j,l). The percentages of stations with significant positive trends were 52.9% and 63.2%, respectively (Figure 4). Geographically, the greatest magnitude for SU was found in Kunming at a rate of 11.0 days/decade. For SU, more than half of the stations, which are mostly located in central and southern YGP, passed the significance test at the 0.01 level. However, 27.9% of the stations for TR had no trends in the central and northern YGP and its surrounding areas on account of the low temperatures and high altitudes. Therefore, the more significant increasing trends were found in Simao and Jiangcheng, which were 13.6 and 12.7 days/decade, respectively. Moreover, it was worth noting that 5.9% of stations in Guizhou province exhibited downward trends, which was not in line with the warming trend of most stations. SU had a larger increase rate than TR in most southern regions with a rate as high as above 5.4 days/decade. The spatial variation trend of DTR presented obvious spatial characteristics: the regions with a significant decrease accounted for 64.7%, which were mainly distributed in the valleys and their extension areas with relatively significant height differences (Figure 3k and Figure 4). The increasing areas account for 11.8%, sporadically distributed in Deqing, Xichang, and Yuanjiang. Briefly, the spatial distribution of the extreme temperature indices in YGP was generally higher in the south and lower in the north, and some indices in the Wumeng Mountains and Hengduan Mountains were relatively low.

3.3. Impacts of Geographical Factors on Extreme Temperature

To further characterize the behavior of the extreme temperature indices in YGP, we used correlation analysis to investigate the relationships between the extreme temperature indices and various geographical factors (longitude, latitude, and height). There are significant negative correlations between latitude and the magnitude of the trends of TXn, TNn, SU, TN90p, and DTR from 1960 to 2019 in YGP (Figure 5). The regional trends of FD are positively and significantly correlated with latitude, but TX90p, TX10p, TN10p, TXx and, TNx had a non-significant relationship with latitude. Figure 5 shows that longitude was marked positively correlated with TXx, TNx, TX10p, and TN10p while negatively correlated with TN90p, TX90p, TXn, and DTR during 1960–2019. It indicated that longitude led to an increasingly colder climate during 1960–2019 over the YGP. However, the correlations between longitude and SU, TR, FD, and TNn were not significant in this study area during 1960–2019. The regional trend of FD and TX90p displayed a statistically positive correlation with altitude from 1960 to 2019 in YGP, whereas the trend of SU, TR, TX10p, TXx, and TNn presented a significantly and negatively correlated with altitude. Changes in latitude indirectly influence temperature, which mainly affects extreme temperature indices through atmospheric circulation. Additionally, elevation determines the vertical distribution of energy and water, which may affect regional temperature variations. Therefore, our results reflect the complexity of regional temperature variation and present an enhanced sensitivity of extreme temperatures to geographical factors in YGP under the background of recent warming.
Additionally, the largest mean values of the extreme temperatures DTR, FD, TX90p, and TN90p are in the 3000–3500 m altitudinal zone, showing an increase with altitude (Table 4). The largest mean values of those indices (TR, SU, TX10p, TN10p, TXx, TNn, TXn, and TNx) are at 0–500 m (Table 4). Thus, this was further evidence that the increase in altitudes might affect the extreme temperatures in YGP.

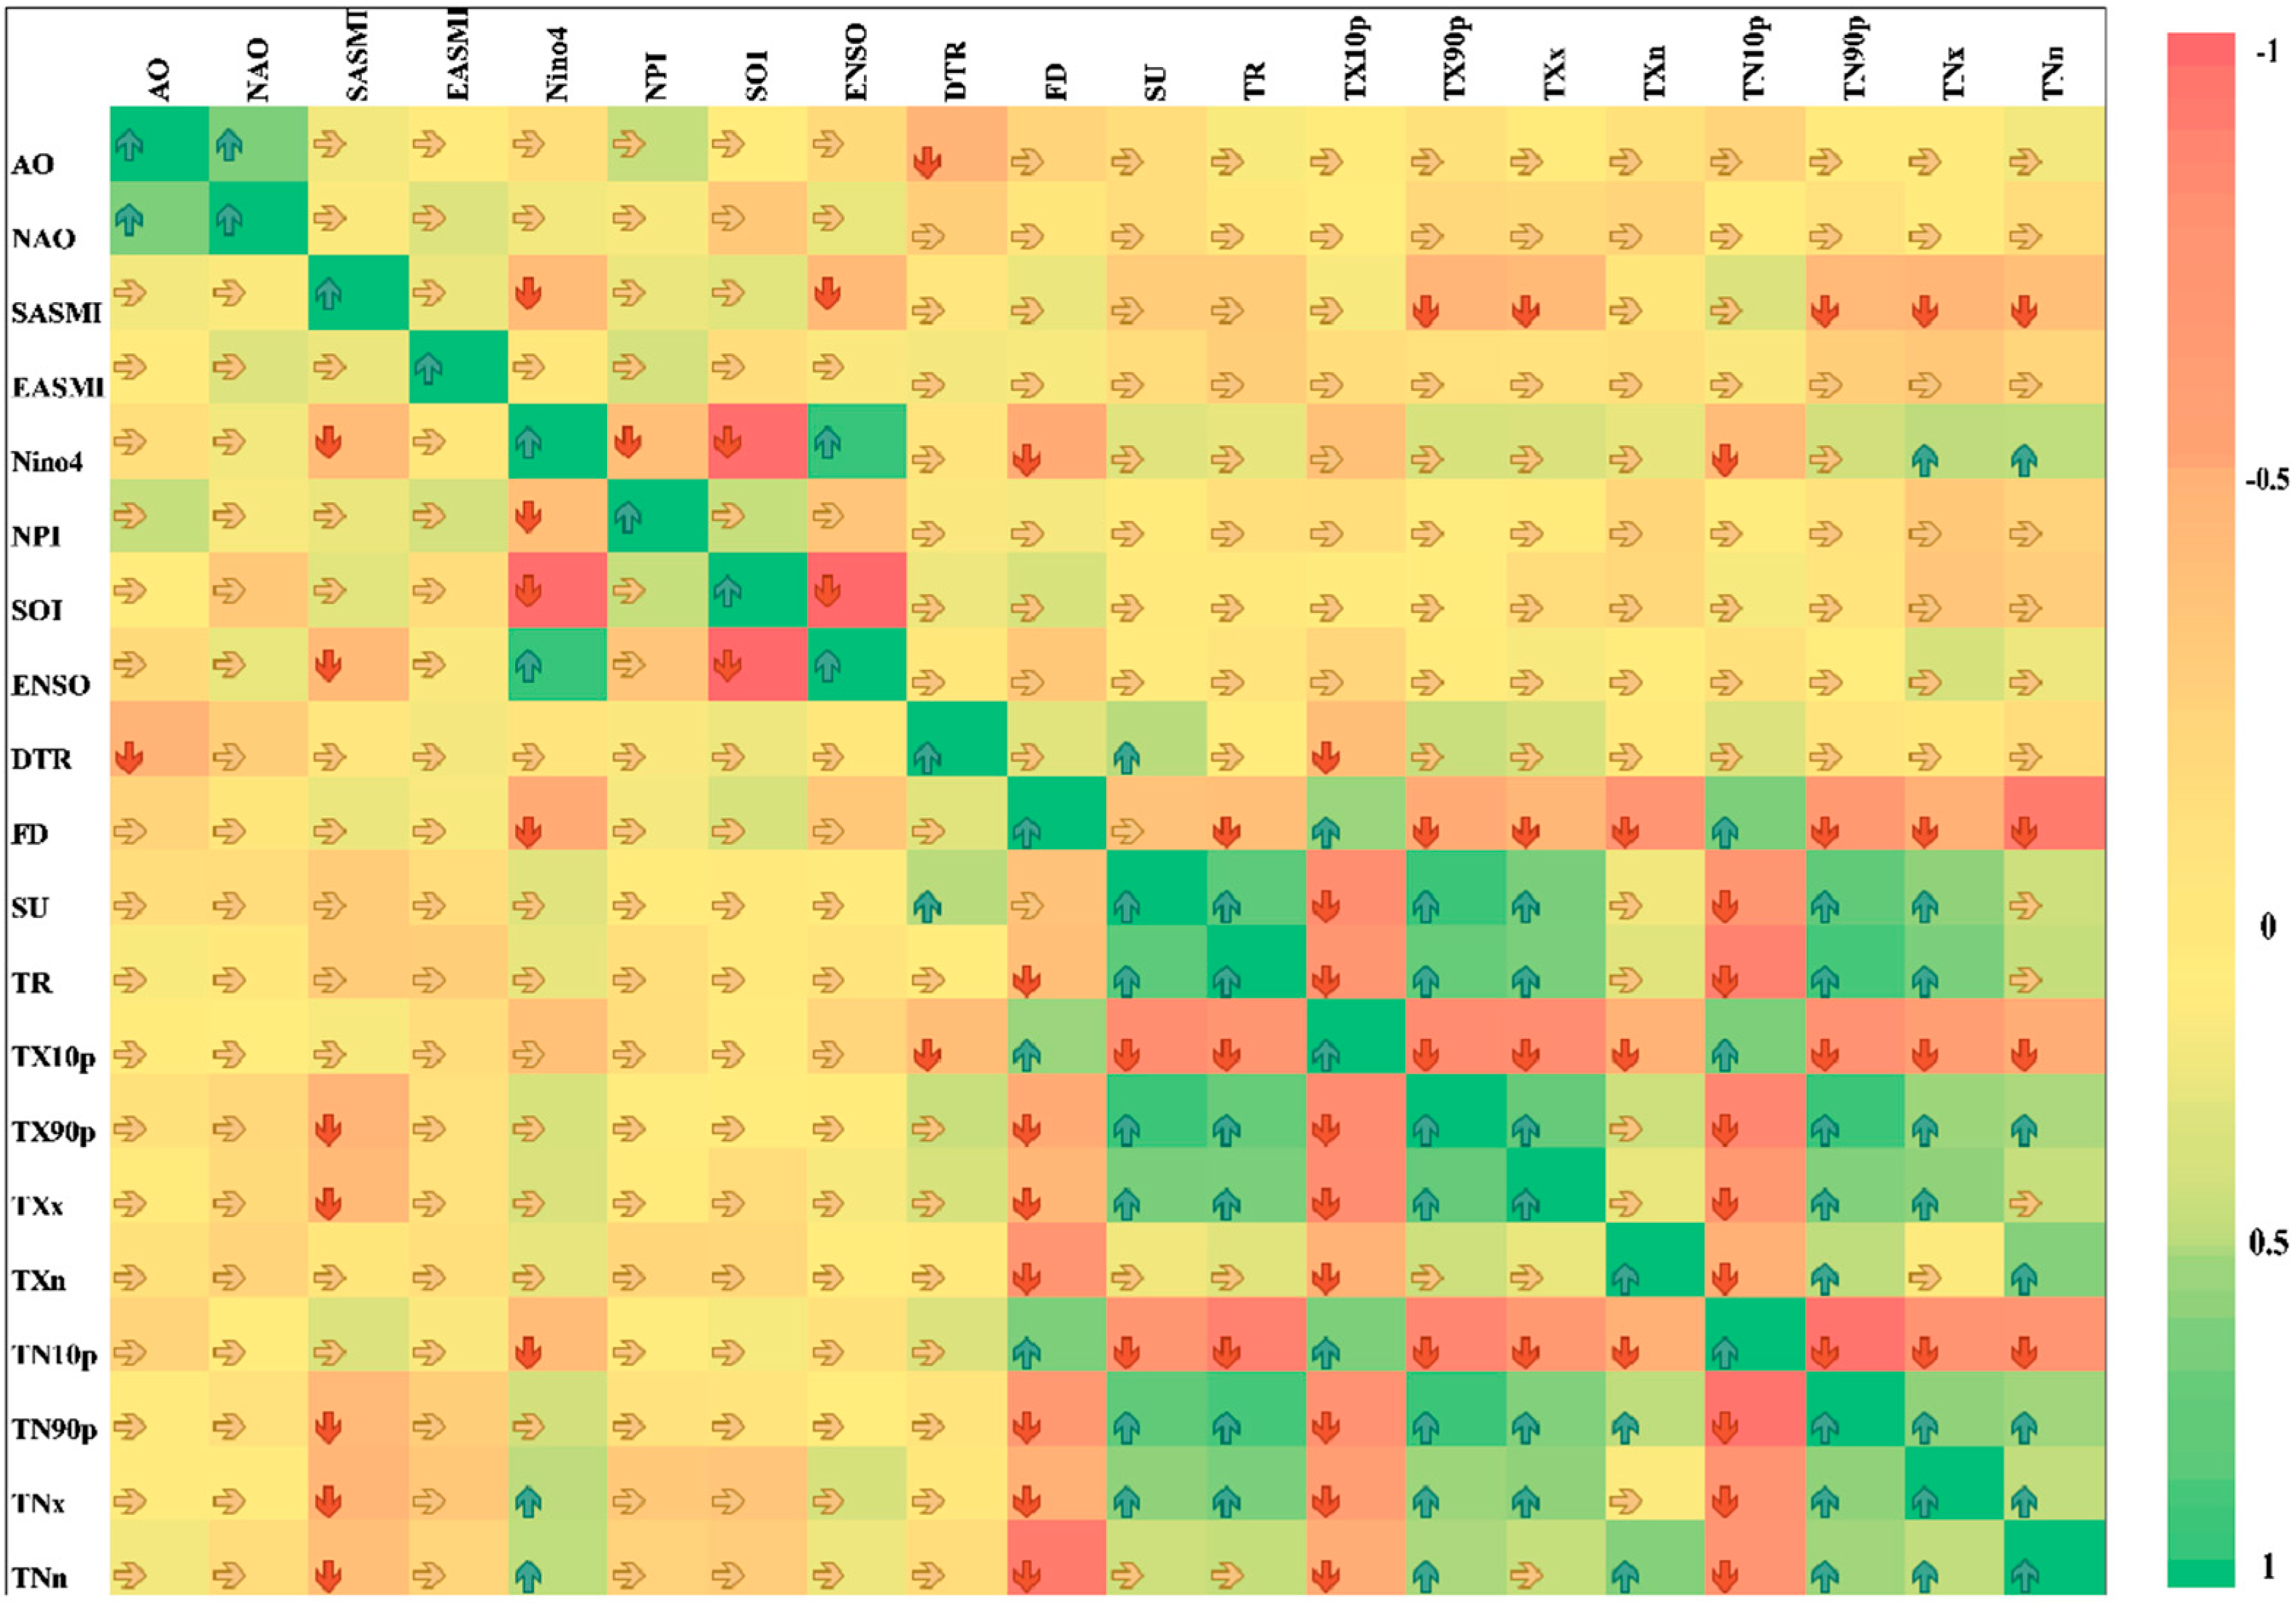
3.4. Association of Extreme Temperatures with ACPs

Relationships between extreme temperature indices and selected atmospheric circulation patterns (ACPs) were examined to determine if atmospheric circulation may be responsible for the trends detected across the YGP. Figure 6 exhibits the relationships between extreme temperature indices and the eight climate indices. The correlation analysis results indicated that the relationship between temperature indices and SASMI is closer than that of EASMI, which implied the contribution of the SASMI is greater than that of the EASMI for the occurrence of extreme temperatures over the YGP, and this is consistent with previous studies (Li et al., 2015). Our analysis also revealed that SASMI had the highest correlation with TX90p, TXx, TN90p, TNx, and TNn, and they were negatively correlated, among which the correlation with SASMI reached 0.36. The Nino4 significantly showed negative correlations with FD and TN10p, while showing significant positive correlations between TNn and TNx. The AO mainly exhibited a significantly negative correlation for DTR in YGP. However, the correlation between the extreme temperatures and the ACPs presents that the ENSO, NPI, SOI, NAO, and EASMI are not significantly associated with the extreme temperatures, and we do not explain them in more detail in this article.
To further clarify the interaction and relationship between different extreme temperature indices, Pearson correlation coefficients of 12 indices were calculated. Overall, except for the poor correlation of the DTR, the indices all had a good correlation, especially TX10p and TN10p. TX10p and TN10p have strong correlations with most other indices, indicating that cold days and clod nights are well correlated with extreme temperatures (Figure 6). The cold indices versus cold indices (TX10, TN10, and FD) and warm indices versus warm indices (TX90, TN90, SU, and TR) showed significant positive correlations. But, cold indices versus warm indices showed negative correlations over the past 60 years. The correlation coefficients of the percentile indices (TX90p, TN90p, TX10p, and TN10), and the vast majority of the other indices (FD, SU, and TR) passed significance tests at the 0.01 or 0.05 level. The results above suggested that the warm indices experienced an upward trend, whereas the cold indices showed a downward trend in the past 60 years.

4. Discussion

The analysis of trends and variability for daily extreme temperatures in YGP during 1960–2019 indicated remarkable changes associated with warming in most regions. The warming trend of the minimum temperature indices was obviously higher than that of the maximum temperature indices, and the warming trend is also higher in the central and western part of YGP than in the eastern part (Figure 2 and Figure 3). For example, the spatial distribution of TXx and TNn is consistent with the overall warming trend in most regions, among which TXx is particularly high in the middle region of YGP, while TNn is particularly high in most regions of YGP. Consistent with the observed trends in TNn and TXx, the frequency of TN10p has decreased while that of TX90p has increased since the 1960s. TN10p demonstrated a significant decreasing trend in almost all land areas, but TX90p presented a different trend, with a certain decrease in the southeast of YGP. Although the observed variations for the extreme temperature indices in YGP are broadly in line with many existing kinds of research at a regional or global scale [29,34,35], there are also some differences. Our results pointed to a very clear warming trend especially since the mid-1980s, which were consistent with the trends over the Tibetan Plateau [36], the Yangtze River Delta [29], and the Southwest China [37].
On the global scale, the evidence for an increase in the coldest and hottest temperature extremes, and an increase in the number of warm days and nights are very strong and consistent across all the variables [5]. Due to its unique geographical and topographic features, such as thin soil thickness, large terrain gradient, and fragile ecological environment [38], the YGP is highly sensitive to extreme weather events in particular. Due to the topography and low elevation, 18 stations in YGP have no frost days (FD) and 19 stations have no tropical nights (TR) (Figure 4i,l). FD generally declined throughout the study period, again manifesting warming (Figure 4i), and most of the stations had significant downward trends. This study also manifested a warming trend of DTR over the YGP (Figure 4k), 44 out of 66 stations experienced a statistically significant decline from 1960 to 2019. According to Li et al. and Liu et al. (2014), DTR presented an obvious downward trend because of the faster increase of the minimum temperature than that of the maximum temperature [37,39]. Kukal & Irmak indicated that the significant decrease trend of DTR may be related to the decrease of incident shortwave radiation and the increase of air humidity [40]. Additionally, it is worth noting that the decline trends of DTR all occurred during 1960–1989 (Table 3). This result is in line with the conclusion that the extensive decrease in DTR is only obvious from the 1950s to the 1980s at a global scale [41]. However, from 1990–2019, DTR showed a significant increasing trend of 0.01 °C/decade in the entire study area. This is mainly because the increasing magnitudes of TXx are stronger than those of TNn in this region during 1990–2019. Moreover, changes in the urban heat island effect, soil moisture, precipitation, and atmospheric circulation likely account for the DTR variation [25,41]. A discontinuous warming phenomenon can also be found in cold-related extreme climate indices when the study period is divided into two sub-periods. SU, TR, TNx, TX90, and TN90 showed an obvious upward trend from 1960 to 2019 and maintained an increasing trend after 1990 (Table 3). Natural climate variability and anthropogenic drivers (such as urbanization and greenhouse gas emissions) have been identified as the main influences affecting extreme temperatures since the mid-20th century [42]. A significant proportion of the decadal variations in extreme temperature remain after eliminating the effect of these patterns of variability, much of which can be attributed to the influence of human activities [43]. Extreme heat events raise temperatures in buildings and cities already warmed by the urban heat-island effect [44] and can cause disruptions to critical infrastructure networks.
Furthermore, YGP is characterized by complex terrain and obvious regional differences [17]. Latitude influences the solar incidence angle, and thus affects the distribution of energy on the Earth’s surface [19]. Generally, higher latitudes have a lower solar incidence angle and therefore receive less heat, resulting in lower temperatures. In this study, all-temperature indices were related to elevation; FD showed significant positive correlations (p < 0.01), while DTR, SU, TNn, and TN90p were significant negative correlations (p < 0.01) (Figure 4). This shows that the warming trend became more obvious with decreasing elevation, which was not consistent with previous study in southwestern China [42] Longitude affects the transport of water and energy between the coast and China’s inland areas, which in turn, influences regional climate change [37,45]. In this study, the extreme temperatures generally had stronger correlations with longitude than with latitude (Figure 4), and there were more significant correlations. This indicates that the water-energy transport between longitude has a great correlation with the changes of extreme temperatures in YGP. This might be due to human activity or the geographical location (e.g., Hengduan Mountains or Wumeng Mountains), but the physical mechanisms of the relationships between longitude and extreme temperatures should be further investigated. Altitude determines the vertical distribution of energy and water, which in turn affects regional climate change [19]. In this study, a significant positive correlation (p < 0.01) was found between two indices (FD and TX90p) and altitude, whereas six indices (TXx, TNx, TNn, TX10p, SU, and TR) were significantly negative correlations with elevation. Under the influence of topography, regional variations of extreme temperatures not only had lateral differences but also changes obviously with altitude. Abnormal formation and appearance of atmospheric circulation patterns often leads to abnormal phenomena of the weather [46]. In this paper, the temperature extremes generally had weaker relationships with the ENSO, NPI, SOI, NAO, and EASMI than with the SASMI, Nino4 and AO, and there were more nonsignificant correlations (Figure 6). However, the results of this study are not consistent with existing research results [17,19].
While a substantial proportion of the observed variation in temperature extreme occurrence is caused by thermos-dynamic changes at regional and global scales, the variation of extreme temperatures over some regions has also been altered by recent changes in the frequency, duration and magnitude of regional circulation patterns [47]. The present results suggest that the whole YGP is influenced by more than one climate index and that the influences of a certain climate index are always regulated by other climate indices.

5. Conclusions

With the aid of 12 temperature-related indices recommended by ETCCDI, we analyzed the extreme temperature variations for 68 weather stations over the Yunnan-Guizhou Plateau (YGP) during 1960–2019. We think it is an important step toward a good understanding of extreme climate changes over the YGP in China under the influences of global warming. The results showed that there had been a remarkable warming trend for these indices in the whole YGP from 1960 to 2019, and the warming rates had also increased significantly since 1990. The warming in minimum temperature indices such as the coldest night, cold nights, tropical nights, and frost days was of greater magnitudes than those of the maximum temperature indices, i.e., the hottest day, warmest day, and cold days, consistent with many previous studies.
There were significant differences in the variations of temperature indexes between 1960–1989 and 1990–2019. Compared with 1990–2019, the changing trends of temperature index during 1960–1989 were more ambiguous. The spatial distribution of the extreme temperature indices in YGP was generally higher in the south and lower in the north, and some indices in the Wumeng Mountains and Hengduan Mountains were relatively low. The most significant warming occurred in most parts of YGP, manifesting that the mountainous regions are relatively sensitive and vulnerable to climate change. There are many factors contributing to the surface warming in YGP, including the geographical factors (latitude, longitude, and altitude), atmospheric circulation patterns (ACPs), anthropogenic greenhouse gases, cloud cover, as well as land-use changes. This study only analyzed the influences of geographical parameters on extreme temperature indices and evaluated their relationships with ACPs. In the present study, all the temperature indices were correlated with latitude, longitude, and altitude; some indices showed significant positive correlations, whereas the others showed significant negative correlations. The results of this paper further reflect the complexity of regional temperature variation and present an enhanced sensitivity of extreme temperatures to geographical factors in YGP under the background of recent warming. The temperature extremes generally had weaker correlations with the El Nino-Southern Oscillation, North Pacific Index, Southern Oscillation Index, North Atlantic Oscillation, and East Asian Summer Monsoon Index than with the South Asian summer monsoon index, Nino4 indices, and Arctic Oscillation, and there were more nonsignificant correlations. Regional trends of the extreme temperature indices reflect nonuniform changes in temperature over the YGP which is attributed to the complicated interaction between ACPs and local topography. However, the influences of ACPs, geographical factors and their forcing mechanisms are very complicated and need to be studied in subsequent work.

Author Contributions

Material preparation and analysis were performed by K.Z. and Y.J. Data collection was processed by J.L. and H.W. K.Z., Y.J. and J.P. contributed to the study conception and design. The first draft of the manuscript was written by K.Z., H.Z. and J.P. All authors have read and agreed to the published version of the manuscript.

Funding

This work was jointly supported by (1) the National Natural Science Foundation of China (42163001), (2) the Science & Technology Planning Projects of Guizhou Province (Qi-an-Kehe-Jichu-zk [2021]-Yiban189), (3) the Science & Technology of Young Talents Development Project of Higher Institutions in Guizhou Province (Qian-Jiaohe-KY [2021]139), and (4) Undergraduate scientific research project of Guizhou University of Finance and Economics (2021BZXS179).

Institutional Review Board Statement

Not applicable.

Informed Consent Statement

Not applicable.

Data Availability Statement

The original datasets of daily maximum and minimum temperatures from 1960 to 2019 were provided by the National Meteorological Information Center of China (http://www.nmic.cn/, accessed on 10 November 2020).

Conflicts of Interest

The authors declare no conflict of interest.

References

  1. Deng, Y.; Jiang, W.; He, B.; Chen, Z.; Jia, K. Change in intensity and frequency of extreme precipitation and its possible teleconnection with large-scale climate index over the China from 1960 to 2015. J. Geophys. Res. Atmos. 2018, 123, 2068–2081. [Google Scholar] [CrossRef]
  2. Seddon, A.W.R.; Macias-Fauria, M.; Long, P.R.; Benz, D.; Willis, K.J. Sensitivity of global terrestrial ecosystems to climate variability. Nature 2016, 531, 229–232. [Google Scholar] [CrossRef] [PubMed] [Green Version]
  3. Piao, S.L.; Ciais, P.; Huang, Y.; Shen, Z.H.; Peng, S.S.; Li, J.S.; Zhou, L.P.; Liu, H.Y.; Ma, Y.C.; Ding, Y.H.; et al. The impacts of climate change on water resources and agriculture in China. Nature 2010, 467, 43–51. [Google Scholar] [CrossRef] [PubMed]
  4. Han, J.; Miao, C.; Duan, Q.; Wu, J.; Lei, X.; Liao, W. Variations in start date, end date, frequency and intensity of yearly temperature extremes across China during the period 1961–2017. Environ. Res. Lett. 2020, 15, 045007. [Google Scholar] [CrossRef]
  5. IPCC. Climate Change 2021: The Physical Science Basis. In Contribution of Working Group I to the Sixth Assessment Report of the Intergovernmental Panel on Climate Change; Cambridge Press: Cambridge, UK, 2021. [Google Scholar]
  6. Sun, Y.; Zhang, X.; Zwiers, F.W.; Song, L.; Wan, H.; Hu, T.; Yin, H.; Ren, G. Rapid increase in the risk of extreme summer heat in Eastern China. Nat. Clim. Change 2014, 4, 1082–1085. [Google Scholar] [CrossRef]
  7. Sharma, P.J.; Loliyana, V.D.; R., R.S.; Timbadiya, P.V.; Patel, P.L. Spatiotemporal trends in extreme rainfall and temperature indices over Upper Tapi Basin, India. Theor. Appl. Climatol. 2018, 134, 1329–1354. [Google Scholar] [CrossRef]
  8. Sun, Q.; Miao, C.; AghaKouchak, A.; Mallakpour, I.; Ji, D.; Duan, Q. Possible Increased Frequency of ENSO-Related Dry and Wet Conditions over Some Major Watersheds in a Warming Climate. Bull. Am. Meteorol. Soc. 2020, 101, E409–E426. [Google Scholar] [CrossRef]
  9. Zhao, N.; Chen, M. A Comprehensive Study of Spatiotemporal Variations in Temperature Extremes across China during 1960–2018. Sustainability 2021, 13, 3807. [Google Scholar] [CrossRef]
  10. Wang, B.; Liu, D.L.; Macadam, I.; Alexander, L.V.; Abramowitz, G.; Yu, Q. Multi-model ensemble projections of future extreme temperature change using a statistical downscaling method in south eastern Australia. Clim. Chang. 2016, 138, 85–98. [Google Scholar] [CrossRef]
  11. Shi, J.; Cui, L.; Ma, Y.; Du, H.; Wen, K. Trends in temperature extremes and their association with circulation patterns in China during 1961–2015. Atmospheric Res. 2018, 212, 259–272. [Google Scholar] [CrossRef]
  12. Lhotka, O.; Kyselý, J. Hot Central-European summer of 2013 in a long-term context. Int. J. Clim. 2015, 35, 4399–4407. [Google Scholar] [CrossRef]
  13. Adams, R.E.; Lee, C.C.; Smith, E.T.; Sheridan, S.C. The relationship between atmospheric circulation patterns and extreme temper-ature events in North America. Int. J. Climatol. 2021, 41, 92–103. [Google Scholar] [CrossRef]
  14. Jiang, S.; Chen, X.; Smettem, K.; Wang, T. Climate and land use influences on changing spatiotemporal patterns of mountain vegetation cover in southwest China. Ecol. Indic. 2020, 121, 107193. [Google Scholar] [CrossRef]
  15. Gu, F.; Gou, X.H.; Deng, Y.; Su, J.J.; Lin, W.; Yu, A.L. Analysis of temperature variations over the Yunnan-Guizhou Plateau from 1960 to 2014. J. Lanzhou Univ. (Nat. Sci.) 2018, 54, 721–730. (In Chinese) [Google Scholar] [CrossRef]
  16. Lu, H.; Ding, L.; Ma, Z.; Li, H.; Lu, T.; Su, M.; Xu, J. Spatiotemporal assessments on the satellite-based precipitation products from fengyun and GPM over the Yunnan-Kweichow Plateau, China. Earth Space Sci. 2020, 7, e2019EA000857. [Google Scholar] [CrossRef]
  17. Yan, W.; He, Y.; Cai, Y.; Cui, X.; Qu, X. Analysis of Spatiotemporal Variability in Extreme Climate and Potential Driving Factors on the Yunnan Plateau (Southwest China) during 1960–2019. Atmosphere 2021, 12, 1136. [Google Scholar] [CrossRef]
  18. Li, Y.-G.; He, D.; Hu, J.-M.; Cao, J. Variability of extreme precipitation over Yunnan Province, China 1960–2012. Int. J. Clim. 2014, 35, 245–258. [Google Scholar] [CrossRef]
  19. Wang, X.; Li, Y.; Wang, M.; Li, Y.; Gong, X.; Chen, Y.; Chen, Y.; Cao, W. Changes in daily extreme temperature and precipitation events in mainland China from 1960 to 2016 under global warming. Int. J. Clim. 2020, 41, 1465–1483. [Google Scholar] [CrossRef]
  20. Wang, S.; Lu, S. A rock magnetic study on red palaeosols in Yun-Gui Plateau (Southwestern China) and evidence for uplift of Plateau. Geophys. J. Int. 2013, 196, 736–747. [Google Scholar] [CrossRef] [Green Version]
  21. Lu, H.; Huang, Z.; Ding, L.; Lu, T.; Yuan, Y. Calibrating FY4A QPE using CMPA over Yunnan–Kweichow Plateau in summer 2019. Eur. J. Remote Sens. 2021, 54, 476–486. [Google Scholar] [CrossRef]
  22. dos Santos, C.A.C.; Neale, C.M.U.; Mekonnen, M.M.; Gonçalves, I.Z.; de Oliveira, G.; Ruiz-Alvarez, O.; Safa, B.; Rowe, C.M. Trends of extreme air temperature and precipitation and their impact on corn and soybean yields in Nebraska, USA. Arch. Theor. Appl. Climatol. 2022, 147, 1379–1399. [Google Scholar] [CrossRef]
  23. Ding, Z.; Pu, J.; Meng, L.; Lu, R.; Wang, Y.; Li, Y.; Dong, Y.; Wang, S. Asymmetric trends of extreme temperature over the Loess Plateau during 1998–2018. Int. J. Clim. 2020, 41, E1663–E1685. [Google Scholar] [CrossRef]
  24. Wang, P.; Tang, J.; Sun, X.; Wang, S.; Wu, J.; Dong, X.; Fang, J. Heat Waves in China: Definitions, Leading Patterns, and Connections to Large-Scale Atmospheric Circulation and SSTs. J. Geophys. Res. Atmos. 2017, 122, 10679–10699. [Google Scholar] [CrossRef]
  25. Zhang, K.X.; Dai, S.P.; Dong, X.G. Dynamic Variability in Daily Temperature Extremes and Their Relationships with Large-scale Atmospheric Circulation During 1960–2015 in Xinjiang, China. Chin. Geogr. Sci. 2020, 30, 233–248. [Google Scholar] [CrossRef] [Green Version]
  26. Alexander, L.V.; Zhang, X.B.; Peterson, T.C.; Caesar, J.; Gleason, B.; Klein Tank, A.M.; Haylock, M.; Collins, D.; Trewin, B.; Rahimzadeh, F.; et al. Global observed changes in daily climate extremes of temperature and precipitation. J. Geophys. Res. Atmos. 2006, 111, 1042–1063. [Google Scholar] [CrossRef] [Green Version]
  27. Finkel, J.M.; Katz, J.I. Changing world extreme temperature statistics. Int. J. Clim. 2017, 38, 2613–2617. [Google Scholar] [CrossRef] [Green Version]
  28. Thirumalai, K.; DiNezio, P.N.; Okumura, Y.; Deser, C. Extreme temperatures in Southeast Asia caused by El Niño and worsened by global warming. Nat. Commun. 2017, 8, 15531. [Google Scholar] [CrossRef] [PubMed]
  29. Guan, Y.; Zhang, X.; Zheng, F.; Wang, B. Trends and variability of daily temperature extremes during 1960–2012 in the Yangtze River Basin, China. Glob. Planet. Chang. 2015, 124, 79–94. [Google Scholar] [CrossRef] [Green Version]
  30. Mann, H.B. Nonparametric tests against trend. Econometrica 1945, 13, 245–259. [Google Scholar] [CrossRef]
  31. Kendall, M.G. Rank Correlation Methods; Charles Griffin and Company: London, UK, 1975. [Google Scholar]
  32. Yatim, A.N.M.; Latif, M.T.; Ahamad, F.; Khan, F.; Nadzir, M.S.M.; Juneng, L. Observed trends in extreme temperature over the Klang Valley, Malaysia. Adv. Atmospheric Sci. 2019, 36, 1355–1370. [Google Scholar] [CrossRef]
  33. Hadri, A.; Saidi, M.; Saouabe, T.; El Alaoui El Fels, A. Temporal trends in extreme temperature and precipitation events in an arid area: Case of Chichaoua Mejjate region (Morocco). J. Water Clim. Change 2021, 14, 895–915. [Google Scholar] [CrossRef]
  34. Dunn, R.J.H.; Alexander, L.V.; Donat, M.G.; Zhang, X.; Bador, M.; Herold, N.; Lippmann, T.; Allan, R.; Aguilar, E.; Barry, A.A.; et al. Development of an Updated Global Land in Situ-Based Data Set of Temperature and Precipitation Extremes: HadEX3. J. Geophys. Res. Atmos. 2020, 125, e2019JD032263. [Google Scholar] [CrossRef]
  35. Sun, W.; Mu, X.; Song, X.; Wu, D.; Cheng, A.; Qiu, B. Changes in extreme temperature and precipitation events in the Loess Plateau (China) during 1960–2013 under global warming. Atmos. Res. 2016, 168, 33–48. [Google Scholar] [CrossRef]
  36. Ding, Z.; Wang, Y.; Lu, R. An analysis of changes in temperature extremes in the Three River Headwaters region of the Tibetan Plateau during 1961–2016. Atmos. Res. 2018, 209, 103–114. [Google Scholar] [CrossRef]
  37. Zongxing, L.; He, Y.; Wang, P.; Theakstone, W.H.; An, W.; Wang, X.; Lu, A.; Zhang, W.; Cao, W. Changes of daily climate extremes in southwestern China during 1961–2008. Glob. Planet. Change 2012, 80–81, 255–272. [Google Scholar] [CrossRef]
  38. Zhang, Q.; Xu, C.-Y.; Zhang, Z.; Chen, X.; Han, Z. Precipitation extremes in a karst region: A case study in the Guizhou province, southwest China. Theor. Appl. Climatol. 2009, 101, 53–65. [Google Scholar] [CrossRef]
  39. Liu, X.D.; Cheng, Z.G.; Yan, L.B.; Yin, Z.Y. Elevation dependency of recent and future minimum surface air temperature trends in the Tibetan Plateau and its surroundings. Glob. Planet. Change 2009, 68, 164–174. [Google Scholar] [CrossRef]
  40. Kukal, M.; Irmak, S. Long-term patterns of air temperatures, daily temperature range, precipitation, grass reference evapotranspiration and aridity index in the USA great plains: Part II. Temporal trends. J. Hydrol. 2016, 542, 978–1001. [Google Scholar] [CrossRef] [Green Version]
  41. Vose, R.S.; Easterling, D.R.; Gleason, B. Maximum and minimum temperature trends for the globe: An update through 2004. Geophys. Res. Lett. 2005, 32, L23822. [Google Scholar] [CrossRef] [Green Version]
  42. Hegerl, G.C.; Zwiers, F.W.; Stott, P.A.; Kharin, V.V. Detectability of anthropogenic changes in annual temperature and precipitation extremes. J. Clim. 2004, 17, 3683–3700. [Google Scholar] [CrossRef] [Green Version]
  43. Kamae, Y.; Li, X.; Xie, S.-P.; Ueda, H. Atlantic effects on recent decadal trends in global monsoon. Clim. Dyn. 2017, 49, 3443–3455. [Google Scholar] [CrossRef] [Green Version]
  44. Zhao, L.; Oppenheimer, M.; Zhu, Q.; Baldwin, J.W.; Ebi, K.L.; Bou-Zeid, E.; Guan, K.; Liu, X. Interactions between urban heat islands and heat waves. Environ. Res. Lett. 2018, 13, 034003. [Google Scholar] [CrossRef]
  45. Zhong, K.; Zheng, F.; Wu, H.; Qin, C.; Xu, X. Dynamic changes in temperature extremes and their association with atmospheric circulation patterns in the Songhua River Basin, China. Atmos. Res. 2017, 190, 77–88. [Google Scholar] [CrossRef]
  46. Marshall, G.J.; Jylhä, K.; Kivinen, S.; Laapas, M.; Dyrrdal, A.V. The role of atmospheric circulation patterns in driving recent changes in indices of extreme seasonal precipitation across Arctic Fennoscandia. Clim. Change 2020, 162, 741–759. [Google Scholar] [CrossRef]
  47. Horton, D.E.; Johnson, N.C.; Singh, D.; Swain, D.L.; Rajaratnam, B.; Diffenbaugh, N.S. Contribution of changes in atmospheric circulation patterns to extreme temperature trends. Nature 2015, 522, 465–469. [Google Scholar] [CrossRef] [PubMed] [Green Version]
Figure 1. The regional map and platform distribution of the YGP.
Sustainability 14 08291 g001
Figure 2. The annual variation trends of extreme temperature indices in YGP from 1960 to 2019. (Abbreviations can be found in Table 1 and the following figures are the same).
Sustainability 14 08291 g002
Figure 3. Spatial distribution of change ranges for extreme temperature indices in YGP during 1960–2019. (The dotted triangle and inverted dotted triangle identify the region in which the variation trend of this district was significant at the 0.01 level. Blue dots indicate that the trend was not obvious).
Sustainability 14 08291 g003
Figure 4. Percentage of stations with the stationary, positive and negative trends out of the total stations examined in YGP from 1960 to 2019.
Sustainability 14 08291 g004
Figure 5. The correlation coefficient between extreme temperature indices and geographical factors in YGP (Right-pointing arrows indicate that the extreme indices have non-significant relationships with geographical factors. Up-pointing arrows indicate the extreme indices are significant positive correlation with geographical factors, while down-pointing arrows are significant negative correlation with geographical factors).
Sustainability 14 08291 g005
Figure 6. Pearson’s correlation coefficients between atmospheric circulation patterns and extreme temperature indices (Right-pointing arrows indicate that the extreme indices have non-significant relationships with ACPs. Up-pointing arrows indicate the extreme indices are significant positive correlation with ACPs, while down-pointing arrows are significant negative correlation with ACPs).
Sustainability 14 08291 g006
Table 1. Definitions of 12 temperature indices were used in this study.
CategoryIndexDescription NameDefinitionsUnit
Absolute indicesTXxThe hottest dayThe maximum value of TX records°C
TXnWarmest dayThe minimum value of TX records°C
TNnThe coldest nightThe minimum value of TN records °C
TNxWarmest nightThe maximum value of TN records °C
Percentile indicesTN10pCold nightsDays when TN < 10th percentile days
TX10pCold daysDays when TX < 10th percentile days
TN90pWarm nightsDays when TN > 90th percentile days
TX90pWarm daysDays when TX >90th percentile days
Other indicesFDFrost daysAnnual count of days where TN < 0 °Cdays
SUSummer daysAnnual count of days where TX > 25 °Cdays
TRTropical nightsAnnual count of days where TN > 20 °Cdays
DTRDiurnal temperature rangeAnnual mean difference between TX and TN°C
Note: All indices are calculated from January to December. TN denotes daily minimum temperature. TX denotes daily maximum temperature.
Table 2. Average values of extreme temperature indices across different decades in YGP during 1960–2019.
Indices1960–19691970–19791980–19891990–19992000–20092010–2019
DTR (°C)9.819.669.439.349.569.59
FD (days)18.4116.3215.2810.9310.6210.67
SU (days)148.37143.95145.28147.19155.61160.66
TR (days)55.0451.7455.8256.6860.4966.61
TX10p (days)10.2710.6610.7410.589.228.33
TX90p (days)11.229.6110.4011.8117.0021.38
TXx (°C)34.3734.0534.4534.4034.6535.72
TXn (°C)3.282.843.623.884.223.84
TN10p (days)10.8811.179.117.676.184.81
TN90p (days)10.189.2611.4613.0115.8720.06
TNx (°C)23.4423.3623.7123.5223.6924.17
TNn (°C)−3.28−3.47−2.36−1.99−1.64−1.81
Table 3. Change trends and differences of extreme temperature indices in YGP during the periods of 1960–1989 and 1990–2019.
Indices1960–19891990–2018Values of 1960–1989Values of 1990–2019DifferenceIndices1960–
1989
1990–2018Values of 1960–1989Values of 1990–2019Difference
DTR−0.02 **0.01 *9.639.50−0.13TXx0.010.06 **34.2934.920.63
FD−0.15−0.0216.6710.74−5.93TXn0.010.003.253.980.73
SU−0.190.81 **145.86154.498.62TN10p−0.08 *−0.14 **10.396.22−4.17
TR0.090.52 **54.5561.266.71TN90p0.060.40 **10.3016.316.01
TX10p0.03−0.11 **10.569.37−1.18TNx0.010.03 **23.5023.800.29
TX90p−0.020.45 **10.4116.736.32TNn0.04 *0.02−3.04−1.811.22
Note: * values are significant at the 0.05 level; ** values are significant at the 0.01 level.
Table 4. Mean values of extreme temperatures in categorized elevation rank in YGP during 1960–2019.
AltitudeStationsDTRFDSUTRTX90pTX10pTN90pTN10pTXxTXnTNxTNn
0–50098.67.9182.4119.711.710.112.68.737.83.626.6−1.4
500–1000148.610.7175.096.612.810.113.48.535.64.125.0−1.4
1000–1500217.514.1172.222.011.39.712.58.631.6−0.122.1−3.4
1500–20001810.023.0103.91.112.310.115.08.530.71.719.6−4.0
2000–2500410.954.644.00.012.89.714.88.229.21.717.6−6.4
3000–3500211.6166.50.40.017.18.318.67.123.9−0.712.1−14.4
Publisher’s Note: MDPI stays neutral with regard to jurisdictional claims in published maps and institutional affiliations.

