1. Introduction
Manufacturing companies need to optimise their operations to ensure economic success, particularly when globalised markets have maximised the competitiveness of businesses. To achieve manufacturing excellence and maintain economic growth, it is vital to continuously become more efficient. For this, reducing waste from manufacturing processes and, therefore, implementing lean-manufacturing principles is key [
1].
One example of a process that generally generates little value but can create significant waste is a changeover. A changeover is the process of ending the production of a product on an assembly line and starting the production of a new product. An efficient changeover is critical in production control for most manufacturers, particularly when customer demand is high and varied, products manufactured are diversified, and production tends to be in small lots [
2]. Short changeover time may help in reducing the lot size in the production system. It benefits in several ways, including expense reduction, faster production, increased output, lead-time reduction, smooth process flows, a broader range of lot sizes, lower inventory and lower waste [
3]. The changeover is often an inefficient process that generates waste (Muda) and unevenness, irregularity and lack of uniformity (Mura), as defined by the Toyota Production System [
4]. Non-optimised changeover processes generate significant waste in productive manufacturing time, which may increase the seven types of waste (Muda): transport, inventory, motion, waiting, overproduction, over-processing and defects [
5,
6].
Single Minute Exchange of Dies (SMED) is a lean production methodology to reduce waste in changeover. SMED focuses on identifying the internal and external changeover activities, separating the internal and external activities, converting internal activities into external activities and streamlining the activities. Activities are classified as internal when production has stopped for changeover and as external when production is still running. SMED is widely accepted and adopted in the manufacturing industry [
7,
8,
9].
This article presents a case study to reduce waste in changeover processes at a ready-meal manufacturer. We first review the most relevant literature on lean manufacturing and the SMED methodology. We then present the problem identified in the food-manufacturing company, and describe the methodology used to tackle the problem, explain the results obtained, discuss potential further work and, finally, discuss the main conclusions of this work.
2. Literature Review
To determine if a manufacturing process needs improvement, three criteria must be considered: effectiveness (“does the process produce the desired results?”), efficiency (“does the process minimise the use of resources?”) and adaptability (“is the process flexible in responding to the changing demands?”) [
10]. Any process that lacks one or more of these three criteria needs improvement.
Process improvement is a systematic approach that enables improvements through incremental steps. Process improvement demands a detailed look at the process and discovers ways to improve it. One of the prominent models used for improvement is DMAIC, which stands for the stages of the process: define, measure, analyse, improve and control [
2]. The basic steps for process improvement are [
10,
11]:
Identify the problem;
Draw a process map;
Verify the process and set the boundaries;
Identify the stakeholders;
Define roles and assemble a team;
Create internal controls, tools, metrics and apply improvement techniques;
Test and rework;
Implement and change;
Drive continuous improvement.
To improve a process or to react to variable customer demands, changes are needed. Companies need to make their organisations flexible in response to fast-changing markets [
12]. The ability to anticipate customer demands and respond effectively is a key skill. Change management is an approach to help businesses achieve successful organisational change [
13]. The change process has the following eight steps [
14,
15]:
Establish a sense of urgency;
Create a guiding coalition;
Develop both vision and strategy;
Communicate the vision;
Empower employees;
Generate short-term wins;
Consolidate the gains to build momentum;
Anchor change in culture.
Lean production is a production method that helps in minimising waste [
1]. It includes the following steps: specify the value, identify the value stream, make value flow through the process, be able to quickly react to customer demands and master the perfection in the whole lean process [
16,
17]. There are various lean methods available to improve manufacturing operations, such as the Single Minute Exchange of Dies (SMED).
The quality-control concept SMED has been widely used to reduce changeover [
18,
19]. In this method, the time taken on changeover operations is a key factor. Changeover operations (also known as setup operations) take place at the start of every production run. When production is very diversified, changeover operations take place frequently. In general, the number of changeover operations cannot be reduced, but the time taken on each changeover can be reduced [
20]. Changeover procedures may vary depending on the type of operation and the type of equipment used. Basic steps include [
8]:
Preparation, adjustments, checking of materials and tools, etc.;
Mounting and removing tools, parts, etc.;
Measurement, setting and calibration;
Trial runs and adjustments.
Several approaches to optimise the changeover process have been proposed in the literature (e.g., [
21,
22,
23]). Generally, manufacturing companies avoid changeovers by producing an excess inventory of finished goods and delivering them to the customers when orders arrive. In this way, deadlines are met and orders are fulfilled. However, this practise generates excess inventory and ties up capital. Other companies have opted to produce fewer products and then tried to stimulate demand for them. These strategies are not appropriate with diversified demand [
8].
SMED includes three major stages [
8,
24]. In the first stage, internal and external changeover operations must be identified. Internal changeover activities can only be performed when the machine (production) is stopped, while external changeover activities can be performed while the machine (production) is still in operation. A continuous production analysis using a stopwatch, or a work sampling study and interviewing the workers, can be used to get information about the main changeover operations. The second stage is to convert internal changeover operations to external changeover operations. This stage involves re-examining the operations to see if any step is wrongly determined to be internal and finding ways to convert these steps to external changeover operations. In the final stage, all aspects of changeover operations are streamlined.
However, Mcintosh et al. [
7] argued that SMED concentrates only on existing changeover activities and converting internal activities to external activities, without focusing on the design level of a changeover. They also claimed that there are possibilities to eliminate changeovers from the process where plants run with spare capacity. Despite this criticism, SMED has been at the forefront of changeover improvement since the 1980s.
SMED was implemented at Toyota and other production facilities. After ten years of implementation, changeover operations took a fortieth of the time than before SMED was implemented. Other effects of SMED include waste reduction, minimisation of inventory, reduction of changeover errors, improved quality and safety, simplified housekeeping, cost reduction, lower-skill requirements and increased production flexibility [
8]. Below, we review other examples of the successful application of SMED in the manufacturing industry.
The implementation of SMED, along with fishbone analysis and “five why” lean techniques, reduced the overall changeover time by 44%, from 4966 s to 2792 s, on a trimming process [
3]. Another example is a survey of secondary wood products manufacturing facilities in North America that implemented SMED. In 93% of cases, productivity was increased, and in 86% of cases, changeover time was reduced [
25].
A small manufacturing facility in Northern India implemented SMED and reported a reduction of time for changeovers of 42.27 min by preheating the die heads, using a pneumatic spanner, and standardising the cut off die length [
9]. Another example of SMED implementation occurred in a stamping production line at an automobile company in Switzerland. The bottlenecks in the changeover operation were identified as the rounding tool settings and tool transportation. A 279-min reduction in changeover operation was reported [
26].
An auto gear manufacturing facility implemented SMED techniques to reduce changeover time and enhance productivity. The bottlenecks were identified as the hot forging, cold forging and machining departments. The changeover time was reduced from 45 min to 8.14 min [
27]. Joshi and Naik [
28] collected data from small-scale industries that had implemented SMED in India. Activities were streamlined, mainly switching the small hand tools with pneumatic/air pressurised tools. A 19.7% average reduction was achieved in changeover operation time.
Roberto et al. [
29] assessed the carbon footprint of a machine centre in Brazil during changeovers. Following SMED implementation, the machine reduced the changeover time by 88% and the carbon footprint during changeover by 81%, which reduced 421.6 g CO
2 emissions per changeover. Diaz-Reza et al. [
30] assessed the effect of SMED in Maquiladora, a group of factories that take raw materials from other countries and process/assemble finished products, largely duty/tariff-free. They found that the identification of internal and external activities is key, and that the transformation phase of activities is responsible for 27.5% of the effects on benefits, and improvement phase activities are responsible for 20.2%.
The conclusion from the literature review undertaken is that optimising the management of manufacturing operations, particularly reducing waste, is a key aspect in any manufacturing business. Changeover processes often generate waste and little value, so they have been previously studied and several approaches for their optimisation have been proposed, for instance, SMED. This article presents a step-by-step example to show how waste can be reduced in changeover processes by applying SMED.
3. Methodology
The company where this study was carried out is a ready meal manufacturer based in South Yorkshire, UK. The business produces its own-labelled chilled ready meals for a premium UK retail brand. It has a portfolio of 70+ products. This study was carried out in the high-care section of the business. This section predominantly stores the inventory, prepares the materials to pack the products and packs the products in 12 assembly lines. Most products are prepared by depositing a sauce in a plastic pot using a sauce depositor, while other components are deposited manually by operatives. Filled pots are sealed, tested for any metal contamination and tested against the declared weight. Food safety and avoiding cross-contamination are key for the company.
Products from the company are complex, diversified and most of them are produced in small lots, therefore requiring a high number of changeovers. Sixteen different types of pots are used to pack the products. It means that there are frequent changes of dies, and adjustments must be made after every change of dies. Before implementing the improvement measures identified in this study, labour was at negative £3000 average a day; changeovers took 80% longer than actually costed for, and the overall equipment effectiveness was at around 60%.
Before this study started, the changeover process was much more complex and longer to avoid cross-contamination. The following activities were identified as part of the changeover process:
Removal of components and equipment of the previous product from the assembly line;
Cleaning and disinfecting the entire assembly line;
Full and deep cleaning if the line is going to start a lower category allergen product followed by a higher category allergen product;
The line is checked and signed off by a supervisor or a quality assurance operative;
Re-cleaning of the line if not cleaned to satisfactory levels;
All components get issued to the line, components are signed off by two separate and independent checkers to ensure that the correct components are used;
Equipment and materials are installed;
Pre-production paperwork is completed;
Production starts;
Metal detection and weight checks are made;
Final adjustments are made before running to target speed.
In this context, this changeover optimisation project was set to achieve these aims:
The timeline of the project can be seen in the Gantt chart in
Figure 1. Nine major tasks were defined.
The methodology applied is based on the lean manufacturing approach explained in
Section 2, principally SMED, and includes the definition of the problem, data collection and process mapping, data analysis, identification of internal and external activities, converting internal activities to external, streamlining activities and line hopping. These steps are described below. The section ends with a short description of some attempts to improve the changeover process that proved to be unsuccessful.
3.1. Definition of the Problem
This step is inspired by the Six Sigma methodology to define a problem [
31]. In this changeover optimisation project, the problem definition started with getting the team together and gathering opinions from all the team members on the problem definition and main objectives. The team consisted of assembly-line team leaders, assembly line setup crew, chills team leaders, quality assurance team leader/supervisor, sleeve-up team leader/supervisor, hygiene team leader, chills supervisor and high care supervisor. The team was led by a high-care supervisor. All members agreed that the basic problem was that changeover time was high, overall equipment effectiveness was lower than the target and labour costs were higher than the target. It was also identified that there were non-value-added activities in the changeover process that needed reduction or, if possible, elimination. It was agreed that avoiding cross-contamination must be the highest priority, and food safety must not be compromised.
3.2. Data Collection and Process Mapping
In this step, data were collected from process mapping. Process mapping is a visualisation exercise to develop a vision of the current state, future state, ideal state and action plan. Mapping is helpful to increase participation and generate ideas. The definition of the scope of mapping is key [
2]. In this study, the scope of mapping was defined as the changeover process. An initial meeting was organised to discuss and clarify the aims and objectives of the mapping. Responsibilities during the mapping exercise were also allocated. Staff were asked to carry out their duties as normal. The project team carrying out the mapping were also instructed not to intervene in the changeover process.
Some of the activities run simultaneously in the changeover process.
Figure 2 shows the activities that ran simultaneously, the activity time and waiting time during the process. Activity time is shown in red, and waiting time is shown in blue.
3.3. Data Analysis
In this step, all the collected data were analysed to identify waste in the changeover process. The following conclusions were drawn:
There is waiting time at various sections of changeover.
Key staff are much busier in the changeover compared to other staff.
The team leader has the highest amount of responsibilities and takes the longest time to complete their activities.
In various activities travelling or motion time is present.
On average, changeover time is 28 min, which is 13 min higher than target/costed changeover time.
The team leader is active for an average of 32 min, including internal and external activities.
Waiting time has increased recently due to in-depth cleaning of line, materials/component sign-off procedures and line sign-off procedures.
3.4. Identification of Internal and External Activities
As previously defined, external activities are those that are performed while production is still on, and internal activities are those performed while production is stopped. Each activity from the changeover process activity list was checked and discussed to define it as internal or external. The focus was on food safety and the risk of cross-contamination while identification was carried out.
Table 1 shows the activities previously identified as part of the changeover process and their classification into internal or external activities. The roles of staff members listed in
Table 1 are: setup crew is the team of semi-skilled operatives responsible for installing the sealing and sauce depositing equipment; packaging operative is the person responsible for removing old packaging from the line and arranging new pots and sealing film; hygiene operative is the person responsible for arranging cleaning and sanitising equipment; servicers are semi-skilled operatives responsible for removing and installing the materials and components on the line; and pink hats are operatives responsible for signing off the materials from chills and receiving the materials on the lines.
3.5. Converting Internal Activities to External
In this step, the activities that can be converted from internal into external are identified. The technical manager was consulted and taken on board to ensure food safety was always maintained. Some activities were only partially converted due to food safety and/or cross-contamination risk. The following activities were converted:
Sealing head heating—Sealing head is used to heat seal the film to the pot. These heads normally have 2–4 impressions (can seal 2–4 pots in one press). They operate at an optimum temperature of 170 °C to 220 °C. Depending on what temperature the product is going to be sealed at, a head can take between 7 and 11 min to reach its optimum temperature. Any attempt of sealing before its optimum temperature results in poor seals. Due to the risk of cross-contamination, heads are installed on the line only once the line has been signed off by a supervisor following cleaning and disinfecting. Therefore, the sealing head has to wait for the optimum sealing head temperature, delaying an average of 5 min for every changeover. This activity was converted to external activity by heating the sealing head on a spare sealing machine and raising it to operating temperature before it was due to be installed. The setup crew were instructed to work closely with supervisors and get the head ready for coming changeovers, to then remove the heated head from the spare sealing machine and install it on the machine due to start production. It was recorded that heads were losing around 5 °C while transporting between machines, which was recovered in a maximum of 1 min. The setup crew were trained to remove heated heads and have the correct PPE to carry out this task safely.
Bringing the cleaning trolley—Cleaning trolleys are used for cleaning stations. To reduce the chances of contaminating listeria in products, they are not used to clean floors. They contain sanitisers, hand sanitisers, paper towels and other cleaning items, as shown in
Figure 3. Cleaning trolleys are brought to the assembly line to clean the line and station at the beginning of changeovers. The time recorded to bring the trolley to the line was 75 s on average. This activity was converted to external by assigning the trolley transportation to hygiene staff rather than line staff. Hygiene staff now get the trolleys ready after changeovers and bring them on to the lines before the next changeover starts.
Completing the SIC board—SIC boards are used to record the line performance in short intervals, normally every hour or during product changeover. The team leaders must update the production data, such as the number of units made, give away, waste, downtime and any issues encountered, on the SIC board. Team leaders were spending, on average, 100 s on updating the board. This requirement was relaxed, and team leaders started to be allowed to update the board once they had completed the changeover.
Clearing the checkweighers—The checkweigher is the machine used to check the weights of every pot packed and reject any pots outside the target weight range. Upon completion of every product, these rejected pots are transferred to sleeve-up (the low-risk area where labelling and sleeving take place) for staff sales. This activity takes place on the completion of every product so that staff sale pots do not mix with pots destined for customers. Team leaders were spending on average 120 s to clear the checkweigher and transfer these pots to sleeve-up. This activity was assigned to the setup crew, who are available between the changeovers (when production is on). The setup crew now clears the checkweigher and uses a spare line to transfer these pots to sleeve-up.
3.6. Streamlining the Activities
In this step, internal and external are streamlined. In this changeover optimisation project, two activities were streamlined:
Line checks—A supervisor must check the line to ensure cleaning and sanitising was done adequately to avoid any risk of cross-contamination. The supervisor must sign off the line before any equipment can be installed on the line.
Figure 4 shows the clean sealing machine before the inspection. It results in the line waiting for the optimum sealing temperatures before production can start (in the previous section, this issue was tackled by converting the internal activity into external; however, this can be done only when there is spare capacity). To reduce the waiting time, it was agreed that line staff clean the sealing machine first, the supervisor signs it off and the setup crew installs the sealing head before the rest of the line is cleaned down. In this way, the sealing head would be at the optimum temperature to start the line. The waiting time before the first pots are on the line at speed can be seen in
Figure 5.
Sanitiser travelling time—A sanitiser at a 1% diluted rate is used for effective cleaning and disinfection of the assembly line. First, brushes and the sanitiser are used to remove the debris, and then the sanitiser is further used for rinsing. The sanitiser is transported in cans on a trolley (as shown in
Figure 3). These trolleys are pre-arranged on the lines before the changeover starts. However, the operatives need to go and get more sanitiser from “controlled sanitiser points” three to four times to clean the line effectively, depending on how contaminated the line is. A travelling time of 75 s on average was recorded every time an operative gets more sanitiser. To eliminate this travelling time, a hygiene team leader was made responsible for always making a full euro bin available at the side of the line. To eliminate the risk of cross contamination, the hygiene team leader was also instructed to label the bin with information, including the line it has been assigned to. This reduced the travelling time.
3.7. Line Hopping
Line hopping is hopping the production from one line to another (e.g., line 1 to line 2), eliminating the need to carry out a changeover. It can be achieved when spare capacity is available within the process. A total of 40–50% spare capacity was reported to be available on high care assembly lines. This process is done in two ways:
Staff working on one assembly line with one spare line available—On one of the assembly lines, staff are working whilst the second line is available as a spare. With line hopping, staff working on line 1 finish the production on line 1 and move to line 2.
Staff hop to the spare line to start production—Staff move to line 2 to start production and the cleaning staff move to line 1 to clean the line. It converted a huge number of internal activities into external ones, as shown in
Table 2.
A dedicated team of three operatives and a team leader are needed to carry out line hopping. The steps to successfully carrying out line hopping are:
Prepare the spare line—A checklist was prepared for staff to follow. The main preparations include installing sealing heads, installing sauce depositors, loading the materials, hanging the photo standards and placing packaging on the line.
Metal checks, checkweighers and paperwork—Initially it was observed that when line 1 was hopping to line 2, there was still waiting time, as the team leader was still finishing the paperwork for the previous work on line 1 and some of the checks were not done for the next product on line 2. To eliminate this waiting time, a team leader was added to the line hopping team, and responsibilities were given to the team leader to prepare the paperwork on line 2, complete the metal and checkweigher checks, and complete the final paperwork on line 1.
End/start of product—Staff on line 1 leave the line as soon as the final pot passes through their station and they have deposited the materials. The team leader then informs the staff that they can move to line 2. Staff wash their hands, change their PPE and occupy their stations on line 2. The team leader gives permission to start the line as soon as all the staff are at their stations.
Clean down—The line hopping team leader takes over line 1, completes the paperwork and does their final checks. The line hopping team cleans the line down, gets it checked and signed off by the supervisor and prepares the line for the next product when it is due to be started.
Line hopping is repeated upon every changeover. Due to the current spare capacity of 40–50%, line hopping is done on all the lines.
3.8. Unsuccessful Attempts
Two attempts to improve the changeover process did not produce the results expected. Therefore, after initial consideration, these ideas were not further considered in the changeover optimisation project. Such unsuccessful attempts are described below.
3.8.1. Reduction in Team Leader Duties
The team leader is the busiest staff member during a changeover and carries out the most significant number of activities. The team leader’s activities during a changeover can be seen in
Figure 6.
To reduce the changeover time, it is necessary to reduce the amount of time a team leader spends on these activities. It can be done either by reducing the number of duties or by sharing the duties with another staff member. However, the activities that a team leader carries out require more training than is covered in the training for an operative. The team leader needs to be signed off on critical control point procedures, metal check, checkweigher check, paperwork, etc. Only a spare team leader could undertake these activities; nevertheless, it is not viable to keep many team leaders spare.
Another option was to train an operative from the line staff and make them share these activities during a changeover [
32,
33]. Suggesting training an operative on additional duties was met by the demand for additional wages. Managers were willing to pay extra towards this; however, this meant creating a new job category. It created a problem as a new category must be implemented throughout the factory, and this was not an achievable task in the given time frame due to the fact that the site was already holding pay negotiations with the union. Hence, this attempt was not successful.
3.8.2. Planning Schedule
Due to the complexity of products, there were several constraints on the changeovers. The duration of a changeover is affected by factors such as:
Size and shape of the pot. If the line is going to start production with a different pot, it takes longer to do the changeover, as the settings on all the machines need to be changed for the new pot shape.
Allergen control is the second major factor that affects the duration of the changeover. If the line is going to changeover to a lower category allergen product, a deep clean is needed. A deep clean takes a much longer time, increasing the changeover time.
To overcome these two challenges, products could be planned in a sequence in a way that pots of similar sizes and shapes could be prepared on one line so that changeover time can be reduced. The same could be done with allergens.
After trying to implement this change, it was found that this was a bigger challenge than expected and was not viable for this project. The main issue was the availability of materials in the correct sequence. It is affected by a number of factors, including give away on lines, the yield of cooked components, stock accuracy and delivery times of materials. Hence, this attempt was not successful.
4. Results
This section presents the comparison of the changeover process before and after the implementation of the changeover optimisation project. The results are presented in two phases: comparison of individual activities and comparison of the whole changeover process.
4.1. Results from Individual Activities
This subsection shows improvement results from the individual activities, which were either converted from internal to external or were streamlined.
4.1.1. Sealing Head Heating
The biggest gain was made from preheating the sealing heads on a spare line and making them ready just in time before changeover. On average, 310 s of waiting time is saved. With an average of 50+ changeovers a day, this would save up to 1570 production hours a year.
4.1.2. Cleaning Trolley
The responsibility of transporting the cleaning trolley was given to the hygiene team, rather than line operatives. It saved, on average, 75 s per changeover, which would save 380 production hours a year.
4.1.3. SIC Boards
By relaxing the requirement to complete SIC boards during a changeover, on average, 100 s are saved for each changeover. It would save up to 500 production hours a year. This change also improved the quality of information on the SIC board, as team leaders were no longer in a hurry to complete the board.
4.1.4. Clearing the Checkweigher
The setup crew, instead of the team leader, were assigned to clear the checkweigher at the end of each run. On average, this saves 120 s every changeover, which would save up to 600 production hours a year.
4.1.5. Line Clean Down Checks
A change in the sequence of the supervisor line check following a line clean down allowed the sealing machines to be checked and signed off earlier than when the lines get clean down. It enabled the setup crew to install sealing heads that were to be heated up by the time they were required. It saves an average of 310 s per changeover. However, this improvement is an alternative to the improvement already discussed in
Section 4.1.1 (sealing head heating), which also saves an average of 310 s every changeover. If spare capacity is available, then the method discussed in
Section 4.1.1 is applied. When spare capacity is not available, then the line clean-down check sequence, as explained in this section, is applied. For consistency, the line clean-down check sequence is permanently adopted in practice, regardless of the availability of capacity.
4.1.6. Sanitiser Transport
The reduction in travelling time to transport sanitiser to the line saves, on average, 75 s a trip. On average, staff had to take 3–4 trips. If changeover taking place on lines closer to the sanitiser storage area, the travelling time is reduced to around 26 s. The mean of the two figures is 50.5 s ((75 + 26)/2 = 50.5). It would save about 250 production hours a year.
4.2. Improved Changeover Process
By implementing the six changes discussed in the previous subsection, the changeover process is improved by reducing the changeover time from 29 min to 20 min, a 30% reduction. In total, 3300 production hours per year would be saved. With the current average of 15 pots a minute, this would produce nearly 3 million extra pots a year. The optimised changeover process can be seen in
Figure 7. The improvements are shown with arrows; the red colour is used to show when staff are busy carrying out the changeover, and the blue colour is used to show waiting time.
4.3. Line Hopping
Line hopping received positive feedback and was considered a success by all senior managers. It is regarded as a way forward to tackle the high number of changeovers due to the low volume of diversified orders the business has. The changeover activities during line hopping can be seen in
Figure 8. Line hopping reduced the changeover time to just under 9 min, which is well below the 20 min achieved using traditional SMED methodology.
4.4. Overall Equipment Effectiveness (OEE)
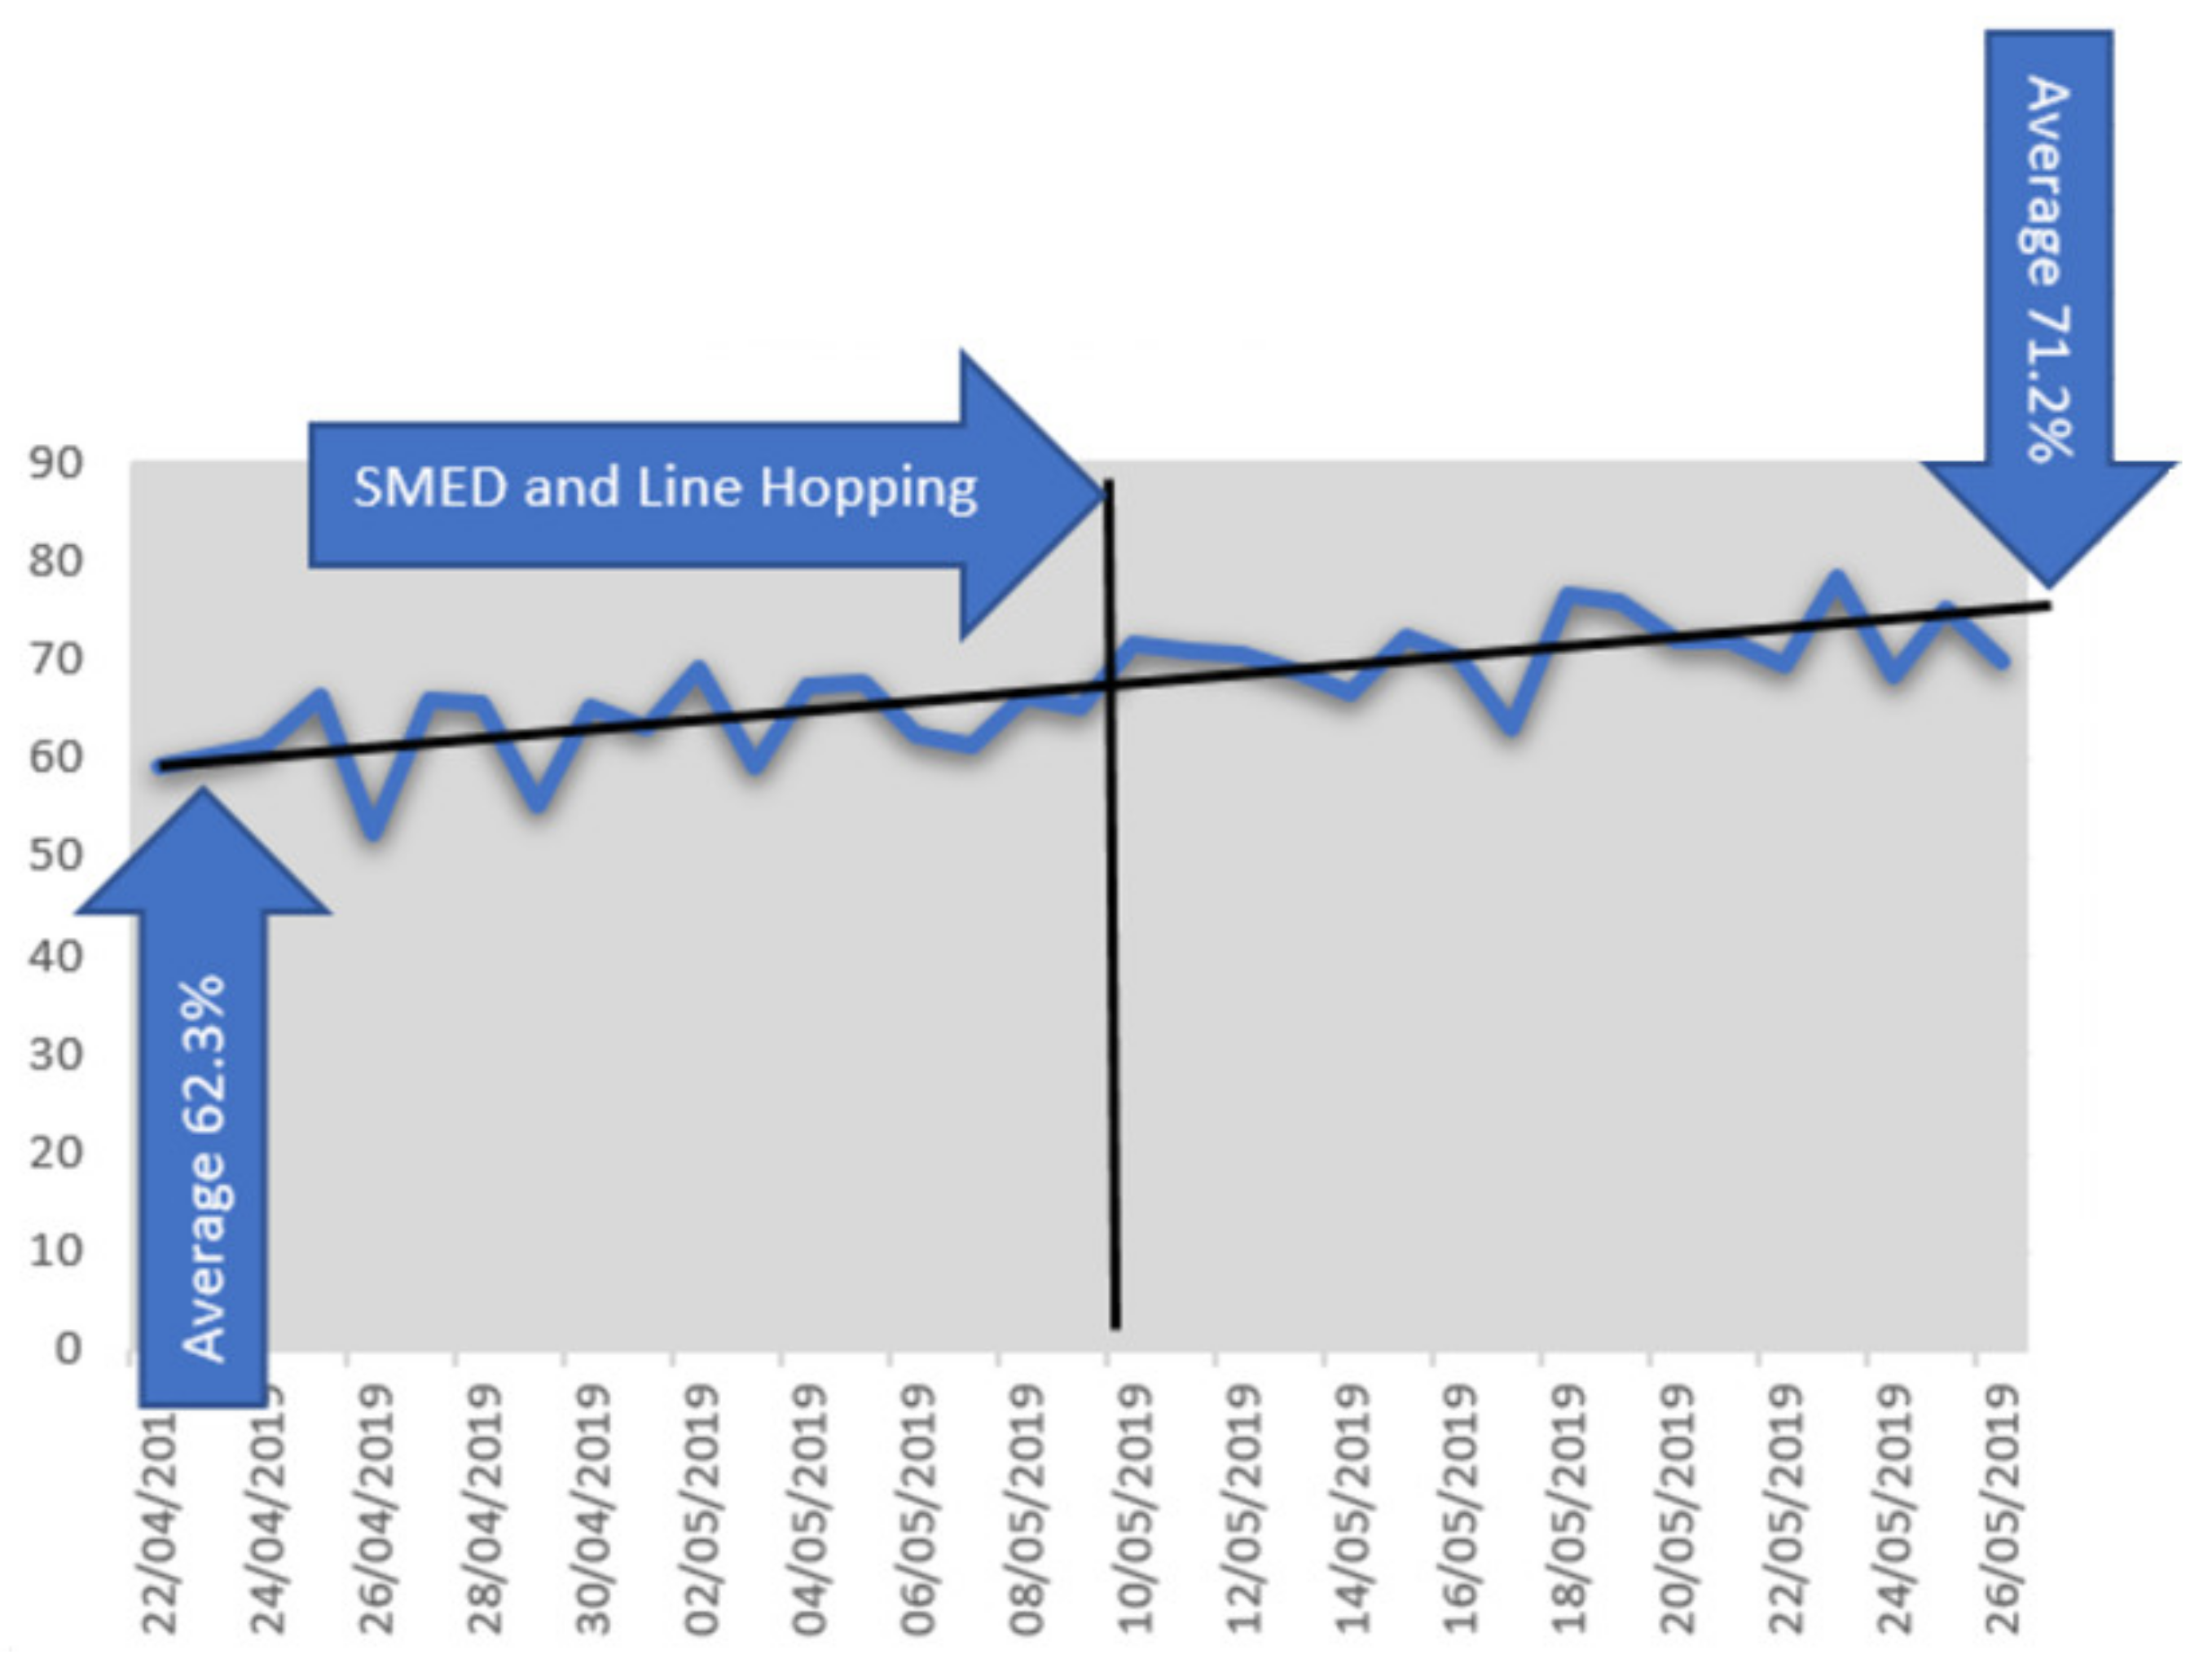
Overall Equipment Effectiveness (OEE) is a key performance indicator to measure the effectiveness of the process. OEE shows the availability of equipment (total time—downtime planned + unplanned), output quality (good packs) and run rate (against target) [
34]. OEE was averaging around 60% before optimising the changeover process. Following the optimisation, OEE increased to an average of 71%. The OEE figures for six weeks, three weeks before the SMED and line hopping (changeover optimisation), and three weeks after, can be seen in
Figure 9.
4.5. Labour Cost
Before the changeover optimisation project, labour costs were measured as “labour variance”, which is the term for the amount spent on labour against the budget. During the project, the business started measuring the labour costs slightly differently (due to a change in leadership). Instead of “labour variance,” the business started measuring “labour recovery”. The daily target for labour recovery is given, and business performance is measured against the target.
Labour recovery is measured for the whole business as one unit. Shortly, it will start to be measured per department. Interpretation of labour recovery figures is currently complicated. If a department uses extra staff to cover promotional stickering work or another department uses extra staff to handle some frozen rework for a few days, it is not possible to calculate exactly how a different department is doing on labour recovery.
Figure 10 shows the labour recovery variance for 3 weeks before implementing SMED and line hopping and 3 weeks after. An improvement can be seen in labour recovery in the time analysed. This can be considered as a high-care performance indicator since high-care uses the biggest pool of staff in the business.
5. Recommendations for Further Work
During the project, three possible areas for improvement were identified for further work: team leader activities, components transport, and planning and cooking schedule. These areas are explained below.
The team leader spends the highest amount of time and carries out the highest number of activities during a changeover. Other team members complete their activities about 7 min before the team leader’s activities are completed. Therefore, the bottleneck is the team leader’s activities. Unless the team leader’s activities are shared or reduced, further improvements are hard to achieve. Proposals have been made to train second staff on the line to share activities and become active only when changeover starts.
Recent restrictions are preventing the line servicers from bringing the components closer to the line for the next product. Only when servicers have cleared the components of the previous product and the supervisor has signed off the line, can servicers start bringing the components to the line. Even then, components must still be signed off by two independent pink hats, further increasing the time taken for this activity. This process is in place to avoid any risk of cross-contamination. It has been proposed that components for the following product be stored in a marked-up, cordoned-off area, and stay in the area until allowed on to the line by a supervisor. This potential solution has been proposed and is being evaluated by management.
Reassessing the planning and cooking schedule is a major task that can be considered long-term but offers huge opportunities. It can help to achieve a linear flow and keep the changeovers short and simple. This can be done by reducing the number of adjustments and tool head changes. The planning and cooking schedule are affected by various factors, including stock taking, stock correction, physical vs. electronic availability of materials, stock visibility, yields and material delivery times. This is a huge task; however, it can bring important benefits not only to improving changeovers but also other parts of the process.
6. Conclusions
This project was carried out to optimise the changeover process in a food factory by using lean production methods, principally the SMED methodology. The team in the factory was introduced to systematic improvement to the changeover process and the SMED concept. The team learned that improvement in changeover could have an impact on overall performance, whereas previously the team leader’s approach was to recoup the time lost during a long run. The team was also made aware of the large impact of long changeovers on performance.
A number of activities were found to be involved in the changeover process. Most activities are internal, but there are also a few external activities. During the project, some internal activities were converted to external, some activities were streamlined, and some were changed by undertaking line hopping. The total changeover time was reduced by SMED methodology by nearly 30%. This was achieved by changing six main activities. The biggest time reduction was achieved by pre-heating the sealing head, with 310 s. This achievement has a limit in the event of limited or no spare capacity because pre-heating relies on the availability of the spare sealing machine.
Line hopping was proven to be an effective way of reducing or even eliminating the changeover time. By performing line hopping, the changeover time went further down to under 10 min, which is an overall reduction of nearly 68% in changeover time. There is a big potential for line hopping to become a method to create spare capacity in a low volume, diversified production setup. It would be interesting to see in what form this can be implemented and how much capacity line hopping can create when there is limited or no spare capacity.
OEE was also improved by 9% to reach 71%. OEE is a good indicator of equipment performance and must be used where there is spare capacity in the process. Labour recovery figures also improved as a result of the project.
The changeover process has further improvement opportunities available. Most production operatives are waiting for other members of the team to finish their activities. The team leader has been associated with the highest number of activities and spends the longest time carrying out activities during changeover. The setup crew make repeat adjustments that can be eliminated. Furthermore, a reduction in spare capacity may reduce the impact of improvements. It must also be considered that all changes made must prioritise workers’ safety.
In conclusion, this study shows how lean principles can support the implementation of more efficient, effective and economically sustainable manufacturing operations in a real industrial environment.
Author Contributions
Conceptualization, S.J.; methodology, Y.S.; validation, G.G.-G.; formal analysis, Y.S. and G.G.-G.; resources, S.J.; data curation, Y.S. and G.G.-G.; writing—original draft preparation, Y.S.; writing—review and editing, G.G.-G.; supervision, S.J.; project administration, S.J.; funding acquisition, G.G.-G. and S.J. All authors have read and agreed to the published version of the manuscript.
Funding
Guillermo Garcia-Garcia acknowledges the Grant ‘Juan de la Cierva Incorporación’ funded by MCIN/AEI/10.13039/501100011033 by “ESF Investing in your future”.
Institutional Review Board Statement
Not applicable.
Acknowledgments
We thank the anonymised food company for collaborating in this project and for the data provided.
Conflicts of Interest
The authors declare no conflict of interest. The funders had no role in the design of the study; in the collection, analyses, or interpretation of data; in the writing of the manuscript, or in the decision to publish the results.
References
- Garcia-Garcia, G.; Coulthard, G.; Jagtap, S.; Afy-Shararah, M.; Patsavellas, J.; Salonitis, K. Business process re-engineering to digitalise quality control checks for reducing physical waste and resource use in a food company. Sustainability 2021, 13, 12341. [Google Scholar] [CrossRef]
- Bicheno, J.; Holweg, M. The Lean Toolbox: The Essential Guide to Lean Transformation, 4th ed.; PICSIE Books: Buckingham, UK, 2008; ISBN 978-0954124458. [Google Scholar]
- Ahmad, R.; Soberi, M. Changeover process improvement based on modified SMED method and other process improvement tools application: An improvement project of 5-axis CNC machine operation in advanced composite manufacturing industry. Int. J. Adv. Manuf. Syst. 2018, 94, 433–450. [Google Scholar] [CrossRef]
- Emiliani, B. Real Lean: Understanding the Lean Management System; Center for Lean Business Management: Wethersfield, CT, USA, 2007; Volume 1. [Google Scholar]
- Ohno, T. Toyota Production System: Beyond Large Scale Production, 1st ed.; Productivity Press: Portland, OR, USA, 1988; ISBN 0915299143. [Google Scholar]
- De Jesus Pacheco, D.A.; Heidrich, G.D.G. Revitalising the setup reduction activities in Operations Management. Prod. Plan. Control 2021, 1–21. [Google Scholar] [CrossRef]
- Mcintosh, R.; Culley, S.; Mileham, A.; Owen, G. A critical evaluation of Shingo’s SMED (single minute exchange of die) methodology. Int. J. Prod. Res. 2000, 38, 2377–2395. [Google Scholar] [CrossRef]
- Shingo, S. A Revolution in Manufacturing: The SMED System; Productivity Press: Portland, OG, USA, 1985; ISBN 978-0915299034. [Google Scholar]
- Singh, J.; Singh, H.; Singh, I. SMED for quick changeover in manufacturing industry—A case study. Bench. Int. J. 2018, 25, 2065–2088. [Google Scholar] [CrossRef]
- Page, S. The Power of Business Improvement: 10 Simple Steps to Increase Effectiveness, Efficiency and Adaptability; American Management Association: New York, NY, USA, 2016; ISBN 978-0814436615. [Google Scholar]
- King, J.; King, F.; Davis, M. Process Improvement Simplified: A How-to-Book for Success in any Organization; ASQ Quality Press: Milwaukee, WI, USA, 2014; ISBN 978-0873898836. [Google Scholar]
- Miller, D.; Proctor, A. Enterprise Change Management: How to Prepare Your Organisation for Continuous Change; Kogan Page: London, UK, 2016; ISBN 978-0749473013. [Google Scholar]
- Camuffo, A.; Gerli, F. Modeling management behaviors in lean production environments. Int. J. Oper. Prod. Manag. 2018, 38, 403–423. [Google Scholar] [CrossRef]
- Errida, A.; Lotfi, B. The determinants of organizational change management success: Literature review and case study. Int. J. Eng. Bus. Manag. 2021, 13, 1–15. [Google Scholar] [CrossRef]
- Kotter, J.; Cohen, D. The Heart of Change: Real-Life Stories of How People Change Their Organizations; Harvard Business Review Press: Washington, DC, USA, 2014; ISBN 978-1422187333. [Google Scholar]
- Tissir, S.; Cherrafi, A.; Chiarini, A.; Elfezazi, S.; Bag, S. Lean Six Sigma and Industry 4.0 combination: Scoping review and perspectives. Total. Qual. Manag. Bus. Excell. 2022, 1–30. [Google Scholar] [CrossRef]
- Liker, J. The Toyota Way: 14 Management Principles from the World’s Greatest Manufacturer; McGraw-Hill: New York, NY, USA, 2004; ISBN 978-0071392310. [Google Scholar]
- Junior, R.G.P.; Inácio, R.H.; da Silva, I.B.; Hassui, A.; Barbosa, G.F. A novel framework for single-minute exchange of die (SMED) assisted by lean tools. Int. J. Adv. Manuf. Syst. 2022, 119, 6469–6487. [Google Scholar] [CrossRef]
- Malindzakova, M.; Malindzak, D.; Garaj, P. Implementation of the Single Minute Exchange of Dies method for reducing changeover time in a hygiene production company. Int. J. Ind. Eng. Manag. 2021, 12, 243–252. [Google Scholar] [CrossRef]
- Chaple, A.P.; Narkhede, B.E.; Akarte, M.M.; Raut, R. Interpretive framework for analyzing lean implementation using ISM and IRP modeling. Bench. Int. J. 2018, 25, 3406–3442. [Google Scholar] [CrossRef]
- Ciavotta, M.; Meloni, C.; Pranzo, M. Minimising general setup costs in a two-stage production system. Int. J. Prod. Res. 2013, 51, 2268–2280. [Google Scholar] [CrossRef]
- Ciavotta, M.; Detti, P.; Meloni, C.; Pranzo, M. A bi-objective coordination setup problem in a two-stage production system. Eur. J. Oper. Res. 2008, 189, 734–745. [Google Scholar] [CrossRef]
- Naso, D.; Turchiano, B.; Meloni, C. Single and multi-objective evolutionary algorithms for the coordination of serial manufacturing operations. J. Intell. Manuf. 2006, 17, 249–268. [Google Scholar] [CrossRef]
- Ikumapayi, O.M.; Akinlabi, E.T.; Mwema, F.M.; Ogbonna, O.S. Six sigma versus lean manufacturing—An overview. Mater. Today 2020, 26, 3275–3281. [Google Scholar] [CrossRef]
- Buehlmann, U.; Kucuk, E. SMED in North American Secondary Wood Products Industry. In Proceedings of the 2018 IEEE International Conference on Industrial Engineering and Engineering Management, Bangkok, Thailand, 16–19 December 2018; pp. 671–674. [Google Scholar]
- Abraham, A.; Ganapathi, N.; Motwani, K. Setup time reduction through SMED technique in stamping production line. Sastech J. 2012, 11, 47–52. [Google Scholar]
- Desai, M.; Warkhedkar, R. Productivity enhancement by reducing adjustment time and setup change. Int. J. Mech. Eng. 2011, 1, 37–42. [Google Scholar] [CrossRef]
- Joshi, R.; Naik, G. Application of SMED methodology—A case study in small scale industry. Int. J. Sci. Res. 2012, 2, 2250–3153. [Google Scholar]
- Roberto, J.; Andrea, N.; Luana, C.; Diogo, S. Creating value with less impact: Lean, green and eco-efficiency in a metalworking industry towards a cleaner production. J. Clean. Prod. 2018, 190, 517–534. [Google Scholar]
- Diaz-Reza, J.; Garcia-Alcaraz, J.; Martinez-Loya, V.; Blanco-Fernandez, J.; Jimenez-Macias, E.; Avelar-Sosa, L. The effect of SMED on benefits gained in maquiladora industry. Sustainability 2016, 8, 1237. [Google Scholar] [CrossRef] [Green Version]
- Breyfogle, F.; Cupello, J.; Meadows, B. Managing Six Sigma, 1st ed.; John Wiley & Sons: New York, NY, USA, 2001; ISBN 471396737. [Google Scholar]
- Losonci, D.; Kása, R.; Demeter, K.; Heidrich, B.; Jenei, I. The impact of shop floor culture and subculture on lean production practices. Int. J. Oper. Prod. Manag. 2017, 37, 205–225. [Google Scholar] [CrossRef]
- Tortorella, G.L.; de Castro Fettermann, D.; Frank, A.; Marodin, G. Lean manufacturing implementation: Leadership styles and contextual variables. Int. J. Oper. Prod. Manag. 2018, 38, 1205–1227. [Google Scholar] [CrossRef]
- Kennedy, R. Understanding, Measuring, and Improving Overall Equipment Effectiveness, 1st ed.; CRC Press: London, UK, 2018; ISBN 9781315166957. [Google Scholar]
| Publisher’s Note: MDPI stays neutral with regard to jurisdictional claims in published maps and institutional affiliations. |
© 2022 by the authors. Licensee MDPI, Basel, Switzerland. This article is an open access article distributed under the terms and conditions of the Creative Commons Attribution (CC BY) license (https://creativecommons.org/licenses/by/4.0/).


