Review

Influencing Factors in MOOCs Adoption in Higher Education: A Meta-Analytic Path Analysis

1
Faculty of Educational Studies, Universiti Putra Malaysia, Seri Kembangan 43400, Selangor, Malaysia
2
Pusat Pengajian Citra Universiti, Universiti Kebangsaan Malaysia (UKM), Bangi 43600, Selangor, Malaysia
*
Author to whom correspondence should be addressed.
Sustainability 2022, 14(14), 8268; https://doi.org/10.3390/su14148268
Submission received: 29 May 2022 / Revised: 29 June 2022 / Accepted: 4 July 2022 / Published: 6 July 2022

Abstract

:
(1) Background: Due to the rapid growth of Massive Online Open Courses (MOOCs), higher educational institutions across the world are investing heavily in MOOCs to support their traditional teaching, their students’ learning experience, and their performance. However, the success of MOOCs highly depends on several factors that influence their success in higher education. Prior studies have attempted to investigate and predict user acceptance of MOOCs in higher education by using a variety of theoretical viewpoints. Nonetheless, these studies have yielded conflicting findings and are inconclusive. (2) Purpose: This study aims to develop a model that integrates the Theory of Planned Behavior (TPB), the Unified Theory of Acceptance and Use of Technology (UTAUT), as well as the Task-Technology Fit (TTF) to explore the factors that influence the acceptance and use of MOOCs in higher education institutions, while synthesizing previous empirical findings in the field. (3) Methods: The model was tested using Meta-analytic Structural Equation Modelling (MASEM) based on the data gathered from 43 studies (k = 45 samples, n = 16,774). (4) Results: Effort expectancy (EE), attitude (ATT), performance expectancy (PE), and TTF—determined by several task and technology characteristics—were identified as the direct predictors of behavioral intention (BI) to continue using MOOCs. (5) Conclusions: This model provides a cohesive view of MOOCs’ acceptance in higher educational institutions, and it helps to identify potential research opportunities in this area. (6) Implications: Results from MASEM offer managerial guidance for the effective implementation of MOOCs and provide directions for further research, to augment current knowledge of MOOCs’ adoption, by higher education institutions.

1. Introduction

For several years, higher education institutions (HEIs) have been under pressure to innovate due to two external forces: the need to reduce costs, while addressing the rising demand for higher education (HE); the need to demonstrate the relevance of their degree programs for employability in the ever-changing world [1]. Massive Online Open Courses (MOOCs) were introduced as the next big thing in HE and branded as the tool for ‘innovative disruption’ that will improve education [2]. This system—which alters remote education delivery and increases students’ and scholars’ access to open educational resources (OER)—has attracted over 800 colleges and universities that offer thousands of these courses to millions of registered individuals worldwide [3]. These numbers have positioned MOOCs as strong virtual platforms for education, and as a result, many HEIs are pioneering various initiatives to incorporate MOOCs into their teaching and learning activities. Despite the growing popularity of these courses in HE, understanding students’ and scholars’ acceptance of such courses is crucial to their success.
Existing studies have explained MOOCs’ user acceptance in the HE context using a multitude of human behavior theories, e.g., [4]. Among these, the Theory of Planned Behavior (TPB) [5], as well as the Unified Theory of Acceptance and Use of Technology (UTAUT), were some of the most frequently applied. TPB was developed to describe generic human behavior, whereas UTAUT was designed to explain specific MOOC user adoption. These theories describe several elements that impact a technology’s adoption, with behavioral intention (BI) (to intend to use the technology) and actual behavior (real usage of the technology) serving as indicators of acceptance. However, concentrating exclusively on users’ impressions of technology may be insufficient. According to the Task-Technology Fit (TTF) model, users will accept a technology if its qualities match the task requirements [6]. While users may acknowledge technological advancements, they may not utilize them if they believe such technologies are unsuitable for their activities or they do not increase users’ work efficiency [7]. Users are utilitarian individuals, whose usage of technology is based not only on perceptions and attitudes but also on a strong TTF.
Numerous scholars have conducted additional research on frameworks that incorporate at least one of these models, in the empirical literature, with regards to the persistence in using these courses in HE [8]. Several research works have compared TTF with the technology acceptance model (TAM) to predict learners’ desire to continue using these courses, while others merged TTF and UTAUT models to provide an enhanced MOOCs adoption model, e.g., [9]. Nonetheless, the majority of recent systematic reviews on the literature lack the rationale for selecting a model, or collection of models, for MOOCs adoption [10,11,12]. Additionally, the examination of the literature on MOOCs’ adoption revealed that none of the studies have examined the performance of the models and their underlying constructs. Not only would this analysis offer trends and evaluations of the models utilized but it would also present the cumulative performance of the constructs included in these models. None of the previous studies have incorporated these models within the context of MOOCs adoption. The novelty of conducting a quantitative review of the MOOCs’ usage, as well as the dearth of studies investigating relations among the constructs of these three models within a unified theoretical framework, forms the motivation for this study. It is also important to synthesize the existing findings on the acceptance of these courses in HE, as they provide additional insights into the possible mechanisms underlying these courses that are relevant to learning and teaching in HEIs.
Against this backdrop, the main objectives of this study are to: (1) develop a model that integrates the TPB, UTAUT, and TTF to explore the factors that influence MOOCs adoption in higher education while synthesizing previous empirical findings; (2) to compare the effect size in the causal relationships to provide evidence for the moderating role of sample size, gender, age, and culture. As such, this study attempts to integrate constructs from these three models into a comprehensive model of MOOCs’ adoption to explore the direct impact of attitude, technology characteristics, and acceptance on MOOCs adoption. The present findings show that our model surpasses any single theory—confirming the significance of all three of them as complementing viewpoints—while allowing us to gain a better understanding of what variables will influence MOOCs’ acceptability in HE and how much influence each element has. Given that the direct effects do not often convey the full picture, this study has been extended to determine the cumulative effect of variables affecting the acceptance of these courses in HEIs. In addition, the current moderator analysis clarifies uncertainties and examines the generalizability of the conflicting results, providing insights into how different factors influence MOOCs’ adoption in HE.

2. Theoretical Background

2.1. Massive Online Open Courses (MOOCs) Adoption

The factors that have an impact on educational innovations’ acceptance were always of interest to researchers and practitioners in HEIs. Numerous scholars have explored various facets of this novel innovation. Several studies have examined students’ toward MOOCs [13]. Some researchers examined the potential applications of these courses in a variety of academic subjects [14]. Prior studies have also examined the assessment challenges associated with these courses [15]. Scholars have also focused their attention on learning theories and pedagogical approaches for MOOCs [16]. In the contemporary information systems (ISs) literature, user acceptance of these courses is frequently portrayed among the most mature fields of study [17]. Numerous theoretical models have been developed in this field to account for individuals’ intentions to enroll in these courses. In this study, the TPB, UTAUT, and TTF serve as bases for an integrated framework to determine MOOCs adoption in HEIs.

2.2. Theory of Planned Behavior (TPB)

The TPB [18], derived from social psychology, is a forerunner to other models, and it is frequently used as an explanation of behavior and for understanding technology usage and its adoption [19]. As illustrated in Figure 1, the TPB states that user behavior is dictated by their perception of control, while their intention is affected by their attitude on behavior (ATT), subjective norms (SN), and perceptions of behavioral control (PBC) [5]. Additionally, some scholars have provided empirical support for TPB in their research on MOOCs [20].

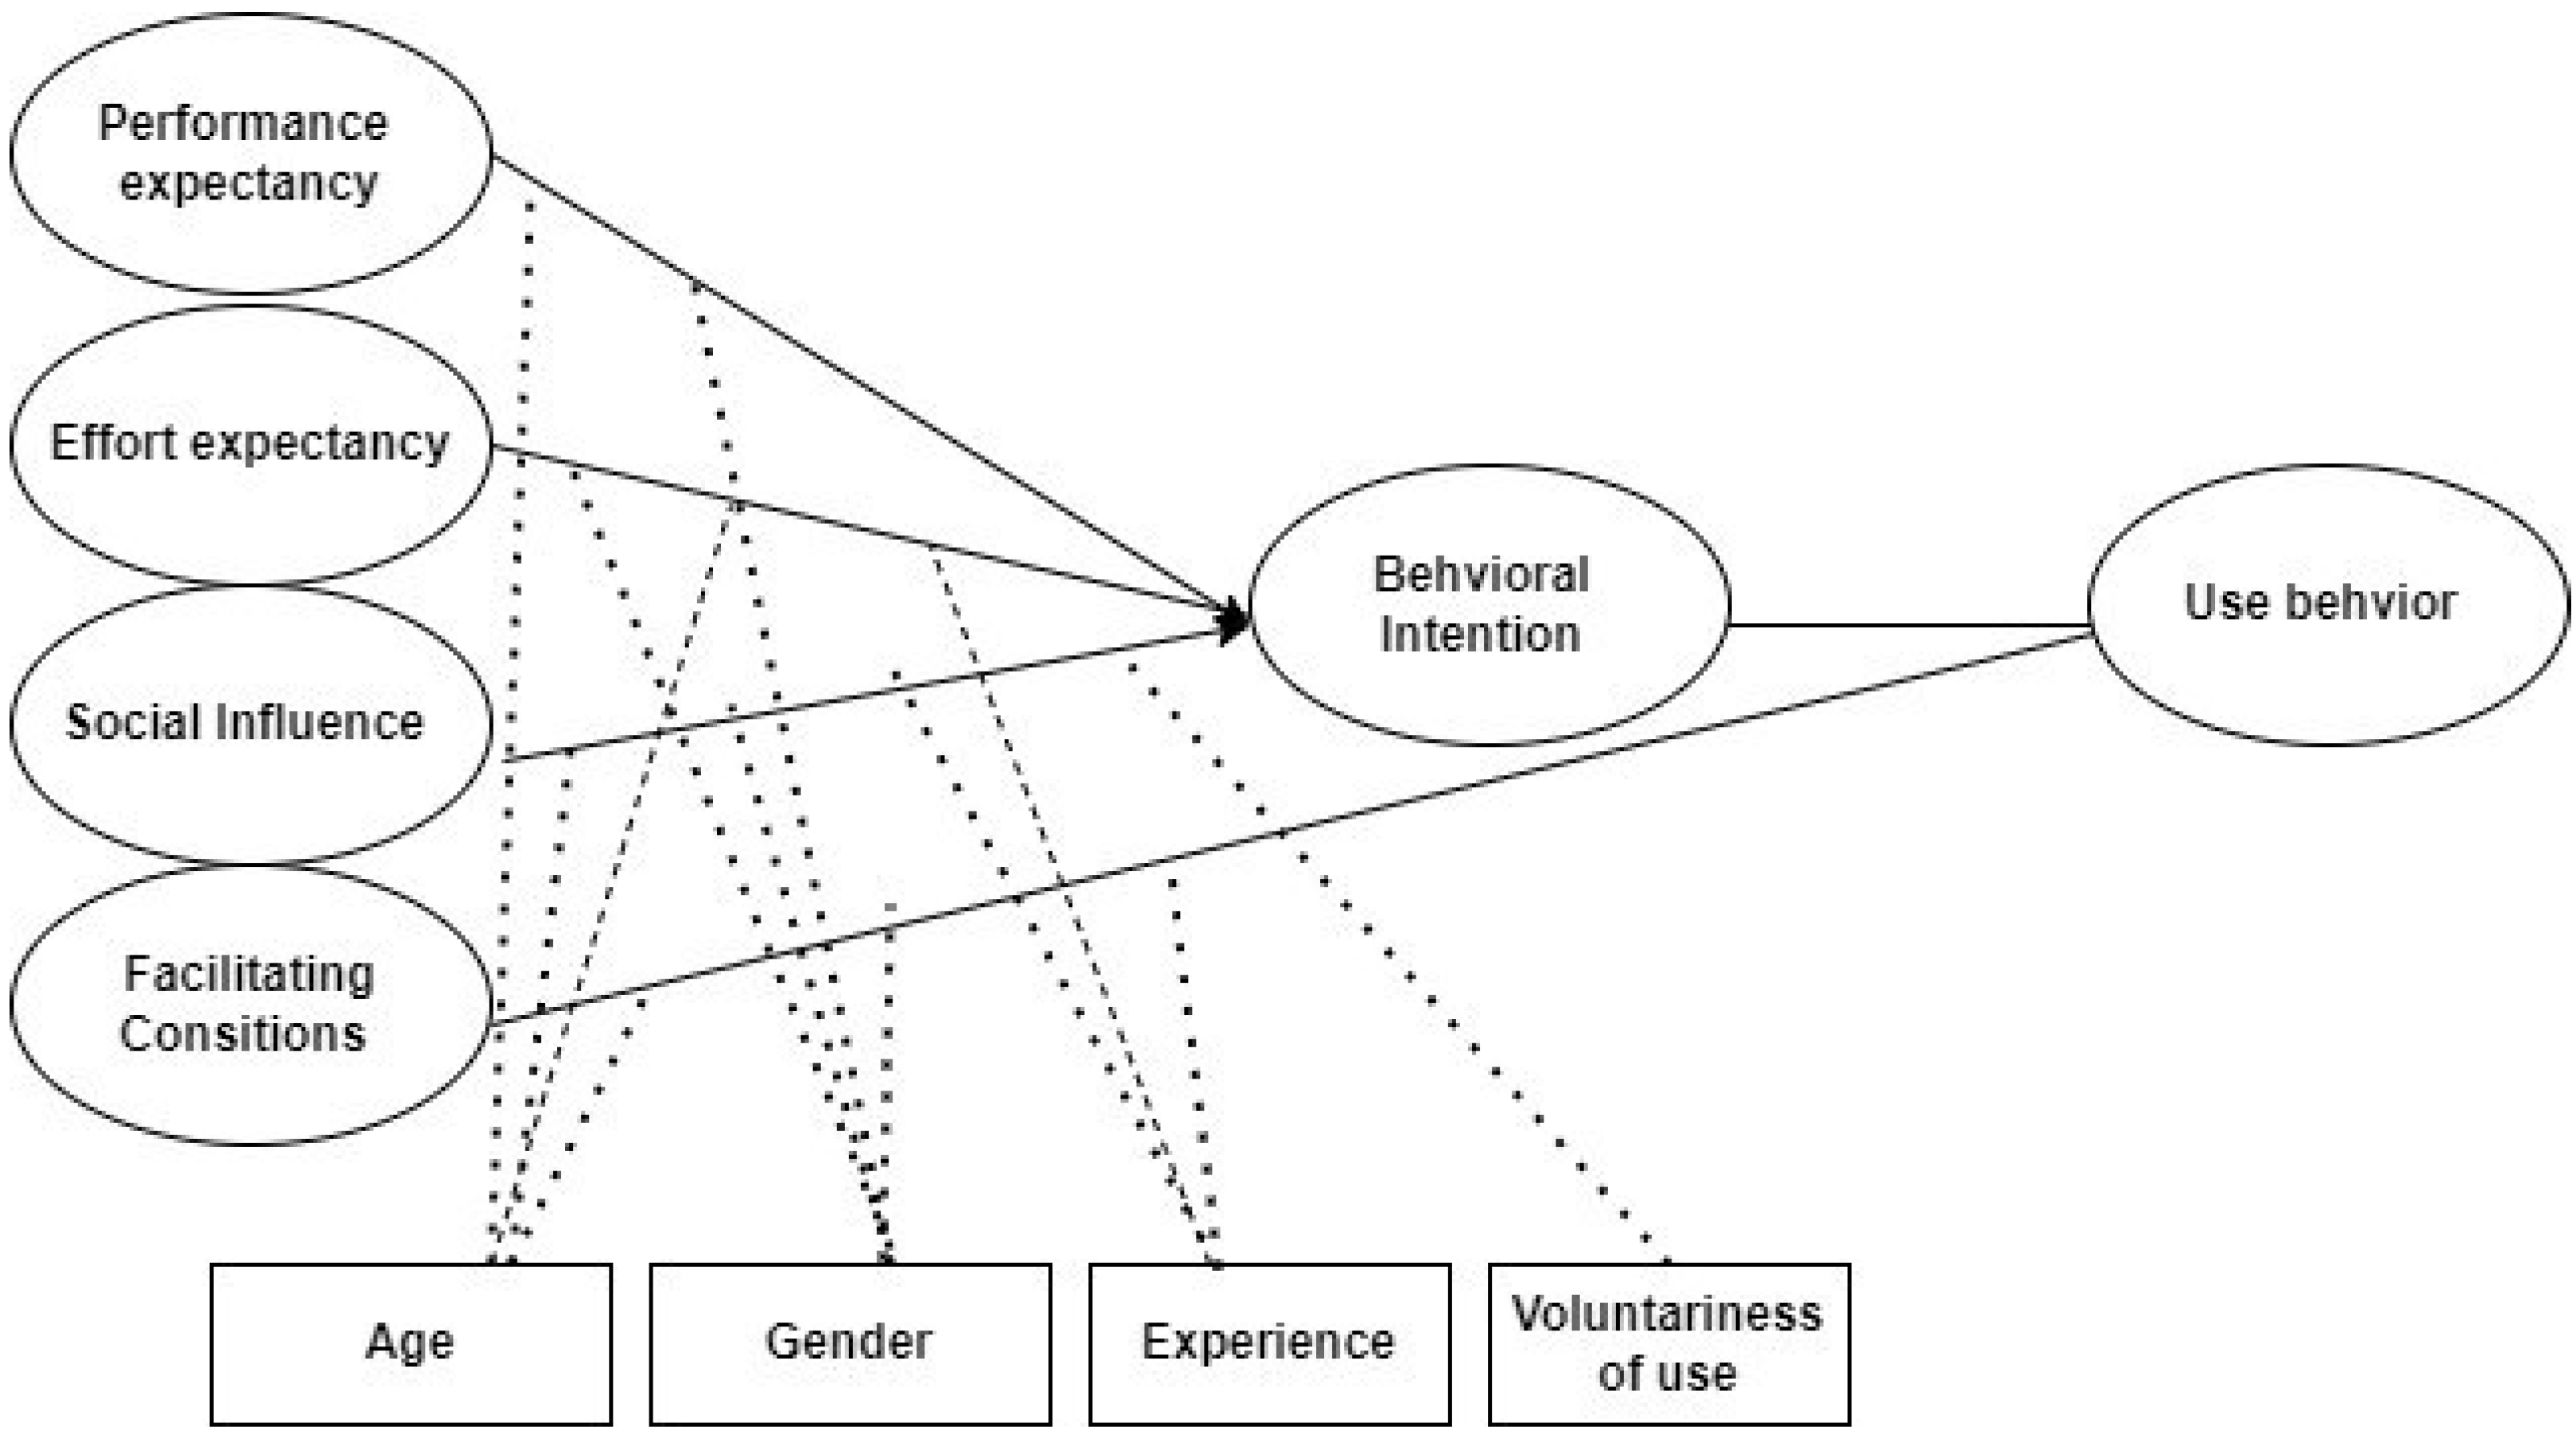
2.3. The Unified Theory of Acceptance and Use of Technology (UTAUT)

The UTAUT [19] is based on eight theories and models: namely, the technology acceptance model (TAM), the theory of reasoned action (TRA), the motivational model (MM), the TPB, the combined TAM TPB model (C-TAM-TPB), the model of PC utilization (MPCU), the innovation diffusion theory (IDT), and the social cognitive theory (SCT). Although UTAUT is not as widely used as TAM, it has garnered academic interest in recent years for its ability to determine user acceptance of MOOCs [21], as demonstrated in Figure 2. According to Venkatesh [19], the eight models explain between 17% and 53% of the variance in users’ intentions to use information systems (ISs)/information technology (IT). UTAUT, on the other hand, outperformed all eight models tested on the same data, accounting for more than 70% of the variance in BI and 50% in technology use [19,22]. Venkatesh [19] proposed that, when researchers are confronted with a significant number of identical constructs provided by many theories, they either “pick and choose” constructs from the models or choose a “preferred model”, whilst ignoring the others. For these reasons, UTAUT can contribute to the understanding of the elements that influence users’ adoption of MOOCs.

2.4. Task-Technology Fit (TTF)

The TTF model is currently being explored and used with a range of ISs [23]. It (Figure 3) considers technology as a beneficial instrument for enhancing individual performance and can be used if its capabilities fit the tasks that users must perform [24]. According to Wu and Chen [25], TTF is a widely used model for assessing how IT affects user performance by correlating task characteristics (TAC) and technology characteristics (TEC). Both these factors have an impact on TTF, which, in turn, defines user performance. The TTF model is the primary subject of interest of this research. According to the TTF model, a user accepts an IT system only if it is a good fit for the activities at hand and increases efficiency [6]. TTF has been broadly used and integrated with related models, such as UTAUT, to investigate the adoption of IT systems since their debut, e.g., [26].

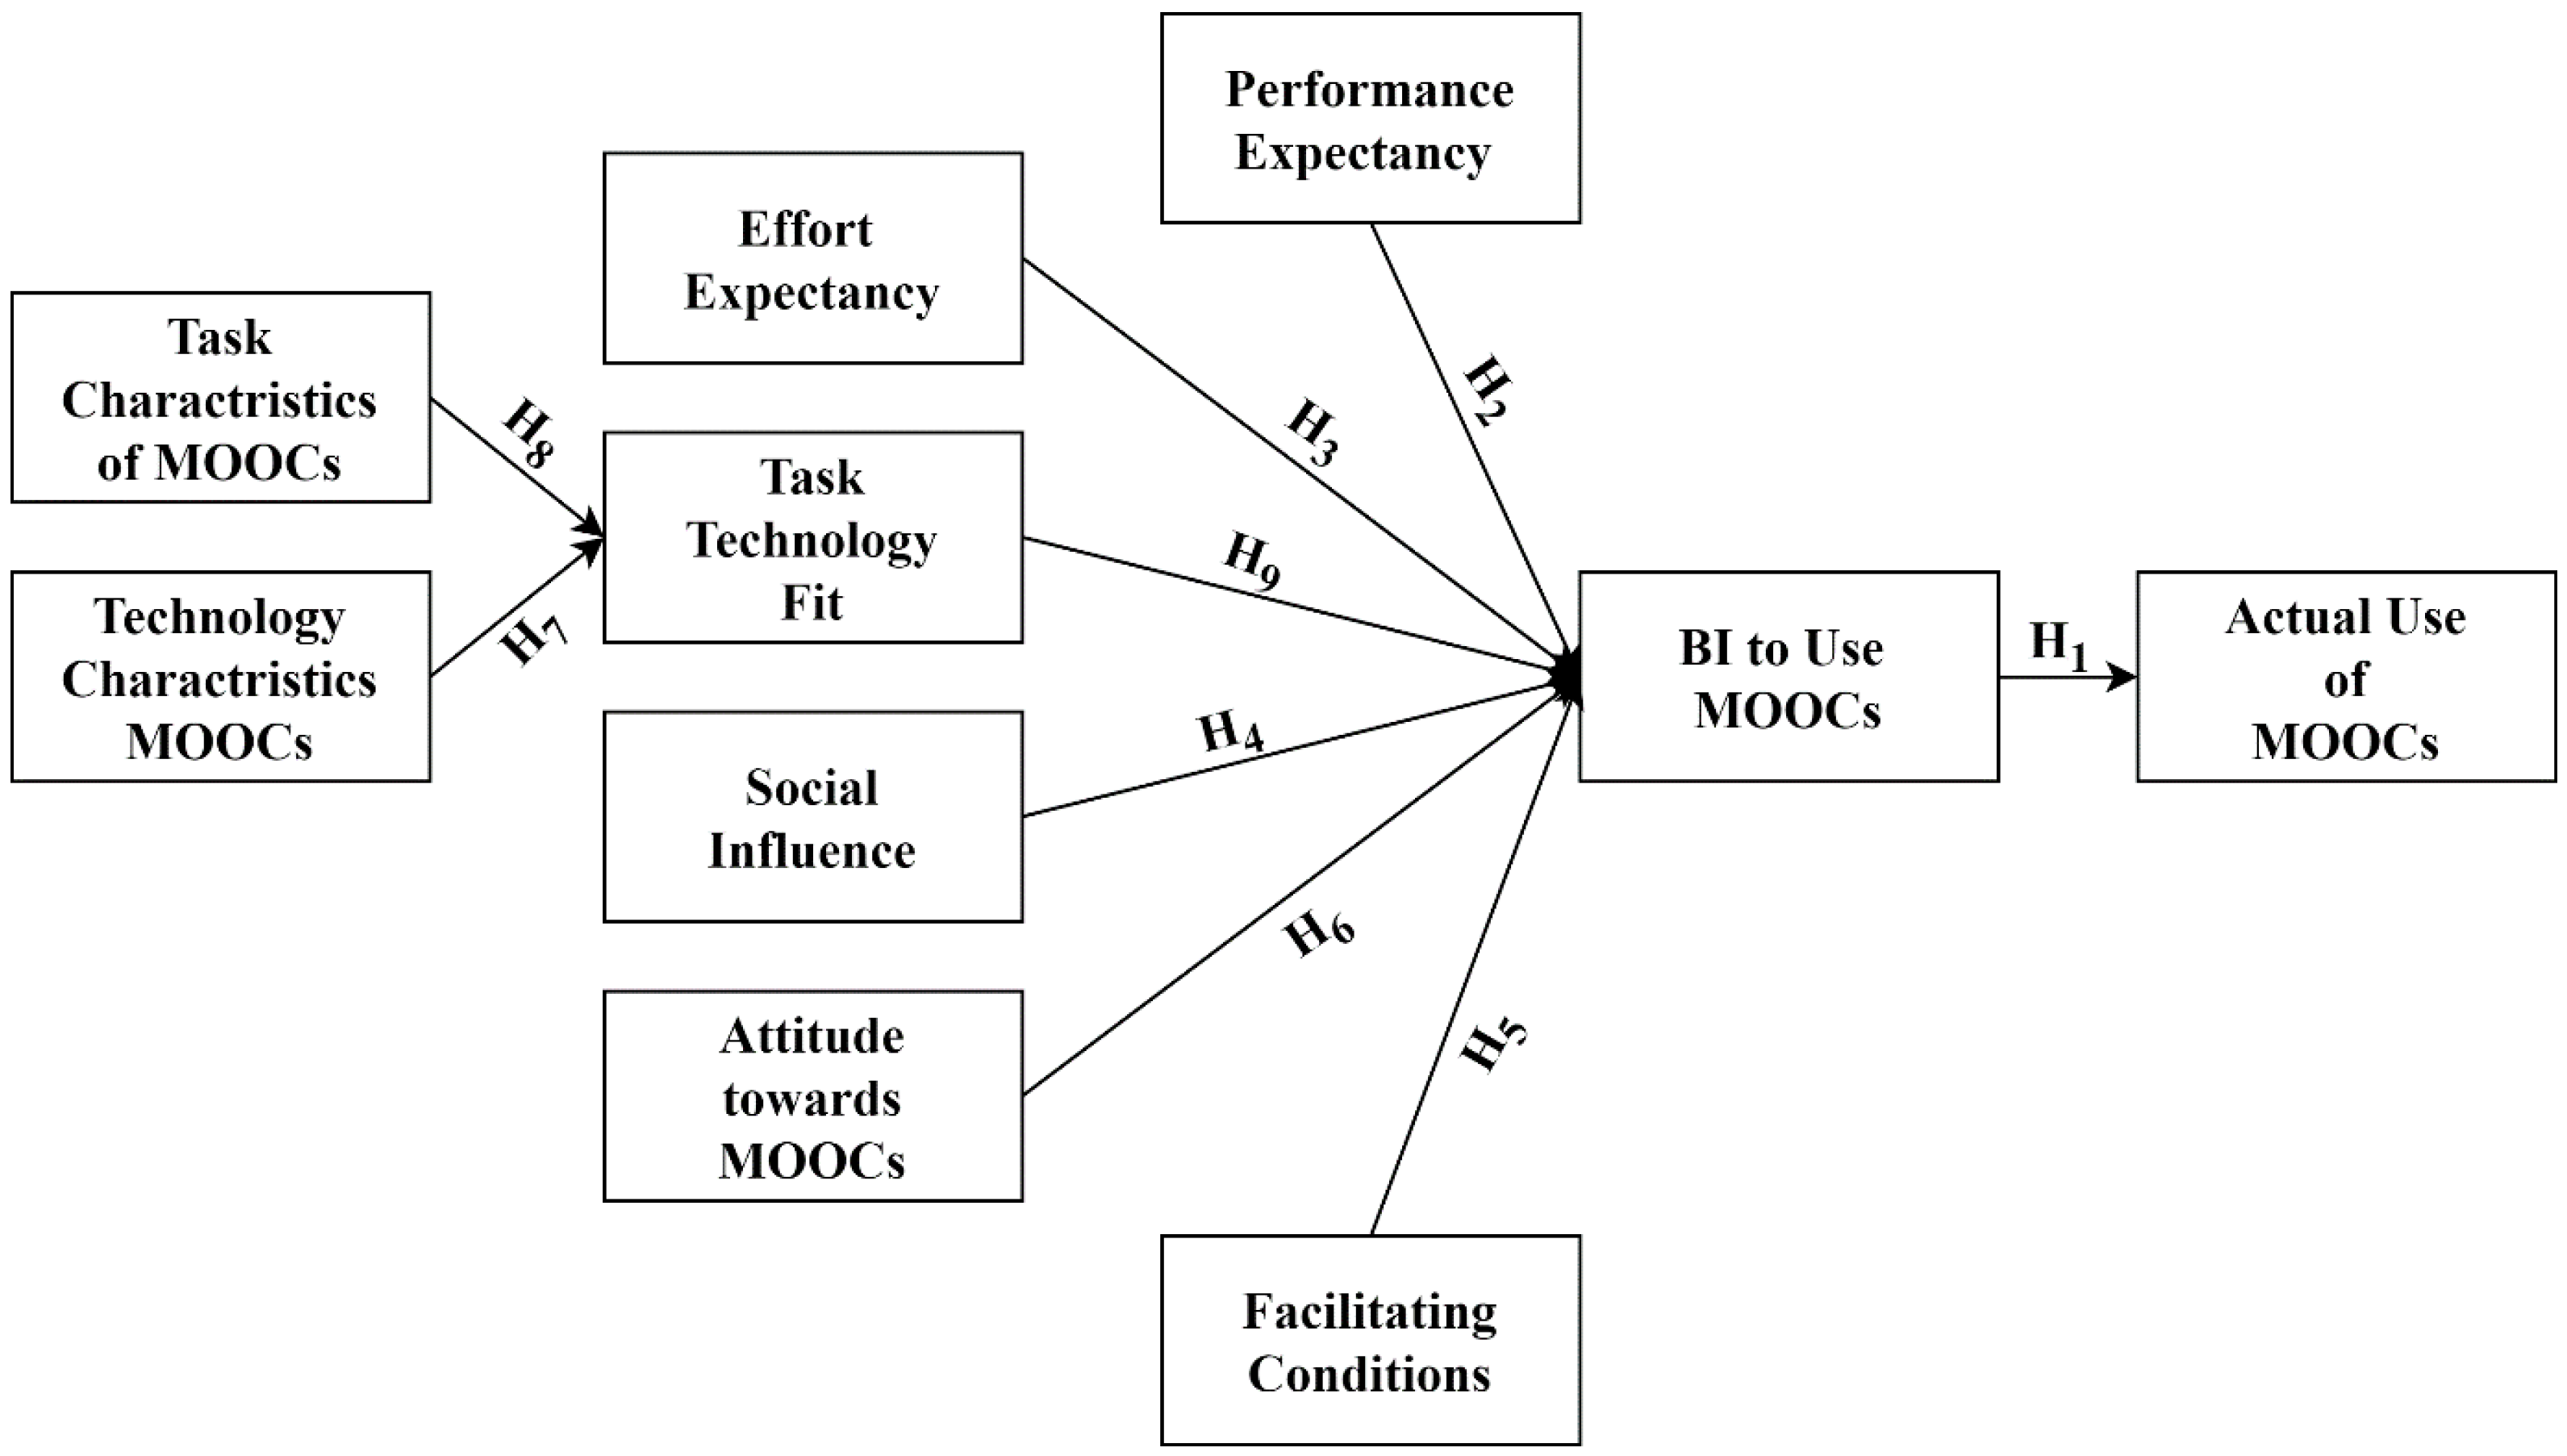
2.5. Research Model and Hypotheses

The TPB, UTAUT, and TTF are three prominent models in the ISs sector that focus on the distinct component of IT adoption. Academics, on the other hand, rarely incorporate the TTF, TPB, and UTAUT into a single model. This paper argues that TTF and user’s perception of technology, when paired with ATT, affect the user’s decision to accept MOOCs. On this basis, TTF has been incorporated into the suggested model. On top of that, numerous surveys have suggested that UTAUT might be used with other models, such as TTF, to account for MOOC user acceptance [27]. The authors discovered that, when TTF and UTAUT are combined, the resulting model reveals a more in-depth explanation of adoption intention compared to the separate utilization of UTAUT. Users will not adopt a technology if the TTF is not satisfied [6,28]. Similarly, if MOOCs are unable to match the objectives of the tasks, users are more likely to avoid them. Thus, the TTF model provides a theoretical foundation for evaluating TEC and TAC in these courses.
On the other hand, TAM is excluded from this model because it does not give enough insight into users’ perceptions of new technologies, overlooks the link between user attitude and intention, and, instead, directly examines the external factors of perceived ease of use and perceived usefulness [29,30]. More specifically, two of its constructs are similar to UTAUT constructs. Perceived ease of use, for example, can be mapped to effort expectancy (EE), whereas perceived usefulness can be mapped to performance expectancy (PE) [19,31]. Although more research was called for in view of the importance of subjective norm, e.g., [32], the original TAM omitted this aspect. Acknowledging the aim of the study and the related literature, this study used TPB, UTAUT, and TTF, consisting of ten variables: ATT, PE, EE, social influence (SI), facilitating condition (FC), TAC, TEC, TTF, BI, and actual use (AU) of MOOCs. The study also includes gender and age as moderating variables (see Figure 4).

2.5.1. Behavioral Intention and Actual Use of MOOCs

According to Ajzen [33] and Venkatesh [34], BI is defined as a person’s intention to follow and utilize a certain tool in the near future. As stated by Alalwan [35], most technology adoption studies employed BI to forecast IT adoption. According to Ajzen [33], BI is also perceived as having a direct influence on adoption. In the MOOCs adoption literature, studies have shown that the BI to use these courses has a strong effect on the actual use of these courses [21,36]. Thus, this study proposes the following hypothesis:
Hypothesis 1 (H1).
Behavioral intention (BI) to continue use MOOCs positively impacts the actual use of MOOCs.

2.5.2. The Effects of UTAUT Constructs on Behavioral Intention

The UTAUT model consists of four original core constructs: PE, EE, SI, and FC. PE is described as an individual’s belief that using MOOCs will help him or her achieve performance improvements. EE is defined as the degree of ease associated with the use of MOOCs. Both PE and EE are regarded as crucial determinants of use intention in the UTAUT model, especially in the early stages, while processing a new behavior [37]. PE has been found to influence MOOC usage intention in several studies [13]. An empirical study conducted by Karels [38] also shows that EE is a factor that promoted MOOCs adoption. Ease of access/download, flexibility of the software, and 24-h online presence are important factors that influence MOOC usage intention [39]. Based on the above-mentioned literature, the following hypotheses are developed:
Hypothesis 2 (H2).
Performance expectancy (PE) positively impacts user’s intention to continue using MOOCs.
Hypothesis 3 (H3).
Effort expectancy (EE) positively impacts user’s intention to continue using MOOCs.
The degree to which a person perceives that other people believe that he or she should use MOOCs is described as SI. Subjective norms represent the part of TPB that reflects SI [40]. Several studies have suggested that SI has an influence on MOOC usage intention [41,42]. Finally, FC is one’s belief that there is enough technical and non-technical support from an institution to enable system use [19]. FC is similar to the PBC construct of TPB since it reflects the impact of a user’s knowledge, competence, and resources [19]. FC was employed as a proxy variable for PBC in this case, which may have introduced undesirable variance into the outcome, resulting in insignificant correlations between FC and BI to utilize MOOCs [43]. As a result, FC takes the place of PBC in the model. Furthermore, studies conducted by Amid and Din [44], as well as Mulik [41], show that the FC variable influences MOOC usage intention. The current study, therefore, proposes the following hypotheses:
Hypothesis 4 (H4).
Social influence (SI) positively impacts user’s intention to continue using MOOCs.
Hypothesis 5 (H5).
Facilitating condition (FC) positively impacts user’s intention to continue using MOOCs.

2.5.3. Attitude towards MOOCs and Behavioral Intention

In the TPB, ATT has a relevant effect on BI [5,32]. ATT, in the context of technology, is defined as one’s favorable or negative assessment of the entrance of new types of technology into any setting [45]. According to Ab Jalil’s [46], there is a substantial positive association between university students’ ATT regarding MOOCs and their BI to design MOOCs. Most respondents had a positive ATT about using MOOC platforms, according to Al-rahmi [47], showing that MOOCs are thought to be effective in improving conceptual understanding during the teaching and learning process. Thus, in the current study, the following hypothesis is proposed:
Hypothesis 6 (H6).
User’s attitude (ATT) towards MOOCs positively influences user’s intention to continue using MOOCs.

2.5.4. The Effects of TTF Constructs on Behavioral Intention

Task-Technology Fit indicates how technological capabilities meet the tasks that individuals execute, highlighting task and technology characteristics as two basic components for determining Task-Technology Fit. Tasks are defined as the actions taken to convert some inputs into useful outputs to meet human requirements, while technology is defined as the mix of user support and information technology, such as software, equipment, and data [48]. The Task-Technology Fit—which impacts user usage and performance—is influenced by both types of characteristics: namely, task and technology [49]. The TTF model has been frequently employed in the MOOCs environment since its introduction [50]. Based on these arguments, we hypothesized that:
Hypothesis 7 (H7).
Technology characteristics (TEC) of MOOCs positively impact Task-Technology Fit (TTF).
Hypothesis 8 (H8).
Task characteristics (TAC) positively impact the Task-Technology Fit (TTF).
According to TTF, people will not accept a technology if the Task-Technology Fit is not met. Similarly, users are less inclined to use MOOCs if they fail to satisfy the needs of their tasks. Previous research has found a link between TTF and the behavioral intention to use these courses [50]. Following these findings, we hypothesized that:
Hypothesis 9 (H9).
Task-Technology Fit (TTF) positively impacts a user’s intention to continue using MOOCs.

2.6. Potential Moderators

This study looks at the impact of four categorical moderators (age, gender, sample size, and culture) on each of the nine causal links in the suggested research model. Uncovering the moderating roles of gender, age, sample size, and culture in empirical research on MOOCs adoption is critical, as it reveals whether these moderators’ influence variations in a certain model effects sizes. Within the MOOCs literature, some researchers, e.g., [38], used small samples (e.g., n = 141), while others [51] relied on big samples (e.g., n = 854). Several studies [52] were set in Asian cultures, while others [38] examined MOOCs’ adoption in non-Asian cultures (e.g., The Netherlands).
In addition, several studies have already recognized the value and importance of examining age and gender disparities in MOOCs’ acceptance [53]. There is extensive evidence that suggests that gender identity (related gender roles) and age categories [54] can contribute to significant disparities in e-learning between males and females, as well as between young and old users [55]. According to Van Dijk [56], disparity is the outcome of categorical inequalities in society, which leads to unequal access to digital technologies. Furthermore, gender disparity is common in these courses, according to Ho [57]. Although females are usually underrepresented in MOOCs participation, it is unclear if this varies by country and, if so, how. MOOCs participants are a very diverse mix of people of various ages. Morris [58], on the other hand, discovered that students who use MOOCs are more likely to be adults. Based on the above survey of the literature, it’s crucial to figure out whether disparities in direction and intensity among effect sizes are caused by sample size, culture, age, or gender.

3. Materials and Methods

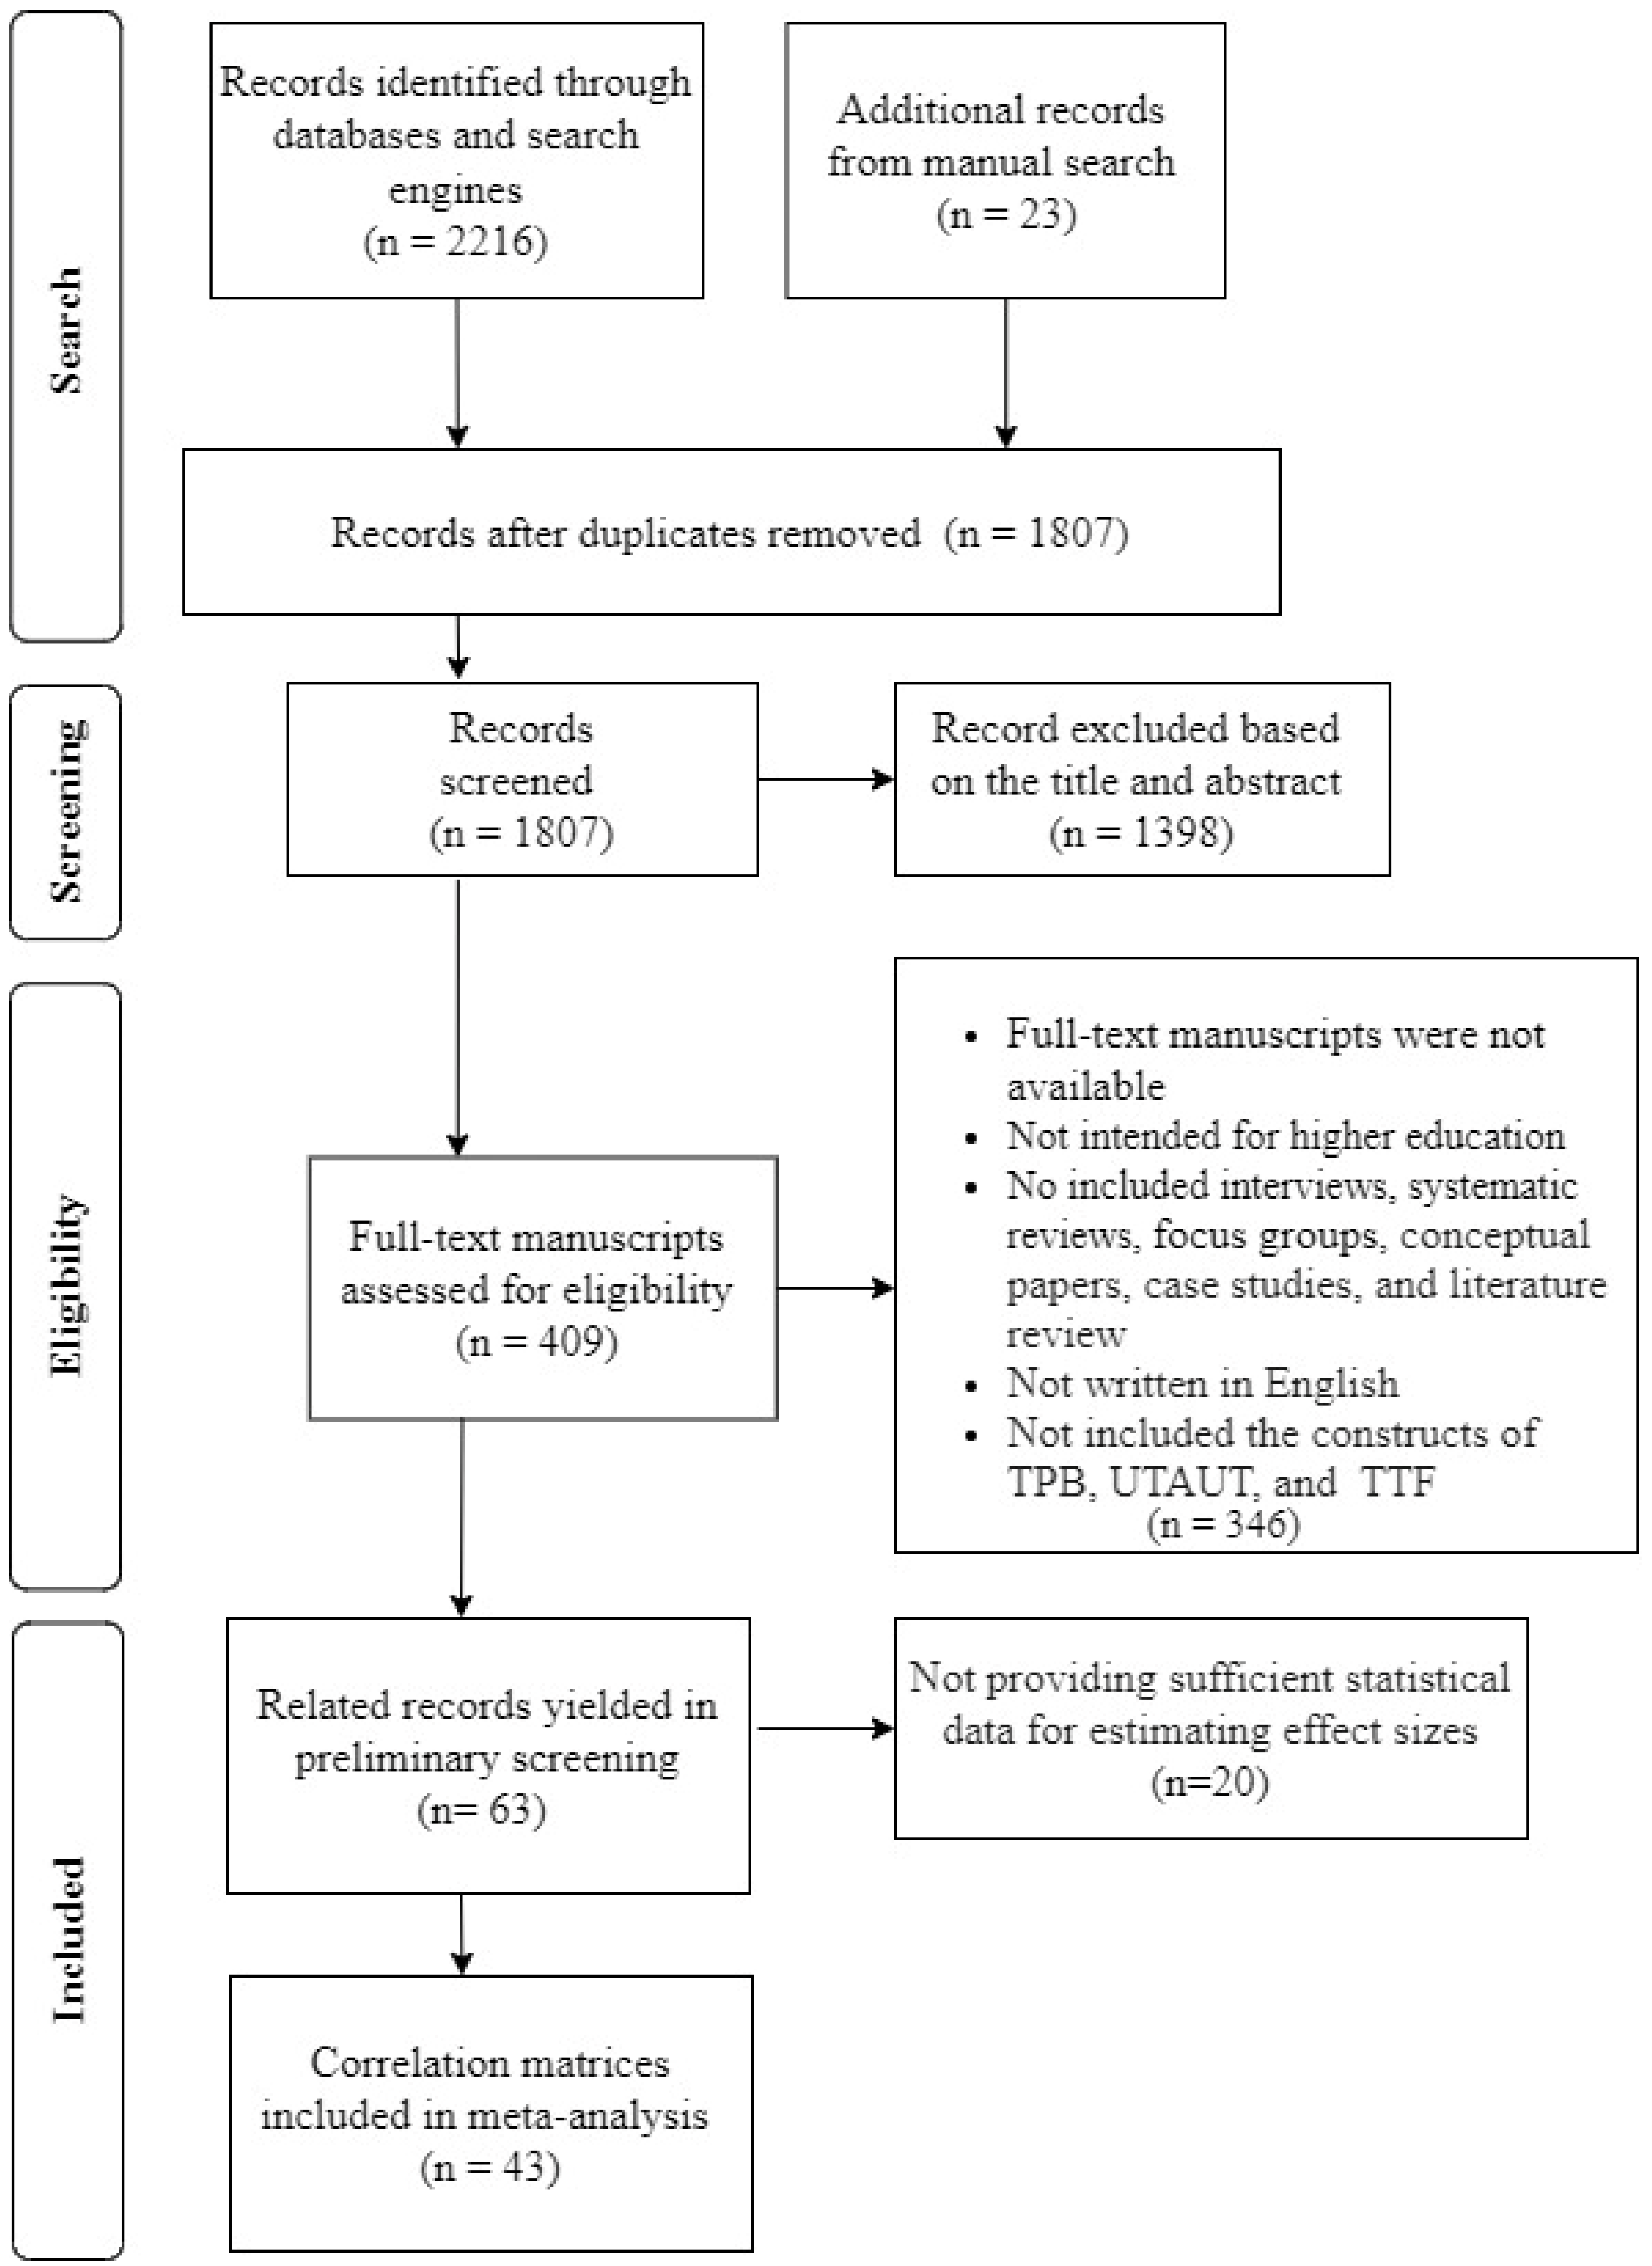
3.1. Study Selection

Preferred Reporting Items for Systematic Reviews and Meta Analyses (PRISMA) criteria were used to present the current study findings [59].

3.2. Eligible Studies for Inclusion

The selected publications were screened based on the following criteria: (1) studies were considered if they assessed academics/university students’ willingness to adopt/accept MOOCs; (2) quantitative studies were included if they applied the TPB, UTAUT, and TTF constructs; (3) studies were included if the results were presented in English; (4) studies were only included if they were published in peer-reviewed journals, book chapters, conference papers, theses (Ph.D. and Master), and working papers; (5) correlation coefficients of the variables of interest, or any data that may be transformed into a correlation coefficient, such as t-values, p-values, or Fisher’s Z, are reported in research; (6) the study was conducted in a higher education setting. Nonetheless, to ensure that all relevant publications were examined, the authors did not limit the scope of this evaluation by any fixed criteria.

3.3. Search Strategy

Two authors independently searched ERIC, ACM Library, IEEEXplore, Google Scholar, DOJA, ProQuest, PsycInfo, ScienceDirect, and Scopus from the inception of the study to 16 April 2021. The following keywords were used: “TPB” OR “UTAUT” OR “TTF” OR “performance expectancy” OR “effort expectancy” OR “social influence” OR “facilitating conditions” OR “attitude” OR “Task-Technology Fit” OR “task characteristics” OR “technology characteristics” were used for “academics” OR “students” OR “higher education/university/college”. The terms were searched (individually, systematically, and concurrently) using search functions specific to each database (e.g., asterisk, quotation mark) in conjunction with the Boolean “AND” operator with “MOOCs adoption” OR “MOOCs acceptance”. A manual search was also conducted on the reference lists from all of the papers chosen. On top of that, full-text reviews and pertinent reviews were also carried out.

3.4. Study Selection and Data Collection Process

The same authors evaluated the filtered studies, starting with their titles and abstracts. The full texts of possibly qualified studies were then obtained. Only the research with greater sample sizes were included when duplication occurred [60]. Two authors (1st and 3rd authors) conducted data extraction independently. In addition to the correlation of the constructs, these authors classified each study by author name, year and publication type, country, mean and standard deviation of measurements, age, gender, and sample characteristics.

4. Data Analysis

This study follows Borenstein’s [61] guidelines for conducting and publishing meta-analyses to minimize typical pitfalls. To compute pooled effect sizes, the third version of Comprehensive Meta-Analysis software (CMA-3) was employed, and a random-effects model was applied to ensure data generalizability to comparable studies [61]. Mukaka [62] proposed the following cutoff points: 0.00 < r < 0.30 indicates negligible correlation, 0.30 < r < 0.50 indicates low correlation, 0.50 < r < 0.70 indicates moderate correlation, 0.70 < r < 0.90 indicates high correlation, and 0.90 < r < 1.00 indicates very high correlation. The relationships found were interpreted using these cutoffs.
Furthermore, the study analyzed zero-order correlations, corrected for sampling error (r+), using a random-effects meta-analysis model since all included studies were regarded as samples from a diverse population. Furthermore, all included studies were subjected to heterogeneity testing (Q and I2 statistics). Besides that, the I-squared (I2) and significant Q-values revealed a diverse distribution, indicating the necessity for moderator analysis. To estimate the effect of age, gender, sample size, and culture as potential moderators for each of the causal paths in the model, a subgroup analysis was conducted.
MASEM was utilized to analyze the model after obtaining meta-analytic correlation matrices. This was carried out using the AMOS 26.0 software (Armonk, NY, USA). The critical ratios (CRs) were used to determine the relevance of model paths [63], and the modification indices (MIs) were used to determine the presence of unexpected paths [64]. When CRs were less than the required limit of greater than 1.96, the non-significant routes were removed from the model [63].

5. Results

5.1. Selection and Inclusion of Studies

As a PRISMA chart, Figure 5 demonstrates the selection and inclusion of research. Following the removal of duplicated research, two authors reviewed the titles and abstracts of 2239 papers for a primary assessment. This preliminary screening yielded 63 publications, which were further screened based on inclusion and exclusion criteria, such as study results, accessibility, sample composition (academics and university students), usage of the TPB, UTAUT, and TTF constructs, reporting p-values, correlation coefficients, T-statistics, and sample size. At this stage, 43 studies (k = 45) were included in the analysis.

5.2. Publication Bias Assessment

Publication bias—also referred to as the ‘file drawer problem’—relates to the possibility of unpublished studies that were not retrievable and excluded in the meta-analysis [65]. Hence, the Egger test and fail-safe N were used to alleviate this problem. The results obtained demonstrated that the fail-safe N was substantial for each effect size, indicating that there was no evidence of publication bias, according to the ad hoc rule (fail-safe N should be over 5k + 10). For instance, in this meta-analysis of the relationship between EE and BI in utilizing MOOCs, the fail-safe N value was 4694, meaning that the current meta-findings analysis might be invalidated if 4694 studies were found to be non-significant. Additionally, Egger’s test was applied to examine potential publication bias. The p-values were all over 0.05, indicating that there was no proof of any publication bias.

5.3. Study Characteristics

The 43 included studies (45 samples, n = 16774) were published between 2016 and 2022. The study included three theses, one conference proceedings paper, and 37 journal publications that met the study’s requirements. In terms of study origin, they comprise studies from 16 nations, with the majority of them conducted in China (k = 11). The sample sizes ranged between 111 and 1148 respondents (Table 1).

5.4. Weight Analysis

Univariate and multivariate weightings were used in synthesizing matrices. With univariate weighting, each association is treated independently, and each factor is pooled separately across studies. As univariate weighting techniques, univariate-r and univariate-z were utilized (Table 2). Since the CI did not include zero, the findings suggested that all the average weighted correlations were very different from the zero values. BI, to utilize MOOCs, showed a low correlation with PE (0.454), SI (r+ = 0.391), EE (r+ = 0.381), FC (r+ = 0.343), and ATT (r+ = 0.452), according to several research works. TTF was substantially linked to both the TAC and TEC of MOOCs (r+ = 0.492 and 0.493, respectively). Additionally, the correlation between BI to participate in these courses and the actual participation in these courses was significant and moderate (r+ = 0.645). The results show that the actual MOOCs usage and its antecedents have low and moderate levels of correlation.
The variance–covariance matrices were then used to weight correlations in the synthesis of correlation matrices across studies for multivariate weighting [94]. In the correlation matrix, a minimum of two associations for each cell of the matrix were used, as was common in the MASEM analysis [95]. The results of the meta-analysis were incorporated into a correlation matrix based on the average weighted sample size, which served as the foundation for the path analyses (Table 3).

5.5. Moderator Analysis

The Q-test for heterogeneity shows that all Q-values are statistically significant, at p < 0.001, for each of the nine causal paths under investigation (Table 2). Furthermore, the findings demonstrate that genuine heterogeneity accounts for more than 75% of the overall diversity across beta-based impact estimates (I2 > 75%). Thus, we find support for a substantial level of variability among MOOCs studies using these two assessments, indicating the presence of possible moderating factors [96]. In the absence of a sufficient number of studies to do the moderator analysis (k = 10), this analysis was omitted [97] between TAC-TTF, TEC-TTF, TTF-BI, and BI-AU.
Only three significant moderating effects were found in the subgroup analysis, as shown in Table 4, Table 5, Table 6 and Table 7. Table 4 revealed that the moderating effect of sample size on the association between FC and BI had a significant Q value (Q = 22.114; p < 0.001). This data implies that the FC–BI relationship is moderated by sample size. This association was particularly significant in studies with high sample sizes (βLarge = 0.464; p < 0.001) compared to studies with small sample sizes (βSmall = 0.336; p < 0.01). Table 7 showed that culture did not significantly moderate the causal relationships. However, researchers discovered that in some associations—such as FC-BI, EE-BI, and ATT-BI—the Asian subgroup’s mean path coefficient was higher than the non-Asian’s.
The Q statistic indicating the moderating influence of gender on the connection between ATT and BI is statistically significant, according to Table 5 (Q = 24.907; p < 0.001). These findings support the idea that gender has a moderating effect on the ATT–BI relationship. Precisely, this association is stronger for female (βfemale = 0.387; p < 0.001) vis-à-vis male (βmale = 0.353; p < 0.001). Finally, the findings revealed a significant Q statistic for age’s moderating influence on the link between SI and BI (Q = 19.847; p < 0.001). This finding implies that the SI-BI relationship is moderated by age. Precisely, this association is stronger for MOOCs users with an age below 24 years old (β > 24 years = 0.413; p < 0.001) when compared with MOOCs users with an age above 24 years old (β > 24 years = 0.153; p < 0.001).

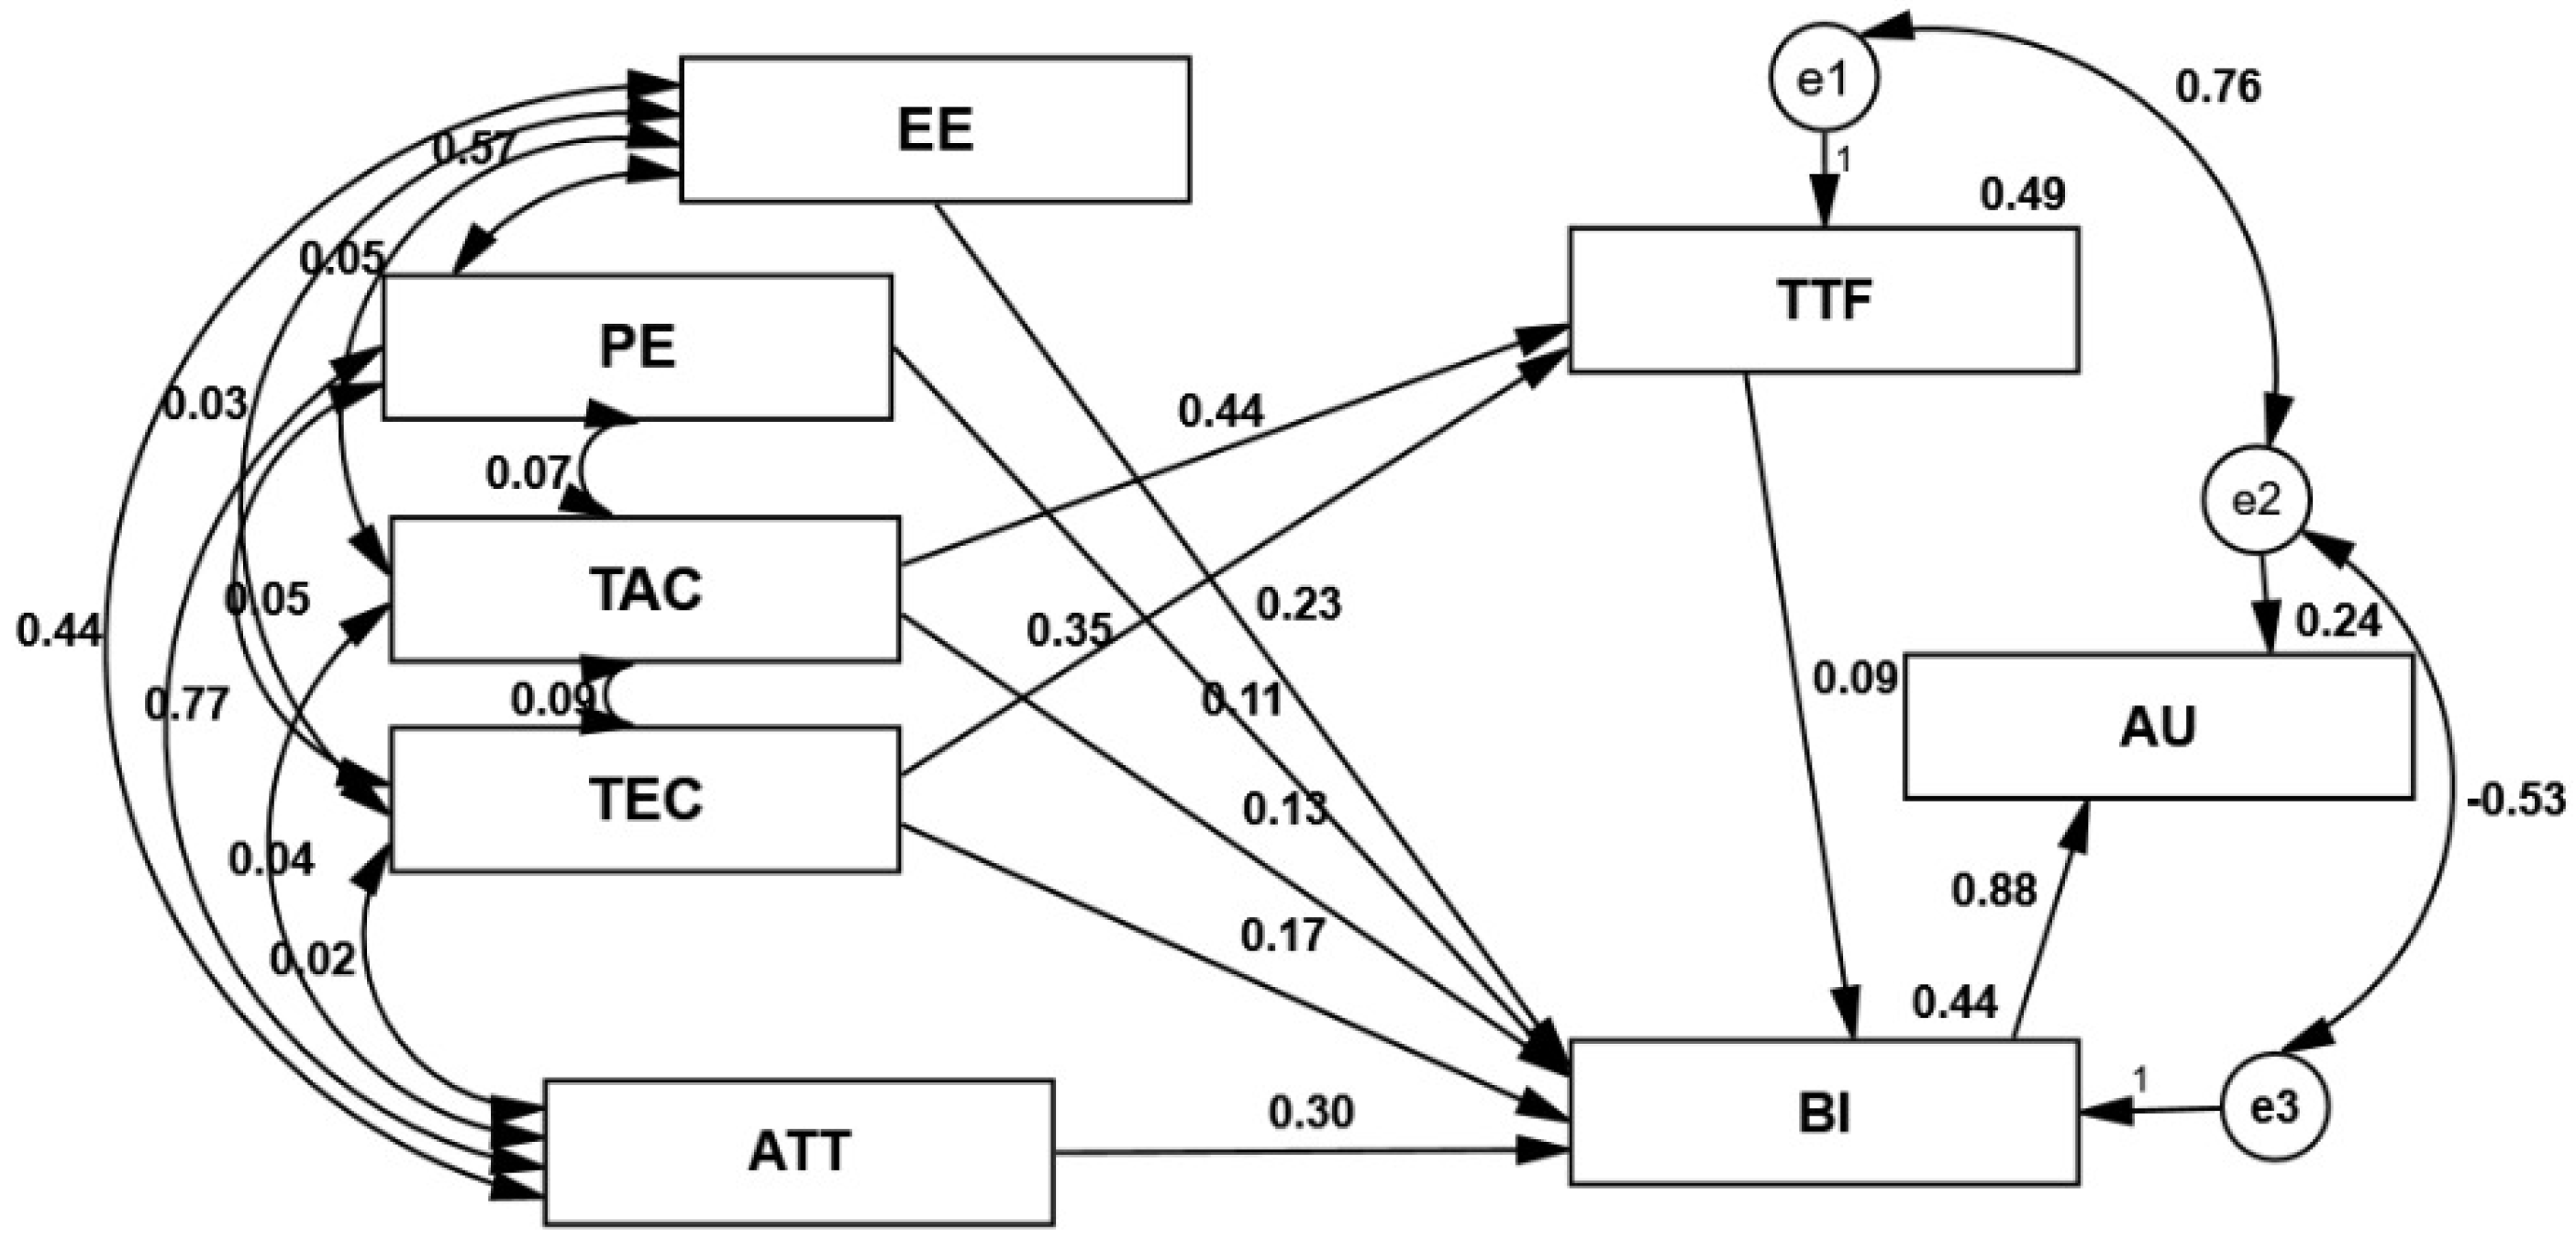
5.6. Meta-Analytic Findings

The present study performed MASEM to assess hypotheses 1 to 9. This research began with a completely unconstrained model that included all possible direct associations. Apart from that, the study incorporates a proposed covariance between the error terms for TTF, BI, and AU, based on an analysis of the fit indices. The model fit was also examined using the Chi-square (χ2) goodness of fit, the root mean square error of approximation (RMSEA), the normed fit index (NFI), as well as the comparative fit index (CFI). When the CFI and NFI are greater than 0.90, the model is considered to be a good fit [98]. A lower RMSEA indicates a better fit, with scores less than 0.05 indicating a greater fit and scores between 0.05 and 0.08 indicating a reasonable fit [99]. However, the resulting path model fit the data poorly in this study: χ2 (11) = 2244.857, p = 0.001, CFI = 0.864, GFI = 0.835, RMSEA = 0.366, and NFI = 0.864. All direct relationships involving TTF and AU were positive and statistically significant in the model. FC and SI were not significant predictors of BI. EE, PE, and ATT were significant positive predictors of BI. Combined, the predictors accounted for 49%, 82%, and 67.1% of the variance in TTF, BI, and AU, respectively.
The new model was constructed using the findings from the previous proposed model and the MIs. Based on the results of the first model, we trimmed the two negative relationships—SI on BI and FC on BI—since they did not support Hypotheses 4 and 5 and assessed the fit of this new model. However, the MIs revealed two surprising paths. Using the proposed model as a starting point, the paths provided by MIs were included where applicable. Firstly, the TAC-BI path was analyzed as containing the highest MIs (581.164) and was incorporated into the model. Secondly, the unexpected TEC-BI path was discovered as containing the second highest MIs (503.630) and was subsequently incorporated into the model. Although this relationship was not expected at the outset, it can be explained using earlier studies in diverse contexts. The inclusion of every unexpected path led to an incremental improvement in fit statistics: χ2 (7) = 1181.163, p = 0.001, SRMR = 0.066, CFI = 0.90, GFI = 0.907, RMSEA = 0.265, and IFI = 0.90. In the final model, all paths were statistically significant, with the predictors accounting for 49%, 24%, and 44% of the variance in TTF, AU, and BI, respectively (Figure 6).

6. Discussion and Implications

The MASEM approach is a method for analyzing quantitative data. It was used to incorporate the UTAUT, TTF, and TPB, in terms of their abilities, to investigate MOOCs’ adoption in HE. Although the results of previous studies recommended several determinants of learner engagement in MOOCs platforms, the meta-analytic results made several implications to the extant literature. First, the research findings established the model’s applicability and validity, in the context of MOOCs, by providing cumulative insights from earlier empirical research. Secondly, this study has proven that the combined model proposed—consisting of TPB, UTAUT, and TTF—is capable of explaining MOOCs’ adoption, in the context of HE, using BI. The model’s application provides a well-developed theoretical foundation, as well as robust, testable predictions applicable for multiple fields. Thirdly, this model directs future research aimed at further developing theoretical explanations. It also suggests that future research should focus on this integrated model to reduce the number of alternative intention models. Fourthly, our study has revealed certain associations not identified in the original UTAUT, TTF, and TPB models, and it has provided new insights into the intentions and behaviors of learners and educators regarding the decision to use MOOCs in higher education. Practically, the results of this study can also help in the development of best practices to assist lecturers in teaching and implementing innovative approaches that promote these courses to improve teaching and learning outcomes, as well as to serve as a guide for developing methodologies to adopt MOOCs in higher education.
The results of this study further reveal that seven out of nine hypotheses were significantly supported. It was discovered that PE and EE have substantial effects on BI, which is consistent with earlier UTAUT bodies of research [90,100]. However, this is inconsistent with an earlier report, which indicates that PE and EE have a non-significant effect on BI [101]. More precisely, this study established that PE is involved in the formation of BI (H1). This means that users will be more receptive to MOOCs if they believe that technology could enhance teaching and learning. It was also discovered that EE has a role in explaining BI in the context of MOOCs (H2). This implies that the easier it is for a MOOC service to learn and perform MOOCs-related tasks, the greater the proclivity to engage in the technology. In a similar way, this MASEM analysis has established that ATT is a critical variable for BI reinforcement (H6). This concurs with a previous study on university students’ intentions towards the usage of a cloud computing classroom, e.g., [100]. As a result, if an individual had a positive ATT about using MOOCs platforms, a high degree of adoption intention is formed. These MASEM findings demonstrate that, while analyzing the factors affecting MOOC users’ uptake, the UTAUT-based technology perceptions must not be considered in isolation but, rather, have to also take into account the impact of the TTF. Additionally, the findings indicated that TAC and TEC were both significant predictors of TTF, with technology attributes having a greater effect [102,103].
Two hypotheses, 4 and 5, were rejected, as SI and FC had no effect on the user’s intention to utilize MOOCs. Based on the results of the first model, the authors trimmed the two relationships: SI on BI and FC on BI. This finding contradicts several related studies reporting SN and FC as predictors of MOOCs adoption [8,75]. It is possible that the effect of SN, within a given culture, differs from country to country, rendering the effect of SN on intention to use MOOCs contextually different. The finding might also reflect learners’ and educators’ uncertainty regarding the availability of various software or hardware conditions that enable them to use MOOCs. Furthermore, two new pathways emerged from the analysis: namely, the TAC and TEC. These two had direct effects on the BI to continue to use MOOCs. It is proposed that the nature of the tasks performed by the users will dictate whether MOOCs are beneficial. D’Ambra [104], Dishaw and Strong [26], as well as Koo [105] discovered strong associations between TAC and technology use. The variable TAC was chosen as a factor that would potentially influence consumers’ utilization of MOOCs, based on the results of the MASEM analysis. Additionally, this study has established a positive relationship between TEC and user’s utilization of MOOCs. TEC reflects the characteristics of MOOCs that are relevant for task completion. TEC has been shown to influence a system’s usefulness, ease of learning, accuracy, adaptability, and dependability [106]. Integrating TEC with task characteristics can aid in determining the technology’s best fit for the activity. D’Ambra [104], Hollingsworth [107], as well as Koo [105] have discovered that substantial correlations exist between TEC and technology adoption.
Finally, the meta-analysis concluded that the moderator analysis supported the variance effects of the integrated framework’s constructs on the actual MOOCs usage. The analysis of the type of sample size—acting as a moderator—offers insight into the effect sizes and resultant findings. Age was identified as a significant moderating role in a user’s decision to use ICT [19,22]. Despite being the primary predictor across all age brackets, the SI and ATT appeared to have greater effects on youths than on adults. The other predictors exhibited an opposite pattern. Gender has been extensively researched as a key demographic factor influencing ICT adoption [19,22]. Additionally, the findings revealed that ATT is more predictive of females than of males. Our findings corroborate prior research on the impact of age and gender on technology acceptance [108,109].

7. Conclusions and Directions for Future Studies

In conclusion, TPB, UTAUT, and TTF, were integrated into the revised model for determining MOOCs acceptance and usage in HE. The revised model explained 42% of variance in actual MOOC usage, 52.6% of variance in BI to use MOOCs, and 33% of variance in TTF. According to the MASEM analysis, user’s perception (PE, EE, ATT, TAC, and TEC) can positively influence BI’s willingness to use MOOCs. Additionally, TAC and TEC were strong predictors of TTF. The findings indicated that the model recommended in this study can be applied effectively to comprehend the effects of BI and a user’s behavior in the MOOC context. The fact that the model is applicable for both academics and students suggests its generalizability across these sub-samples and, therefore, points to its relevance for both student education and academic professional development.
Additionally, this research contains four limitations that should be considered in future studies. Firstly, the meta-analysis is limited to empirical studies on MOOCs. As such, it may be beneficial to investigate the distinctions between various types of e-learning platforms. Secondly, future studies might assess other models’ abilities to explain the acceptance of MOOCs in HE. Thirdly, this study has omitted the two moderators observed in the original UTAUT model (experience and voluntariness) [19]. This is mainly because previous studies did not analyze or report on those factors. The current study was limited to examining only those relations and moderators (age and gender) that were previously researched. Hence, future studies should focus on specific moderators. Finally, the integrated model provided additional empirical support for the inclusion of the UTAUT, TTF, and TPB components. Another important area for future MASEM studies is to evaluate the three models’ strengths in the context of HE.

Author Contributions

Conceptualization, Z.Z. and H.A.J.; methodology, Z.Z. and S.R.; software, Z.Z. and Z.M.; validation, S.R., I.A.I. and Z.Z.; formal analysis, Z.Z.; investigation, Z.Z.; resources, Z.M. and S.A.; data curation, S.R.; writing—original draft preparation, Z.Z. and S.R.; writing—review and editing, Z.Z.; visualization, I.A.I. and S.A.; supervision, S.R.; project administration, S.R.; funding acquisition, S.R. and Z.M. All authors have read and agreed to the published version of the manuscript.

Funding

This research received no external funding.

Institutional Review Board Statement

Not applicable.

Informed Consent Statement

Not applicable.

Data Availability Statement

Not applicable.

Conflicts of Interest

The authors declare no conflict of interest.

References

  1. Santandreu Calonge, D.; Aman Shah, M. MOOCs, Graduate Skills Gaps, and Employability: A Qualitative Systematic Review of the Literature. Int. Rev. Res. Open Distrib. Learn. IRRODL 2016, 17, 67–90. [Google Scholar] [CrossRef]
  2. Tirthali, D. Are MOOCs Sustainable? In From Books to MOOCs; Portland Press Limited: London, UK, 2016; pp. 115–123. [Google Scholar]
  3. Koukis, N.; Jimoyiannis, A. MOOCS for Teacher Professional Development: Exploring Teachers’ Perceptions and Achievements. Interact. Technol. Smart Educ. 2019, 16, 74–91. [Google Scholar] [CrossRef]
  4. Tao, D.; Fu, P.; Wang, Y.; Zhang, T.; Qu, X. Key Characteristics in Designing Massive Open Online Courses (MOOCs) for User Acceptance: An Application of the Extended Technology Acceptance Model. Interact. Learn. Environ. 2022, 30, 882–895. [Google Scholar] [CrossRef]
  5. Ajzen, I. The Theory of Planned Behavior. Organ. Behav. Hum. Decis. Process. 1991, 50, 179–211. [Google Scholar] [CrossRef]
  6. Goodhue, D.L. Understanding User Evaluations of Information Systems. Manag. Sci. 1995, 41, 1827–1844. [Google Scholar] [CrossRef]
  7. Junglas, I.; Abraham, C.; Watson, R.T. Task-Technology Fit for Mobile Locatable Information Systems. Decis. Support Syst. 2008, 45, 1046–1057. [Google Scholar] [CrossRef]
  8. Li, Y.; Zhao, M. A Study on the Influencing Factors of Continued Intention to Use MOOCs: UTAUT Model and CCC Moderating Effect. Front. Psychol. 2021, 12, 528259. [Google Scholar] [CrossRef] [PubMed]
  9. Alyoussef, I.Y. Massive Open Online Course (MOOCs) Acceptance: The Role of Task-Technology Fit (TTF) for Higher Education Sustainability. Sustainability 2021, 13, 7374. [Google Scholar] [CrossRef]
  10. Lambert, S.R. Do MOOCs Contribute to Student Equity and Social Inclusion? A Systematic Review 2014–2018. Comput. Educ. 2020, 145, 103693. [Google Scholar] [CrossRef]
  11. Wong, J.; Baars, M.; Davis, D.; Van Der Zee, T.; Houben, G.-J.; Paas, F. Supporting Self-Regulated Learning in Online Learning Environments and MOOCs: A Systematic Review. Int. J. Hum.-Comput. Interact. 2019, 35, 356–373. [Google Scholar] [CrossRef]
  12. Zhu, M.; Sari, A.; Lee, M.M. A Systematic Review of Research Methods and Topics of the Empirical MOOC Literature (2014–2016). Internet High. Educ. 2018, 37, 31–39. [Google Scholar] [CrossRef]
  13. Fianu, E.; Blewett, C.; Ampong, G.O. Toward the Development of a Model of Student Usage of MOOCs. Educ. Train. 2020, 62, 521–541. [Google Scholar] [CrossRef]
  14. Robinson, A.C.; Kerski, J.; Long, E.C.; Luo, H.; DiBiase, D.; Lee, A. Maps and the Geospatial Revolution: Teaching a Massive Open Online Course (MOOC) in Geography. J. Geogr. High. Educ. 2015, 39, 65–82. [Google Scholar] [CrossRef]
  15. Gamage, D.; Staubitz, T.; Whiting, M. Peer Assessment in MOOCs: Systematic Literature Review. Distance Educ. 2021, 42, 268–289. [Google Scholar] [CrossRef]
  16. McLoughlin, C.E. The Pedagogy of Personalised Learning: Exemplars, MOOCS and Related Learning Theories. In Proceedings of the EdMedia 2013–World Conference on Educational Media and Technology, Victoria, BC, Canada, 24–28 June 2013; Association for the Advancement of Computing in Education (AACE): Waynesville, NC, USA, 2013; pp. 266–270. [Google Scholar]
  17. Gao, S.; Yang, Y. Exploring Users’ Adoption of MOOCs from the Perspective of the Institutional Theory. In Proceedings of the WHICEB 2015 Proceedings, Wuhan, China, 25 May 2015; Volume 26, pp. 282–290. [Google Scholar]
  18. Ajzen, I.; Fishbein, M. Understanding Attitudes and Predicting Social Behavior; Prentice-Hall: Englewood-Cliffs, NJ, USA, 1980. [Google Scholar]
  19. Venkatesh, V.; Morris, M.G.; Davis, G.B.; Davis, F.D. User Acceptance of Information Technology: Toward a Unified View. MIS Q. 2003, 27, 425–478. [Google Scholar] [CrossRef] [Green Version]
  20. Wang, Y.; Dong, C.; Zhang, X. Improving MOOC Learning Performance in China: An Analysis of Factors from the TAM and TPB. Comput. Appl. Eng. Educ. 2020, 28, 1421–1433. [Google Scholar] [CrossRef]
  21. Haron, H.; Hussin, S.; Yusof, A.R.M.; Samad, H.; Yusof, H. Implementation of the UTAUT Model to Understand the Technology Adoption of MOOC at Public Universities. In Proceedings of the IOP Conference Series: Materials Science and Engineering, Selangor, Malaysia, 25–26 June 2020; IOP Publishing: Bristol, UK, 2021; Volume 1062, pp. 1–8. [Google Scholar]
  22. Venkatesh, V.; Thong, J.Y.; Xu, X. Consumer Acceptance and Use of Information Technology: Extending the Unified Theory of Acceptance and Use of Technology. MIS Q. 2012, 36, 157–178. [Google Scholar] [CrossRef] [Green Version]
  23. Aljukhadar, M.; Senecal, S.; Nantel, J. Is More Always Better? Investigating the Task-Technology Fit Theory in an Online User Context. Inf. Manag. 2014, 51, 391–397. [Google Scholar] [CrossRef]
  24. Goodhue, D.L.; Thompson, R.L. Task-Technology Fit and Individual Performance. MIS Q. 1995, 19, 213–236. [Google Scholar] [CrossRef]
  25. Wu, B.; Chen, X. Continuance Intention to Use MOOCs: Integrating the Technology Acceptance Model (TAM) and Task Technology Fit (TTF) Model. Comput. Hum. Behav. 2017, 67, 221–232. [Google Scholar] [CrossRef]
  26. Dishaw, M.T.; Strong, D.M. Extending the Technology Acceptance Model with Task-Technology Fit Constructs. Inf. Manag. 1999, 36, 9–21. [Google Scholar] [CrossRef]
  27. Oliveira, T.; Faria, M.; Thomas, M.A.; Popovič, A. Extending the Understanding of Mobile Banking Adoption: When UTAUT Meets TTF and ITM. Int. J. Inf. Manag. 2014, 34, 689–703. [Google Scholar] [CrossRef]
  28. Gebauer, J.; Ginsburg, M. Exploring the Black Box of Task-Technology Fit. Commun. ACM 2009, 52, 130–135. [Google Scholar] [CrossRef]
  29. Almaiah, M.A.; Al Mulhem, A. Analysis of the Essential Factors Affecting of Intention to Use of Mobile Learning Applications: A Comparison between Universities Adopters and Non-Adopters. Educ. Inf. Technol. 2019, 24, 1433–1468. [Google Scholar] [CrossRef]
  30. Chao, C.-M. Factors Determining the Behavioral Intention to Use Mobile Learning: An Application and Extension of the UTAUT Model. Front. Psychol. 2019, 10, 1652. [Google Scholar] [CrossRef] [Green Version]
  31. Chen, L.; Aklikokou, A.K. Determinants of E-Government Adoption: Testing the Mediating Effects of Perceived Usefulness and Perceived Ease of Use. Int. J. Public Adm. 2020, 43, 850–865. [Google Scholar] [CrossRef]
  32. Davis, F.D.; Bagozzi, R.P.; Warshaw, P.R. User Acceptance of Computer Technology: A Comparison of Two Theoretical Models. Manag. Sci. 1989, 35, 982–1003. [Google Scholar] [CrossRef] [Green Version]
  33. Ajzen, I. The Theory of Planned Behaviour: Reactions and Reflections. Psychol. Health 2011, 26, 1113–1127. [Google Scholar] [CrossRef]
  34. Venkatesh, V.; Thong, J.Y.; Xu, X. Unified Theory of Acceptance and Use of Technology: A Synthesis and the Road Ahead. J. Assoc. Inf. Syst. 2016, 17, 328–376. [Google Scholar] [CrossRef]
  35. Alalwan, A.A.; Dwivedi, Y.K.; Rana, N.P.; Williams, M.D. Consumer Adoption of Mobile Banking in Jordan: Examining the Role of Usefulness, Ease of Use, Perceived Risk and Self-Efficacy. J. Enterp. Inf. Manag. 2016, 29, 118–139. [Google Scholar] [CrossRef]
  36. Chu, J.; Dai, Y.-Y. Extending the UTAUT Model to Study the Acceptance Behavior of MOOCs by University Students and the Moderating Roles of Free Time Management and Leisure-Study Conflict. Int. J. Technol. Hum. Interact. (IJTHI) 2021, 17, 35–57. [Google Scholar] [CrossRef]
  37. Im, I.; Hong, S.; Kang, M.S. An International Comparison of Technology Adoption: Testing the UTAUT Model. Inf. Manag. 2011, 48, 1–8. [Google Scholar] [CrossRef]
  38. Karels, M. An Empirical Study of Users’ Acceptance of MOOCs. Master’s Thesis, Universiteit van Amsterdam, Amsterdam, The Netherlands, 2018. [Google Scholar]
  39. Farrow, R.; de los Arcos, B.; Pitt, R.; Weller, M. Who Are the Open Learners? A Comparative Study Profiling Non-Formal Users of Open Educational Resources. EURODL (Eur. J. Open Distance E-Learn.) 2015, 18, 50–74. [Google Scholar] [CrossRef] [Green Version]
  40. Ajzen, I. Attitudes, Personality, and Behavior; Dorsey Press: Chicago, IL, USA, 1988. [Google Scholar]
  41. Mulik, S.; Srivastava, M.; Yajnik, N. Extending UTAUT Model to Examine MOOC Adoption. NMIMS Manag. Rev. 2018, 36, 26–44. [Google Scholar]
  42. Tseng, T.H.; Lin, S.; Wang, Y.-S.; Liu, H.-X. Investigating Teachers’ Adoption of MOOCs: The Perspective of UTAUT2. Interact. Learn. Environ. 2019, 30, 635–650. [Google Scholar] [CrossRef] [Green Version]
  43. Pavlou, P.A.; Fygenson, M. Understanding and Predicting Electronic Commerce Adoption: An Extension of the Theory of Planned Behavior. MIS Q. 2006, 30, 115–143. [Google Scholar] [CrossRef]
  44. Amid, A.; Din, R. Acceptance and Use of Massive Open Online Courses: Extending UTAUT2 with Personal Innovativeness. J. Pers. Learn. 2021, 4, 57–66. [Google Scholar]
  45. Huedo-Martínez, S.; Molina-Carmona, R.; Llorens-Largo, F. Study on the Attitude of Young People towards Technology. In International Conference on Learning and Collaboration Technologies; Zaphiris, P., Ioannou, A., Eds.; Springer: Cham, Switzerland, 2018; pp. 26–43. [Google Scholar]
  46. Ab Jalil, H.; Ma’rof, A.; Omar, R. Attitude and Behavioral Intention to Develop and Use MOOCs among Academics. Int. J. Emerg. Technol. Learn. (IJET) 2019, 14, 31–41. [Google Scholar] [CrossRef]
  47. Al-Rahmi, W.M.; Yahaya, N.; Alamri, M.M.; Alyoussef, I.Y.; Al-Rahmi, A.M.; Kamin, Y.B. Integrating Innovation Diffusion Theory with Technology Acceptance Model: Supporting Students’ Attitude towards Using a Massive Open Online Courses (MOOCs) Systems. Interact. Learn. Environ. 2021, 29, 1380–1392. [Google Scholar] [CrossRef]
  48. Lin, T.-C.; Huang, C.-C. Understanding Knowledge Management System Usage Antecedents: An Integration of Social Cognitive Theory and Task-Technology Fit. Inf. Manag. 2008, 45, 410–417. [Google Scholar] [CrossRef]
  49. Lee, C.-C.; Cheng, H.K.; Cheng, H.-H. An Empirical Study of Mobile Commerce in Insurance Industry: Task-Technology Fit and Individual Differences. Decis. Support Syst. 2007, 43, 95–110. [Google Scholar] [CrossRef]
  50. Khan, I.U.; Hameed, Z.; Yu, Y.; Islam, T.; Sheikh, Z.; Khan, S.U. Predicting the Acceptance of MOOCs in a Developing Country: Application of Task-Technology Fit Model, Social Motivation, and Self-Determination Theory. Telemat. Inform. 2018, 35, 964–978. [Google Scholar] [CrossRef]
  51. Chen, C.-C.; Lee, C.-H.; Hsiao, K.-L. Comparing the Determinants of Non-MOOC and MOOC Continuance Intention in Taiwan: Effects of Interactivity and Openness. Libr. Hi Tech 2018, 36, 705–719. [Google Scholar] [CrossRef]
  52. Azami, H.H.R.; Ibrahim, R. Investigating the Factors That Influence the Acceptance of MOOC as a Supplementary Learning Tool in Higher Education. J. Adv. Res. Dyn. Control. Syst. 2020, 12, 522–530. [Google Scholar] [CrossRef]
  53. Khalid, B.; Lis, M.; Chaiyasoonthorn, W.; Chaveesuk, S. Factors Influencing Behavioural Intention to Use MOOCs. Eng. Manag. Prod. Serv. 2021, 13, 83–95. [Google Scholar] [CrossRef]
  54. Yawson, D.E.; Yamoah, F.A. Gender Variability in E-Learning Utility Essentials: Evidence from a Multi-Generational Higher Education Cohort. Comput. Hum. Behav. 2021, 114, 106558. [Google Scholar] [CrossRef]
  55. Vanitha, P.S.; Alathur, S. E-Learning Adoption Based on Gender Differences: Insight from India. Int. J. Innov. Learn. 2020, 28, 510–538. [Google Scholar] [CrossRef]
  56. Van Dijk, J.A. A Theory of the Digital Divide. In The Digital Divide: The Internet and Social Inequality in International Perspective; Ragnedda, M., Muschert, G.W., Eds.; Routledge: Oxford, UK, 2013; pp. 29–43. [Google Scholar]
  57. Ho, A.D.; Reich, J.; Nesterko, S.; Seaton, D.T.; Mullaney, T.; Waldo, J.; Chuang, I. Harvard X and MITx: The First Year of Open Online Courses; Harvard University/MIT: Cambridge, MA, USA, 2014. [Google Scholar]
  58. Morris, N.P.; Swinnerton, B.J.; Hotchkiss, S. Can Demographic Information Predict MOOC Learner Outcomes? In Proceedings of the Experience Track: Proceedings of the European MOOC Stakeholder, Mons, Belgium, 18–20 May 2015; University of Leeds: Leeds, UK, 2015. [Google Scholar]
  59. Moher, D.; Liberati, A.; Tetzlaff, J.; Altman, D.G.; PRISMA Group. Preferred Reporting Items for Systematic Reviews and Meta-Analyses: The PRISMA Statement. Ann. Intern. Med. 2009, 151, 264–269. [Google Scholar] [CrossRef] [Green Version]
  60. Cosci, F.; Fava, G.A. Staging of Mental Disorders: Systematic Review. Psychother. Psychosom. 2013, 82, 20–34. [Google Scholar] [CrossRef]
  61. Borenstein, M. Common Mistakes in Meta-Analysis and How to Avoid Them; Biostat Inc.: Englewood, NJ, USA, 2019. [Google Scholar]
  62. Mukaka, M.M. A Guide to Appropriate Use of Correlation Coefficient in Medical Research. Malawi Med. J. 2012, 24, 69–71. [Google Scholar]
  63. Byrne, B.M. Structural Equation Modeling with AMOS: Basic Concepts, Applications, and Programming; Routledge: New York, NY, USA, 2016. [Google Scholar]
  64. Sabherwal, R.; Jeyaraj, A.; Chowa, C. Information System Success: Individual and Organizational Determinants. Manag. Sci. 2006, 52, 1849–1864. [Google Scholar] [CrossRef] [Green Version]
  65. Rothstein, H.R.; Sutton, A.J.; Borenstein, M. Publication Bias in Meta-Analysis: Prevention, Assessment and Adjustments; John Wiley & Sons: Hoboken, NJ, USA, 2006. [Google Scholar]
  66. Haron, H.; Hussin, S.; Yusof, A.R.M.; Samad, H.; Yusof, H. MOOC: A Technology Adoption Using UTAUT Model at Public Universities. TEST Eng. Manag. 2020, 83, 3146–3151. [Google Scholar]
  67. Khan, E. Factors Influencing Intention to Use Massive Open Online-Course on German Market. Master’s Thesis, St. Petersburg University, St. Petersburg, Russia, 2016. [Google Scholar]
  68. Mohan, M.M.; Upadhyaya, P.; Pillai, K.R. Intention and Barriers to Use MOOCs: An Investigation among the Post Graduate Students in India. Educ. Inf. Technol. 2020, 25, 5017–5031. [Google Scholar] [CrossRef]
  69. Zhou, M. Chinese University Students’ Acceptance of MOOCs: A Self-Determination Perspective. Comput. Educ. 2016, 92, 194–203. [Google Scholar] [CrossRef]
  70. Lim, C.L.; Tang, S.F.; Ravichandran, P. A Study on the Mediation Effects of Intention to Enroll in MOOCs on Its Actual Usage. In Proceedings of the 8th International Conference on E-Education, E-Business, E-Management and E-Learning, Kuala Lumpur, Malaysia, 5–7 January 2017; pp. 30–33. [Google Scholar]
  71. Tamjidyamcholo, A.; Gholipour, R.; Kazemi, M.A. Examining the Perceived Consequences and Usage of MOOCs on Learning Effectiveness. Iran. J. Manag. Stud. 2020, 13, 495–525. [Google Scholar]
  72. Othman, M.S.; Tashimaimaiti, G.; Yusuf, L.M.; Al-Rahmi, W.M. End-User Perspectives on Effectiveness of Learning Performance through Massive Open Online Course (MOOCs). In International Conference of Reliable Information and Communication Technology; Springer: Cham, Switzerland, 2017; pp. 699–707. [Google Scholar]
  73. Virani, S.R.; Saini, J.R.; Sharma, S. Adoption of Massive Open Online Courses (MOOCs) for Blended Learning: The Indian Educators’ Perspective. Interact. Learn. Environ. 2020, 1–17. [Google Scholar] [CrossRef]
  74. Ouyang, Y.; Tang, C.; Rong, W.; Zhang, L.; Yin, C.; Xiong, Z. Task-Technology Fit Aware Expectation-Confirmation Model towards Understanding of MOOCs Continued Usage Intention. In Proceedings of the Hawaii International Conference on System Sciences (HICSS), Hilton Waikoloa Village, HI, USA, 4–7 January 2017. [Google Scholar]
  75. Wan, L.; Xie, S.; Shu, A. Toward an Understanding of University Students’ Continued Intention to Use MOOCs: When UTAUT Model Meets TTF Model. SAGE Open 2020, 10, 1–15. [Google Scholar] [CrossRef]
  76. Altalhi, M. Toward a Model for Acceptance of MOOCs in Higher Education: The Modified UTAUT Model for Saudi Arabia. Educ. Inf. Technol. 2021, 26, 1589–1605. [Google Scholar] [CrossRef]
  77. Yang, H.-H.; Su, C.-H. Learner Behaviour in a MOOC Practice-Oriented Course: In Empirical Study Integrating TAM and TPB. Int. Rev. Res. Open Distrib. Learn. IRRODL 2017, 18, 35–63. [Google Scholar] [CrossRef] [Green Version]
  78. Zhou, J. Exploring the Factors Affecting Learners’ Continuance Intention of MOOCs for Online Collaborative Learning: An Extended ECM Perspective. Australas. J. Educ. Technol. 2017, 33, 123–135. [Google Scholar] [CrossRef] [Green Version]
  79. Zahrani, A.A. Exploring Behaviour Control and Actual Use of Massive Open Online Courses System Management for Education Sustainability. Entrep. Sustain. Issues 2021, 9, 386. [Google Scholar] [CrossRef]
  80. Abu-Shanab, E.A.; Musleh, S. The Adoption of Massive Open Online Courses: Challenges and Benefits. Int. J. Web-Based Learn. Teach. Technol. (IJWLTT) 2018, 13, 62–76. [Google Scholar] [CrossRef]
  81. Navarro, M.M.; Prasetyo, Y.T.; Young, M.N.; Nadlifatin, R.; Redi, A.A.N.P. The Perceived Satisfaction in Utilizing Learning Management System among Engineering Students during the COVID-19 Pandemic: Integrating Task-Technology Fit and Extended Technology Acceptance Model. Sustainability 2021, 13, 10669. [Google Scholar] [CrossRef]
  82. Chen, M.; Wang, X.; Wang, J.; Zuo, C.; Tian, J.; Cui, Y. Factors Affecting College Students’ Continuous Intention to Use Online Course Platform. SN Comput. Sci. 2021, 2, 114. [Google Scholar] [CrossRef]
  83. Jo, D. Exploring the Determinants of MOOCs Continuance Intention. KSII Trans. Internet Inf. Syst. (TIIS) 2018, 12, 3992–4005. [Google Scholar] [CrossRef]
  84. Morales Chan, M.; Barchino Plata, R.; Medina, J.A.; Alario-Hoyos, C.; Hernandez Rizzardini, R.; Roca, M.D.L. Analysis of Behavioral Intention to Use Cloud-Based Tools in a MOOC: A Technology Acceptance Model Approach. J. Univers. Comput. Sci. 2018, 24, 1072–1089. [Google Scholar] [CrossRef]
  85. Kim, R.; Song, H.-D. Examining the Influence of Teaching Presence and Task-Technology Fit on Continuance Intention to Use MOOCs. Asia-Pac. Educ. Res. 2022, 31, 395–408. [Google Scholar] [CrossRef]
  86. Singh, A.; Sharma, A. Acceptance of MOOCs as an Alternative for Internship for Management Students during COVID-19 Pandemic: An Indian Perspective. Int. J. Educ. Manag. 2021, 35, 1231–1244. [Google Scholar] [CrossRef]
  87. Van de Kamp, C. Acceptance of MOOCs by Dutch University Students. Extending the Unified Theory of Acceptance and Use of Technology (UTAUT) Model with the Technology Acceptance Model (TAM). Master’s Thesis, Radboud University, Nijmegen, The Netherlands, 2019. [Google Scholar]
  88. Wang, Q.; Khan, M.S.; Khan, M.K. Predicting User Perceived Satisfaction and Reuse Intentions toward Massive Open Online Courses (MOOCs) in the COVID-19 Pandemic: An Application of the UTAUT Model and Quality Factors. Res. Bus. Soc. Sci. 2021, 10, 1–11. [Google Scholar] [CrossRef]
  89. Lung-Guang, N. Decision-Making Determinants of Students Participating in MOOCs: Merging the Theory of Planned Behavior and Self-Regulated Learning Model. Comput. Educ. 2019, 134, 50–62. [Google Scholar] [CrossRef]
  90. Chaveesuk, S.; Khalid, B.; Bsoul-Kopowska, M.; Rostańska, E.; Chaiyasoonthorn, W. Comparative Analysis of Variables That Influence Behavioral Intention to Use MOOCs. PLoS ONE 2022, 17, e0262037. [Google Scholar] [CrossRef] [PubMed]
  91. Teo, T.; Dai, H.M. The Role of Time in the Acceptance of MOOCs among Chinese University Students. Interact. Learn. Environ. 2019, 30, 651–664. [Google Scholar] [CrossRef]
  92. Dai, H.M.; Teo, T.; Rappa, N.A. Understanding Continuance Intention among MOOC Participants: The Role of Habit and MOOC Performance. Comput. Hum. Behav. 2020, 112, 106455. [Google Scholar] [CrossRef]
  93. Meet, R.K.; Kala, D.; Al-Adwan, A.S. Exploring Factors Affecting the Adoption of MOOC in Generation Z Using Extended UTAUT2 Model. Educ. Inf. Technol. 2022, 1–23. [Google Scholar] [CrossRef]
  94. Lv, J.; Maeda, Y. Evaluation of the Efficacy of Meta-Analytic Structural Equation Modeling with Missing Correlations. Struct. Equ. Model. Multidiscip. J. 2020, 27, 414–437. [Google Scholar] [CrossRef]
  95. Geyskens, I.; Steenkamp, J.-B.E.; Kumar, N. Make, Buy, or Ally: A Transaction Cost Theory Meta-Analysis. Acad. Manag. J. 2006, 49, 519–543. [Google Scholar] [CrossRef]
  96. Santini, F.D.O.; Ladeira, W.J.; Mette, F.M.B.; Ponchio, M.C. The Antecedents and Consequences of Financial Literacy: A Meta-Analysis. Int. J. Bank Mark. 2019, 37, 1462–1479. [Google Scholar] [CrossRef]
  97. Chaveesuk, S.; Wutthirong, P.; Chaiyasoonthorn, W. Cloud Computing Classroom Acceptance Model in Thailand Higher Education’s Institutes: A Conceptual Framework. In Proceedings of the 2018 10th International Conference on Information Management and Engineering, Salford, UK, 22–24 September 2018; pp. 141–145. [Google Scholar]
  98. Hooper, D.; Coughlan, J.; Mullen, M.R. Structural Equation Modelling: Guidelines for Determining Model Fit. Electron. J. Bus. Res. Methods 2008, 6, 53–60. [Google Scholar]
  99. Kenny, D.A.; Kaniskan, B.; McCoach, D.B. The Performance of RMSEA in Models with Small Degrees of Freedom. Sociol. Methods Res. 2015, 44, 486–507. [Google Scholar] [CrossRef]
  100. Wang, H.; Tao, D.; Yu, N.; Qu, X. Understanding Consumer Acceptance of Healthcare Wearable Devices: An Integrated Model of UTAUT and TTF. Int. J. Med. Inform. 2020, 139, 104156. [Google Scholar] [CrossRef]
  101. Khalid, B.; Chaveesuk, S.; Chaiyasoonthorn, W. MOOCs Adoption in Higher Education: A Management Perspective. Pol. J. Manag. Stud. 2021, 23, 239–256. [Google Scholar] [CrossRef]
  102. Rahi, S.; Khan, M.M.; Alghizzawi, M. Extension of Technology Continuance Theory (TCT) with Task-Technology Fit (TTF) in the Context of Internet Banking User Continuance Intention. Int. J. Qual. Reliab. 2021, 38, 986–1004. [Google Scholar] [CrossRef]
  103. Fu, J.; Shang, R.-A.; Jeyaraj, A.; Sun, Y.; Hu, F. Interaction between Task Characteristics and Technology Affordances: Task-Technology Fit and Enterprise Social Media Usage. J. Enterp. Inf. Manag. 2020, 33, 1–22. [Google Scholar] [CrossRef]
  104. D’Ambra, J.; Wilson, C.S.; Akter, S. Application of the Task-Technology Fit Model to Structure and Evaluate the Adoption of E-books by Academics. J. Am. Soc. Inf. Sci. Technol. 2013, 64, 48–64. [Google Scholar] [CrossRef] [Green Version]
  105. Koo, C.; Wati, Y.; Jung, J.J. Examination of How Social Aspects Moderate the Relationship between Task Characteristics and Usage of Social Communication Technologies (SCTs) in Organizations. Int. J. Inf. Manag. 2011, 31, 445–459. [Google Scholar] [CrossRef]
  106. DeLone, W.H.; McLean, E.R. Information Systems Success: The Quest for the Dependent Variable. Inf. Syst. Res 1992, 3, 60–95. [Google Scholar] [CrossRef] [Green Version]
  107. Hollingsworth, C.L. An Examination of Fit and the Use of Mobile Devices for Performing Tasks. Ph.D. Thesis, Kennesaw State University, Kennesaw, GA, USA, 2015. [Google Scholar]
  108. Dutot, V.; Bhatiasevi, V.; Bellallahom, N. Applying the Technology Acceptance Model in a Three-Countries Study of Smartwatch Adoption. J. High Technol. Manag. Res. 2019, 30, 1–14. [Google Scholar] [CrossRef]
  109. Hauk, N.; Hüffmeier, J.; Krumm, S. Ready to Be a Silver Surfer? A Meta-Analysis on the Relationship between Chronological Age and Technology Acceptance. Comput. Hum. Behav. 2018, 84, 304–319. [Google Scholar] [CrossRef]
Figure 1. Theory of Planned Behavior.
Sustainability 14 08268 g001
Figure 2. UTAUT Model.
Sustainability 14 08268 g002
Figure 3. The Task-Technology Fit Model.
Sustainability 14 08268 g003
Figure 4. Proposed Theoretical Model.
Sustainability 14 08268 g004
Figure 5. The Flow Diagram of the Study Adapted from [59].
Sustainability 14 08268 g005
Figure 6. The revised model and the standardized path coefficients. All paths are significant (p < 0.001).
Sustainability 14 08268 g006
Table 1. An overview of the studies used in the meta-analysis processes.
No.Author(s)YearTypeCountrySample SizeVariable(s)Mean AgeGender
(Male %)
No.Author(s)YearTypeCountrySample SizeVariable(s)Mean AgeGender
(Male %)
1Mulik [41]2018JIndia310PE, EE, SI, FC, BI35.72 a72.9024Haron [66]2020JMalaysia350EE, PE, SI, FC, BI, AU
2Khan [67]2016TGermany491PE, EE, SI44.5 a4925Mohan [68]2020JIndia412EE, PE, SI, FC, BI23.5 a47
3Zhou [69]2016JChina475ATT, BI21.4050.526Azami & Ibrahim [52]2020JMalaysia111ATT, SI, BI72.1
4Lim [70]2017CMalaysia780PE, EE, SI, FC, BI, AU27Tamjidyamcholo [71]2020JIran234SI, FC, AU,BI29.62 a68
5Othman [72]2017CMalaysia513ATT-BI23.03 a43.928Virani [73]2020JIndia286SI, ATT, BI67.1
6Ouyang [74]2017JChina234TTF-BI29Wan [75]2020JChina464PE, EE, SI, FC, TAC, TEC, TTF, BI36.4
7Wu & Chen [25]2017JChina252ATT, BI, TTF, TAC, TEC, SI35.7 a59.130Altalhi [76]2021JSaudi
Arabia
169ATT, EE, FC, SI, PE21.36 a82
8Yang & Su [77]2017JTaiwan272AU, BI, ATT23.7130.231Alyoussef [9]2021JSaudi
Arabia
277SI, TTF23.23 a60.6
9Zhou [78]2017JChina435SI, BI24.5 a56.632Zahrani [79]2021JSaudi Arabia235ATT-AU
10Abu-Shanab & Musleh [80]2018JJordan184SI, BI20 a2533Amid & Din [44]2021JMalaysia218PE, EE, SI, FC, BI, UB22.215 a24.3
11Karels [38]2018TThe Netherlands141PE, EE, SI, FC, BI58.934Navarro [81]2021JPhilippines1011BI, TTF, TEC, TAC21.01 a76.06
12Chen [51]2018JTaiwan854PE, BI6535Chen [82]2021JChina337EE,SI, PE, BI25.8
13Jo [83]2018JSouth
Korea
237TTF, BI28.0551.936Chu & Dai [36]2021JChina771EE, PE, SI, FC, BI, AU 45.8
14Khan [50]2018JPakistan414TEC, TAC, TTF, SI, BI, AU5637Haron [21]2021CMalaysia400EE, PE, SI, FC, BI, AU
15Morales Chan [84]2018JGuatemala131BI, ATT, FC83.3338Kim & Song [85]2021JSouth
Korea
252TTF, BI45.2
16Ab Jalil [46]2019JMalaysia238ATT-BI39Li & Zhao [8]2021JChina312PE, EE, SI,FC,BI23.11 a44.90
17Al-Rahmi [47]2021JMalaysia1148ATT-BI21.9 a46.340Singh & Sharma [86]2021JIndia326SI, FC
18Kamp [87]2019TThe Netherlands305ATT, BI, PE, EE, SI, FC21.7524.341Wang [88]2021JChina298FC, SI, EE, PE, BI26.9277.7
19Lung-Guang [89]2019JTaiwan222ATT, BI33.751.442Chaveesuk [90] (study A)2022JPoland455PE, EE, SI, FC, BI71.5
20Teo & Dai [91]2019JChina209ATT, BI32.5443Chaveesuk [90] (study b)2022JThailand490PE, EE, SI, FC, BI41
21Tseng [42]2019JTaiwan161EE, PE, SI, FC, BI, AU46.95 a63.544Chaveesuk [90] (study c)2022JPakistan513PE, EE, SI, FC, BI28.5
22Dai [92]2020JChina160ATT-BI30.6219.0745Meet [93]2022JIndia483PE, SI, EE, FC, BI22.03 a49.7
23Fianu [13]2018JGhana204EE, PE, SI, FC, BI, AU
Note: Journal article = J; Conference paper = C; Thesis = T; a Based on the information provided in the included studies, the mean age was calculated indirectly.
Table 2. Random effects of average correlation and heterogeneity statistics.
PathsKNr+rzCI 95% LIQ-TestI2Fail Safe NEgger’s Test
BI-AU937940.5160.5700266–0.701658.820 ***98.78631880.346
FC-BI1857620.3430.3580.221–0.455438.045 ***96.11931810.622
PE-BI2184560.4540.4890.338–0.5561604.944 ***98.75473190.005
EE-BI1869620.3810.4020.244–0.503697.219 ***97.55146940.482
SI-BI2588700.3910.4130.280–0.491841.468 ***97.14887620.649
ATT-BI1333430.4520.4870.318–0.568249.157 ***95.18421850.079
TTF-BI840090.4270.4570.246–0.580283.021 ***95.52712250.108
TAC-TTF421410.4920.5390.216–0.696152.983 ***98.0395250.345
TEC-TTF318890.4930.5400.331–0.62734.079 ***94.1312110.377
Note. N = sample size; *** p value < 0.001.
Table 3. Meta-analysis correlation matrix among the constructs (N = 16774).
Construct123456789
1. PE
2. EE0.572
3. SI0.5450.479
4. FC0.5750.5620.496
5. ATT0.7700.4430.5420.304
6. TTF0.5460.5060.5020.5460.105
7. TAC0.6590.4850.3090.4670.4380.492
8. TEC0.5290.3170.1930.2970.2460.4440.590
9. BI0.4540.3810.3910.3430.3430.4270.4930.493
10. AU0.4730.4430.4570.4140.4770.6200.516
Note. All correlation values are significant (p < 0.001). A dash (–) shows that no studies reflected in the meta-analysis had evaluated the association between the corresponding variables.
Table 4. The sample size moderating effect.
SubgroupsFC → BIPE → BIEE → BISI → BIATT → BI
Large sample size
Meta β0.2880.6200.2660.4640.312
p-value (β)0.0000.0000.0000.0000.000
Z-value16.77496.8216.8632.48410.123
Small sample size
Meta β0.3890.5570.9710.3360.435
p-value (β)0.0000.0000.0000.0000.000
Z-value20.5333.9828.30221.23822.453
Heterogeneity
Q-statistic0.3223.0621.36422.1140.793
p (heterogeneity)0.5710.0800.2430.0000.373
Table 5. The gender moderating effect.
SubgroupsFC → BIPE → BIEE → BISI → BIATT → BI
Female
Meta β0.4280.6220.3370.2990.387
p-value (β)0.0000.0000.0000.0000.000
Z-value18.88497.6921.56418.92716.363
Male
Meta β0.3100.3950.4400.4450.353
p-value (β)0.0000.0000.0000.0000.000
Z-value9.97222.02317.52427.57014.070
Heterogeneity
Q-statistic1.4570.1050.5420.64624.907
p (heterogeneity)0.4830.9490.7620.7240.000
Table 6. The age moderating effect.
SubgroupsFC → BIPE → BIEE → BISI → BIATT → BI
Age > 24 years
Meta β0.4030.9650.2400.1530.308
p-value (β)0.0000.0000.0000.0000.000
Z-value13.2235.059.1586.08812.132
Age < 24 years
Meta β0.3020.5430.6470.4130.372
p-value (β)0.0000.0000.0000.0000.000
Z-value15.7320.25821.20817.8849.759
Heterogeneity
Q-statistic1.1090.9385.09819.84710.756
p (heterogeneity)0.5570.6260.0780.0000.013
Table 7. The culture moderating effect.
SubgroupsFC → BIPE → BIEE → BISI → BIATT → BI
Asian
Meta β0.3360.3820.3720.3860.405
p-value (β)0.0000.0000.0000.0000.000
Z-value22.35733.24130.0675.6623.013
Non-Asian
Meta β0.3270.6230.2980.3220.367
p-value (β)0.0000.0000.0000.0000.000
Z-value13.598497.5189.5043.6107.979
Heterogeneity
Q-statistic0.3581.5450.0180.1860.253
p (heterogeneity)0.550.2140.8930.660.615
Publisher’s Note: MDPI stays neutral with regard to jurisdictional claims in published maps and institutional affiliations.

