Article

Uncovering the Effect of Forest Certification on the Dynamic Evolution of the Global Log Trade Network: A Stochastic Actor-Oriented Model Approach

1
School of Economics and Management, Beijing Forestry University, Beijing 100083, China
2
School of Business, Beijing Union University, Beijing 100025, China
*
Authors to whom correspondence should be addressed.
Sustainability 2022, 14(14), 8229; https://doi.org/10.3390/su14148229
Submission received: 20 May 2022 / Revised: 12 June 2022 / Accepted: 1 July 2022 / Published: 6 July 2022

Abstract

:
Clarifying the dynamic evolution characteristics and driving mechanism of the global log trade network (GLTN) can provide references for the trade decision-making of various countries. Based on the stochastic actor-oriented model, this paper analyzed the GLTN’s dynamic evolution from 2010 to 2019 and paid more attention to the effect of forest certification on the dynamic evolution of the GLTN. Results indicate that from 2010 to 2019, many changes have occurred in the network. The change rate in the 2010–2015 period is faster than that in the 2015–2019 period. Countries tend to form reciprocity, three-cycles, and transitive trade ties over time. A country with more certified forest area tends to form new log export ties with the other countries. The trade imbalance ratio (TII) has a significant negative mediating effect on the evolutionary relationships between the certified forest area and the log trade network dynamic. Net exporters of log tend to avoid establishing export ties with countries with more certified forest areas over time. Countries with similar cultural backgrounds are easier to establish log trade ties with, while countries with farther geographical distances tend to avoid establishing trade ties over time. A free trade agreement (FTA) has a significant positive impact on the formation of log trade ties among nations. Our findings shed new light on the dynamic evolution mechanism of the global log trade network and offer implications for future trade and forest conservation policy design.

1. Introduction

The deepening of economic globalization has strengthened the degree of involvement of countries in international trade, which has gradually increased their dependence on international trade [1]. As an essential wooden forest product, logs have obvious resource attributes, and their supply directly depends on a country’s forest resource endowment. However, the global forest resources are unevenly distributed [2]. At the same time, international trade can promote the cross-regional flow of forest products [3], thus alleviating the contradiction between supply and demand, and helping the economic construction of each country to a certain extent [4]. It is mainly for countries with a lower level of economic development and ampler forest resource endowments. However, with the deterioration of the global ecological environment, governments have begun to think about the relation between economic growth and environmental protection [5]. They have adopted a series of measures to protect forest resources, such as the American “Lacey Act Amendment”, the “Timber Regulation of European Union”, and China’s Natural Forest Protection Project. Relevant policy constraints have increased the scale of international log trade. On the other hand, the supply of logs in the global market is less than the demand, which has induced frequent illegal deforestation in some underdeveloped countries (regions) with abundant forest resources and weak environmental awareness. The forest certification system came into being to alleviate the overexploitation of forests from the perspective of the market access mechanism [6].
Forest certification was introduced in the early 1990s to address concerns of deforestation and forest degradation and to promote the maintenance of biological diversity, especially in the tropics [7], which provide a means to ensure that the appropriate forms of management are occurring [6]. Forest certification includes forest management certification and chain of custody certification. It is the process where an independent third party conducts an overall evaluation of the forest (or forest product processing enterprises) of a certain forest management unit in accordance with certain performance standards and prescribes procedures to verify whether the forest management or forest product processing enterprises are in compliance with standard requirements, and then propose improvements and certificates [7]. It can link green consumption with improving forest management level, expand market share, obtain high-yield producers by the comprehensive evaluation of the forest’s management (or forest product processing enterprises), and achieve the purpose of protecting the environment, promoting sustainable forest management and market access for forest products through the means of a market supervision of forest products [8].
With more awareness of environmental protection and the implementation of green trade barriers, from the perspective of the legitimacy of the source of raw materials, the green trade barrier effect of forest certification by restricting the supply of logs has become increasingly prominent [9,10]. Scholars have analyzed the role of forest certification from different perspectives, and the results show that forest certification has helped to improve several social and environmental aspects of forest management [9]. Some scholars also believe that forest certification has a particular green advantage in international trade [10], which impacts the current log trade network evolution. However, forest certification is costly work [6]. The economic benefits may not be immediately apparent because most countries have not adopted the forest certification system. This means that the impact of forest certification on the characteristics and evolution of the log trade network is currently uncertain.
At this stage, the research on the log trade network either starts from the traditional network centrality index and analyzes the network’s topological structure [2] or uses block models and motif discovery algorithms to analyze the microtrading model and community structure of the network [11]. Thus, there are few pieces of literature involving the impact of forest certification on the evolution of the GLTN. On the other hand, the trade network can better present the characteristics of the interconnected and dependent relations between countries and has become a research hotspot and frontier field in economics [12]. Combining trade network visualization and statistical modeling to explore the micro-driving mechanism behind the macrotopological structure of the network has also received more and more attention from scholars [13]. Constructing an exponential random graph model through cross-sectional data is a widely used method to research the internal mechanism of forming a trade network. At the same time, this static analysis lacks the consideration of time-dependent effects [14].
The dynamic evolution of a country’s status in the global log trade network is not only affected by its own factors, but also by its trading partners and trading partners’ partners, which leads to the global log trade network being affected by the changes in the attributes of each member in the network. More complex changes have occurred, and the evolution of the overall network will also affect the changes in the attributes of network members, which are not only reflected in trade relations, but also in changes in trade intensity. This complex dynamic evolution problem can be analyzed with the help of the stochastic actor-oriented model. Based on three or more periods of dynamic data, the stochastic actor-oriented model that explores the influence of a network’s endogenous structural variables and exogenous behavior variables on the evolution of the network’s relations is the most advantageous method to study the dynamic development of trade networks [15]. This model can reveal the influence of the endogenous network’s structure effect on the evolution of the trade network’s structure and explore the impact of the network’s structure effect on the attributes of exogenous nodes. Because of the superiority of the stochastic actor-oriented models in studying the dynamic evolution of the network, its application scenarios have been expanded from its initial interpersonal network analysis to the trade network [16], which provides a new method for studying the dynamic evolution of the GLTN and its driving mechanism.
In summary, this paper innovatively applies the stochastic actor-oriented models to research the dynamic evolution of the GLTN. It explores the impact of forest certification on the dynamic development of the GLTN and its driving mechanism from two aspects: relation structure and tie strength. This paper also analyzes the impact of forest resource endowment, economic development level, geographic distance, cultural distance, and FTA network on the dynamic evolution of the GLTN. This research’s conclusion enriches the existing research on international log trade. Furthermore, it can provide references for countries to assess their position in the GLTN and respond to the network evolution.
The remaining sections are organized as follows. The second section introduces the material and methods, including the theoretical basis and research hypothesis, research data, and method. The third section addresses the research results, including the characteristics and structural evolution of the GLTN and the dynamic evolution of the log trade network. A discussion of the research is presented in the fourth section; the final section is the conclusion.

2. Material and Methods

2.1. Theoretical Basis and Research Hypothesis

The GLTN is part of a complex economic system. The dynamic evolution of the network is affected by political, economic, cultural, and other conventional factors and their unique attributes. As a market-based means to deal with illegal logging and protect forest resources, forest certification restricts the supply of logs from the perspective of the legality of the source of raw materials [17]. Therefore, certified forests have three market advantages: potential market access, improved public image, and price premiums [6,18]. Correspondingly, forest certification will also have a particular impact on the structure and evolution of the GLTN by affecting the legality of log supply. This impact is mainly reflected in the competitive export effect, trade barrier effect, and standard language effect [10]. These effects have changed the structure of trade ties.
On the one hand, they may cause some trade ties to be disconnected or newly built. and on the other hand, they have affected the strength of trade ties, causing changes in the structure of the log import and export trade proportions of countries, thus impacting the dynamic evolution of the GLTN. In addition, forest certification is a manifestation of a country’s forest sustainable management ability [2]. The certified area represents a country’s forest resource endowment level to a certain extent; that is, countries with more certified forest areas may have relatively rich forest resources. Moreover, the formation of international trade ties is based on the complementary supply and demand of both sides of the trade. The log net exporter has a strong log supply capacity and is the primary import market for countries with relatively poor forest resources. In contrast, the trade linkages with countries with rich forest resources may be weak, so the following hypothesis is proposed.
H1:
Countries characterized as having more certified forest areas tend to form log export trade ties.
H2:
Countries characterized as having more certified forest areas tend to avoid establishing import ties with net log exporting countries.

2.2. Construction of the Global Log Trade Network

The global log trading system is a relationship network composed of a series of trade relations, G = (V, E), where V = {Vi: i = 1, 2 … n} represents different countries (regions) in the network, E = {Vi, Vj: i,j = 1, 2 … n} represents the trade relationship between country (region) i and country (region) j, and the direction of the ties represents the trade flow. In a weightless network, the edge value of 1 means there is a trade tie, and 0 means no trade tie. In a weighted network, the weight of an edge represents the trade volume between nodes.

2.3. Data Sources

Our data consisted of 3 periods of trade and attribute data of 172 countries in 2010, 2015, and 2019. It should be noted that we chose 2010–2019 instead of 2010–2020 mainly to exclude the impact of the COVID-19 epidemic on the global log trade. The trade data came from the United Nations Commodity Trade Database. Referring to the research of Wang et al. [19], the data with a trading volume greater than USD 10,000 were recorded as 1, which signifies the existence of trade ties between the two countries, while the data with a trading volume less than USD 10,000 were recorded as 0, which means there is no trade tie between the two countries [2]. Furthermore, due to the fact that missing reports and inconsistent statistical calibers exist when reported to the United Nations, this paper used the method of cross-validating the export data and import data to check for gaps and make up for any omissions. For the same trade relation, when the statistical data were inconsistent, the larger one prevailed [16], In this way, the GLTN was built. For the node attribute data, the per capita GDP (GDPP) of each country came from the World Bank. The certified forest areas (CER) and number of chains of custody certificates (COC) were from the official website of the Forest Stewardship Council (FSC), and the per capita forest stock (FSP) was from the 2020 Global Forest Resources Assessments Report. Language network (LAN), distance network (DIS), and FTA network came from the CEPII database. In addition, to meet the requirements of the stochastic actor-oriented models, the paper performed logarithmic processing on related data.
In addition, to analyze the evolution of the log trade structure of various countries from the perspective of trade volume, the log trade imbalance index (TII) was constructed to indicate the type and scale of net log trade in each country with reference to the research of Prell [15]. The construction method was applied as follows. Firstly, the log export trade value of each country was subtracted from the import trade value. It was done mainly with the aim of meeting the requirements of the logarithmic function and reflected the net trade type of each country at the same time. This paper took the opposite number of the net traded value of the log net importing country, computed the logarithm, and then retook the opposite. For net exporting countries, only the logarithm procedure of their net export number was needed. Moreover, a value greater than zero indicated that the country was a net log export country, and a difference of less than zero indicated that the country was a net log import country. Secondly, to make the TII meet the requirements of the stochastic actor-oriented models, this paper further processed the data so that all countries’ TIIs were converted into numbers greater than zero. The specific construction process is shown below. In this formula, the larger the trade imbalance index of a country, the higher the proportion of the country’s log export trade.
T I I i = { log ( V i e x p V i i m p ) + n   i f   V i e x p V i i m p > 0   log ( V i i m p V i e x p ) + n   i f   V i e x p V i i m p < 0
where V i e x p and V i i m p , respectively, represent the log export and import trade volume of the country i, n is the adjustment factor of the trade imbalance index, and it depends on the positive integer of the logarithm of the most significant net log import value.
The descriptive statistical analysis of each variable is shown in Table 1 below. It can be seen from Table 1 that the mean values of the time-varying variables NET, TII, FS, CER, COC, GDPP, and FTA all have an upward trend, indicating that the above variables have risen as a whole from 2010 to 2019. Thus, the dynamic changes of variables lay the foundation for the dynamic evolution of the GLTN.

2.4. Method

The stochastic actor-oriented model (SAOM) is based on a longitudinal data analysis of the dynamic evolution of the network, which can simultaneously analyze the evolution of the network and changes in node behavior [20]. The SAOM regards the evolution of the network as a process in which nodes in the network establish, maintain, or terminate connections with other nodes. Furthermore, each node decides to establish, maintain, or cancel contact with other nodes by controlling its outdegree [21]. A rate equation represents this process. The model uses the computer to generate Markov processes during actual operation randomly and combines historical longitudinal data of social networks to simulate the structural evolution of the social network; for the estimation of model parameters, it adopts a Monte Carlo Markov simulation and judges the significance of the parameters by t statistics.
Given that an actor i has the opportunity to make a relational change, the choice for this actor is to change one of the tie variables   X i j , which will lead to a new state X , X C ( X 0 ) . At this stage, a traditional logistic regression is used to model choice probabilities [22]:
P = { X ( t ) c h a n g e s   t o   x / i   h a s   a   c h a n g e   o p p o r t u n i t y   a t   t i m e   t ,   X ( t ) X 0   } = P i ( x 0 , x , v , w ) = e x p ( f i ( X 0 , x , v , w ) ) X C ( X 0 ) e x p ( f i ( x 0 , x , v , w ) )
The change determination process models the probabilities of changing and thus defines the transition matrix of the process. The probability of the choice made by the actor i who gets the opportunity for a change is modelled by a multinomial logistic regression model where the linear combination of statistics and explanatory variables is determined by the so-called evaluation function. The evaluation function is used to model how change occurs in the network, that is, what changes occur once an actor i has an opportunity to change its network or attribute (in a network or behavioral ministep, respectively). These changes are expressed by two interdependent mathematical functions termed objective functions, which model the course of action that the actor selects. The actor makes its decision by evaluating the outcome of each possible change (to its network or attribute, depending on the type of ministep) in terms of its effect on the value of its objective function and then choosing the optimal change (with a small amount of randomness). In a utility-based approach, the objective functions directly reflect the actor’s “utilities” such that in making their decisions, actors seek to maximize the utility they derive [23].
f i n e t ( x , z ) = k = 1 k β k n e t s i k n e t ( x , z )
  f i b e h ( x , z ) = k = 1 k β k b e h s i k b e h ( x , z )
In each equation, f i ( x , z ) denotes the value of the objective function for actor i for a given network state x and its level of the attribute z. f i n e t   denotes the objective function that actor i seeks to optimize in a network ministep. f i b e h   represents the objective function that actor i seeks to optimize in an attribute (behavioral) ministep. The value of f is dependent on a series of parameter values   β k , each of which is coupled to an effect, denoted s i k . An effect represents a subgraph count in the network neighborhood of the focal actor (or a function of the attributes of actors sending or receiving ties) in a given ministep.
It can be seen that a significant strength of the SAOMs is that a large variety of variables can be included in the specification of the objective function to model the preferences and constraints of actors [24]. In the GLTN, the dynamic evolution of the network depends on internal and external factors, namely the endogenous network’s structure effect, which refers to the network’s structural characteristics on the network evolution and the exogenous node attribute effect.
This study analyzes mainly from five outdegree effects: reciprocity, GWESP, 3-cycles and transitive ties. The impact of exogenous node attributes refers to the influence of node attributes on the dynamic evolution of the network, which can be divided into three types of effects. Among them, the ego effects refer to what degree the attribute of the focal actor affects its import partners. The alter effects pertain to the attributes of those to whom ego is tied and measure the tendency of egos to be drawn to form ties to those altered with a higher value for a given attribute. Finally, the similarity effects measure more ties to form between actors with a similar value for a given attribute. This paper mainly focused on four aspects, including sustainable forest management capabilities (certified forest area, number of chains of custody certificates), trade structure (TII), resource endowment (per capita forest stock), and economic development level (GDP per capita) to analyze the influence of node attributes on the dynamic evolution of the GLTN. In addition, to verify the stability of the conclusion, this paper added a series of covariates, including a geographic distance network, cultural distance network and FTA network. The statistics of specific network effects and their corresponding interpretations are shown in Table 2 below.

3. Results

3.1. Characteristics and Structural Evolution of the GLTN

According to the social network analysis method, this section analyzes the structural characteristics in 2010, 2015, and 2019 of the GLTNs composed of 172 countries. Among them, the unweighted network density is mainly used to measure the sparseness of the network ties, that is, the closeness of the ties [25]. On the other hand, the weighted network density represents the average strength of trade ties in the network; the clustering coefficient measures the degree of aggregation of nodes in the network, the reciprocity represents the degree of reciprocity between nodes, the average path distance represents the proximity between nodes, and the compactness mainly measures the compactness of the network degree. The results of each index are shown in Table 3 below.
It can be seen from Table 3 that the relation in the GLTN is relatively sparse. From 2010 to 2019, the total number of trade ties in the network dropped from 1929 to 1801. The degree of closeness of the GLTN did not change much. However, from the perspective of trade scale, the density of the weighted GLTN increased significantly, reflecting the increase in the average trade volume of trade ties and the increase in the strength of trade ties. The clustering coefficient of the GLTN for three years were all above 0.45 and showed a slightly increasing trend. There is also an increasing trend for the reciprocity coefficient, indicating that the log trade among countries showed a certain degree of agglomeration, and the overall degree of agglomeration increased. Moreover, the degree of trade reciprocity between countries is low, but the change is relatively stable. In addition, the average path refers to the average of the shortest path lengths (or distances) between two nodes in a network, that is, starting from a node, passing through the node connected to it, and gradually connecting to the target node. The average path distance of the network is relatively stable and maintained between 2.454 and 2.499, indicating that the compactness of the nodes in the network was relatively low, and any two nodes can be connected by about three steps in the shortest average. Hence, there is still a lot of room for optimizing the global log trading network.
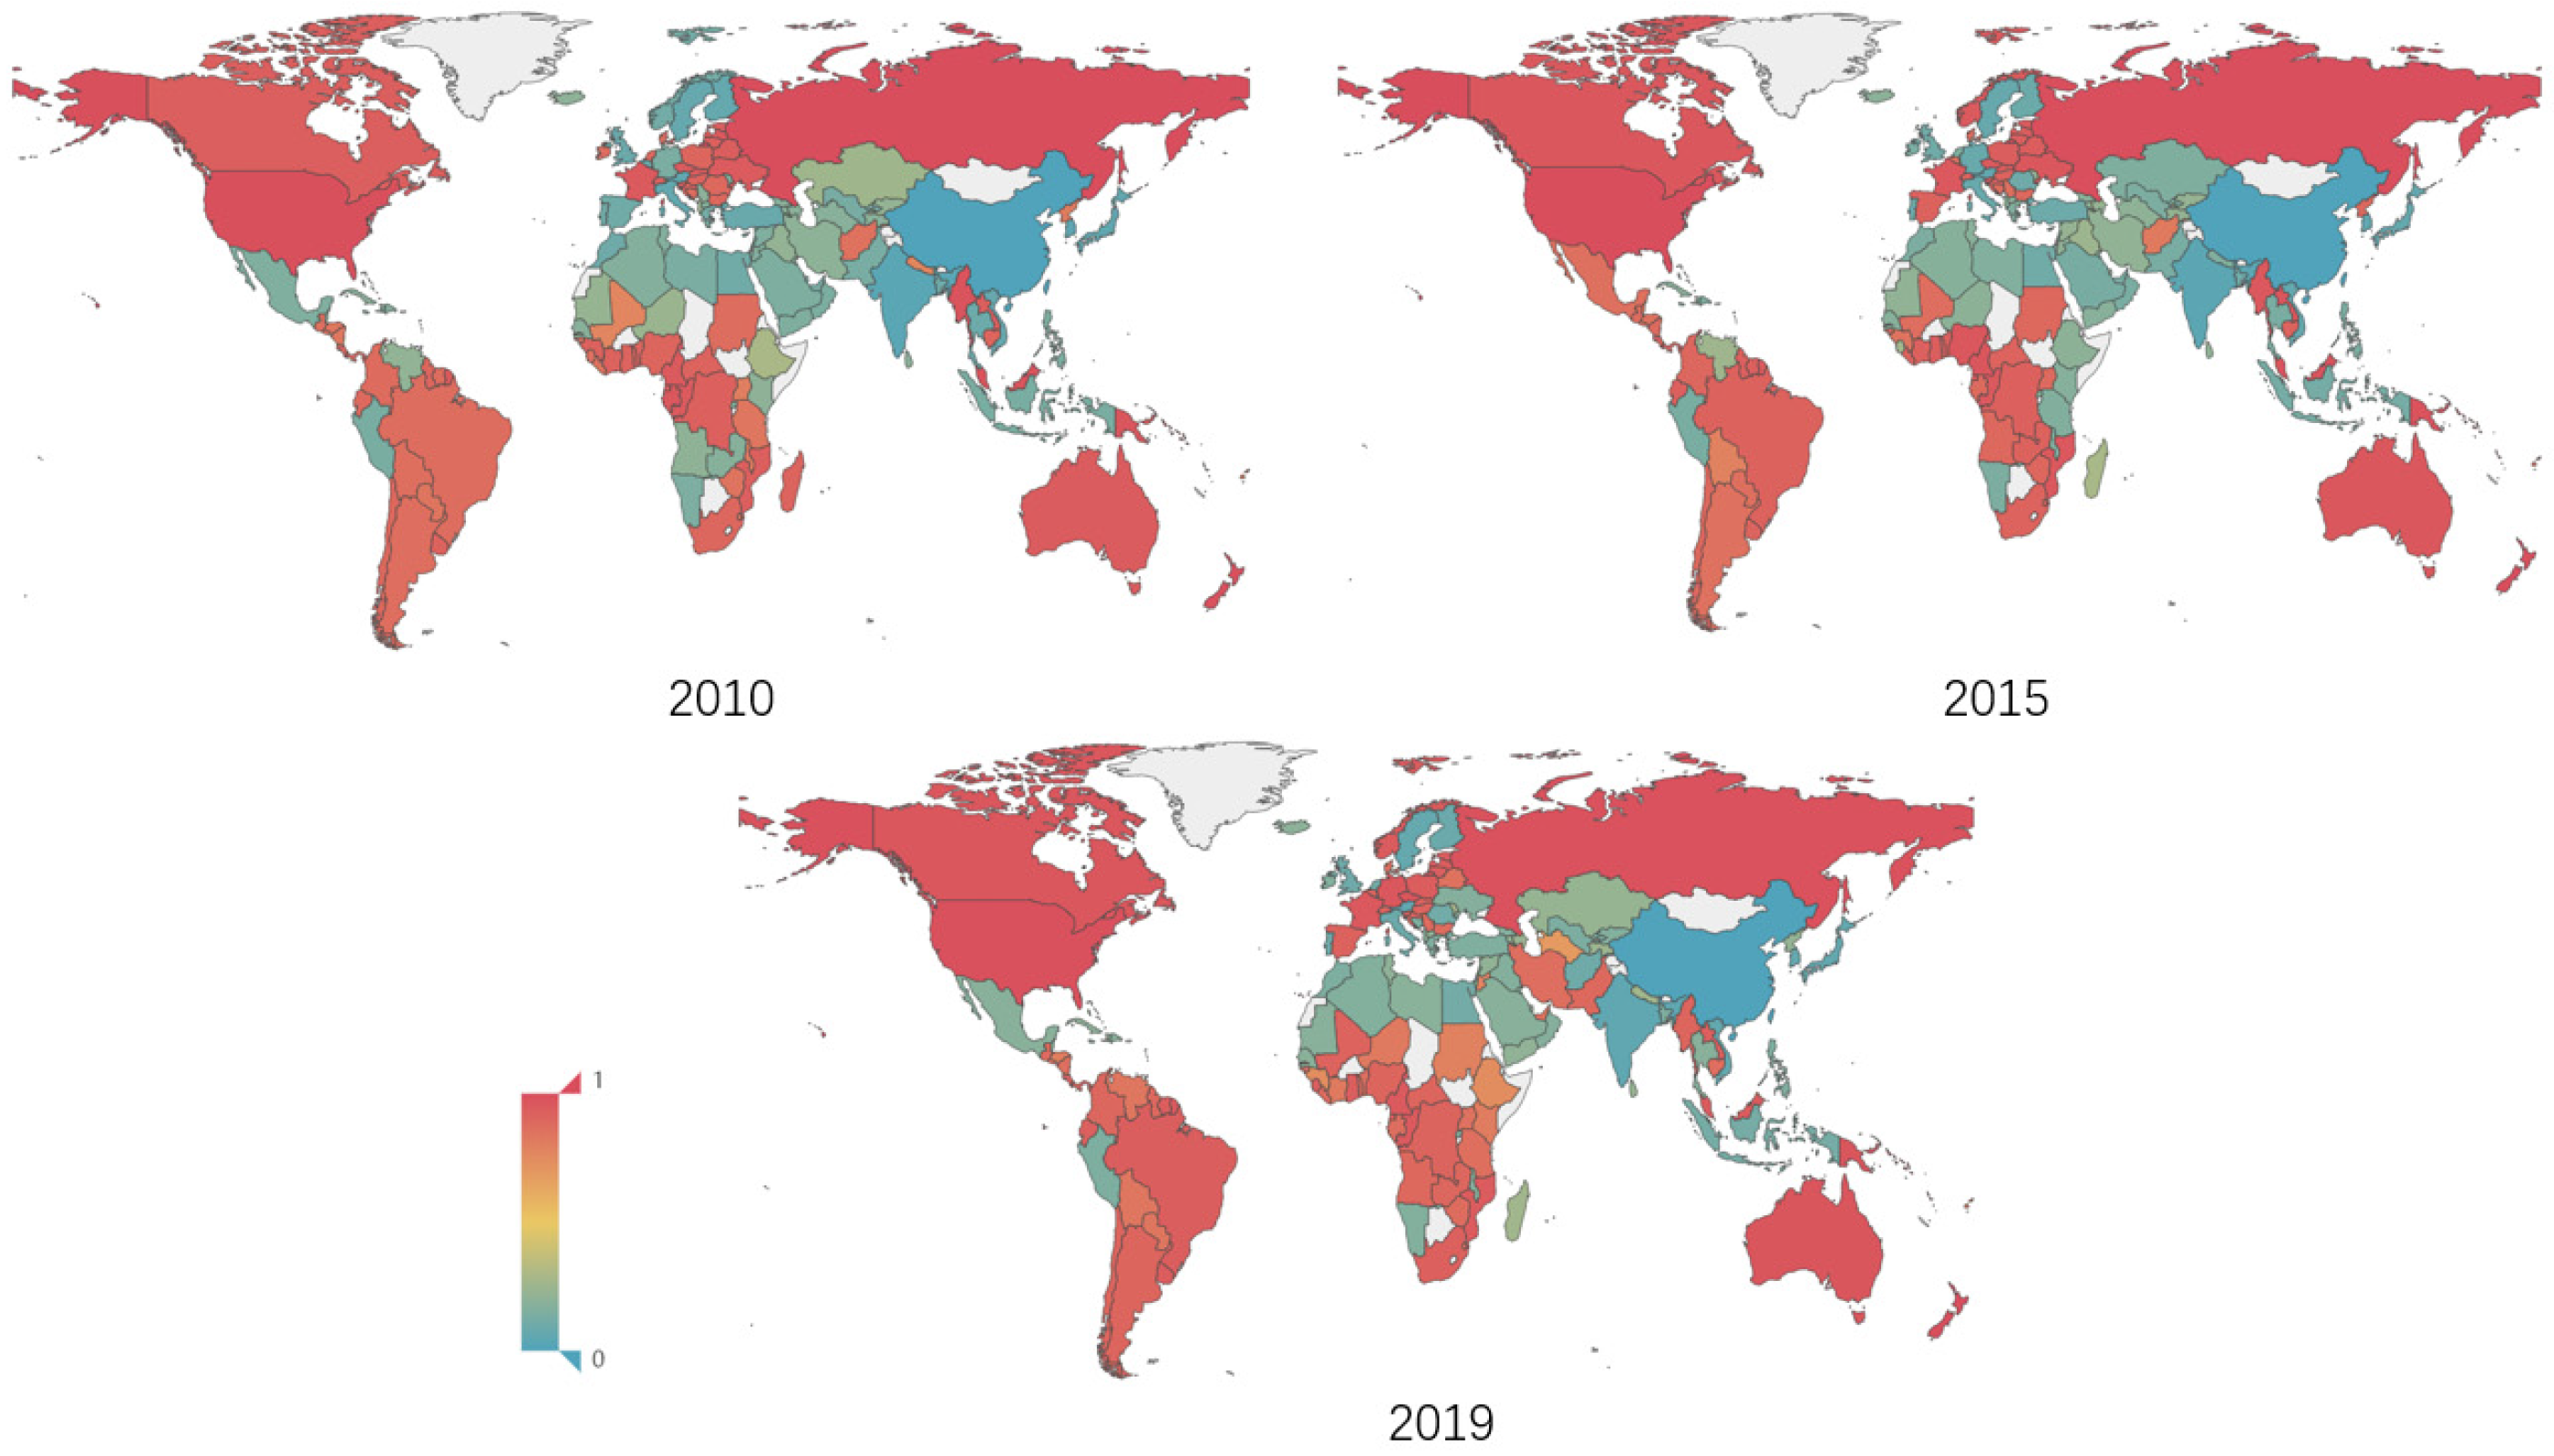
In order to analyze the evolution trend of the log trade scale of various countries from the perspective of the net trade volume, this paper constructed a trade imbalance indicator (TII) and visualized the evolution of the TII of each country in 2010, 2015, and 2019, as shown in Figure 1 below. The closer the color is to read, the greater the country’s net export trade volume of log, and the closer it is to green, the greater the country’s net import trade volume of log.
It can be concluded in Figure 1 that from 2010 to 2019, developed countries represented by Canada, Belgium, and France gradually expanded their net log exports, while countries represented by Germany and Ethiopia gradually reduced their net log exports, their scale of imports was on the rise, and they became net log importers after 2010. The increase in the scale of imports in these countries may be related to the expansion of domestic demand and the lack of supply capacity. In the role of the log trade, Mexico, Spain, Norway, and other countries transformed from net importers to net exporters. At the same time, the world’s major log importing countries, such as China, India, Finland, etc., still had a high degree of log importing dependence, and the upward trend was notable. China and India are typical developing countries with large population., and their per capita forest stock is far below the world average. Still, there is also a certain gap between the sustainable forest management capacity and developed countries. In addition, a series of forest protections have been implemented to protect the ecological environment. The policy has caused a large amount of domestic log demand to be met through imports. Russia, Australia, the United States, and other countries have consistently ranked among the top globally regarding log exports, due to their rich forest resources and advanced sustainable forest management.
In summary, no matter the trade ties or trade scale, a series of changes took place in the GLTN from 2010 to 2019. These changes may be caused by changes in countries’ resource endowments, forest management level, and economic development level, or maybe due to changes in the supply and demand mechanism of the log market, such as the promotion and application of forest certification systems, which have forced countries to change their positions in the GLTN. However, to what extent has the GLTN changed? Do the above factors have an impact on the evolution of the GLTN? What other factors have contributed to the development of the GLTN? These problems are still unknown, hence the subsequent attempts to explore the above issues with the help of stochastic actor-oriented models.

3.2. The Results of the Dynamic Evolution of the Log Trade Network

According to the previous assumptions and the requirements of the stochastic actor-oriented models, this paper analyzed the dynamic development of the GLTN. The estimated results of the model are shown in Table 4 below, where Model 1 is the most basic, parsimonious model.
As presented in Table 4, it can be seen that after 3675 iterations, the result of Model 1 is obtained, and the overall maximum convergence ratio is 0.2207, which is less than the threshold of 0.25 [22], indicating that Model 1 has a good convergence. For the network’s endogenous structure effects, the rate effect is significantly positive, indicating that more ties in the GLTN have changed over time. Moreover, the change rate during 2010–2015 is faster and more significant than that during 2015–2019 year. The negative, significant coefficient (−3.1359) for the outdegree effect indicates that countries tend to avoid forming too many log export ties over time. The reciprocity is significantly positive, showing that countries tend to develop complementary trade ties [26]. Three-cycles are significantly positive, indicating that governments tend to avoid forming a ternary closure in the GLTN, and the trade network is more open. The GWESP (geometrically weighted edgewise shared partners) effect is used to account for transitive closure, that is, the tendency for friends of friends to be friends [22]. The positive and significantly coefficient of the GWSEP effect in Model 1 indicates that there is a strong tendency toward transitive closure.
The behavioral variable CER ego is significant at the 5% level and its coefficient is 0.0564, while the coefficient of CER alter is −0.0934 and significant at the 1% level, indicating that a country with more certified forest area has a positive and significant tendency to form a new log export tie, as well as a lower probability of forming an import tie with the outside world. Therefore, Hypothesis 1 is valid. In addition, in the behavioral evolution equation, the rate function of the certified forest area is significantly positive, indicating that the certified forest area of each country changed rapidly and the change rate (0.5006) during 2010–2015 was greater than that during 2015–2019.
Model 1 also shows a strong support for H2. We verified the impact of the TII on the relation between certified forest area and the evolution of the GLTN’s structure by constructing the interaction term TII ego × CER alter. The model results show that the coefficient of TII ego × CER alter is −0.0077, which is significant at the 5% level, indicating that the TII has a significant negative moderating effect on the relation between the certified forest area and the evolution of the GLTN, that is, countries characterized as having more certified forest areas tend to decrease their import ties with log net exporting countries, thus H2 is proved. In the behavioral evolution equation, the rate function of the TII is significantly positive, and the change rate in period 1 is less than that in period 2, indicating that the TII of various countries changed rapidly from 2010 to 2019 and confirming the analysis result of TII’s evolution in Section 3.1.
Based on Model 1, Model 2 further adds the per capita forest stock and GDP per capita (GDPP) to analyze the factors affecting the evolution of the GLTN. The overall maximum convergence ratio is 0.2124, and the iteration steps is 4084. The results of endogenous network variables in Model 2 are consistent with the previous models. The coefficient of behavioral variable FSP is significantly negative at the 1% level, and FSP ego is particularly positive at the 1% level, indicating that countries with more forest stock are more inclined to establish log export ties with the other countries, while avoiding the establishment of import ties with the others over time. It is worth noting that countries with similar forest stock also tend to establish trade ties. The possible reason is that the status of each country is different and there are differences in tree species. Therefore, there is some intraindustry trade in logs. The GDPP is significantly negative at the 1% level, while the GDPP similarity is particularly optimistic at the significance level of 1%, indicating that countries with a higher economic level avoid forming importing ties with the outside world. At the same time, trade ties are easier to be established with countries under similar levels of economic development.
To further test the stability of the model, Model 3 and Model 4 were tested for robustness by adding covariates and replacing key variables. The overall maximum convergence ratio for both models were less than 0.25, and the iteration steps were 4425 and 4297, respectively. The specific results are shown in Table 4. It can be seen from Model 3 that by adding geographic distance, cultural distance, and FTA network, the model assumptions are verified. In addition, the coefficient of DIS is −0.0418, which is significantly negative at the 1% level, indicating that geographic distance has a significant negative impact on the formation of log trade ties, that is, geographical distance is not conducive to the establishment of log trade ties between countries [27]. LAN is significantly positive at the 1% significance level, indicating that cultural distance has a significant positive impact on the formation of log trade ties. The closer the cultural space, the easier it is for countries to establish trade ties. This is the same as the research conclusions of Zhou [28]. Moreover, an FTA significant positively affects the formation of log trade ties (0.0122, p < 0.1), indicating that when countries are located in the same FTA, it is easier to establish trade ties, and this conclusion further confirms the existing research of Zhou et al. [2].
In Model 4, the variable of certified forest area was replaced with the number of chains of custody certificates (COC) to test the robustness of the model. The COC aim at all aspects of forest product production and processing enterprises, including the transportation, processing to the circulation of logs, and the chain of custody so that consumers can track through certification labels whether the raw materials of forest products purchased are from sustainably managed forests. As a part of the forest certification, chains of custody certification have been recognized by scholars for its impact on the international trade of wood products [29], and it has particular significance to introduce it as a proxy variable of forest certification into the model. The model results are shown in Model 4 in Table 4. It can be seen from Model 4 that all research hypotheses passed the test, indicating that the model is relatively robust.

4. Discussion

A strong perception concerning the current wave of globalization is that the characteristics of international trade have changed over time, with an acceleration of modifications occurring in the last decades [1]. The GLTN is part of a complex economic system: the behavior of any node in the network is not only affected by its own factors, but also by the factors of its trading partners and the trading partners’ partners. Therefore, when the trade scale of a country (region) changes, this change will affect its direct trading partners through trade ties, and furthermore, affect trading partners’ partners through trading partners, and so on, until it affects the whole trade network. In addition, this dynamic evolution is more compounded when multiple countries simultaneously change their trade behavior. Traditional factors affecting international trade, such as the economy, society, culture, procedures, and policies, all affect its dynamic evolution. In addition, because the supply of log is highly dependent on the endowment of forest resources and is closely related to ecological construction, the forest certification system based on market access also has a significant impact on the GLTN [10].
Altogether, Models 1–4 underscore the significant influence of forest certification on the dynamic evolution of the GLTN. Countries characterized as more certified forest areas tend to avoid forming log import trade ties over time, and the trade imbalance index has a significant negative adjustment effect on the certified forest area and the evolution of the GLTN, that is, countries characterized as having more certified forest areas tend to decrease their import ties with log net exporting countries. Forest certification is one of the manifestations of a country’s capacity for sustainable forest management [30], and a higher forest certification rate means a higher level of sustainable forest management, while a stronger sustainable management capability means a sustainable supply capacity of logs. On the other hand, the certified forest area of a country is related to its forest stock to a certain extent; the more the certified forest areas in a country, the richer its forest resources, and the relatively smaller import demand for external logs, so the probability of establishing a log import trade relationship with other countries is relatively low.
Moreover, countries with closer cultural distances are more likely to form log trade ties, and this conclusion further confirms the existing research of Felbermayr and Toubal [31]. As a direct manifestation of national spirit, culture affects trade mainly through two ways: reducing trade costs and increasing affinity parameters [32]. Different cultural backgrounds increase the difficulty of economic communication and are not conducive to cross-border market activities [28]. In recent years, the view that cultural similarity significantly affects trade flows has achieved a broad consensus [33].
Countries with farther geographical distances are less likely to create log trade ties. The research on the influence of geographical distance on trade can be traced back to 1962. Tinbergen verified in the gravity model that geographical distance has a negative impact on the international trade between the two countries. Since then, this conclusion has been confirmed by many scholars [34]. Although with the advancement and development of science and technology, the efficiency of the global logistics system has been improved, and the cost of international transportation has been greatly reduced, resulting in a weakening of the impact of geographic distance on the trade, while this impact still exists, especially for countries with farther geographic distances [2].
Countries with the same FTA number are more likely to develop log trade ties. The FTA is a legally binding contract between two or more countries with the goal to eliminate trade barriers in order to allow products and services to flow freely among countries. The most direct manifestation of FTA’s economic impacts on members is to promote the establishment of trade relations and the expansion of trade scale [35], therefore, FTAs play a significant role in promoting the establishment and deepening of trade management [34].

5. Conclusions

The GLTN is a complex system. Changes in the status or attributes of a country’s network may promote the overall evolution of the network through trade ties. Making full use of this evolution trend will help countries actively adjust their log supply or demand and maximize their benefits. Based on the above conclusions, we can proceed from the following aspects to optimize the GLTN and the log trade structure of each country. First of all, the dynamic adjustment of the worldwide log trade network means new market opportunities. Therefore, governments should adopt various measures to strengthen their relations with trading partners according to their realities and enhance the reciprocity and openness of log trade. Secondly, as a market-oriented measure to deal with illegal logging, forest certification is a manifestation of the ability of sustainable forest management. Therefore, it has a significant impact on the evolution of the GLTN. Therefore, countries with rich forest resources, especially developing countries, should steadily advance the pace of forest certification to meet the international market’s demand for the legality of timber sources and at the same time improve their sustainable forest management capabilities. Thirdly, cultural similarity and FTA networks have a significant role in promoting the establishment of trade ties. Countries should make full use of the regional trade agreements in promoting log trade, continuously expand the log trade circle, and at the same time, deepen mutual cultural exchanges to reduce the transaction cost of log trade to a certain extent.

Author Contributions

Conceptualization, Y.Z. and B.C.; methodology, Y.Z.; software, Y.Z.; validation, Y.Z.; formal analysis, Y.Z. and B.C.; investigation, Y.Z.; resources, Y.Z. and J.C.; data curation, J.C.; writing—original draft preparation, Y.Z.; writing—review and editing, J.C. and B.C.; visualization, Y.Z.; supervision, J.C.; project administration, B.C.; funding acquisition, B.C. All authors have read and agreed to the published version of the manuscript.

Funding

This research was funded by Major Project of National Forestry and Grassland Administration of China (2019132707) and National Natural Science Foundation of China (72073012; 71873016).

Institutional Review Board Statement

Not applicable.

Informed Consent Statement

Not applicable.

Data Availability Statement

The data were selected from “UN Comtrade Database” at https://comtrade.un.org.cn (accessed on 10 December 2021), “World Bank Database” at https://data.worldbank.org.cn (accessed on 10 February 2022), “Food and Agriculture Organization” at http://www.fao.org.cn (accessed on 10 February 2022), “CEPII Database” at http://www.cepii.fr (accessed on 10 February 2022) and https://fsc.org/en/facts-figures (accessed on 10 February 2022).

Conflicts of Interest

The authors declare no conflict of interest.

References

  1. Benedictis, L.D.; Tajoli, L. The World Trade Network. World Econ. 2011, 34, 1417–1454. [Google Scholar] [CrossRef]
  2. Zhou, Y.Y.; Hong, Y.P.; Cheng, B.D.; Xiong, L.C. The spatial correlation and driving mechanism of wood-based products trade network in RCEP countries. Sustainability 2021, 13, 10063. [Google Scholar] [CrossRef]
  3. Fujita, M.; Krugman, P.; Venables, A.J. The spatial economy: Cities, regions, and international trade. Mit Press Books 2001, 1, 283–285. [Google Scholar]
  4. Long, T.; Pan, H.X.; Dong, C.; Qin, T.; Ma, P. Exploring the competitive evolution of global wood forest product trade based on complex network analysis. Physica A 2019, 525, 1224–1232. [Google Scholar] [CrossRef]
  5. Pendrill, F.; Persson, U.M.; Godar, J.; Kastner, T.; Moran, D.; Schmidt, S.; Richard, W. Agricultural and forestry trade drives large share of tropical deforestation emissions. Glob. Environ. Chang. 2019, 56, 1–10. [Google Scholar] [CrossRef]
  6. Chen, J.; Innes, J.L.; Tikina, A. Private cost-benefits of voluntary forest product certification. Int. For. Rev. 2010, 12, 1–12. [Google Scholar] [CrossRef]
  7. Rametsteiner, E.; Simula, M. Forest certification—An instrument to promote sustainable forest management? J. Environ. Manag. 2003, 67, 87–98. [Google Scholar] [CrossRef]
  8. Ebeling, J.; Yasué, M. The effectiveness of market-based conservation in the tropics: Forest certification in Ecuador and Bolivia. J. Environ. Manag. 2009, 90, 1145–1153. [Google Scholar] [CrossRef]
  9. Hain, H.; Ahas, R. Can forest certification improve forest management? Case study of the fsc certified estonian state forest management centre. Int. For. Rev. 2007, 9, 759–770. [Google Scholar] [CrossRef]
  10. Chen, J.J.; Wang, L.H.; Li, L.C.; Magalhes, J.; Song, W.M.; Lu, W.M.; Xiong, L.C.; Chang, W.; Sun, Y. Effect of forest certification on international trade in forest products. Forests 2020, 11, 1270. [Google Scholar] [CrossRef]
  11. Wang, Y.B.; Cheng, B.D. Influence factors to the formation of the world log trade network: A macro network perspective. World For. Res. 2021, 34, 8–12. [Google Scholar]
  12. Zhou, M.; Wu, G.; Xu, H.L. Structure and formation of top networks in international trade, 2001–2010. Soc. Netw. 2016, 44, 9–21. [Google Scholar] [CrossRef]
  13. Prell, C.; Feng, K. The evolution of global trade and impacts on countries’ carbon trade imbalances. Soc. Netw. 2016, 46, 87–100. [Google Scholar] [CrossRef]
  14. Lospinoso, J.A.; Schweinberger, M.; Snijders, T.A.B.; Ripley, R.M. Assessing and accounting for time heterogeneity in stochastic actor oriented models. Adv. Data Anal. Classif. 2010, 5, 147–176. [Google Scholar] [CrossRef] [Green Version]
  15. Prell, C.; Sun, L.X.; Feng, K.S.; He, J.Y.; Hubacek, K. Uncovering the spatially distant feedback loops of global trade: A network and input-output approach. Sci. Total Environ. 2017, 586, 401–408. [Google Scholar] [CrossRef] [PubMed] [Green Version]
  16. Shore, J.C. Market formation as transitive closure: The evolving pattern of trade in music. Netw. Sci. 2016, 4, 164–187. [Google Scholar] [CrossRef] [Green Version]
  17. Espinoza, O.; Buehlmann, U.; Smith, B. Forest certification and green building standards: Overview and use in the U.S. hardwood industry. J. Clean. Prod. 2012, 33, 30–41. [Google Scholar] [CrossRef]
  18. Paluš, H.; Parobek, J.; Šulek, R.; Lichý, J.; Šálka, J. Understanding sustainable forest management certification in slovakia: Forest owners’ perception of expectations, benefits and problems. Sustainability 2018, 10, 2470. [Google Scholar] [CrossRef] [Green Version]
  19. Wang, C.; Huang, X.; Lim, M.K.; Tseng, M.L.; Ghadimi, P. Mapping the structural evolution in the global scrap copper trade network. J. Clean Prod. 2020, 275, 122934. [Google Scholar] [CrossRef]
  20. Snijders, T.A.B.; Steglich, C.E.G.; Schweinberger, M. Modeling the co-evolution of networks and behavior. In Longitudinal Models in the Behavioral and Related Sciences; Montfort, K.V., Oud, J., Satorra, A., Mahwah, N.J., Eds.; Lawrence Erlbaum: Mahwah, NJ, USA, 2007; pp. 41–71. [Google Scholar]
  21. Snijders, T.A.B. Stochastic actor-oriented modelss for network dynamics. Annu. Rev. Stat. Appl. 2017, 4, 343–363. [Google Scholar] [CrossRef] [Green Version]
  22. Snijders, T.A.B.; van de Bunt, G.G.; Steglich, C.E.G. Introduction to actor-based models for network dynamics. Soc. Netw. 2010, 32, 44–60. [Google Scholar] [CrossRef]
  23. Kalish, Y. Stochastic actor-oriented modelss for the Co-Evolution of Networks and Behavior: An Introduction and Tutorial. Organ. Res. Methods 2019, 23, 511–534. [Google Scholar] [CrossRef]
  24. Balland, P.A.; Vaan, M.D.; Boschma, R. The dynamics of interfirm networks along the industry life cycle: The case of the global video game industry, 1987–2007. J. Econ. Geogr. 2013, 13, 741–765. [Google Scholar] [CrossRef]
  25. Knoke, D. Reviewed Work: Social Network Analysis: Methods and Applications. by Stanley Wasserman, Katherine Faust. Cont. Sociol. 1996, 25, 275–276. [Google Scholar] [CrossRef]
  26. Garlaschelli, D.; Loffredo, M.I. Structure and evolution of the world trade network. Physica A 2005, 355, 138–144. [Google Scholar] [CrossRef] [Green Version]
  27. Fagiolo, G. The international-trade network: Gravity equations and topological properties. J. Econ. Interact. Coord. 2010, 5, 1–25. [Google Scholar] [CrossRef] [Green Version]
  28. Zhou, M. Intensification of geo-cultural homophily in global trade: Evidence from the gravity model. Soc. Sci. Res. 2011, 40, 193–209. [Google Scholar] [CrossRef]
  29. Guan, Z.; Xu, Y.; Sheong, J.I.P. The impact of application of fsc chain of custody certification on global wood products trade. Eur. J. Wood Wood Prod. 2019, 77, 633–643. [Google Scholar] [CrossRef]
  30. Newsom, D.; Bahn, V.; Cashore, B. Does forest certification matter? An analysis of operation-level changes required during the SmartWood certification process in the United States. For. Policy Econ. 2006, 9, 197–208. [Google Scholar] [CrossRef]
  31. Felbermayr, G.J.; Toubal, F. Cultural proximity and trade. Eur. Econ. Rev. 2010, 54, 279–293. [Google Scholar] [CrossRef] [Green Version]
  32. Hofstede, G.J.; Jonker, C.M.; Meijer, S.; Verwaart, T. Modelling trade and trust across cultures. Int. Conf. Trust Manag. 2006, 3986, 120–134. [Google Scholar]
  33. Tian, H.; Jiang, C.C. Effect of national cultural distance on China’s foreign trade: Data analysis of 31 countries and regions’ trade based on gravity model. J. Int. Trade 2012, 38, 45–52. [Google Scholar]
  34. Nasrullah, M.; Liu, C.; Khan, K.; Rizwanullah, M.; Zulfiqar, F.; Ishfaq, M. Determinants of forest product group trade by gravity model approach: A case study of china. For. Policy Econ. 2020, 113, 102117. [Google Scholar] [CrossRef]
  35. Baier, S.L.; Bergstrand, J.H.; Vidal, E. Free Trade Agreements in the Americas: Are the Trade Effects Larger than Anticipated? World Econ. 2007, 30, 1347–1377. [Google Scholar] [CrossRef]
Figure 1. The evolution of the trade imbalance index (TII).
Sustainability 14 08229 g001
Table 1. Descriptive statistical analysis of variables.
201020152019
MinimumMaximumMeanMinimumMaximumMeanMinimumMaximumMean
NET010.066010.066010.061
TII0.21019.3559.6640.09119.2749.9500.02319.44710.440
Log(FS)0.8457.0884.4180.8457.0854.4210.8457.0814.442
Log(CER)0.0017.5542.0022.7607.7032.0752.3267.7052.039
Log(COC)04.5730.77104.5950.88904.9140.969
Log(GDPP)2.5245.0443.5012.5775.0233.5322.6705.0693.573
Log(DIS)0.00219.9047.8850.00219.9047.8850.00219.9047.885
LAN010.146010.146010.146
FTA010.463010.551010.654
DL142.808142.808142.808
Table 2. Network effects and their interpretations in the stochastic actor-oriented models.
Network’s Structure EffectStatisticsMeaning
Outdegree effect j x i j The general tendency to form outgoing ties
Reciprocity j x i j x j i The tendency to become symmetric
GWESP forward x i j e α { 1 ( 1 e α ) h = 1 n x i h x h j } The tendency whereby a tie is formed from actor i to j
3-cycles i , h x i j x j h x i h Friend’s friends are my friends
Transitive ties j x i j m a x h ( x i h x h j ) Two nodes are connected through an intermediary
Node Attribute EffectNetwork StatisticsMeaning
V-ego j x i j x i n Nodes with higher attribute values are more active
V-alter j x i j x n j Nodes with higher attribute values are more popular
V-similarity j x i j ( s i m i j v n s i m ^ v n ) Nodes with similar attribute values tend to form ties
Table 3. The overall structure characteristics of the GLTN.
YearNumber of NodesUnweighted DensityWeighted DensityTiesClustering CoefficientReciprocityAverage Path Distance
20101720.0656511,192.656319290.4500.18932.499
20151720.0660572,199.437519410.4570.19592.477
20191720.0612601,425.062518010.4850.20232.454
Table 4. Model results.
Model 1Model 2Model 3Model 4
Network DynamicsEst.SEEst.SEEst.SEEst.SE
1. rate (period 1)19.0001 ***(0.856)19.5572 ***(0.9256)20.1806 ***(0.985)19.6714 ***(1.0421)
2. rate (period 2)17.0977 ***(0.66)17.4787 ***(0.8627)17.8377 ***(1.7004)17.5079 ***(0.8039)
3. eval outdegree (density)−3.1359 ***(0.0724)−3.2904 ***(0.1081)−3.4241 ***(0.0981)−3.517 ***(0.1194)
4. eval reciprocity0.7298 ***(0.0704)0.7148 ***(0.0883)0.593 ***(0.1359)0.5887 ***(0.0868)
5. eval 3-cycles0.0569 ***(0.0111)0.0503 ***(0.0109)0.0383 ***(0.0109)0.0337 **(0.0134)
6. eval transitive ties0.0744(0.1142)0.1243(0.1075)0.11550.12880.0987(0.1314)
7. eval GWESP 1.2406 ***(0.0648)1.2002 ***(0.0733)1.2526 ***(0.0896)1.197 ***(0.0659)
8. eval Distance −0.0418 ***(0.008)−0.0474 ***(0.0056)
9. eval language 0.4902 ***(0.0581)0.541 ***(0.0644)
10. eval FTA 0.0122 *(0.0073)0.0149 **(0.0064)
11. eval CER alter−0.0934 ***(0.029)−0.044(0.0346)−0.0263(0.0301)−0.2533 ***(0.0552)
12. eval CER ego0.0564 **(0.0281)0.0468 *(0.0276)0.0531 *(0.0323)0.0603 *(0.0315)
13. eval TIR alter−0.0187 ***(0.0032)−0.0168 ***(0.0045)−0.0199 ***(0.0051)−0.0198 ***(0.0057)
14. eval TIR ego0.0205(0.0034)0.0181 ***(0.0038)0.0167 ***(0.0061)0.0056(0.0053)
15. eval GDPP alter −0.1671 ***(0.0377)−0.1866 ***(0.0398)−0.314 ***(0.0591)
16. eval GDPP ego −0.0509(0.0493)−0.0942(0.0648)−0.0854 **(0.0406)
17. eval GDPP similarity 0.3743 ***(0.1239)0.3441(0.223)0.3857 ***(0.1146)
18. eval FSP alter −0.2115 ***(0.0378)−0.187 ***(0.0433)−0.1442 ***(0.0425)
19. eval FSP ego 0.1852 ***(0.0413)0.2003 ***(0.0417)0.2336 ***(0.0422)
20. eval FSP similarity 1.4221 ***(0.2485)1.2492 ***(0.2444)1.1885 ***(0.2492)
21. eval int. TIR ego × CER alter−0.0077 **(0.0039)−0.0101 **(0.0046)−0.0105*(0.0055)−0.0132 **(0.0052)
Behavior Dynamics
22. rate CER (period 1)0.5006 ***(0.1423)0.5052 ***(0.1302)12.159 ***(3.9489)15.571 ***(5.0897)
23. rate CER (period 2)0.218 ***(0.072)0.2191 **(0.1120)15.9915(13.6201)21.5424 **(9.5521)
24. rate TIR (period 1)15.5398 ***(2.7524)15.5998 ***(3.5769)0.0045(0.0066)0.8913 ***(0.1896)
25. rate TIR (period 2)21.3454 ***(3.7905)21.4743 ***(8.1609)0.1583(0.1366)0.395 ***(0.1118)
Convergence ratio0.22070.21240.19080.2256
Iteration steps3675408444254297
*** Significant at the 1% level, ** significant at the 5% level, * significant at the 10% level.
Publisher’s Note: MDPI stays neutral with regard to jurisdictional claims in published maps and institutional affiliations.

