Abstract
Although many project portfolio management tools have been developed, little has been found capable of evaluating and managing project quality, cost, and schedule simultaneously. Limited cross-project references also limit lessons learned in the context of triple constraints. This study aims to embed quality check into the earned value management (EVM) method and develop an extended tool for triple constraint management based on EVM. The purpose is to evaluate and manage the triple constraints of a project in one go, incorporating quality management and portfolio management functions into costing and scheduling. The newly developed tools are tested and validated in real-world case studies. It was proven to assist project portfolio stakeholders in triple constraints planning, organizing, monitoring, managing, and reporting using a single reporting format.
1. Introduction
Project scheduling tools such as Earned Value Management (EVM), S-Curve, Gantt Chart, Balanced Scorecard, Program Evaluation, Review Technique (PERT), and Critical Path Method (CPM) have been designed to measure project performance and business excellence [1,2,3]. These scheduling tools were designed in different contexts; for example, EVM focuses on cost and schedule management [4,5]; S-Curve and Gantt’s chart concentrates on schedule management [6,7]; Balanced Scorecard focuses on quality performance and customer satisfaction [8]; while PERT and CPM focus only on time management [9]. Very few of the existing scheduling tools are can manage triple constraints such as schedule, cost, and quality in a single setting [10,11]. Most existing scheduling tools focus only on cost and schedule constraints rather than the quality constraint, or vice versa; example of this are the Construction Quality Assessment System (CONQUAS®), QLASSIC, and Performance Assessment Scoring System (PASS) [12]. Building and Construction Authority, Singapore, developed CONQUAS®, which was widely adopted in Singapore, Hong Kong, and Malaysia. The Construction Industry Development Board, Malaysia, developed QLASSIC; it is only used in Malaysia. PASS was produced by Hong Kong Housing Authority, and it is only used in Hong Kong [13,14]. These tools mainly focused on the quality constraints with limited integration with other constraints such as schedule and cost in the triple constraints context [15].
Most organizations are engaged in multiple projects at a time [16,17,18,19]. The capability and efficiency of organizations in managing multiple projects have become critical success factors. Project Portfolio Management (PPM) is a highly recognized approach to managing multiple projects [19,20,21]. Effective PPM encounters challenges such as delayed projects, resource struggles, stress, and a lack of overview for projects within the same portfolio in implementation [18,19,21,22,23]. Given that most organizations are engaged in the multiple projects environment, the scheduling failure at the portfolio level could directly affect the entire business [24]. This study aims to develop a quality-embedded scheduling tool for portfolio earned value monitoring and forecasting (QST-EVM) to cover all three constraints on portfolio excellence. Specifically, this study combines existing quality management tools with cost and schedule management measures, utilizes EVM’s superior cost and schedule management methods, and treats quality inspection as a new extension of EVM to form a combination of quality, cost, and schedule under a triple management method, as a concise approach to triple constraint management. The proposed approach would be a major change in the current PM industry, especially in the construction industry. First of all, the model can measure and describe the quality, cost and schedule of construction projects homogeneously, so as to realize the comprehensive evaluation of project objectives. Second, the model refines the functions of the EVM under triple constraints and combines the quality of the project for triple management supervision. As a result, project managers in the construction industry can use a single tool for triple constraint management, as well as better project management, compared to existing methods. Finally, this study examines the extension by using scenario analysis and real-world case studies to validate its functionality for triple constraint management. Following the validation process, this study will transition the triple constraint management tool from a single project to a PPM environment to achieve triple constraint for project portfolio management.
2. Existing Schedule, Quality, and Cost Management Tools
During a business project execution, regular and timely reviews are essential to evaluate the project’s progress and effectiveness [25,26]. Existing tools, such as the earned value management (EVM) tool, can measure the cost and schedule performance of a project [27]. EVM has been proven as one of the most useful tools for project planning, organizing, controlling, and monitoring [28,29,30]. Looking at the functionality of EVM in the context of the triple constraints, it has covered two out of three constraints, which are schedule management and cost management [31]. Although some scholars have proposed several extensions of the classic EVM, for example, Earned Schedule [32,33], Earned Duration [33], Earned Duration Management [34], and Fuzzy Earned Value [31,35], EVM has yet to come close to neither the quality management nor the end of its potential extensions [4]. Therefore, this study identified EVM as part of the foundation of the developed triple constraints management tool.
On the other hand, a few existing quality management tools, such as CONQUAS®, QLASSIC, and PASS, are compared in Table 1. CONQUAS® is the pioneer of these three tools, and the other two were inspired by it. CONQUAS® is also the most widely adopted one [36]. Therefore, this research targeted embedding CONQUAS® into EVM as part of the foundation of the triple constraints management tool being developed.

Table 1.
Comparison between QLASSIC, PASS and CONQUAS®.
Notably, EVM is a highly flexible yet comprehensive tool for cost and schedule management [28]. It has been enhanced to many different versions to increase efficiency and effectiveness [37]. Although it has been improved in various ways, its core has remained unchanged [27]. The core of EVM is based on three essential variables, namely Planned Value (PV), Actual Cost (AC), and Earned Value (EV) [2,29]. Different kinds of literature have different appellations for these three metrics; for instance, PV is also recognized as Budgeted Cost of Work Scheduled (BCWS), AC is also known as Actual Cost of Work Performed (ACWP); and EV is also distinguished as Budgeted Cost of Work Performed (BCWP) [28]. Generally, PV is the authorized budget planned for the physical work that should have been accomplished [38,39,40], AC is the realized cost incurred for the work performed on an activity during a specific time [29,38,39,41,42], and EV is the budget associated with the authorized work that has been completed [32,38,39,40]. A detailed explanation for these metrics and their expansion can be found in PMBOK 6th edition [38], Practice Standard for Earned Value Management [43], Program Analysis Pamphlet [40], and Project Management Guidelines [44].
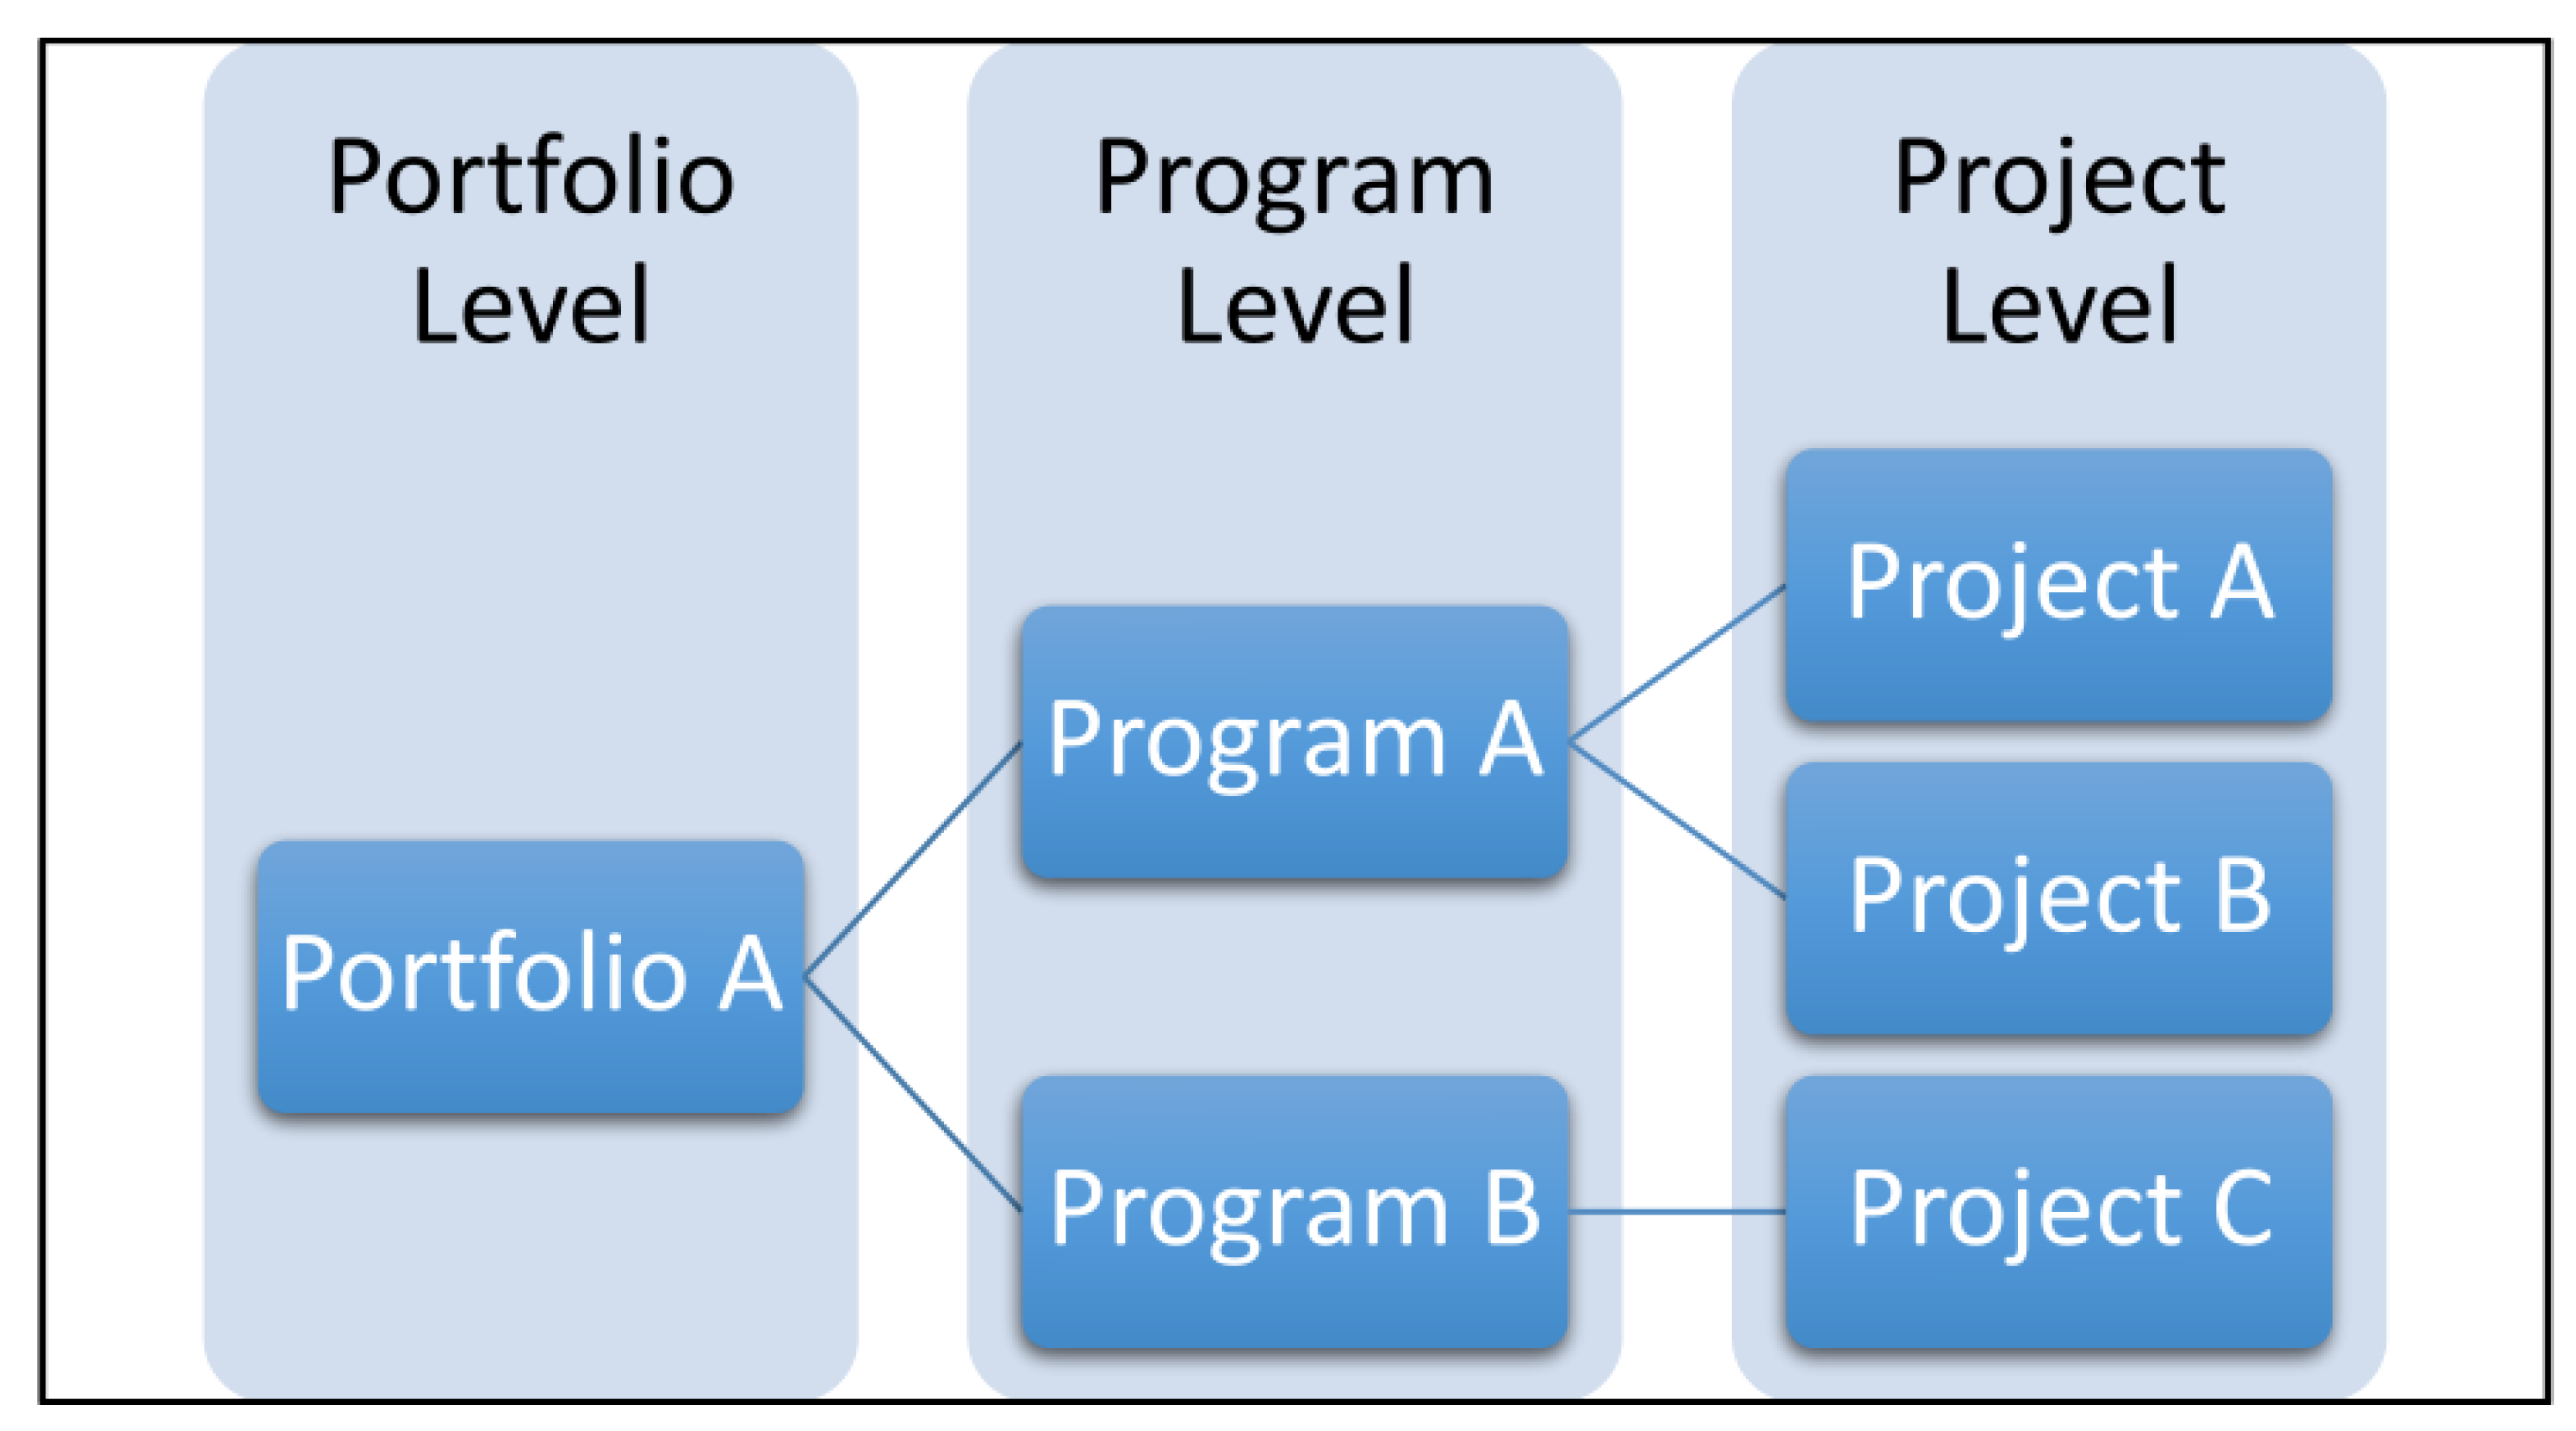
Furthermore, this study also extends the capabilities of the proposed model to the portfolio environment. This is to help organizations with cross-project management and resource allocation. Portfolio refers to projects, programs, sub-portfolios, and operations managed as a whole to achieve the same strategic goals. Figure 1 illustrates the relationship between portfolios, programs, and projects. Portfolio management includes managing resources and other constraints, coordinating project teams, and managing interfaces between projects. The focus is on configuring projects and programs according to organizational strategy and balancing the risks and benefits of a portfolio of projects. Due to the uncertainty and uniqueness of the construction industry, the progress forecasting of individual construction projects is a complex process. A portfolio is a closely coordinated set of related projects for high control and more efficient performance. Initial risk assessments and ongoing information updates in the portfolio lead to high-performance progress on projects that might not be the case when handled in isolation. The result of this improvement is the main motivation for institutions to develop portfolio management. EVM’s newly expanded target outcomes not only enable better planning, organization, control and monitoring of quality management, but also provide the entire triple constraint in the context of projects and portfolios. Project managers in the construction industry can use the proposed model to manage project and portfolio performance in multiple project environments. Specifically, organizations with multiple projects running concurrently will benefit from managing their projects and portfolios in a single environment.

Figure 1.
Relationships among portfolios, programs, and projects.
3. Research Methods and QST-EVM Tool Development Procedures
Two existing triple constraints management tools, including CONQUAS® and EVM, were identified as part of the QST-EVM tool’s foundation. With EVM metrics, a project’s performance could be identified easily by comparing the achievement with the initial planning. The work performance is measured by comparing the cost baseline and the schedule baseline to generate the performance baseline [38]. EVM uses “value” as the performance measurement metric, and it represents more than just monetary value. Barima [45] urged that value is “the influence of goals and standards”, where the value should be referred to the potential requirements and conviction inclination. For instance, EV is the contact sum multiplied by the schedule to date, and PV is the contract sum multiplied by the target schedule. Since EVM uses “values” and “variables” as basic theory, it is recommended to quantify quality in order to integrate quality management into EVM. The reason for synchronizing quality management with an existing EVM is that it can be monitored using the same technology. Obtaining quality performance by multiplying the quality fraction (%) by the actual cost is one way that triple constraints are implemented in the same environment. We demonstrate the feasibility and reliability of this approach through experiments on four projects; thus, homogenizing quality metrics with cost and schedule metrics is a feasible approach. Therefore, this research suggests that the quality metric should be embedded in the form of “value” instead of money alone. The purpose of embedding the quality metric into the EVM is to enhance the functionality of EVM from two constraints to triple constraints, including quality. The hypothesis suggested a proposed model to overcome the research gaps and achieve the research objectives. With regards to the research objectives, there were three sections of concept development: the first section was to formalize a new quality assessment method to quantify the quality performance; the second section was to integrate the proposed quality assessment method into Earned Value Management (EVM) to formalize a new model, taking into consideration the triple constraints management; the third section was to implement the proposed model into Project Portfolio Management. The concept development processes are illustrated in Figure 2.
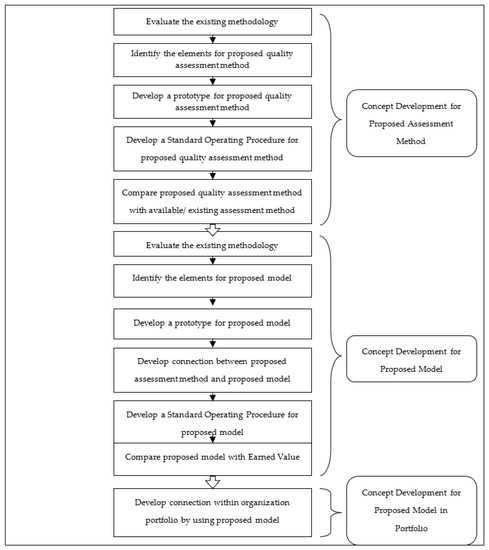
Figure 2.
Concept development processes.
Indeed, CONQUAS® has been widely accepted by many countries [12,46,47]. The objectives of CONQUAS® are: (1) to have a standard quality assessment system for construction projects, (2) to make quality assessment objectives by measuring constructed works against workmanship standards and specifications and using a sampling approach to suitably represent the whole project, and (3) to enable a quality assessment to be carried out systematically within reasonable cost and time [48]. CONQUAS® uses the scoring system as a performance measurement dimension. The scoring will be recorded based on first-time inspections; areas to be inspected are based on a sampling system. Rectification and correction carried out after the assessment will not be re-scored [48]. Furthermore, CONQUAS® uses a weightage system as part of the scoring system. Each quality standard (each component) carries a weight that represents the quality of a building. The weightage system is a compromise between the cost proportions of three components in various buildings, and different types of buildings have different weightage systems.
Traditionally, the quality of a project is judged based on the end product. However, the project success means more than just achieving quality; it encompasses the triple constraints, including time and cost. The shortfall in managing schedule and cost in CONQUAS® makes it an incomplete tool. Given the EVM capacity in schedule and cost management, this study proposed embedding CONQUAS® into the EVM platform to create a new tool to cover the triple constraints management in a single setting. In order to ensure that quality management best fits into EVM, this new tool should have new performance metrics using the same concept and similar functions as EVM metrics. This study used the CONQUAS® scoring system to facilitate this purpose.
First and foremost, this research used the quality standard in CONQUAS® to measure a contractor’s quality performed (QP). As a term used in this development, QP refers to the quality that has been achieved by work or an event. In a simple phrase, it is a quality achievement degree to measure the quality performance. CONQUAS® practices periodic inspection whereby the auditor conducts a site inspection only upon request from the project portfolio management team, which is very much related to the sampling system where only selected areas are inspected. It was pointed out that existing methods do not provide details on how sampling selection was made and therefore cannot determine whether the sampling system is representative of the overall quality of the building. Therefore, this study recommends measuring the quality of all construction events and construction components to avoid any deviation or error in localized areas (selected areas). Daily inspections would be more convincing than periodic inspections by weeks or months because it is not practical to expect an external auditor to conduct very frequent inspections. Hence, this study proposed that the daily inspection be performed by an in-house trained auditor, who would inspect and access all work events using CONQUAS®’s quality standard and record scores on the computation sheet. The computation sheet is used to calculate the QP achieved by the contractor.
The in-house trained auditor registers all scores of QP achieved by the contractor using the following five rules: (a) Each inspection is assigned with a total of 10 scores; each non-compliance or inappropriate work spotted should be deducted from the score accordingly; the achieved score would then be recorded as final attainment for that particular inspection; (b) At any work event at any work area, if the contractor achieves 7 scores or lower, a second inspection is to be conducted upon the rectification work done by the contractor; (c) In the case a work event is required to be inspected for the second time, the final attained would be 70% from the score achieved during the first inspection, and 30% from the score achieved during the second inspection; (d) If a work event fails for both the first and second inspection, the final attained for that particular event should be marked as zero due to too many rectification works resulting from the inadequate performance of the contractor; and (e) All work events should be recorded, including repeated events at a different location.
Table 2 shows the scoring of the calculation table by taking structural engineering as an example. The calculation table score is formalized in Microsoft Excel, and the rules for the calculation table are as follows: (1) The weight of each item is obtained from the results of the qualitative analysis. (2) The maximum score for one inspection per location is 10 points. (3) If a work scores less than 8 points, a second inspection is required. (4) If a work does not receive a score of 8 and above on the first inspection, the calculation sheet score will appear as “false” in the subtotal column, as this is a violation of the general rules. (5) If a work has been inspected twice, the final score achieved will be 70% of the first inspection score plus 30% of the second inspection score. This calculation is meant to show that no matter how good the rectification work is, the best construction method is doing things right the first time. (6) If neither the 1st nor the 2nd examination achieves a score of 8 and above, the 3rd examination will be considered as zero. The reason is that there is too much rectification work, indicating that the quality of the work is not good. (7) The QP score per item is the average score per position (not per inspection) multiplied by the item’s weight. (8) The QP sum of each type of work is shown in the calculation table to facilitate monitoring of the score for each type of work. A full score is the highest score based on a weighting system. It is worth noting that it is necessary to pay attention to the position with a score of zero. Once there is a position with a score of zero, it means that there is a position with seriously unqualified quality in this project. Even if the total score is high, it cannot be treated as a high-quality project. This work of identifying zero can be done quickly using Excel.
Table 2.
Quality performed computation sheet.
The QP computation sheet used the weightage system to convert the scores achieved by the contractor to QP. The weightage system shown in Table 2 was derived from a self-administrated questionnaire distributed to relevant stakeholders. A total of 390 valid responses out of 2000 were collected from the respondents in Malaysia and Singapore. It was noted that the CONQUAS®’s weightage system was also derived from a similar approach [48]. The QP generated would then be implemented into Equation (1), acting as the quality metric embedded in the EVM interface. The newly introduced quality metric, namely Quality Consumption (QCt), is a new “value” to be embedded into the EVM to complete the functionality of the EVM in triple constraints context.
Quality Consumption = (Actual Cost to achieve the quality) × (Quality Performed)
There were two variables in this QCt: Quality Performed (QP) and AC. AC is the same AC as in the EVM methodology, referring to the actual cost of work performed. The concept of QCt is formulated based on the EV concept derived from Equation (2):
EV = Budgeted Cost spent (BC) × Work Performed (%)
The formula for QCt is similar to the EV formula, whereby QCt’s formula substituted the Work Performed for Quality Performed to calculate the contractor’s quality performance. QCt represents the quality that the contractor within the approved budget has earned. The outcome of an end product in QCt is quality consumption. The quality of a product could be determined by comparing a set of inherent characteristics against a set of requirements [49]. Quality refers to a standard, whereas grade refers to features or the characteristics of a material, a service, or a category assigned to deliverables having the same functional use but different technical characteristics.
Hence, all products have their quality value, good or poor. Stakeholders would get what they pay for, and an item’s quality means that it is indeed what it was intended to be [3]. QCt is the new “value” developed by this study to be incorporated into the EVM interface. In addition, a computation tabulation, namely the QST-EVM sheet as per Table 3, was developed for triple constraints management in a single setting, which is an enhanced version of the existing EVM interface, whereby the formula to calculate the metrics and variables of the existing EVM remained unchanged, with some additional equations developed by this study to cover the total quality scope. Table 3 shows a scoring value for an actual project; it is worth noting that a higher AC will lead to a higher QCt, although the quality of the actual execution remains the same (refer to the 3rd and 6th months). Differences in progress do not affect QC values (refer to Months 10 and 11). This is because QC is the actual cost used to achieve quality performance. (1) The variables of PQV are AC and quality target. The higher the AC, the higher the PQV (see Months 4, 6, 10, and 14). Usually, the quality goals will remain the same because the quality goals are set for the entire project. Therefore, the PQV is highly dependent on the AV, since the AV describes the progress of the project work at any given point in the project schedule, the PQV will represent the progress of the project quality work at any given point in the project schedule. (2) QV depends on QC and PQV, and QC is equal to QC minus PQV. When the QP is above the target, a positive QV will be recorded (refer to the 9th and 10th months), if the opposite, a negative QV (refer to the 5th and 6th months) will be recorded. (3) With this in mind, it is important to determine the performance metrics for each constraint. QPI is influenced by cost and quality performance, as observed in Months 4, 6, 9, 12, 16, and 19. QPI is directly affected by AC and QP: when QP is higher than expected, QPI will be greater than 1.00 (refer to Months 31 and 32); when QP is lower than expected, QPI will be less than 1.00 (refer to Months 11 and 12); when QP is the same as expected, QPI will be equal to 1.00 (refer to Months 16 and 34).
Table 3.
QST-EVM sheet.
In order to have better control and monitoring in quality management, quality performance indicators were established and termed Quality Variance (QV) and Quality Performance Index (QPI). A reference point was required to identify QV. Planned Quality Value (PQV) was developed as the budgeted cost of the quality performed, meaning the estimated budget for the physical work that should have been accomplished. As calculated in Equation (3), PQV used the same principle as QCt to identify the budgeted cost of the quality performed:
Planned Quality Value (PQV) = Actual Cost (AC) × Target QP Score (%)
Not all stakeholders would require their end products to score 100% in quality. For example, the project stakeholders might only request the building to achieve 70% of quality for a low-cost housing building. As a project progresses, there is a possibility that the quality target has to be changed due to stakeholder requests for better quality or stakeholders compromising the quality requirement for other constraints. This change could be done and registered into the proposed QST-EVM sheet for control and monitoring purposes. Further to that, two more tracking indicators to track the performance of quality, namely Quality Variance (QV) and Quality Performance Index (QPI), were developed, and the formulas to calculate QV and QPI are in Equations (4) and (5):
Quality Variance (QV) = Quality Consumption (QCt) − Planned Quality Value (PQV)
Quality Performance Index (QPI) = Quality Consumption (QCt)/Planned Quality Value (PQV)
QV describes the gap between the actual quality performed against the planned quality. QPI describes the performance index of the quality performed against its planned quality. The functions of these two indicators were used to monitor the quality performance of a project and to indicate variance between planned quality and the actual quality performance. Through these two performance indicators, project stakeholders can quickly identify the quality performance of a project portfolio to make an informed decision either to add in more resources or to withdraw resources from the project portfolio.
4. Results and Case Study
4.1. Standard Operating Procedures (SOPs) of Developed QST-EVM System
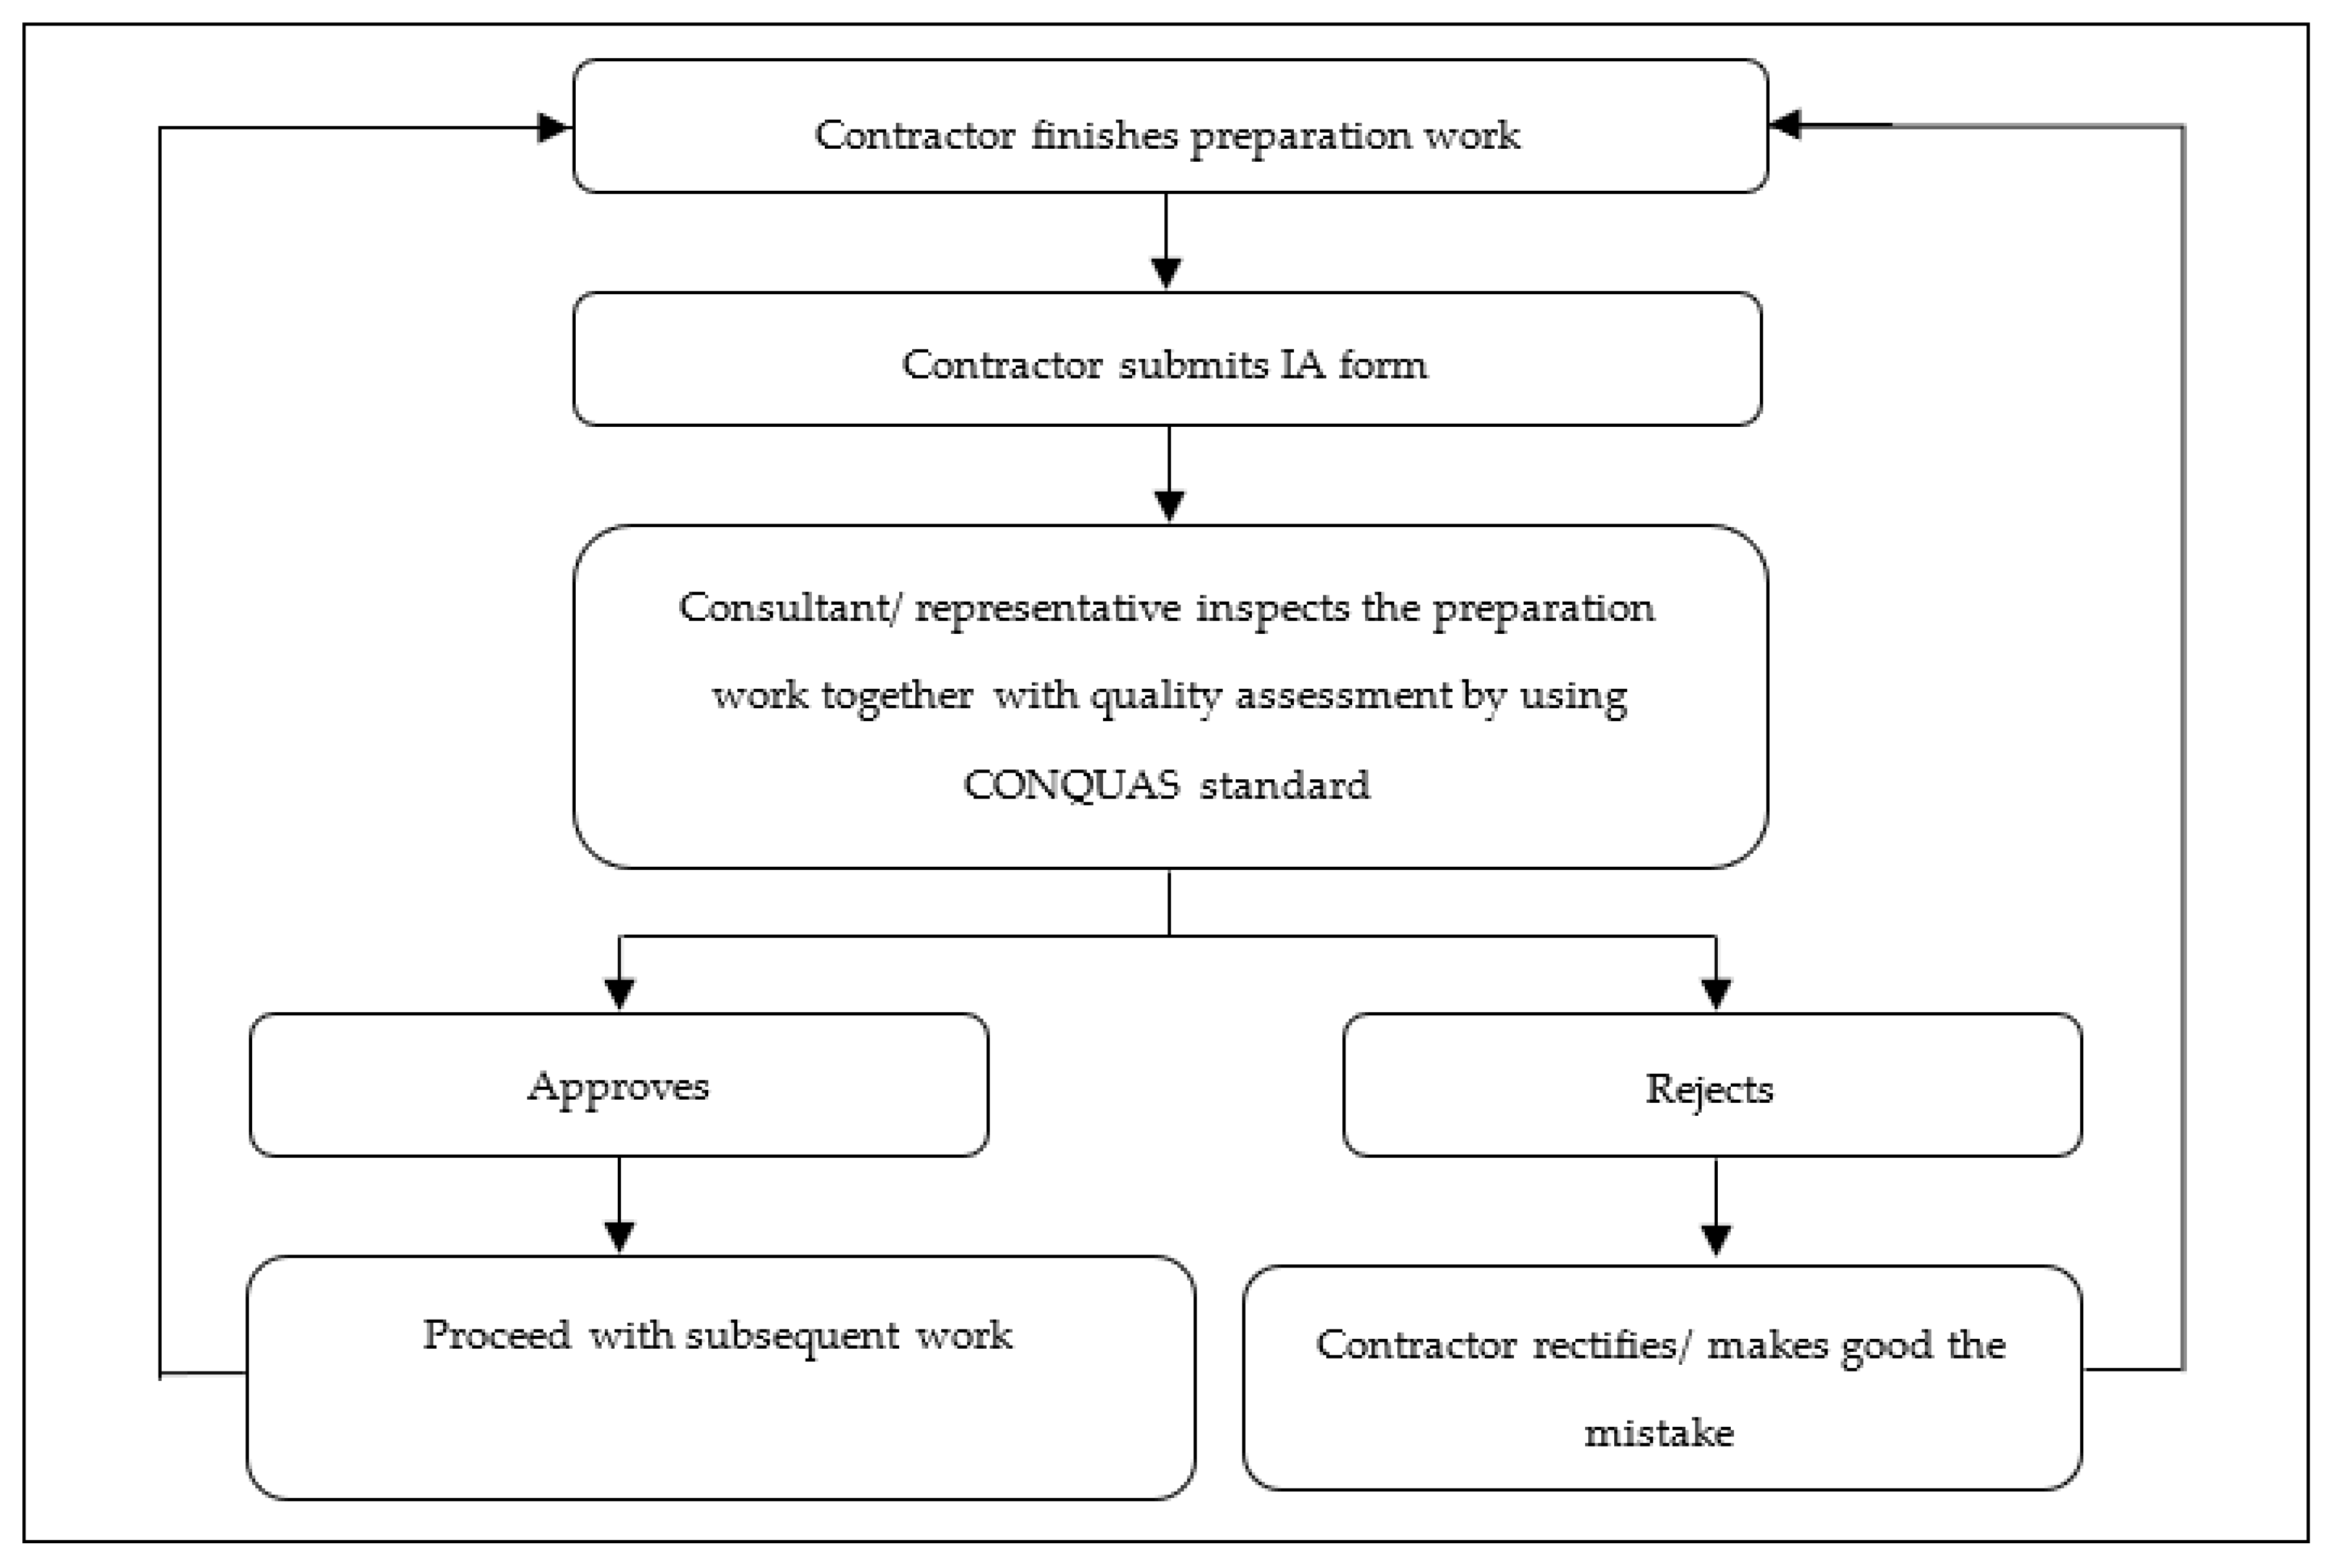
A few simple steps were required to conduct the inspection and collect the quality scores (quality performed by the contractor). Upon collecting the quality scores, they were typed into a computation sheet to calculate the overall quality scores achieved by the project. Figure 3 illustrates the SOPs to inspect by QST-EVM. The details of each step are as follows:
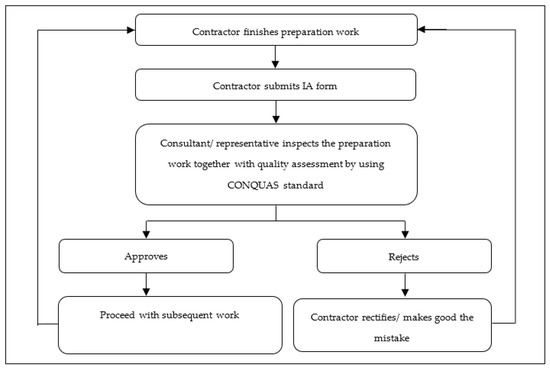
Figure 3.
Standard Operating Procedure for Inspection by QST-EVM.
- Step 1: Contractor finishes preparation work.
The contractor gets ready for the work prior to any inspection. All the preparation works need to be done under the specification stated in the construction drawing.
- Step 2: Contractor submits Inspection Application (IA) form.
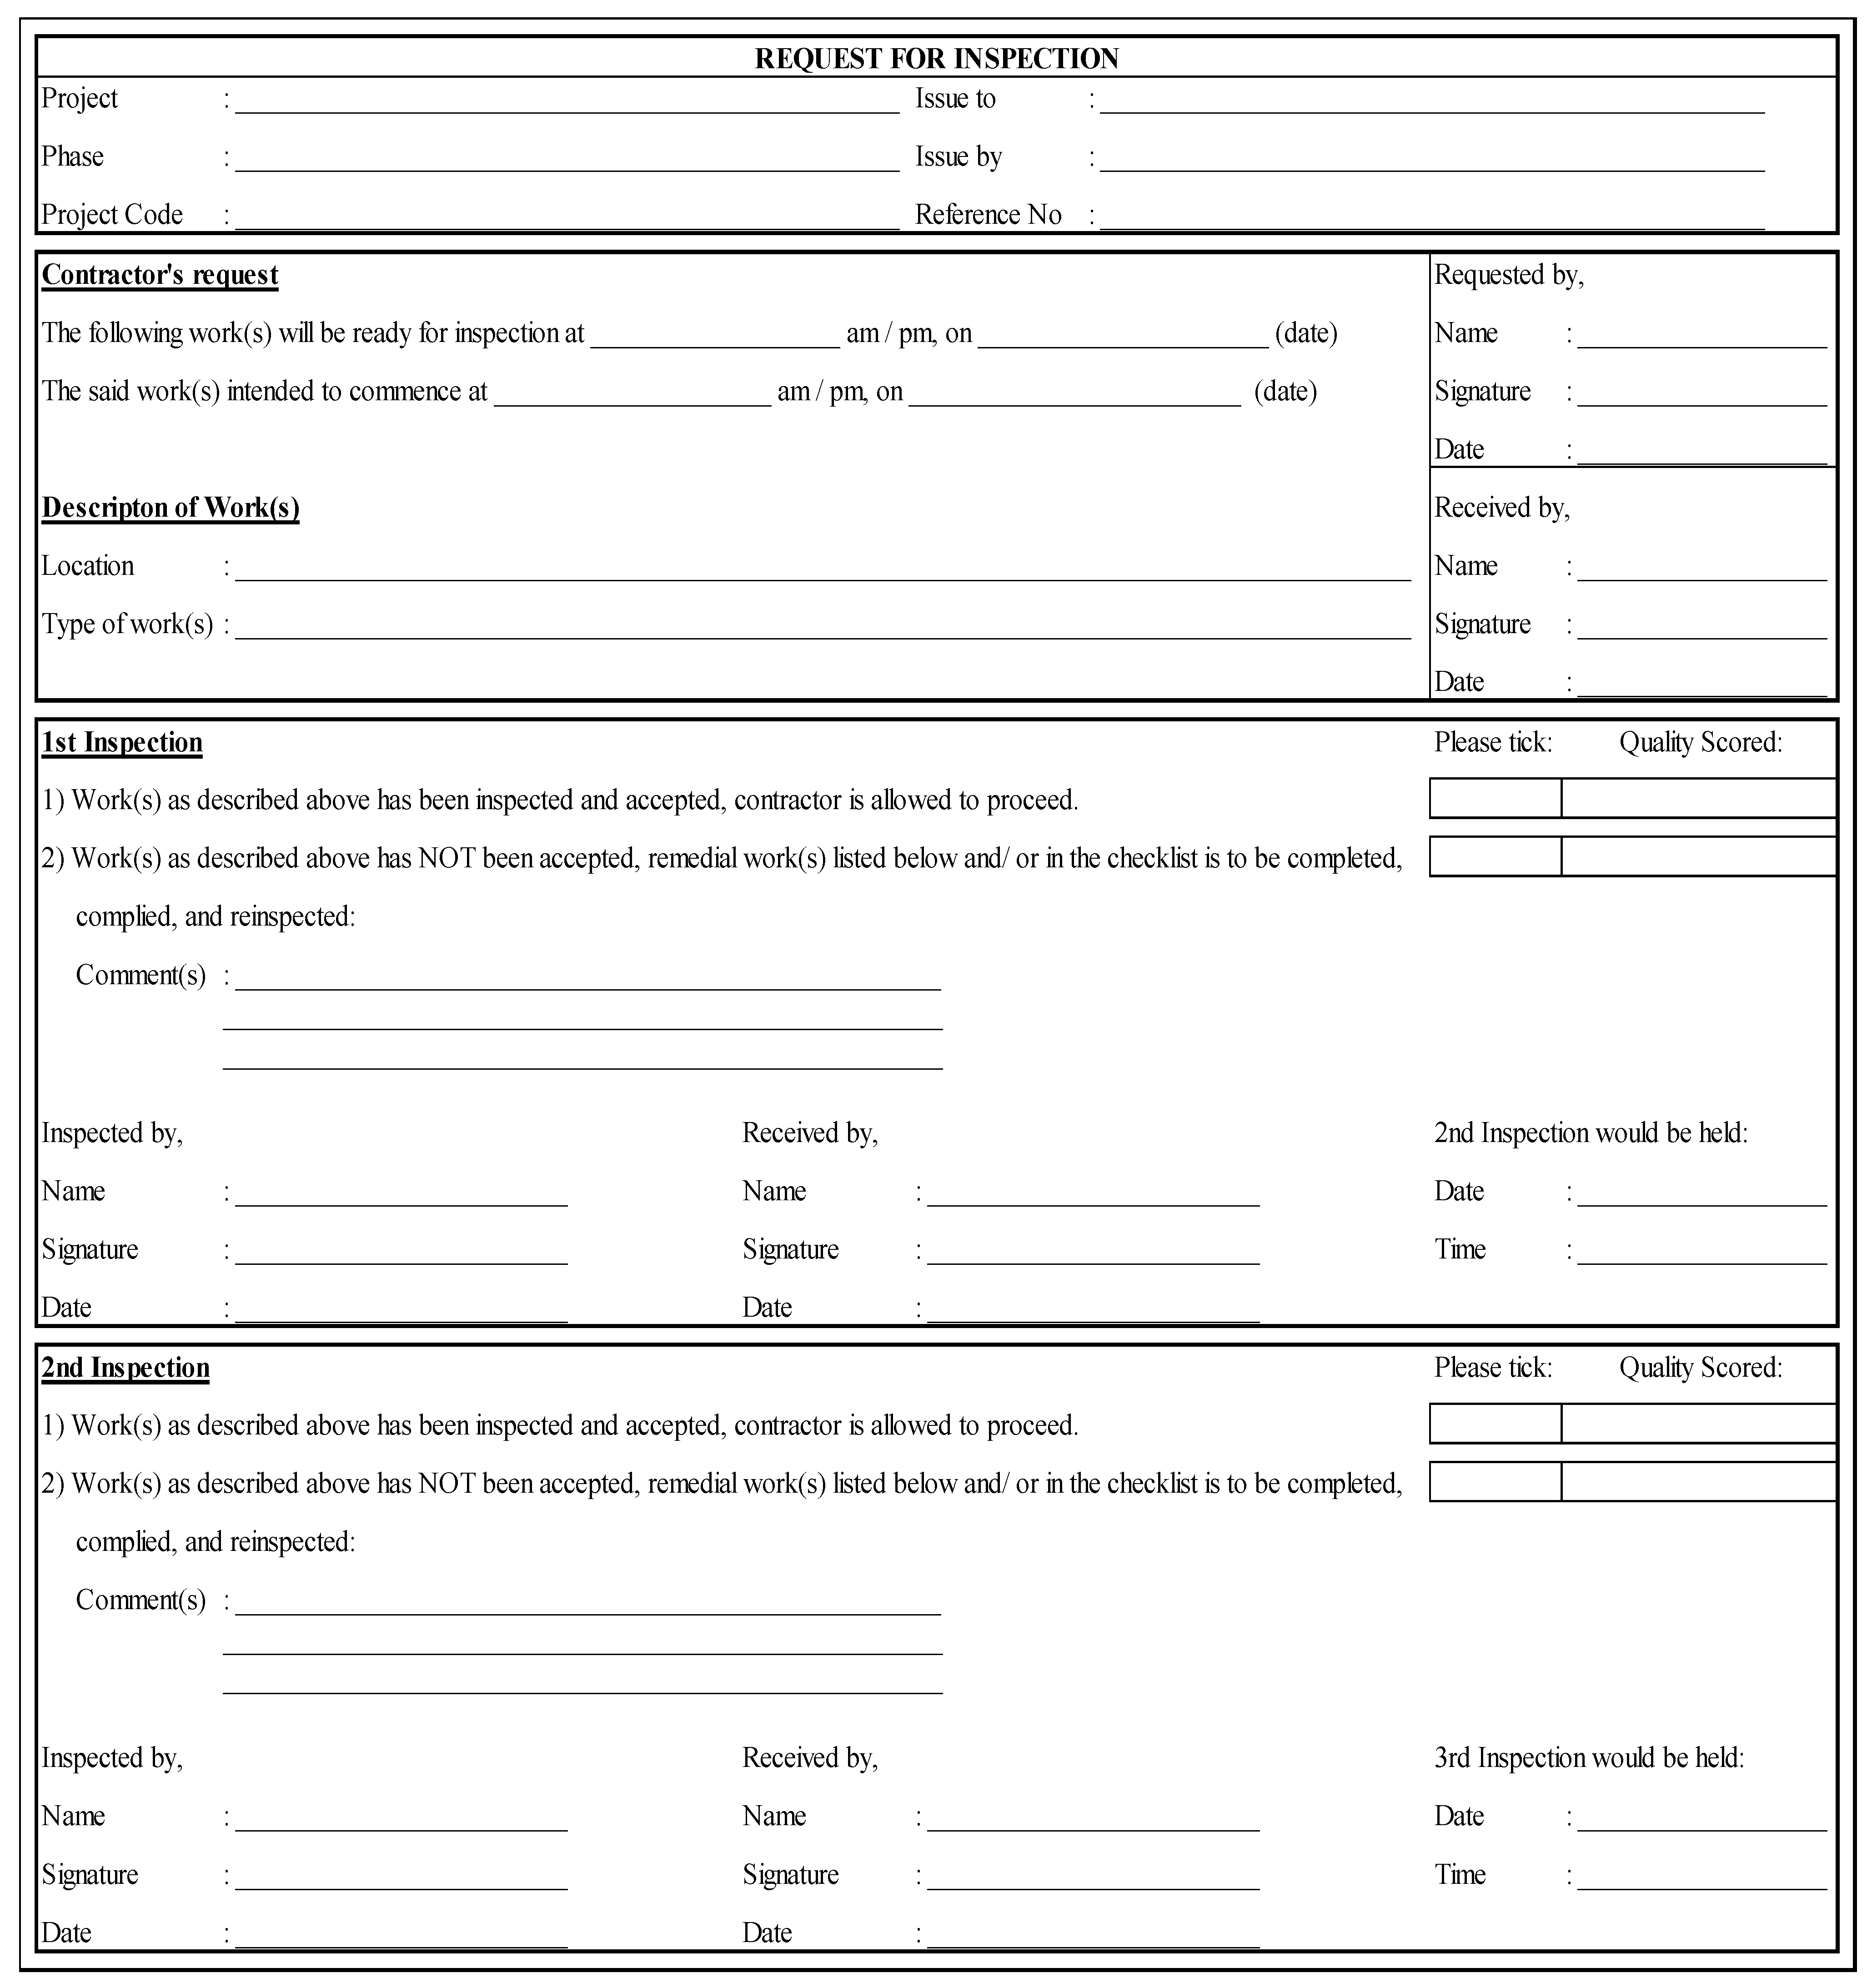
Upon completing the preparation works, the contractor submits the IA form to request an inspection. Issuance of an IA form by the contractor indicates that the contractor has reviewed the work and found the work to be complete and in compliance with the contract documents. A sample IA form is shown in Figure 4.
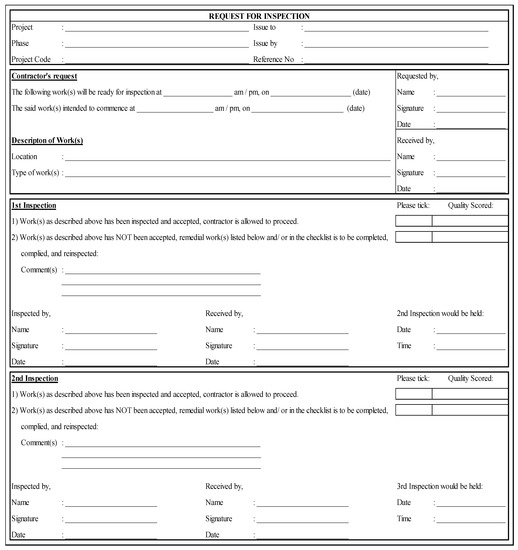
Figure 4.
Sample of Request for Inspection Form.
- Step 3: Consultant/representative inspects the work together with quality assessment by using the CONQUAS standard.
The consultant/representative inspects the work as per the IA form on the schedule as outlined in the said form. Upon the inspection, they can either approve or comment on the said work using their best knowledge. At the same time, the inspector marks the QP of the said work. The items to be inspected are the same as the CONQUAS system; the marks to be given, however, are different from the CONQUAS standard. The inspector will mark the inspected work under the CONQUAS system, with a scale from 0 to 10 marks, with 0 being the lowest and 10 the highest score. One mark will be deducted for each non-compliance. The passing score for a one-time inspection is 8 marks and above, failing which a second inspection is required.
- Step 4: Consultant/representative approves/rejects the work.
If the consultant/representative approves the said work, the contractor can proceed with the subsequent work. However, if the consultant/representative comments on the said work, the contractor cannot proceed with the subsequent work until all comments have been complied with and the work has been re-inspected. In both circumstances, the consultant/representative will be requested to indicate the QP by the contractor in the space given in the form, using the CONQUAS standard. The QP marks will then be recorded and registered into the computation sheet for further analysis.
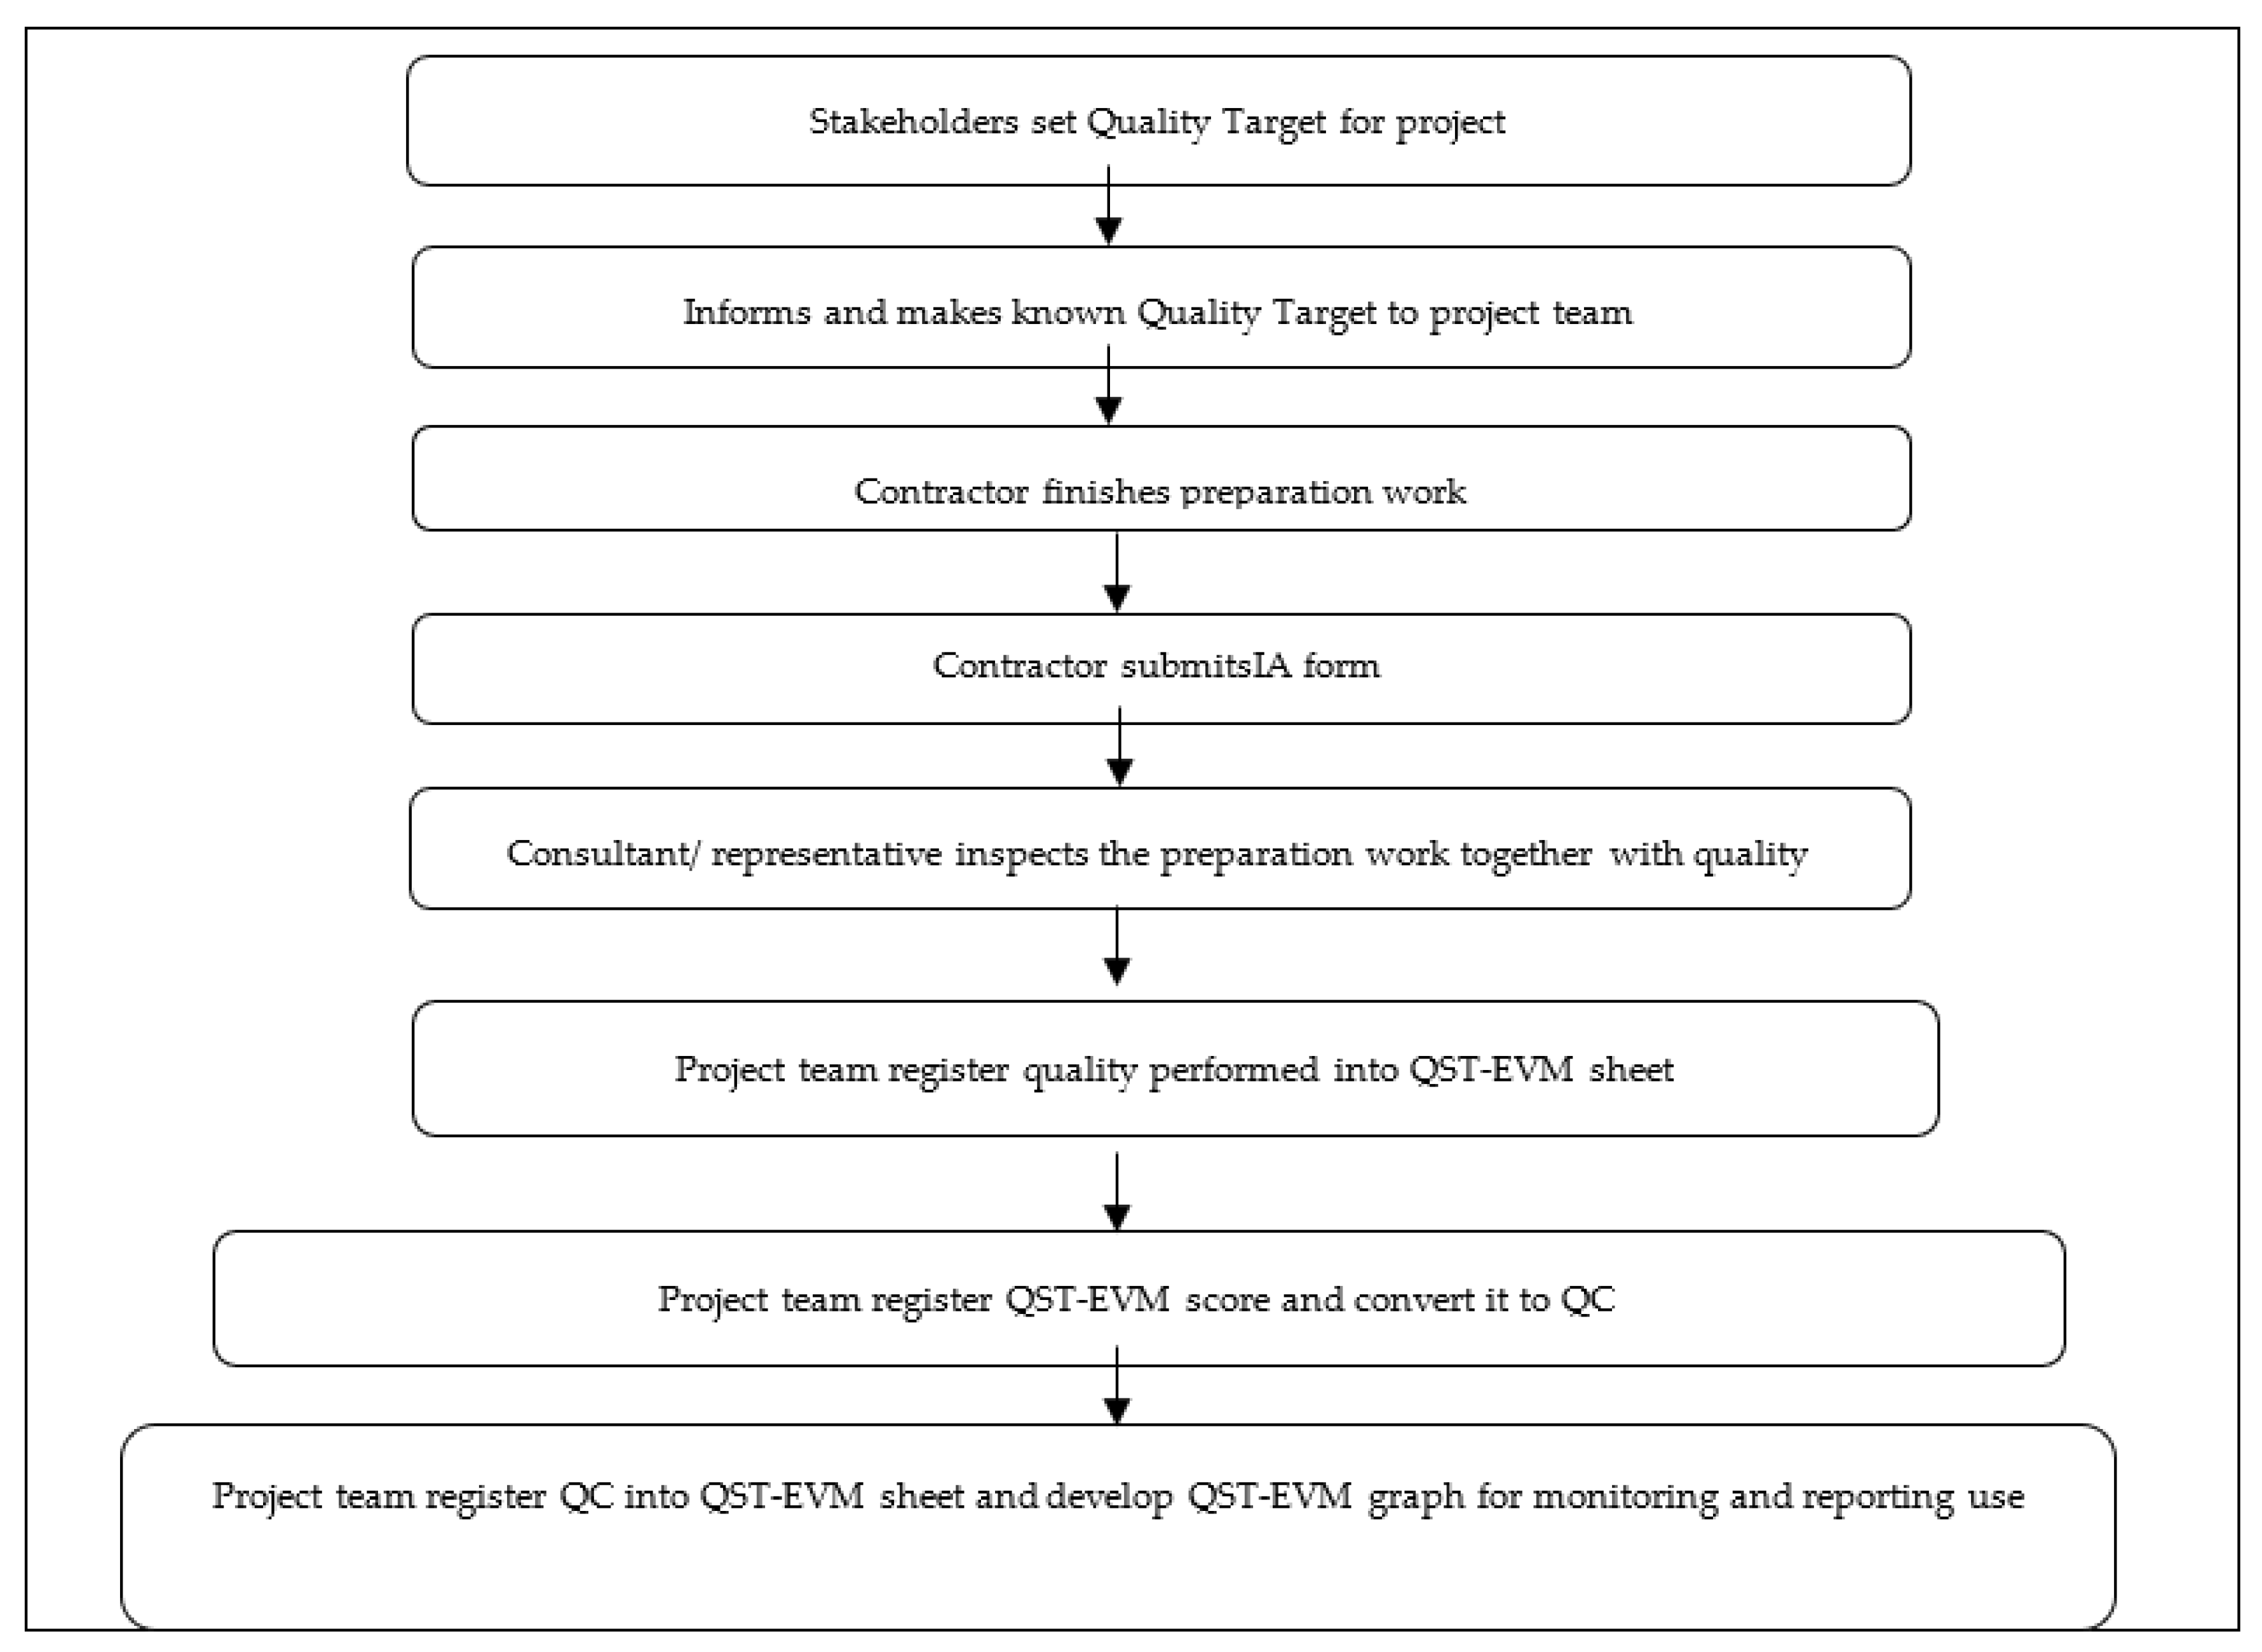
Figure 5 presents the developed QST-EVM sample graph, which the project team can use. This QST-EVM is a single graph that shows the triple constraints, and it can assist the project team in tracking the performance of a project in the context of the triple constraints. Figure 6 summarizes the entire Standard Operating Procedure to implement QST-EVM for easy reference in the construction industry.
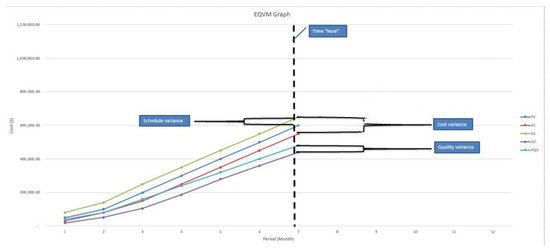
Figure 5.
QST-EVM Sample Graph developed in triple constraints context.
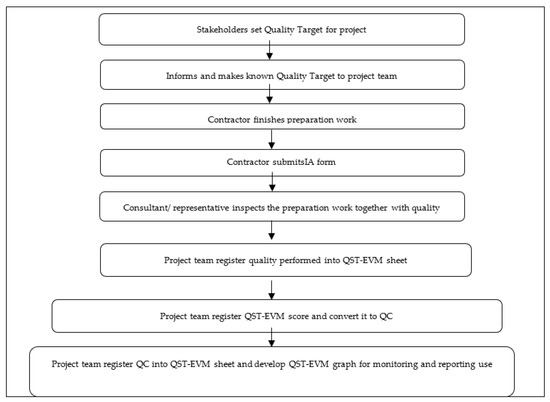
Figure 6.
Standard Operation Procedure to use QST-EVM.
4.2. Validation via Case Study
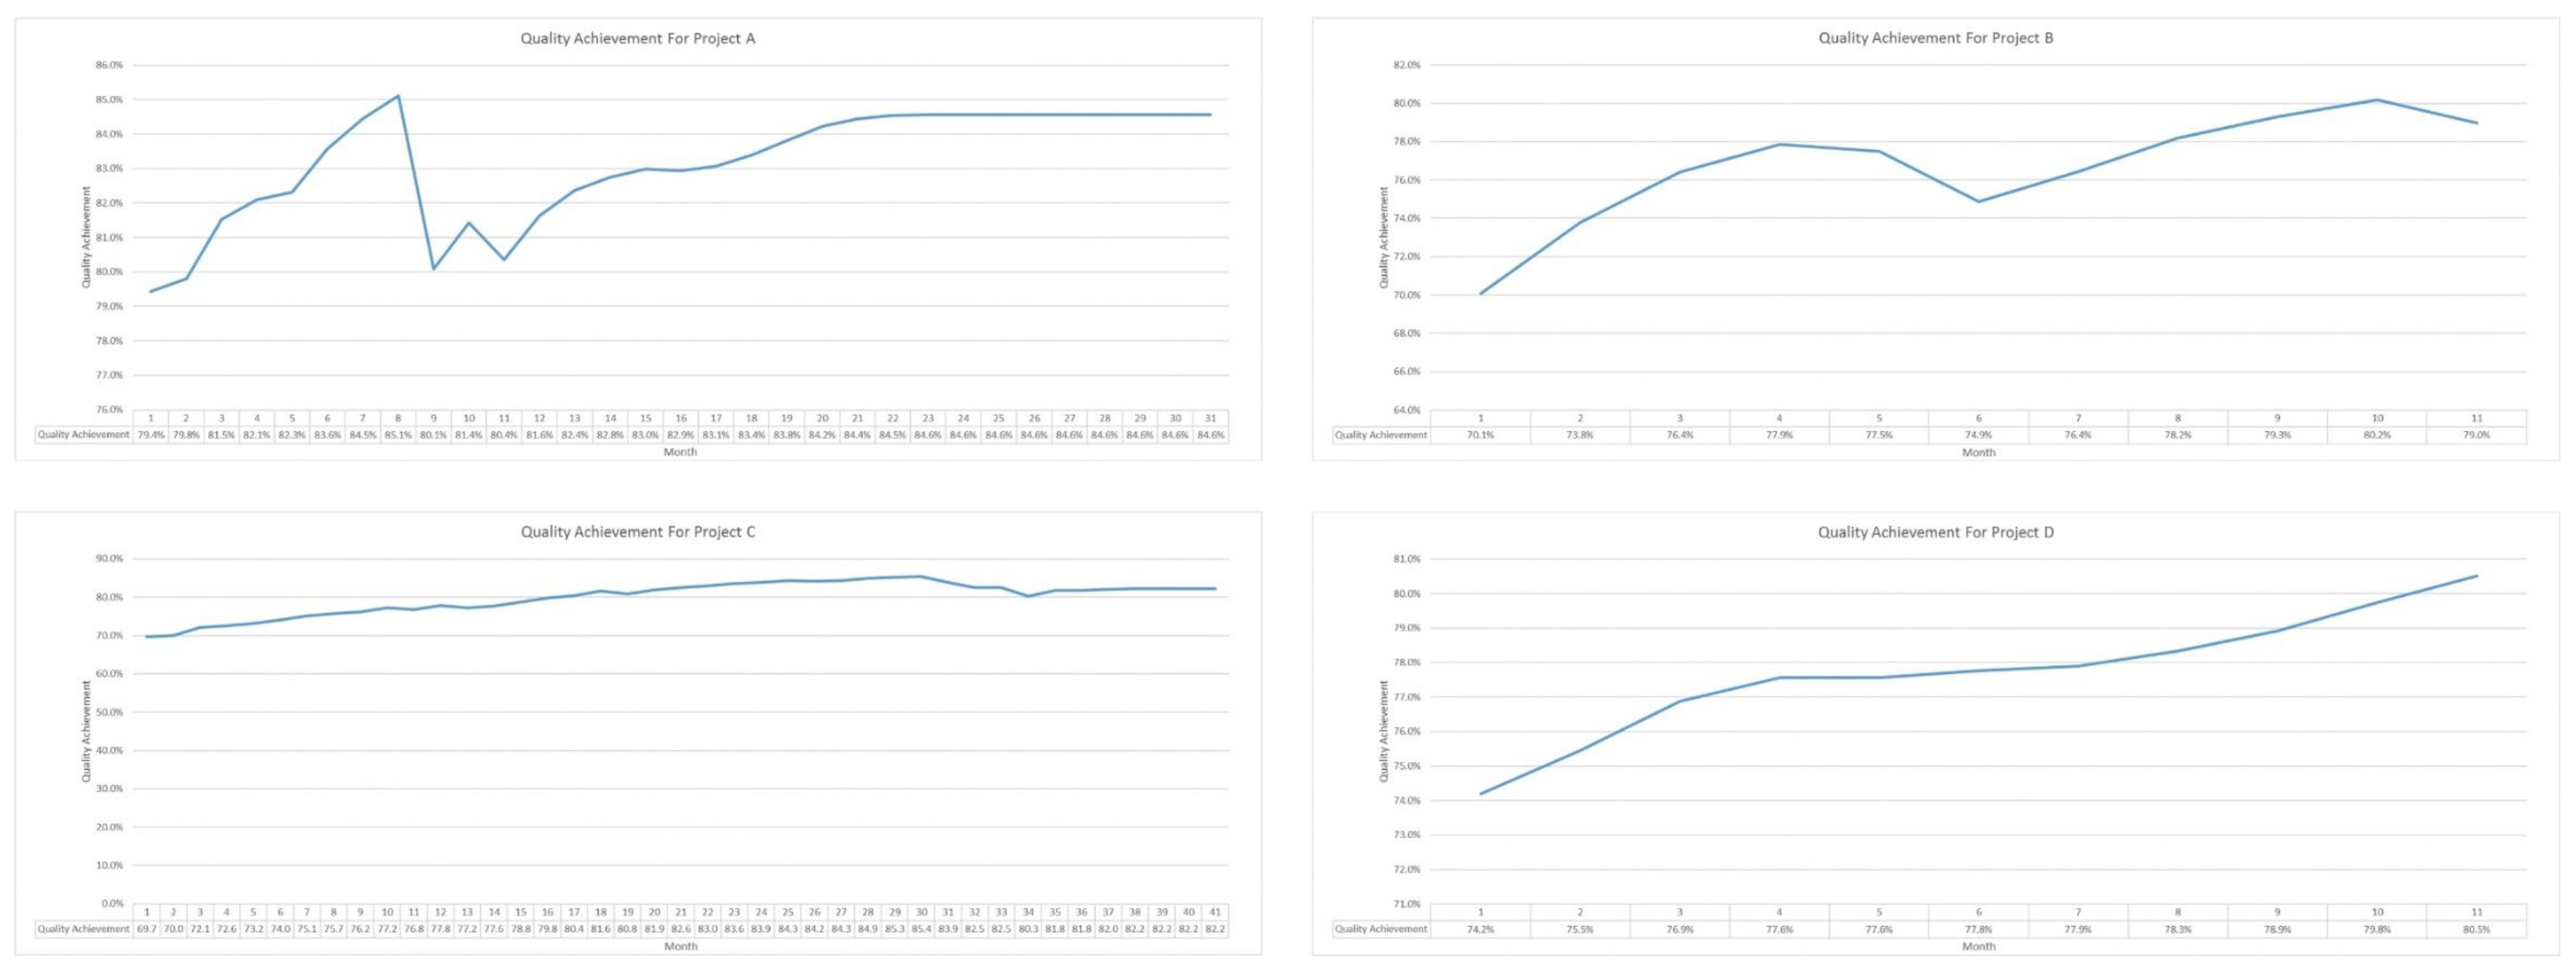
The proposed calculation table and QST-EVM method is a new tool; the feasibility of its operation and reliability of the results needs to be tested in practical engineering practice. Therefore, we selected four projects in Klang Valley, Malaysia, to conduct the QST-EVM experiment. A summary of these four projects is shown in Table 4. These four projects were contracted by the same firm but are different in characteristics. The purpose of selecting four projects was to validate the functionality of QST-EVM under different scenarios and features. The quality inspection involved daily construction inspections. In the current construction practice, a contractor submits an IA form to the consultant to indicate that they have reviewed their work and found the work to be completed in compliance with the contract documents. The consultant inspects the completed work and either accepts, accepts with condition/s, or rejects that particular type of work. The subsequent works can only be carried out upon acceptance in the IA form. The IA form is used as a quality inspection instrument to ensure all areas in the construction work are being inspected. Quality achievements for Projects A, B, C, and D are presented in Figure 7.
Table 4.
Project Summary.
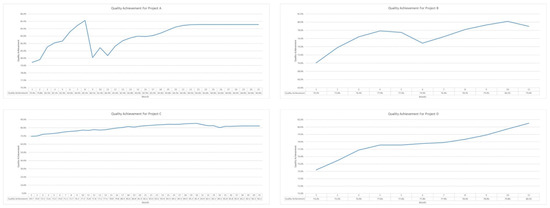
Figure 7.
Quality Achievement for Projects A, B, C, and D.
Every time the contractor finishes a preparation work, they must submit the IA form to request an inspection. Upon receiving the IA form, the consultant and the in-house trained auditor carry out an inspection based on drawing specifications and the CONQUAS® quality standard. The in-house trained auditor gives a QP score based on the CONQUAS® quality standard, and the QP score is then registered into the QP computation sheet to generate the To-Date Attained QP. Some projects in this portfolio were still ongoing, while some were already completed. Therefore, the cut-off date for all four case studies in this research was August 2018.
The To-Date Attained QP was then registered into the QST-EVM computation sheet monthly. At the same time, the project portfolio management team was required to fill in relevant project information (target schedule, actual schedule, contract sum, payment to date) in the QST-EVM computation sheet. Microsoft Excel was used as the computation sheet because its flexible and relevant equations could be formulated for calculation purposes. The project portfolio management team used the QST-EVM sheet to conduct detailed analysis on QCt, QV, and QPI to identify the performance variances in cost, schedule, and quality performance against the budgeted/planned performance. The triple constraints management could be conducted in one setting in QST-EVM, which significantly reduced the project portfolio management team’s workload compared with using different tools to track different constraints.
Project C’s QST-EVM computation sheet is shown in Table 3 as an example. It should be noted that Project C’s QCt was recorded as higher than the PQV, resulting in a QCt surplus from Month 17 onwards. A slight drop was recorded from Month 31 onwards. Analysis of Project C was then conducted using QST-EVM; the outcome revealed that the reason quality performance dropped was because the contractor was too focused on catching up on the schedule performance. The SPI recorded in Month 24 was 0.57, and that was the third consecutive month the schedule performance remained low. An Extension of Time was granted to the contractor at Month 25 to extend the project completion date. This resulted in the SPI changing from under budget to above budget (SPI more than 1.00). From Month 25 onwards, the project progress was able to significantly catch up in completion percentage (Actual Schedule %). The over-performed cost was reduced, coming closer to the as-planned cost (CPIs closer to 1.00).
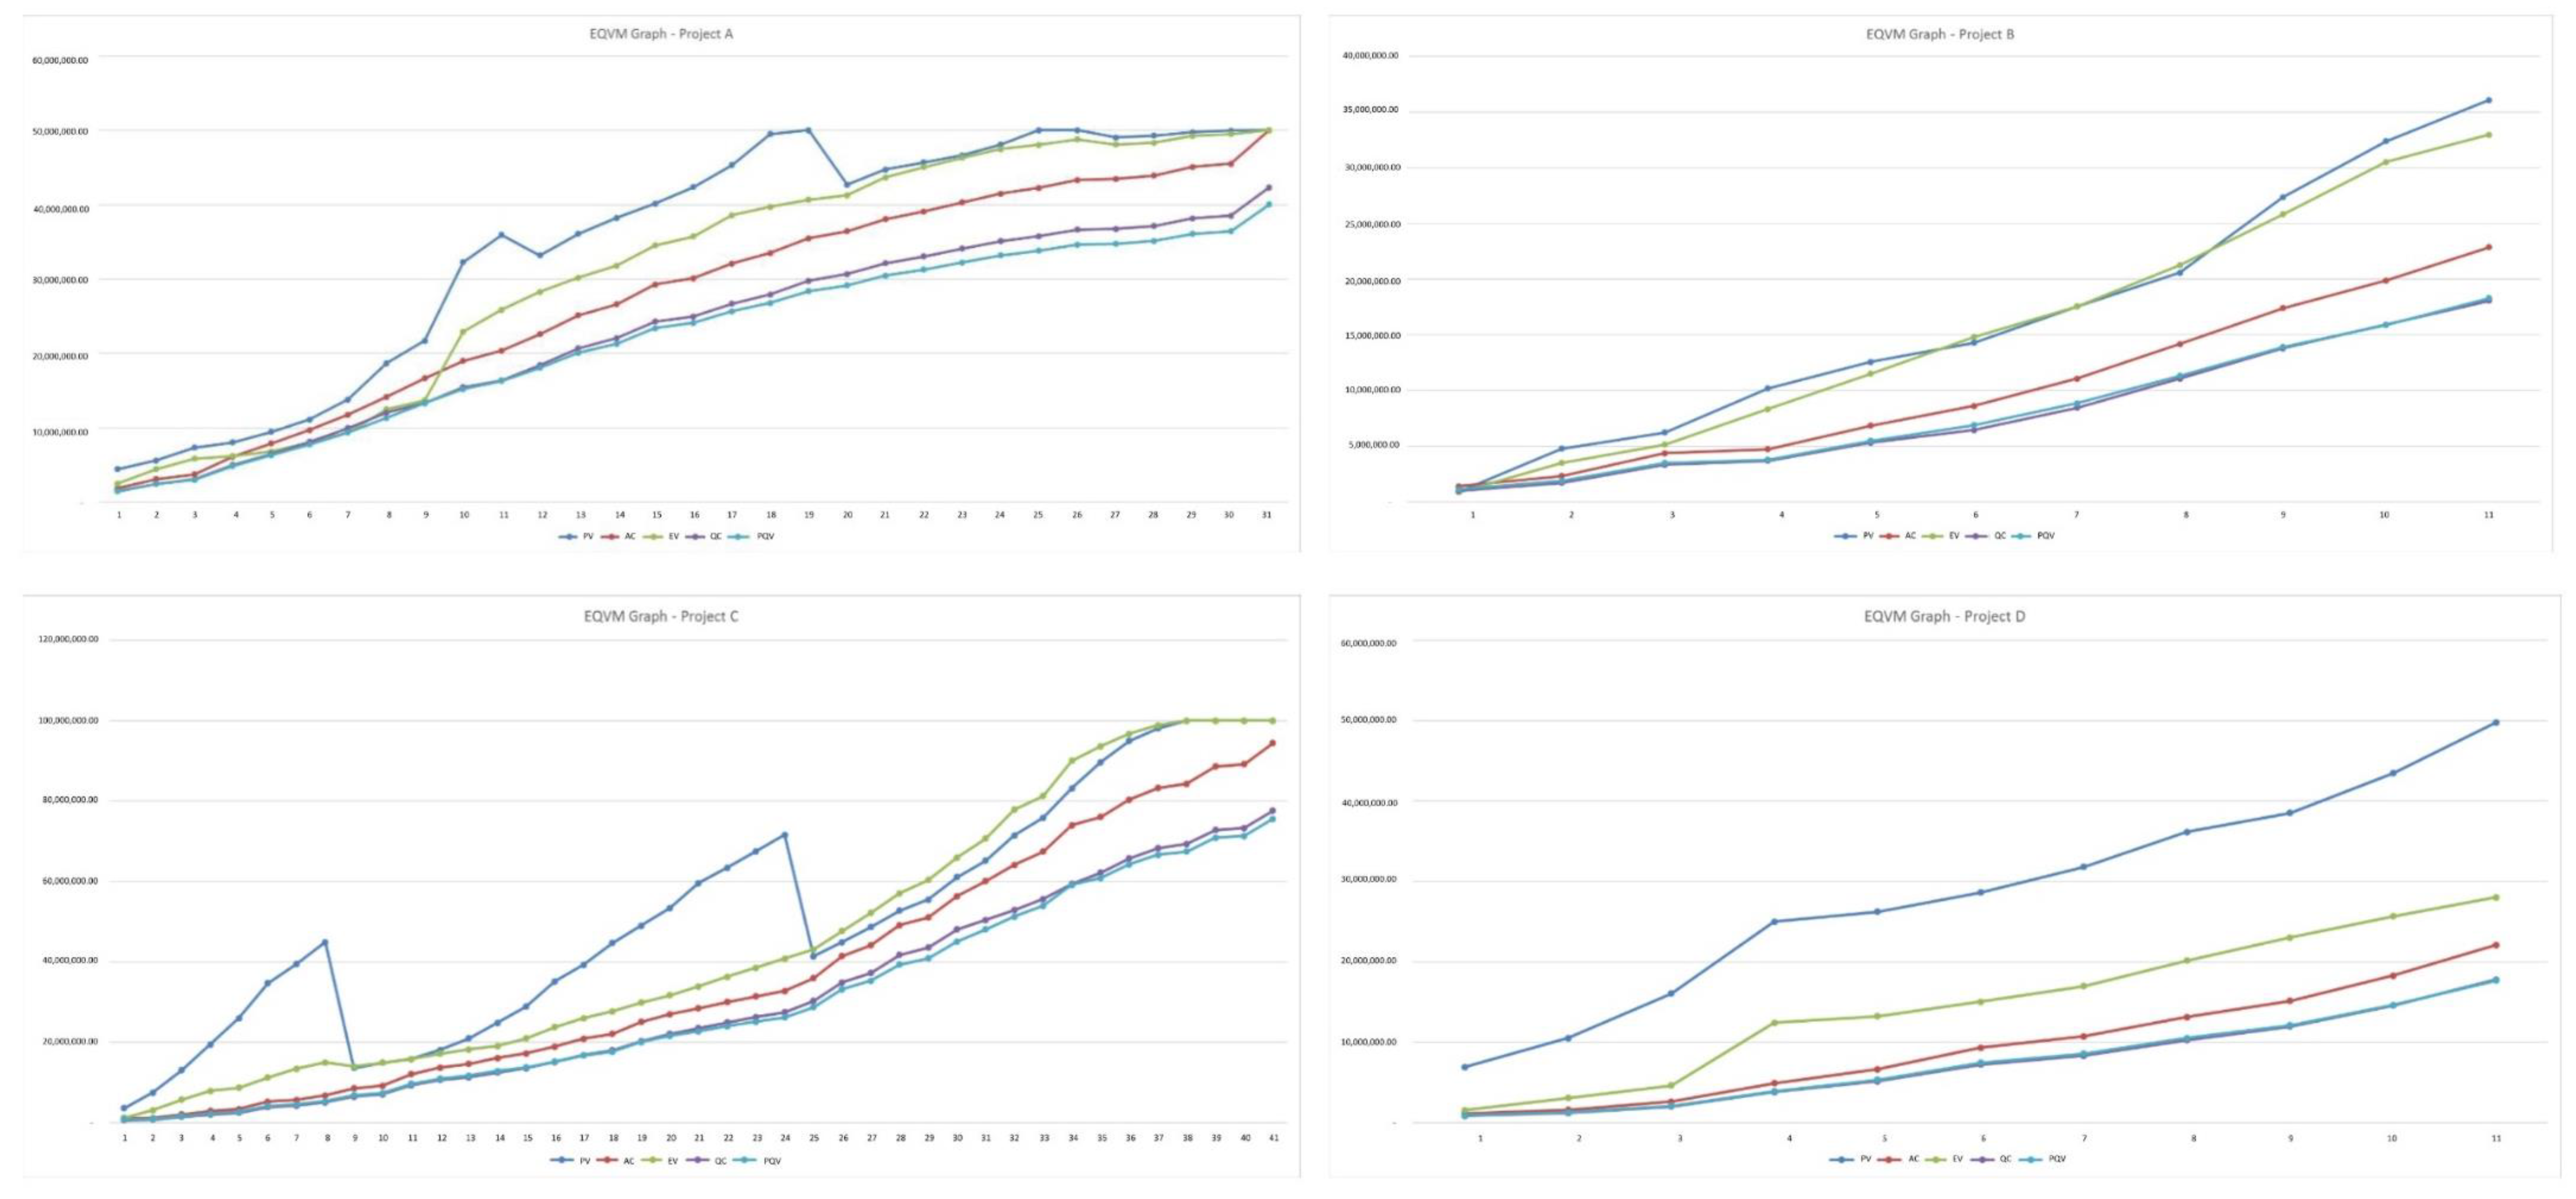
After Month 25, the project portfolio management team monitored the performance of the triple constraint very carefully to ensure that the project could be completed as planned. Although a slight drop was recorded in QPI, it did not affect the overall quality performance in Project C (QPI remained above 1.00). The surplus in quality in the months before Month 31 was compromised in order to catch up on the schedule performance. Additional costs were injected into the project to accelerate the schedule performance (CV significantly improved from Month 31 to Month 32). QST-EVM played an important role in Project C by indicating the warning signs of low performance in the schedule and recommending compromising the over-provided quality to catch up on the work program. The same protocol was applied to the other three projects within the same portfolio, and the results constantly reflected that the QST-EVM’s functionality was as expected. QST-EVM Graphs for Projects A, B, C, and D are presented in Figure 8.
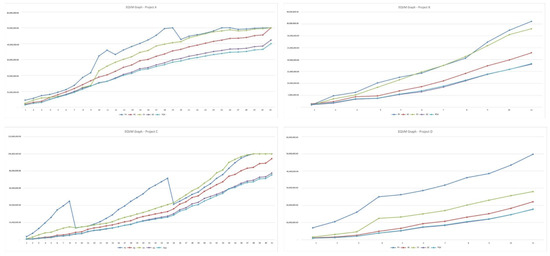
Figure 8.
QST-EVM Graphs for Projects A, B, C, and D.
4.3. QST-EVM Results in Portfolio Management
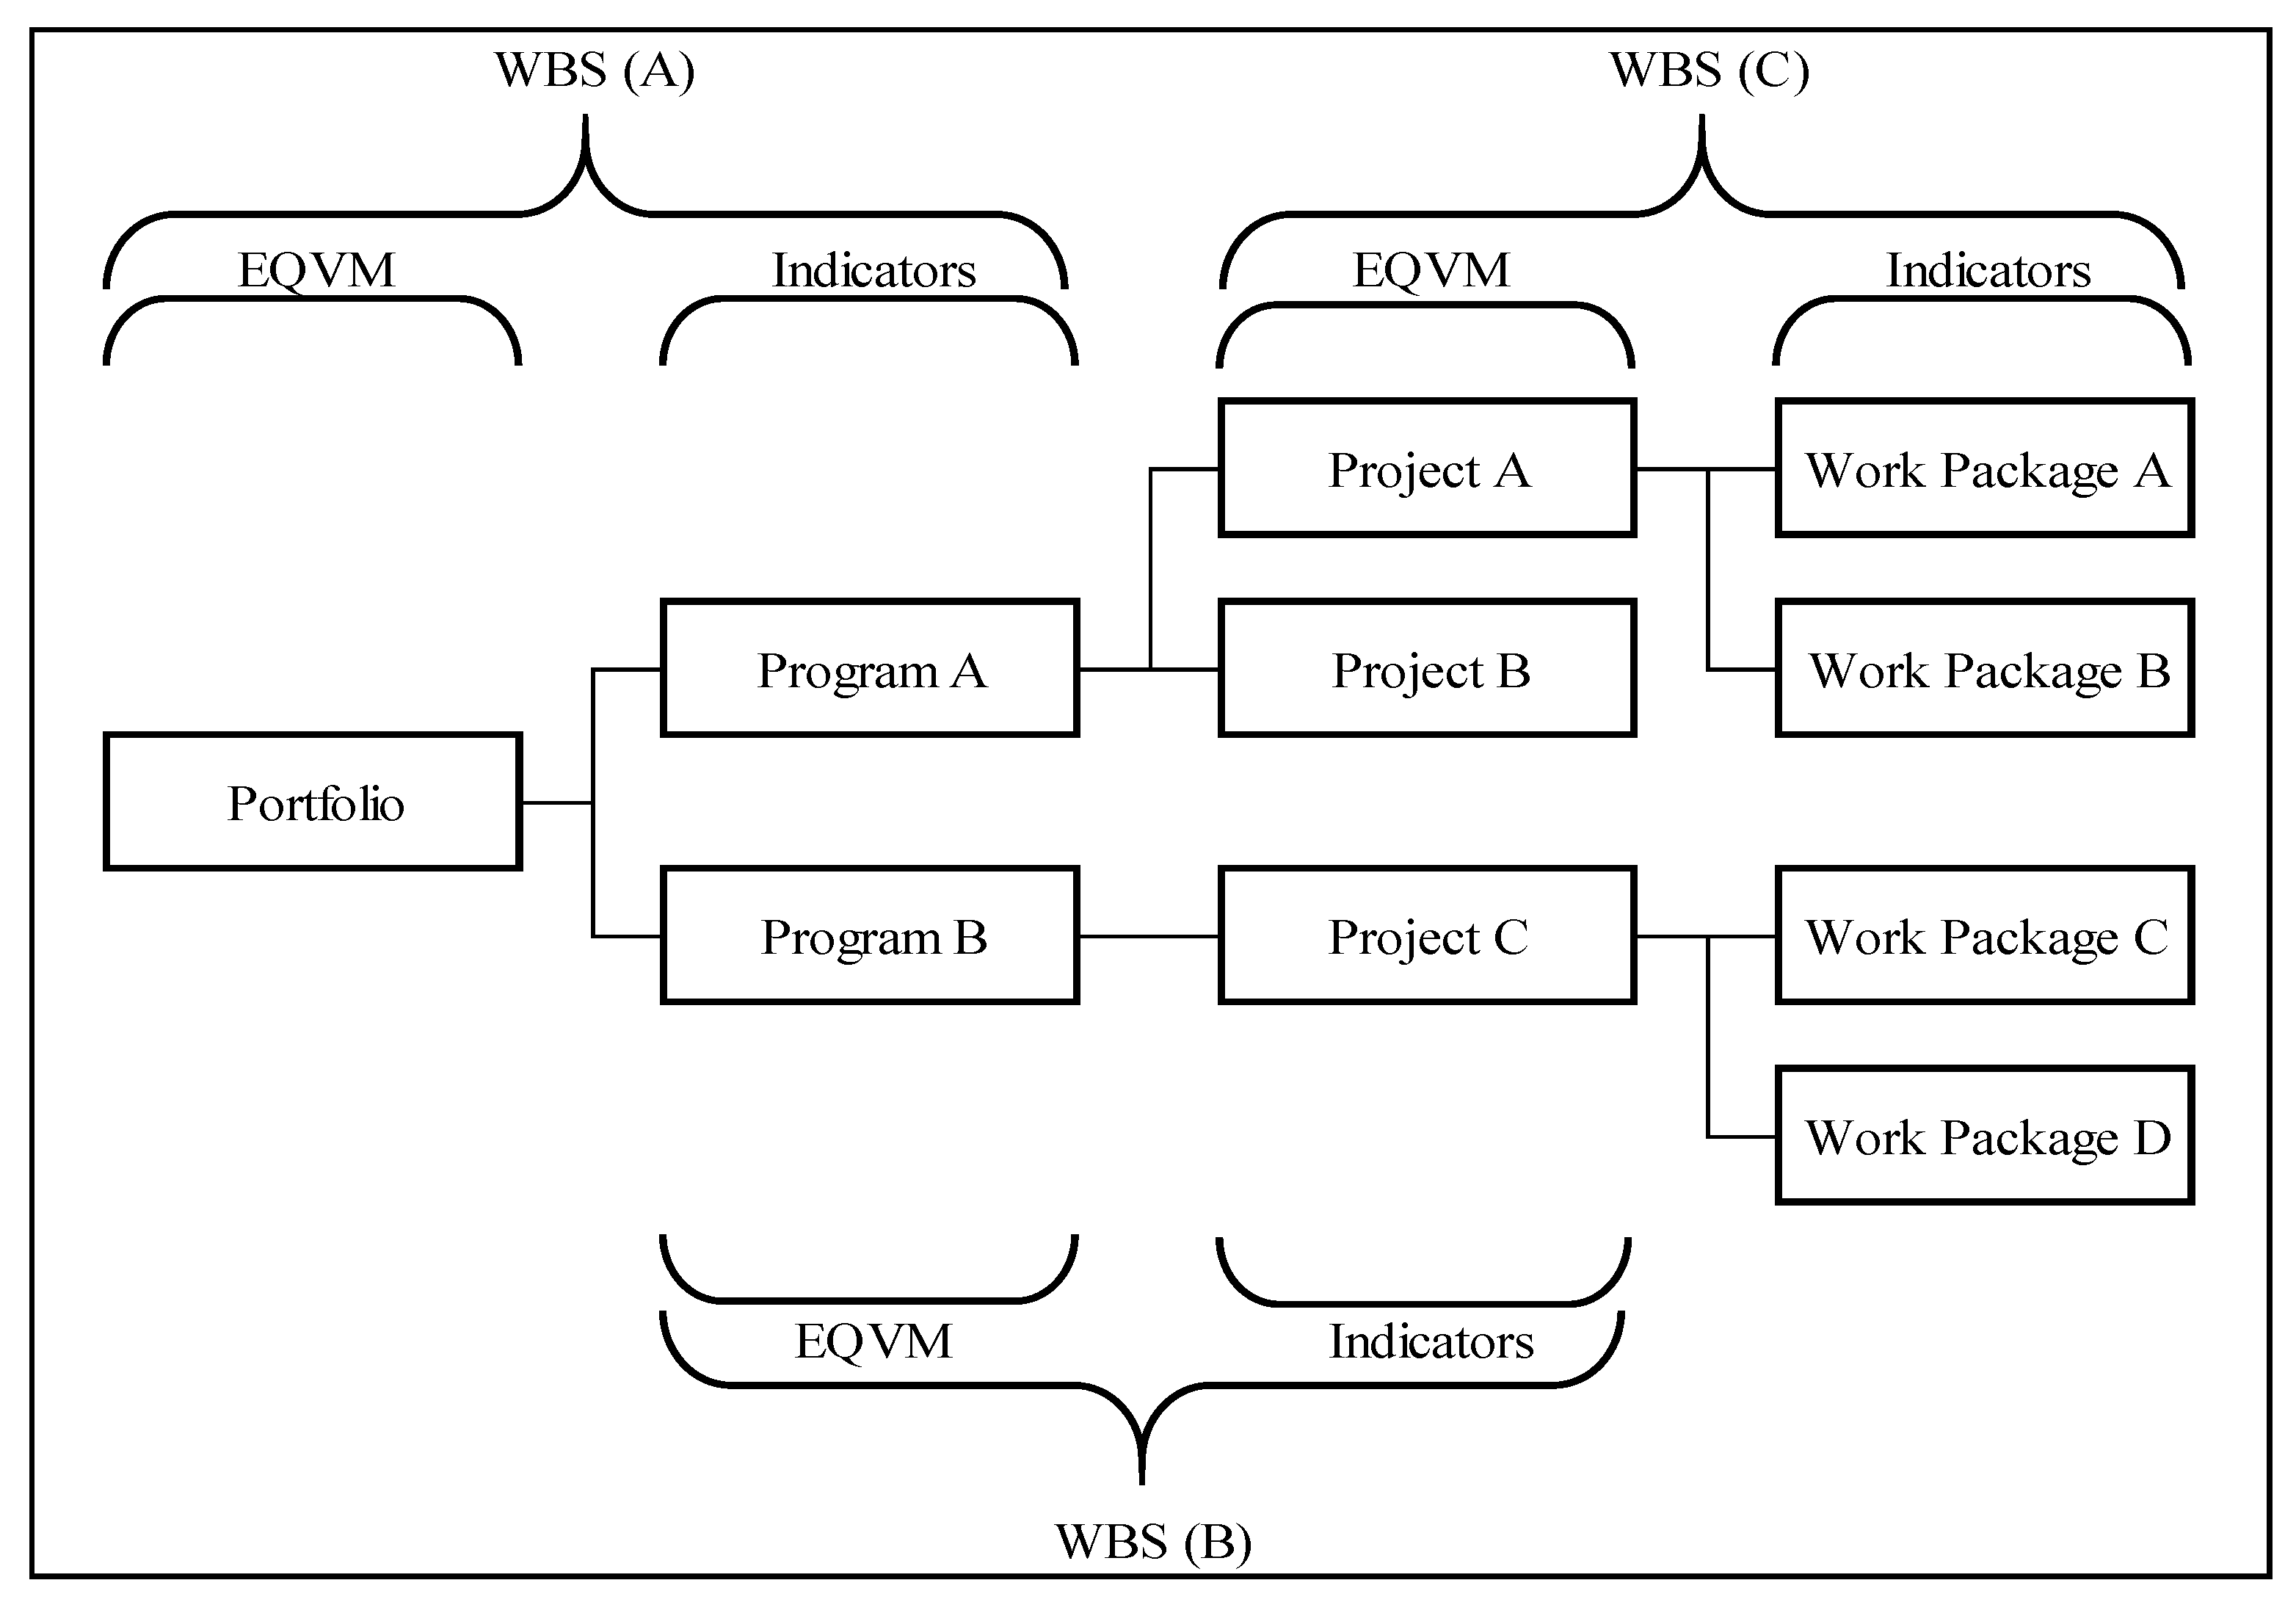
QST-EVM was created based on the EVM interface, and it was validated through case studies proving that QST-EVM could facilitate triple constraints management. In the EVM context, the project performance was measured by integrating the scope baseline with the cost baseline and the schedule baseline to form the performance baseline (PMI, 2017; PMI, 2013). In other words, each indicator in EVM was a value or the performance measurement baseline of the cost and schedule at a given point in time. This is an essential point to be noted because these values could be added to one another. A project’s progress was made based on the Work Breakdown Structure (WBS); each activity in the project was one event in WBS, and each event had its PV, AC, and EV. The overall project performance was measured by adding up all the PV, AC, and EV of each event, forming the entire portfolio’s performance. Figure 9 illustrates QST-EVM in project and portfolio management using the WBS concept. Looking at WBS (C), each work package had its PV, AC, EV, PQV, and QCt. All these indicators in different work packages were summed up and formed QST-EVM at the project level. In the WBS (B), the individual project QST-EVM became the indicator of a program, and that program eventually generated a QST-EVM at the portfolio level. Using the WBS concept, QST-EVM could be applied to all levels of management, such as portfolio, program, project, and even individual work packages.

Figure 9.
QST-EVM in Portfolio WBS.
QST-EVM used tabulation to create a link between the indicators at each level within a portfolio based on the WBS concept. The WBS of each level had its QST-EVM sheet. For instance, if an organization has three levels in the portfolio, it has two levels of WBS and two levels of QST-EVM. A QST-EVM-WBS table was created as per Table 5 to manage QST-EVM in the WBS concept. Projects within the same portfolio might have different project durations, commencements, and completion times. Therefore, Table 5 was created, taking into account the project duration. The project indicators were registered based on the timeframes. The first section in Table 5 included the individual indicators, whereby all individual project indicators were enrolled in this section. The second section was the macro QST-EVM for the entire portfolio. The macro indicators were generated by tallying up the individual indicators of each project in the same month. If two projects were running concurrently in the same month, the macro indicators would be the summed indicators of the said projects. The four projects in the case study were registered into the QST-EVM-WBS sheet, and a quarterly report of that QST-EVM-WBS is shown in Table 5. The QST-EVM-WBS was able to assist the project portfolio management team in (1) monitoring portfolio performance; (2) identifying, eliminating, minimizing, and diversifying risks; (3) maximizing the resources in the organization across different projects; and (4) enabling prioritization and selection of projects. There were three key performance indexes in QST-EVM-WBS: CPI, SPI, and QPI.
Table 5.
QST-EVM-WBS Quarterly Report.
These three performance indexes were intended to provide the earliest warning in terms of the entire portfolio. When any of these indexes was lesser than 1.0, it reflected that the particular performance was lower than planned. Using the performance indexes, a project portfolio management team was enabled to monitor the project performance in a macro view. Besides using the function of identifying, eliminating, minimizing, and diversifying risks, the organization could take a step further to analyze each project’s contribution and adjust particular projects toward the entire portfolio’s success. For example, when it was identified that a project in the portfolio was having low performance in scheduling, additional resources were to be provided by the portfolio manager (either fresh new resources or diverted from other projects that had advanced progress) to advance the project. However, if a project contributed the most to the entire portfolio, relevant priorities would be established to safeguard the entire portfolio.
The functionality of QST-EVM-WBS was integrated concurrently to maximize its capability. For instance, the schedule performance for April 2016, July 2016, and October 2016 were far behind the original plan (SPI ≈ 0.65), which indicated that the projects were running behind schedule. Since the risk of portfolio delays was detected, an analysis was required of the individual project’s QST-EVM to find out the root cause of that delay and possibly eliminate/minimize the risk of portfolio delays. At the same time, it was noted that there was a surplus in the quality performance. Therefore, the project portfolio management team would maximize the resources across projects by diversifying the resources invested in quality to catch up on the portfolio schedule.
5. Comparison of QST-EVM with Existing Methodologies
QST-EVM is a quality assessment method that provides quality performance indicators. Quality performance indicators can help manage quality performance, such as performance measurement, performance comparison, and performance analysis. QPAM was proven to be beneficial to the construction industry during a series of validation processes ranging from commissioning and scenario analysis to real-world case studies. Using the performance measurement feature allows the project team to monitor the quality performance of the project; using the performance comparison feature, the project team can compare the quality achievements of multiple projects, given the performance analysis will help to identify the strengths and weaknesses of the contractor’s handling of the project. By combining the above functions in QPAM, continuous improvement in the project implementation phase will be promoted, and a higher quality of the final product of the project will be achieved. An important contribution of QPAM is its ability to continuously improve the project from the implementation phase. This is not observed in other similar quality management tools such as CONQUAS, QLASSIC, or PASS. During the project implementation phase, one type of work is repeated several times before the project ends. If a bug or defect typical of that particular job is discovered early in the project, it prevents the same bug or defect from being repeated until the project is complete. In fact, this will improve the quality of the entire project and reduce construction waste during the project implementation phase.
Table 6 lists the detailed comparison between existing methods and QST-EVM for easy reference. On the other hand, EQVM has two parts, the QST-EVM graph and the QST-EVM table. Both projects were created to promote triple constraint management in the AEC industry. The QST-EVM is based on the EVM system, and other indicators such as PQV, QCt, and QPI are added to the current EVM system. The functions of these three indicators have been discussed and tested in previous chapters. The case studies show that QST-EVM is suitable for triple constraint management in the construction industry.
Table 6.
Comparison of QST-EVM with Existing Methodologies.
6. Conclusions
Existing scheduling tools could not monitor the triple constraint’s performance in one reporting format. The QST-EVM developed in this study has been tested and proven capable of assisting project portfolio stakeholders in triple constraints planning, organizing, monitoring, managing, and reporting. Using a single reporting format to manage the triple constraints allows project portfolio stakeholders to gain complete insight into the entire portfolio and make an informed decision based on their organization’s preference. Besides introducing QST-EVM, this study also took a step to enable knowledge sharing across projects by introducing a simple way to manage the performance of the triple constraint at the portfolio level. With this, project portfolio management teams within the same portfolio could share information amongst them. On the organizational level, the overall portfolio performance could be managed in one interface, and if required, focus could be given to a particular project identified as problematic. A detailed analysis could be carried out to determine the root cause of the problematic project, and lessons learned from other projects with similar problems could be transferred at the utmost speed within the portfolio. Allocation of resources would be easier compared to what was previously practiced. From the academic point of view, this study has minimized the gap in triple constraints management, quality management, and project portfolio management. From the practical industry viewpoint, this study created a model for triple constraints management in both the project and the portfolio context. For better commercialization purposes, developing mobile apps for better user experiences is recommended for further study.
Author Contributions
Conceptualization, C.W., Y.T., M.A.K. and K.N.A.; methodology, C.W., Y.T. and J.B.H.Y.; software, C.W., Y.T. and H.Y.O.; validation, C.W., Y.T., K.N.A. and J.B.H.Y.; formal analysis, C.W., Y.T. and H.Y.O.; investigation C.W. and Y.T.; resources, C.W. and Y.T.; data curation, C.W., Y.T., H.Y.O. and M.A.K.; writing—original draft preparation, C.W. and Y.T.; writing—review and editing, C.W., M.A.K., K.N.A. and J.B.H.Y.; visualization, C.W., Y.T. and J.B.H.Y.; supervision, C.W., M.A.K. and K.N.A.; project administration, C.W., Y.T. and M.A.K.; funding acquisition, C.W., Y.T. and K.N.A. All authors have read and agreed to the published version of the manuscript.
Funding
This research was funded by Fujian Province Science and Technology Department of China (grant number 2021I0014); the Quanzhou Tongjiang Scholar Special Fund for financial support through grant number (600005-Z17X0234); Huaqiao University through grant number (17BS201), and Universiti Teknologi Malaysia (UTM) Research Grant Vot No. (05E79).
Institutional Review Board Statement
Not applicable.
Informed Consent Statement
Not applicable.
Data Availability Statement
The data sets analyzed during the current study are available from the corresponding author on reasonable request.
Acknowledgments
The authors are grateful to the research grants awarded by the Fujian Province Science and Technology Department of China (grant number 2021I0014); the Quanzhou Tongjiang Scholar Special Fund for financial support through grant number (600005-Z17X0234); Huaqiao University through grant number (17BS201), and Universiti Teknologi Malaysia (UTM) Research Grant Vot No. (05E79).
Conflicts of Interest
The authors declare no conflict of interest.
References
- Hendiani, S.; Bagherpour, M.; Mahmoudi, A.; Liao, H. Z-number based earned value management (ZEVM): A novel pragmatic contribution towards a possibilistic cost-duration assessment. Comput. Ind. Eng. 2020, 143, 106430. [Google Scholar] [CrossRef]
- Abdi, A.; Taghipour, S.; Khamooshi, H. A model to control environmental performance of project execution process based on greenhouse gas emissions using earned value management. Int. J. Proj. Manag. 2018, 36, 397–413. [Google Scholar] [CrossRef]
- Newell, M.W. Preparing for the Project Management Professional Certification Exam; American Management Association: New York, NY, USA, 2005. [Google Scholar]
- Hamzeh, A.M.; Mousavi, S.M.; Gitinavard, H. Imprecise earned duration model for time evaluation of construction projects with risk considerations. Autom. Constr. 2020, 111, 102993. [Google Scholar] [CrossRef]
- Kerkhove, L.P.; Vanhoucke, M. Extensions of earned value management: Using the earned incentive metric to improve signal quality. Int. J. Proj. Manag. 2017, 35, 148–168. [Google Scholar] [CrossRef]
- Maylor, H. Beyond the Gantt chart: Project management moving on. Eur. Manag. J. 2001, 29, 99–100. [Google Scholar]
- Wilson, J.M. Gantt charts: A centenary appreciation. Eur. J. Oper. Res. 2003, 149, 430–437. [Google Scholar] [CrossRef]
- Brown, A.K.; Hyer, N.L. Managing Projects: A Team Based Approach; McGraw-Hill Inn.: New York, NY, USA, 2010. [Google Scholar]
- Larson, E.W.; Gray, C.F. Project Management: The Managerial Process; McGraw Hill: New York, NY, USA, 2011. [Google Scholar]
- Basu, R. Managing quality in projects: An empirical study. Int. J. Proj. Manag. 2014, 32, 178–187. [Google Scholar] [CrossRef]
- Baratta, A. The triple constraints, a triple illusion. In Proceedings of the 2006 PMI Global Congress Proceedings, Seattle, WA, USA, 21–24 October 2006. [Google Scholar]
- Kam, C.W.; Tang, S.L. Development and implementation of quality assurance in public construction works in Singapore and Hong Kong. Int. J. Qual. Reliab. Manag. 1997, 14, 909–928. [Google Scholar] [CrossRef]
- Low, S.P. Quantifying the relationships between buildability, structural quality and productivity in construction. Struct. Surv. 2001, 19, 106–112. [Google Scholar]
- Low, S.P.; Tan, B.K.; Allen, A.A.L. Effectiveness of ISO 9000 in raising construction quality standard: Some empirical evidence using CONQUAS scores. Struct. Surv. 1999, 17, 89–108. [Google Scholar]
- Love, P.E.D.; Li, H.; Irani, Z.; Faniran, Q. Total quality management and the learning organisation: A dialogue for change in construction. Constr. Manag. Econ. 2000, 18, 321–331. [Google Scholar] [CrossRef]
- Nicholas, J.M.; Steyn, H. Project Management for Engineering, Business and Technology, 5th ed.; Routledge: New York, NY, USA, 2017. [Google Scholar]
- Bakker, R.M.; Knoben, J.; Vries, N.D.; Oerlemans, L.A.G. The nature and prevalence of inter-organisational project venture: Evidence from a large scale field study in the Netherlands 2006–2009. Int. J. Proj. Manag. 2011, 29, 781–794. [Google Scholar] [CrossRef] [Green Version]
- Meskendahl, S. The influence of business strategy on project portfolio management and its success: A conceptual framework. Int. J. Proj. Manag. 2010, 28, 807–817. [Google Scholar] [CrossRef]
- Blichfeldt, B.S.; Eskerod, P. Project portfolio management—There’s more to it than what management enacts. Int. J. Proj. Manag. 2008, 26, 357–365. [Google Scholar] [CrossRef]
- Cooper, R.G.; Edgett, S.J.; Kleinschmidt, E.J. Portfolio management for new product development: Results of an industry practices study. RD Manag. 2001, 31, 361–380. [Google Scholar] [CrossRef]
- Archer, N.P.; Ghasemzadeh, F. An integrated framework for project portfolio selection. Int. J. Proj. Manag. 1999, 17, 207–216. [Google Scholar] [CrossRef]
- Young, M.; Conboy, K. Contemporary project portfolio management: Reflections on the development of an Australian Competency Standard for Project Portfolio Management. Int. J. Proj. Manag. 2013, 31, 1089–1100. [Google Scholar] [CrossRef]
- Sambasivan, M.; Soon, Y.W. Causes and effects of delays in Malaysian construction industry. Int. J. Proj. Manag. 2006, 25, 517–526. [Google Scholar] [CrossRef]
- Koke, B.; Moehler, R.C. Earned Green Value management for project management: A systematic review. J. Clean. Prod. 2019, 2301, 180–197. [Google Scholar] [CrossRef]
- Starke, S.D.; Baber, C. The effect of known decision support reliability on outcome quality and visual information foraging in joint decision making. Appl. Ergon. 2020, 86, 103102. [Google Scholar] [CrossRef]
- Cleland, D.I.; Ireland, L.R. Project Management: Strategic design and implementations; McGraw-Hill Inn.: New York, NY, USA, 2007. [Google Scholar]
- Bryde, D.; Unterhitzenberger, C.; Joby, R. Conditions of success for earned value analysis in projects. Int. J. Proj. Manag. 2018, 36, 474–484. [Google Scholar] [CrossRef]
- Batselier, J.; Vanhoucke, M. Improving project forecast accuracy by integrating earned value management with exponential smoothing and reference class forecasting. Int. J. Proj. Manag. 2017, 35, 28–43. [Google Scholar] [CrossRef]
- Acebes, F.; Pajares, J.; Galan, J.; Lopez-Paredes, A. Beyond Earned Value Management: A graphical framework for integrated cost, schedule and risk monitoring. Procedia—Soc. Behav. Sci. 2013, 74, 181–189. [Google Scholar] [CrossRef] [Green Version]
- Kim, E.H.; Well, W.G., Jr.; Duffey, M.R. A model for effective implementation of Earned Value Management methodology. Int. J. Proj. Manag. 2003, 21, 375–382. [Google Scholar] [CrossRef]
- Naeni, L.; Salehipour, A. Evaluating fuzzy earned value indexes and estimates by applying alpha cuts. Expert Syst. Appl. 2011, 38, 8193–8198. [Google Scholar] [CrossRef]
- Lipke, W.; Zwikael, O.; Henderson, K.; Anbari, F. Prediction of project outcome: The application of statistical methods to earned value management and earned schedule performance indexes. Int. J. Proj. Manag. 2009, 27, 400–407. [Google Scholar] [CrossRef]
- Elshaer, R. Impact of sensitivity information on the prediction of project’s duration using earned schedule method. Int. J. Proj. Manag. 2013, 31, 579–588. [Google Scholar] [CrossRef]
- Khamooshi, H.; Golafshani, H. EDM: Earned Duration Management, a new approach to schedule performance management and measurement. Int. J. Proj. Manag. 2014, 32, 1019–1041. [Google Scholar] [CrossRef]
- Hamzah, A.R.; Wang, C.; Muhammad, N. Project performance monitoring methods used in Malaysia and perspectives of introducing EVA as a standard approach. J. Civ. Eng. Manag. 2011, 17, 445–455. [Google Scholar]
- Kam, K.J.; Hilmy, A.; Hamid, A. The relationship between motives and benefits on adopting QLASSIC—CIS 7:2006 in Malaysia construction industry. Int. J. Qual. Res. 2012, 6, 321–332. [Google Scholar]
- Sedighizadeh, M.; Doyran, R.V.; Rezazadeh, A. Optimal simultaneous allocation of passive filters and distributed generations as well as feeder reconfiguration to improve power quality and reliability in microgrids. J. Clean. Prod. 2020, 26520, 121629. [Google Scholar] [CrossRef]
- Project Management Institute (PMI). A guide to the Project Management Body of Knowledge, 6th ed.; Project Management Institute: Newtown Square, PA, USA, 2017. [Google Scholar]
- Project Management Institute (PMI). A guide to the Project Management Body of Knowledge; Project Management Institute: Newtown Square, PA, USA, 2013. [Google Scholar]
- Department of Defence. Earned Value Management System (EVMS) Program Analysis Pamphlet (PAP); U.S. Department of Defence, Defence Contract Management Agency: Fort Lee, VA, USA, 2012.
- Naderpour, A.; Mofid, M. Improving construction management of an educational center by applying earned value technique. Procedia Eng. 2011, 14, 1945–1952. [Google Scholar] [CrossRef] [Green Version]
- Vandevoorde, S.; Vanhoucke, M. A comparison of different project duration forecasting methods using earned value metrics. Int. J. Proj. Manag. 2006, 24, 289–302. [Google Scholar] [CrossRef]
- Project Management Institute (PMI). Practice Standard for Earned Value Management; Project Management Institute: Newtown Square, PA, USA, 2005. [Google Scholar]
- Association for Project Management. Earned Value Management: APM Guidelines; Association for Project Management: Bucks, UK, 2008. [Google Scholar]
- Barima, O.K.B. Examination of the best, analogous, competing terms to describe value in construction projects. Int. J. Proj. Manag. 2010, 28, 195–200. [Google Scholar] [CrossRef]
- Kamath, A.; Jayaraman, R. CONQUAS systems standard for high quality project management. Int. J. Manag. 2013, 1, 51–67. [Google Scholar]
- Ahmed, S.M.; Aoieng, R.T.; Tang, S.L.; Zheng, X.M. A comparison of quality management systems in the construction industries of Hong Kong and the USA. Int. J. Qual. Reliab. Manag. 2005, 22, 149–161. [Google Scholar] [CrossRef]
- Building Construction Authority Singapore (BCA). The BCA Construction Quality Assessment System (CONQUAS), 9th ed.; Building and Construction Authority: Singapore, 2017. [Google Scholar]
- ISO 9000-2015; Quality Management Systems—Fundamentals and Vocabulary. ISO Copyright Office: Geneva, Switzerland, 2015.


Publisher’s Note: MDPI stays neutral with regard to jurisdictional claims in published maps and institutional affiliations. |
© 2022 by the authors. Licensee MDPI, Basel, Switzerland. This article is an open access article distributed under the terms and conditions of the Creative Commons Attribution (CC BY) license (https://creativecommons.org/licenses/by/4.0/).