Abstract
Based on the inter-provincial high-tech industry panel data from 2010 to 2016 in China, this study constructs static and dynamic panel models, respectively, to study the relationship between high-tech industry agglomeration and high-tech export product upgrading, and makes an in-depth discussion on open innovation to achieve sustainable development through industry agglomeration. This paper studies and tests the transmission mechanism between high-tech industrial agglomeration and export product upgrading, which makes up for the research gap in industry agglomeration. The results show that: (1) China’s high-tech industry agglomeration has a significant positive effect on its export industry product upgrading. (2) Regional education has a significant positive effect on the high-tech industry’s export product upgrading, and the influence of high-tech industry agglomeration on export product upgrading is negatively regulated by regional education. (3) From the perspective of influence mechanism, high-tech industry agglomeration has a positive effect on high-tech export product upgrading mediated by innovation and openness (open innovation), and then affects the sustainable development of a regional economy. (4) The high-tech industry agglomeration has a heterogeneous effect in promoting their export products; in terms of scale, the promotion effect is more significant in the large enterprises than small- and medium-sized enterprises; in terms of region, the eastern and western regions have a more significant role in promoting export product upgrading; in terms of industries, the electronic and communication equipment manufacturing industry has the most obvious promotion effect. Based on the research results, this study puts forward policy suggestions such as increasing investment in high-tech industries, strengthening the degree of opening to the outside world, encouraging enterprise innovation, and promoting balanced development of the industry.
1. Introduction and Literature Review
Since the accession to the World Trade Organization (WTO), China’s high-tech industry has developed rapidly. China’s export delivery value has always maintained an annual growth rate of more than 20%, which is much higher than other manufacturing industries in the same period. The expansion of high-tech industry plays an important role in promoting regional employment, trade development and industrial optimization. However, it is undeniable that the status of “quality” and “quantity” of China’s high-tech industry does not match; most products are still at the middle and low end of the industrial value chain [1,2]. There is still a big gap with developed countries. In addition, the impact of factors such as the rising labor cost, resource depletion and environmental pollution have further weakened the competitive advantage of China’s export products, directly leading to the current situation that China’s high-tech industry is big but weak. In recent years, the structure of China’s export products has been continuously improved, mainly because the technical complexity of export products has increased, which greatly exceeds that of similar countries [3,4]. Based on this fact, mining the main factors and driving mechanisms that affected the technical complexity of China’s high-tech industry exports is a major breakthrough for China to gradually change the development mode and to realize the sustainable development strategy.
The research on the complexity of China’s export technology has been discussed through many perspectives. In recent years, great changes have taken place in China’s export market structure, mainly reflected in the increasing export share of electronics and machinery, while agricultural exports have been in a downward trend [4]. Over the past 30 years, China’s exports have grown substantially. The main reason is the increasing complexity of export products, especially the rapid penetration of new products and high-tech industry markets [5]. Some studies have shown that China’s export complexity is positively correlated with the share of Wholly Foreign Owned Enterprise, foreign-invested enterprises’ processing exports, and China’s VAT reform. Others suggest that export complexity is negatively correlated with China’s local enterprises’ share of processing exports [6,7]. From the data of China’s regional economy, it can be found that regions specializing in more complex commodities are growing faster than other regions [8]. The above research shows that the increase in export product complexity can promote the regional economy as a whole, and the main driving force for the upgrading of export products comes from the improvement on the scientific and technological levels.
The existing research results show that industry agglomeration can not only improve productivity through relevant spillover effects, so as to increase the probability of the enterprises entering the export market [9,10], but it can also significantly improve the enterprise’s own export tendency and the competitiveness of export products through the competitive pressure within the cluster [11,12,13]. Similarly, trade facilitation can promote the growth of industries with a high degree of agglomeration in developing countries [14,15,16]. However, the excessive gathering of homogeneous export enterprises leads to the “delocalization effect” of export enterprises spillover, and excessive industry agglomeration cannot significantly promote the transformation of enterprises from processing trade to general trade with a higher division of labor in the industrial chain [17,18]. The above literature shows that industry agglomeration promotes the export trade volume of enterprises by improving their productivity. However, the impact of industry agglomeration on export quality is still a gap that still needs further research and testing.
Innovation is the most fundamental driving force for upgrading industrial technology. Open innovation is an innovative way that combines openness and innovation. It can introduce external innovation resources and innovation capabilities and realize enterprise and external joint market expansion through cooperation [19]. Some research shows that the spillover effect of industry agglomeration can reduce the gap in the science and technology levels among the enterprises in the cluster. The overall science and technology levels of the enterprises in the cluster can be improved [10]. However, when the industry agglomeration develops to a certain extent, the technological level gap among enterprises in the cluster is small, and the spillover effect of industry agglomeration will be greatly weakened [20]. At this time, through the introduction of foreign new technologies, new ideas and human resources through cooperation, some local enterprises can achieve technological innovation. The spillover effect of industry agglomeration once again forms technology promotion in the cluster, further improves the overall scientific and technological level in the cluster, and realizes the sustainable development of the utility of industry agglomeration [21].
The research on the relationship between open innovation and sustainability have been discussed via two perspectives. Open innovation can promote the technological transformation of enterprises and realize the sustainable development of enterprises [22]. When an enterprise develops to a certain extent, its internal innovation will encounter a bottleneck. Open innovation can keep the progressiveness of enterprise technology and realize the sustainable development of enterprises by acquiring external technology [23]. Although different open innovation has different effects based on different types of high-tech enterprises, it generally promotes the sustainable development of enterprises [24]. The research shows that open innovation has successfully overcome the bottleneck of science and technology development of small- and medium-sized enterprises in Indonesia. Based on the fact that the characteristics of some small- and medium-sized enterprises in Indonesia match the implementation of open innovation, open innovation contributes to the success and sustainable development of small- and medium-sized enterprises in Indonesia [25]. However, enterprises integrate sustainability performance indicators into product development to establish demand for sustainability-oriented radical product innovation, which in turn can promote the development of open innovation [26]. The research shows that the implementation of sustainable development strategy and adherence to open policy can significantly enhance the progressiveness of enterprises and improve their innovation ability [27].
Through the above literature analysis, we find that, first of all, high-tech industry agglomeration can form a technology spillover effect to a certain extent, which is conducive to the promotion and application of high-tech technology in the region, thus increasing the overall scientific and technological level in the region. Only when an enterprise has a high level of technology can it promote the upgrading of its products. Second, open innovation can promote the spillover effect of industry agglomeration. When the technological gap between enterprises in the region is small, the spillover effect of agglomeration is relatively not obvious. At this time, it is necessary to introduce foreign scientific and technological innovation to improve the driving force of the regional scientific and technological levels, which not only promote the spillover effect of industry agglomeration, but also promote the sustainable development of industry agglomeration. Finally, the level of regional education determines the quantity and quality of talents in the region, and talents are the fundamental condition for innovation. Therefore, in regions with high education level.
The existing studies have promoted the development of theories related to industry agglomeration on export trade, but still have some deficiencies: First, most studies focus on the impact of specific industry agglomeration on export trade volume, but few literature studies focus on the improvement of specific industry agglomeration on technical content and added value of export products; second, most studies focus on the impact of general industry (such as industry and manufacturing) agglomeration on export trade, while few studies focus on the impact of high-tech industry agglomeration on the quality of export trade products by improving product-added value; third, most of the existing studies on the impact of industry agglomeration on export trade are based on the perspective of enterprise performance or enterprise productivity, and little consideration is given to other factors; finally, the existing literature involves more theoretical mechanisms of the impact of industry agglomeration on export trade, but less mathematical model analysis, derivation and verification.
The measurement methods used in this paper include fixed effects, system gmm, maximum likelihood estimation, and mediation test (sobel test), which demonstrate the robustness of the model setting from many aspects. These methods are widely used in economic research [25,26,27,28].
This paper first sorts out the relationship among the variables, refers to Figure 1, and then tests the promoting effect of high-tech industry agglomeration on the technological upgrading of export products. When the effect is significant, this paper further tests the mediating effect of open innovation (divided into two dimensions of openness and innovation) on the two and verifies that high-tech industry agglomeration affects the upgrading of export products through the transmission mechanism of open innovation. Finally, this paper also tests the impact of the interaction between industry agglomeration and education level on the upgrading of export products. It shows that high-tech industrial agglomeration under different levels of education has different effects on the upgrading of export products.
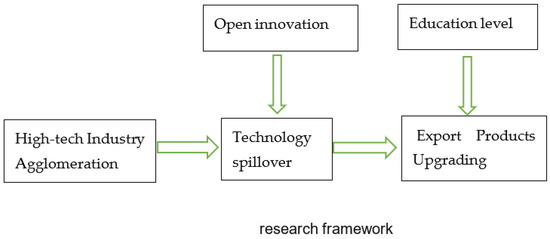
Figure 1.
Reserch franmework.
The contributions of this paper are as follows: (1) This paper constructs some relevant theoretical models and mathematical derivation and analyses and obtains the theoretical basis that high-tech industry agglomeration promotes export product upgrading through two transmission mechanisms of innovation ability and degree of openness. (2) Based on the interprovincial high-tech industry panel data, this paper tests the interactive relationship between China’s high-tech industry agglomeration, education level and export product upgrading, conducts the mediating effect test based on the transmission mechanism, tests the heterogeneity of different types of samples, and obtains the corresponding results. (3) According to the theoretical analysis and measurement results, this paper puts forward relevant policy implications for the development of China’s high-tech industries. (4) Based on the perspective of industry agglomeration, this paper establishes the path relationship between open innovation and sustainable development and provides references and ideas for the sustainable development at the cluster level.
2. Theoretical Analysis and Research Assumptions
2.1. High-Tech Industry Agglomeration and Export Product Upgrading
2.1.1. Industry Agglomeration and Technological Innovation
End Product Manufacturer
According to the production function theory of end products proposed by Aghion and Howitt (2009) [18], assuming that the production of final products requires two production factors, labor and specialized intermediate products, and the continuum of intermediate products is 1, the production function is defined as follows:
where represents the number of final products produced by industry k in region i at time t represents the labor input of manufacturing industry k; represents a specialized intermediate product m used to produce k final products of manufacturing industry; represents the production efficiency or technical level of intermediate product m. α is the intensive use degree of labor force, 1-α is the intensive use degree of intermediate products, 0 < α < 1. Formula (1) means that the return to scale of the final product production technology in the manufacturing industry is unchanged, which satisfies the concave characteristics. Under the given conditions of labor price () and intermediate product price (), the representative firms in the manufacturing industry maximize its profits by choosing the optimal combination of labor and intermediate products. If the final product price of the representative firm of manufacturing industry k in region i is , the profit maximization condition of the representative firm of this industry is:
Intermediate Product Manufacturers
The profit function of the Intermediate product manufacturers is:
Taking the derivative of the above formula, the maximum output of the intermediate product manufacturer can be obtained, and it can be brought into the profit function of the above formula, and the maximum profit can be generated as:
According to Aghion and Howitt (2009) [18], the innovation success probability of the m-th intermediate product manufacturer in the manufacturing industry k at time t depends on the final R&D product input
where reflects the efficiency parameter of R&D department k, represents the productivity of new intermediate products after successful innovation, and η is the elastic coefficient with a value of 0~1. reflects the R&D investment per labor; it is used to avoid the impact of the scale effect caused by population expansion.
The intermediate product manufacturer can obtain income when the innovation is successful and zero income when the innovation fails; thus, the profit function of the intermediate product manufacturer’s innovation is:
Taking the first-order partial derivative of , we can obtain:
The above formula shows that the probability of innovation success depends on the parameters α, η and the R&D efficiency of the manufacturing industry k.
Agglomeration and Innovation
Spatial proximity and the stability of the innovation environment can enhance the synergistic efficiency of different departments for innovation subjects, support the process of knowledge socialization among different economic subjects, and thus generate the dynamic advantage of innovation. The R&D activities of intermediate product manufacturers are often concentrated in areas with a high concentration of producer services, so as to obtain the required producer services nearby, reduce innovation risk and innovation coordination cost, improve learning efficiency and socialization of knowledge, and improve R&D efficiency [28]. According to Maier’s research results, R&D efficiency of manufacturing industry can be regarded as an increasing function of industry-specialized agglomeration and diversified agglomeration of other producer services.
where K represents the exogenous technological progress common to all regions; SP represents the specialized agglomeration of producer services; DV is the diversified agglomeration of producer services. , respectively represent the innovation efficiency parameters of specialized agglomeration and diversified agglomeration of producer services. Combining the above formula, we can obtain:
From (10), it can be concluded that specialized agglomeration and diversified agglomeration in the region can promote the innovation success probability of intermediate product manufacturers by improving the R&D efficiency of industry K.
2.1.2. High-Tech Industry Agglomeration and Open Demand
From the perspective of industry agglomeration, open innovation is a concept whose attributes can be perceived as naturally complementing the proximity-based offer of clusters [29]. Public support at the cluster level can improve the cooperation openness of member companies, leading to more and more reliable relations among cluster members, but it also limits the access to more and more valuable information and knowledge resources, which are most relevant to the future environment pursuing sustainability [30]. Therefore, only by continuously implementing the open innovation strategy, through external technology acquisition, some enterprises can obtain advanced technology, and then, through the knowledge spillover effect of industrial agglomeration to improve the advanced technology level and innovation ability of the overall cluster, we can promote the sustainable development of regional economy [31].
Industry agglomeration can produce a technology spillover effect in a certain range and then promote the promotion and application of new technologies by enterprises at different levels in the region [32]. Openness can further promote technological progress between regions. When there is a large technological gap in an industry between regions, backward regions will copy, adapt and implement leading-edge technologies instead of innovation to promote production by introducing foreign capital, cooperative operation and shares. When there is a small technology gap in an industry between regions, pure technology spillover can no longer meet the needs of improving the level of science and technology. At this time, we can only improve the level of technology through technological innovation [33]. According to the transnational conditional convergence of growth rate in the Schumpeter growth model, Howiit believes that a country that starts far behind the world’s technological frontier may have greater open demand and faster growth space [34]. According to the research of Aghion et al. (2014) [35], the open demand in a region is proportional to the technology level (or product quality) in the region and the gap between the frontier level in the industry. The greater the gap between the current industry technology and the frontier, the greater the open demand. From the most intuitive point of view, industry agglomeration is the agglomeration of a series of production factors such as capital and labor. According to the neoclassical economic model, this paper supposes that the production function of a certain region is:
where represents the output of m industry in the i region, represents the technical level or product quality of the m industry in the i region, L represents the labor force, represents the intermediate products required for production, and θ represents the labor ratio of the region used to input the m industry, reflecting the level of industry agglomeration. At the same time, assuming that the final product price is constant at 1, its profit function is expressed as follows:
where represents the wage rate of m in region i; represents the price of intermediate products. Further, it is similarly assumed that the production function and profit function in the adjacent area j of area i are as follows, and ()
Taking the first-order conditions for the profit function for μ and θ, respectively, we can obtain:
When the industry economy is balanced, the labor wage rates of the same industry between regions will tend to be equal, that is, to satisfy:
We can obtain:
When approaches , we can obtain:
When and are constant, the agglomeration degree θ of m industries in region i is positively correlated with the technological difference ; that is, the agglomeration degree θ is positively correlated with the demand for openness.
2.1.3. Innovation, Openness and Technology Upgrading
The innovation of one sector or country is often based on the knowledge created by the innovation of another sector or country. The process of technology spillover is an important factor behind transnational integration. If a country starts far behind the world’s technological frontier, it can develop faster rather than close to the frontier country, because every time a department of the country catches up with the global frontier, the former country will make greater technological progress [36]. Based on the above theory, Aghion proposed the balance model of independent innovation effect and open technology imitation effect as follows:
where represents the technical level or product quality in period t, represents the technological quality frontier in the t period, and γ expresses the independent innovation effect . If the improvement of technical level from t to t + 1 is all caused by independent innovation, it can be expressed as: If both sides of the above equation are divided by we can obtain:
From the above formula, it can be concluded that the growth of technical level or product quality depends on the innovation ability and the gap with the frontier technology. When the gap with the frontier technology is large, innovation γ growth and openness growth are the main driving forces for technology upgrading and quality improvement. With the increase in technology level, when is close to 1, the main driving force for industrial technology upgrading and product quality improvement comes from the innovation.
Based on the above analysis and combined with the characteristics of China’s high-tech industry development, this paper puts forward the following hypothesis:
Hypothesis 1 (H1).
Through the mediating effect of innovation ability and openness, high-tech industry agglomeration can promote the improvement of product quality and technical level and then promote the upgrading of export products.
2.2. High-Tech Industry Agglomeration and Education Level
Regional education can directly affect the training quality of high-tech talents in the region, and the high-tech talents are the key factors in promoting technological innovation and technological upgrading in the region [37]. From this point of view, education level can promote its output products, especially its export of high-tech products. However, compared with regions with a high level of education, regions with a low level of education generally develop more slowly in high-tech industries, their industry agglomeration is basically in the primary stage, and export commodities have relatively low technical content [38]. Most of their export products are generally in the low end of the industrial value chain, and there is relatively large room for improvement [39]. Therefore, the improvement of technology will be obviously reflected in product quality or production efficiency. First, the areas with lower education levels generally are relatively weak in high-tech industries, the level of industry agglomeration is in the primary stage, and the agglomeration effect is more obviously reflected in the product quality. The relevant literature research shows that with the increase in the level of agglomeration, the effect of industry agglomeration presents an inverted “U” shape [40]. Second, compared with regions with a high education level, the export products of the regions with low education level are mostly based on basic materials. Their products have lower technological content and lower added value; thus, there is a lot of room for improvement in quality and technology. Finally, in areas with higher education level, high-tech industries agglomeration will lead to greater competition pressure in the industry. Whether it is the agglomeration effect or the competition effect, it is easy to cause vicious competition in high-tech industries. Moreover, the added value of its export products is high, and the promotion space is small, which lead to the fact that high-tech industry agglomeration does not significantly improve product quality.
Based on the above analysis and combined with the characteristics of China’s high-tech industry development, this paper puts forward the following hypothesis:
Hypothesis 2 (H2).
Regional education level has a significant positive effect on the high-tech industry’s export product upgrading, and the influence of high-tech industry agglomeration on export product upgrading is negatively regulated by regional education level.
3. Methodology
3.1. Model and Method
In order to verify the previous relevant hypothesis, according to the new trade theory [9] and the existing research results, this paper plans to include the relevant variables affecting export product upgrading and constructs the production function as follows:
where i represents the region, t represents the year, Expu represents the export product upgrading, Agg represents the degree of industry agglomeration, Edu represents the regional education level, Control represents the control variables, and represents a random perturbation term.
where R&D represents R&D investment, Fi represents regional financial revenue, Ei represents regional economic density, and Snp represents the sales of new products in the industry.
In order to further test the mediating effect of the mechanism, this paper uses the test method given by Wen Zhonglin et al. (2004) [41] to investigate the degree to which the explanatory variable acts on the explained variable through the mediating variable and further uses empirical research to test that high-tech industry agglomeration affects the technical complexity of export products. The specific measurement model is set as follows:
where i represents the region, t represents the year, represents the export product upgrading, represents the degree of industry agglomeration, represents the mediating variables including the innovation ability of the enterprise and the degree of openness, represents the control variables, and represent the random disturbance terms. According to Wen Zhonglin ‘s model settings, Equation (24) is the basic regression result that examines the overall effect of high-tech industry agglomeration on export product upgrading. It is expected that the overall effect of high-tech industry agglomeration in promoting the export product upgrading is positive. Furthermore, Equation (25) investigates the impact of high-tech industry agglomeration on the mediating variable. It is expected that the impact of high-tech industry agglomeration on each mediating variable is positive. Equation (26) examines the indirect impact of high-tech industry agglomeration. It is expected the indirect effect of high-tech industry agglomeration to promote export product upgrading to be positive. The specific steps to determine whether there is a mediating effect are as follows:
First, if passes the significance test, then the high-tech industry agglomeration has a positive impact on export product upgrading, and the next step is continued. If it is not significant, the judgment is suspended, and there is no mediating effect.
Second, on the basis of passing the significance test in the previous step, the mediating effect of Formulas (25) and (26) is tested. If , is significant, then the mediating effect is significant, and then further test . If significantly represents that high-tech industry agglomeration has a direct impact on export product upgrading, which is a partial mediating effect and if is not significant, it means that the high-tech industry agglomeration has no direct impact on export product upgrading, which is a complete mediating effect. If at least one of σ1 > 0 and ω2 > 0 is not significant, the sobel test is required. If the test is significant, the mediating effect is significant; otherwise, the mediating effect is not significant.
Third, when the mediating effect is significant and is significant, it indicates that the promotion of high-tech industry agglomeration on export product upgrading is partly realized through the mediating variable M, and the proportion of the mediating effect in the total utility is
where and are the standard errors of and , respectively.
In this paper, stata15 software is selected for econometric analysis (including mediating effect test). Based on the idea of linear regression, different methods such as fixed effect, maximum likelihood estimation and System GMM are used to analyze the corresponding models in the rest of the regression analysis, which lays a foundation for the robustness and rationality of the model.
3.2. Variable Selection
Explained variable: export product upgrading of high-tech industry (Expy). Based on the practice of Zhou et al. (2019) [42], this paper uses the complexity of export technology to represent the export product upgrading of high-tech industry. First, the export technical complexity of product r is calculated by the following formula ():
where represents the value of export product r in region i, represents the total export value of all high-tech products, and is the per capita GDP in region i. At the same time, this paper divides the high-tech industries in various regions into electronic and communication equipment manufacturing, aerospace manufacturing, medical equipment and instrument manufacturing, computer and office equipment manufacturing, pharmaceutical manufacturing, etc., constituting five categories. Further, by summing the ESr of various industries, the export technical complexity (Expu) of high-tech industry in j region can be obtained. The specific calculation formula is as follows:
where is the total export products value of all high-tech in j region, and represents the share of product r in the total export value of high-tech industry.
Core explanatory variable: high-tech industry agglomeration (). Based on the practice of Zhang et al. (2019) [43] and the idea of location entropy, this paper uses the number of employees in regional industries to obtain the regional specialized index. The specific indicators and descriptions are as follows:
where represents the location entropy of the i industry in the j region, which is an indicator reflecting the degree of specialization of the i industry in the j region, represents the number of employees of the i industry in the j region, represents the total employment in the j region, represents the number of employees of the i industry nationwide, and q represents the number of employees in all industries nationwide.
Mediating variable: The mediating variables in the regression model include: (1) Innovation ability: select the number of new industry R&D projects in the industry in the year to measure nationwide. (2) The degree of openness: At present, the indicators to measure the degree of regional openness include the ratio of imports to GDP, the ratio of foreign investment to GDP, and the proportion of migrant workers to the total population. Based on the research needs (currently, the introduction of foreign technology mostly takes the form of foreign investment) and the availability of data, this paper selects the proportion of annual net foreign investment (RMB is calculated at the current exchange rate) to GDP to describe the degree of regional openness.
Moderating variable: Use the average years of education of the labor force in the region to reflect the education level of the region.
Control variables: (1) Fiscal revenue: select the ratio of annual regional fiscal revenue to GDP. (2) Economic density: divide regional GDP by regional area. (3) R&D Investment: select R&D internal expenditure. (4) Sales of new products: calculated by using the total sales revenue of new products in the current year.
3.3. Data Sources
Considering the availability of data, the sample period of this paper is from 2010 to 2016. In view of the serious lack of data in Tibet, the sample is not included in this study, and the final sample included 30 provinces and municipalities directly under the Central Government. The original data come from the “China High-tech Industry Statistical Yearbook” (over the past years), “China’s Science and Technology Statistical Yearbook” (over the past years), “China Urban Statistical Yearbook”, “China Statistical Yearbook” (over the past years) and the statistical yearbooks of various provinces over the years. Variable selection and interpretation are shown in Table 1.

Table 1.
Descriptive statistics.
This paper selects 210 consecutive sample values, including the sample mean, variance, maximum and minimum values of 11 variables. Through the test, the absolute value of the correlation coefficient between variables is [0.01,0.78], and the maximum value does not exceed 0.8. At the same time, the calculation of variance expansion factor (VIF) shows that the average value of variance expansion factor of each variable is 3.4, and the maximum value is 5.11 (<10); thus, it can be considered that the degree of multicollinearity between variables is relatively acceptable.
4. Result
4.1. Empirical Test
According to Formula (22), this paper empirically tests the impact of high-tech industry agglomeration on its export product upgrading, and then tests its robustness. At the same time, in order to overcome the possible endogenous problems in the model variables, a dynamic panel is further constructed to test the model. The test results are as Table 2:
Table 2.
Basic test.
It can be seen that the Hausmann test of model I and model II is not significant, and the random effect is selected. Model III and model IV selected the fixed effects by the Hausman test. The empirical results show that, first, the high-tech industry agglomeration coefficients in models I-IV are all significantly positive, indicating that China’s high-tech industry agglomeration has a significant role in promoting the upgrading of export products, which verifies hypothesis H1. Second, model III and model IV show that the coefficient of regional education level is significantly positive, and the interaction term between industry agglomeration and education level is significantly negative, indicating that regional education has a significant effect on export product upgrading. The influence of high-tech industry agglomeration on export product upgrading is negatively regulated by regional education level, which verifies the hypothesis H2. In terms of control variables, the coefficient of fiscal revenue is significantly negative, indicating that there is a negative correlation between fiscal revenue and export upgrading, which is consistent with the fact in China. Fiscal revenue comes from tax, and most of the tax comes from enterprises. Excessive enterprise burden will affect the economic status of enterprises and will then affect the product upgrading of enterprises; the economic density coefficient is significantly positive, indicating that the regional economic environment has a certain role in promoting the product technology upgrading of enterprises.
In order to test the robustness of the model, this paper selects the maximum likelihood estimation method to control the time effect and regional effect of the original model, and the results are basically consistent with the basic test (refer to Table 3). Among them, the relationship among export product upgrading, high-tech industry agglomeration and regional education level is basically consistent with the basic test (including the moderating effect). Except for individual variables, most of the control variables are consistent with the basic test results, which also verify the robustness of the model to a certain extent.
Table 3.
Robust test.
The static panel data model easily ignores the impact of cultural environment, system and other factors that also play an important role in export product upgrading. At the same time, considering the possible endogenous problems in the model variables, that is, the causal relationship between the explained variables and the explanatory variables, the potential sample selectivity deviation and the missing variable deviation, this paper introduces the first-order lag term of export product upgrading to construct the dynamic panel model and uses the system GMM to correct some errors in the results of the static panel model.
As shown in Table 4, the p values of AR (2) in model I, model II and model III are greater than 0.05, indicating that the model has no second-order autocorrelation, and the random interference term has no sequence correlation. The sargan test values for judging the excessive identification of tool variables are greater than 0.05, indicating that the tool variables selected by the model are effective. The results show that the dynamic panel regression results are generally consistent with the basic test, in which the lag term of export product upgrading has a significant positive impact on it. High-tech industry agglomeration and education level have a significant positive impact on export product upgrading, and the impact of high-tech industry agglomeration on export product upgrading is significantly negatively regulated by regional education level.
Table 4.
Dynamic panel test.
4.2. Impact Mechanism Test
From the previous analysis, it can be seen that the high-tech industry agglomeration may promote export product upgrading through transmission mechanisms such as innovation ability and openness. On the basis of basic regression, this paper further adds various mediating variables to verify the previous analysis and hypothesis (refer to Table 5 for details).
Table 5.
Impact mechanism test.
From the previous analysis, it can be seen that the high-tech industry agglomeration may promote export product upgrading through transmission mechanisms such as innovation ability and openness. On the basis of basic regression, this paper further adds various mediating variables to verify the previous analysis and hypothesis.
When the mediating variable is the degree of openness, the coefficients of the high-tech industry agglomeration and mediating variable on export product upgrading are significantly positive (model I), and the coefficients of export product upgrading on the mediating variable is also significantly positive (model II). The coefficient symbols in the models are consistent with the expected theoretical symbols in the model construction. According to the model construction theory, the sobel test is no longer required. The proportion of mediating effect of the total effect is 7.33%.
When the mediating variable is the innovation ability, the coefficients of high-tech industry agglomeration and mediating variable on export product upgrading are significantly positive (Model III), but the coefficient of export product upgrading on the mediating variable is not significant (Model IV). According to the model construction theory, it is necessary to further conduct a sobel test. The test result is that the Z statistic is 1.21, which is higher than the significance level of 5% of the MacKinnon critical value (0.97); thus, the significance test is passed. The proportion of the calculated mediating effect to the total effect is 5.64%.
4.3. Heterogeneity Test
4.3.1. Scale Heterogeneity Test
The results of Table 6 show that, first, whether taking large enterprises or small- and medium-sized enterprises as samples, the regional education level has a significant role in promoting the export product upgrading in high-tech industry. Second, the agglomeration of large enterprises in high-tech industry has a significant role in promoting export product upgrading, while small- and medium-sized enterprises have not passed the significant test. Finally, the moderating effect of regional education level on high-tech industry agglomeration and its export product upgrading is only significantly negative for large enterprises but is not significant for small- and medium-sized enterprises.
Table 6.
Scale heterogeneity test.
4.3.2. Regional Heterogeneity Test
Due to the differences in economic conditions, factor endowments, labor conditions and market mechanism in various regions, the impact of high-tech industry agglomeration on export product upgrading is also unbalanced. The nationwide regression test is likely to ignore some regional characteristics. Therefore, it is necessary for subregions to further examine its heterogeneity characteristics. The results in Table 7 show that the promotion of high-tech industry agglomeration on export product upgrading is significant in the eastern and western regions but not significant in the central region.
Table 7.
Regional heterogeneity test.
4.3.3. Industry Heterogeneity Test
According to “High-tech Industry (Manufacturing) Classification (2013)”, China’s high-tech industries are divided into six industries: pharmaceutical manufacturing (PM), aerospace and equipment manufacturing (AEM), electronic and communication equipment manufacturing (ECEM), computer and office equipment manufacturing (COEM), medical equipment manufacturing (MEM) and information chemistry manufacturing (ICM). However, since the data of the information chemical manufacturing industry are only available after 2015, this paper only selects the top five industries for regression, and the results are shown in Table 8.
Table 8.
Regional heterogeneity test.
The results show that the industry agglomeration of the pharmaceutical manufacturing industry and aerospace and equipment manufacturing industry on export product upgrading does not pass the significance test, indicating that the industry agglomeration of these two industries does not have a significant effect on export product upgrading. The other three are significantly positive, indicating that the industry agglomeration of the latter three industries plays a significant role in promoting the export product upgrading, and the moderating effect of education level on it is basically consistent with the overall sample.
5. Discussion
First, this study empirically tests the impact of high-tech industry agglomeration on its export product upgrading. It is found that high-tech industry agglomeration can significantly promote export product upgrading, which is basically consistent with the research conclusions of [44]. In the test of impact mechanism, the mediating effect of innovation ability and openness are also significantly positive, which further verifies the hypothesis H2. The purpose of high-tech industry agglomeration is to improve product quality and promote product upgrading by improving industry technology [45,46]. The direct way to improve product quality and promote product upgrading is technological innovation, and industry agglomeration has a significant role in promoting technological innovation to a large extent [47,48]. Industry agglomeration promotes enterprise technological innovation and industry product upgrading through regional technology spillover, resource allocation and reducing production costs. However, when the technological level of high-tech industry in the region lags far behind the external level, the industry will face greater industrial pressure, but at the same time, there is also greater room for improvement. Compared with independent innovation, it is easier to improve the overall technological level of the industry and promote product upgrades by means of openness and technology spillovers [49]. In addition, compared with domestic products, export products are facing higher quality requirements and greater competitive pressure [50,51,52]. Therefore, the impact of industry agglomeration on product upgrading through corresponding effects is more significant in export products.
Second, this study empirically tests that regional education has a significant role in promoting export product upgrading, and the impact of high-tech industry agglomeration on the upgrading of export products is negatively regulated by the level of education. Some research shows that regional education plays a significant role in promoting the cultivation of high-tech talents, and high-tech talents are the basic conditions of technological innovation [53]. Regional education promotes scientific and technological innovation of enterprises through talent training and then achieves the purpose of promoting product upgrading [54]. However, compared with regions with low education level, high-tech talents are relatively saturated in regions with high education level, the industry technology level has reached the bottleneck, and the spillover effect of foreign science and technology in the region is relatively reduced [55]. At this time, the effect of industry agglomeration is not as good as that in regions with a low education level.
Finally, this study further investigates the heterogeneity of samples in different ranges and categories. Based on the heterogeneity of scale, agglomeration of large enterprises in high-tech industry has a significant role in promoting export product upgrading, while small- and medium-sized enterprises have not passed the significant test. The main reasons are as follows: first, in terms of statistical data, the number and output value of large enterprises have an absolute advantage in the overall sample in China’s high-tech industry, and their agglomeration effect has a more significant impact on regional export product upgrading than small- and medium-sized enterprises. Second, generally speaking, among the same type of enterprises, the larger the scale, the easier it is to obtain financial and policy support in the region where they are located, and even give enterprises export subsidies. The enterprises that have received financial support or export subsidies have more advantages in investment in R&D and improving productivity, which have a more significant impact on export product upgrading [56,57]. Third, from the perspective of innovation promoting export upgrading, large enterprises with large scale and strong strength can not only bear more risks of innovation failure in the process of technology research and development, but also make themselves far ahead of other enterprises in technology research and development by their large numbers of resources and innovation projects, these advantages can promote their technology upgrading and then promote the export product upgrading [58]. Based on the regional heterogeneity, the promotion of high-tech industry agglomeration on export product upgrading is significant in the eastern and western regions, but not significant in the central region. The main reasons are as follows: there are not only many coastal ports with a large export volume in the eastern region of China, but also the high-tech industry here is relatively developed, the export quality is highly dependent on the high-tech industry, the development of high-tech industry in the western region is in the initial stage, and the industry agglomeration effect is usually more significant in this period [59]. In addition, there is large room for the rise in export products in the western region. The promotion of high-tech industry will have a more significant impact on export product upgrading [36]; in the central region, products and services are relatively rich. The high-tech industry accounts for a small proportion of the industrial structure. The effect of industrial diversity interferes with the impact of high-tech industry agglomeration on export quality to a certain extent, resulting in its insignificant impact. In addition, regional education has a significant promoting effect on export product upgrading in each region. This result is consistent with the previous hypothesis, but the moderating effect of education level on export product upgrading relative to high-tech industry agglomeration has not passed the significance test. The reason may be that the educational level gap among one region (eastern, central or western) of China is relatively small, and its moderating effect on the agglomeration of high-tech industries and export product upgrading does not appear from the small educational gap. Based on the heterogeneity of the industry, the industry agglomeration of the pharmaceutical manufacturing industry and aerospace and equipment manufacturing industry on export product upgrading does not pass the significance test, while the other three are significantly positive. The main reasons are as follows: the development of China’s pharmaceutical manufacturing industry is relatively backward, the independent research and development and production capacity of drugs is not strong, and there is long-term dependence on imports, coupled with factors such as patent protection, which makes the spillover effect of talents, knowledge and technology small, resulting in a high cost of industry agglomeration and insignificant effects on export upgrading. The threshold for aerospace and equipment manufacturing is relatively high, and the participation of the public and capital is low. Many of them involve state secrets, and aerospace and equipment manufacturers have strict requirements for gathering locations. Therefore, the agglomeration of the aerospace and equipment manufacturing industry has no significant effect on export upgrading. The promotion of the electronics and communication equipment manufacturing industry is due to the fact that China’s electronics and communication equipment manufacturing industry has developed well and has a high degree of industry agglomeration. Some well-known enterprises have emerged, such as Lenovo, ZTE, Huawei, etc., which not only promote the employment of a large number of labor forces in China, but also promote export product upgrading of high-tech industries to a certain extent. The industry agglomeration of the medical instruments and meters manufacturing industry and computer and office equipment manufacturing industry is relatively weak, indicating that the industry agglomeration of medical instruments and meters and computer and office equipment manufacturing industry has relatively little impact on export product upgrading of the high-tech industry.
6. Conclusions and Recommendations
6.1. Conclusions
Based on the inter-provincial high-tech industry panel data from 2010 to 2016, this paper first sorts out the transmission mechanism of the high-tech industry agglomeration promoting export product upgrading, fills the gap of open innovation based on cluster level to promote the sustainable development of the regional economy, and then constructs static and dynamic panel models respectively for regression analysis and robustness tests. Finally, it tests the mediating effect and the heterogeneity.
The results show that first, China’s high-tech industry agglomeration plays a significant role in promoting export product upgrading as a whole. Second, the regional education level has a significant role in promoting export product upgrading. The relationship between high-tech industry agglomeration and export product upgrading is negatively affected by the regional education level. Third, high-tech industry agglomeration significantly promotes export product upgrading through the two mediating effects of openness and innovation ability. Fourth, based on the heterogeneity of scale, the agglomeration of large enterprises in China’s high-tech industry can significantly promote export product upgrading, while the small- and medium-sized enterprises are not significant; based on regional heterogeneity, high-tech industry agglomeration can significantly promote export product upgrading in the eastern and western regions, but it is not significant in the central region. Regional education level has a significant role in promoting export product upgrading in the eastern, central and western regions, but the moderating effect of education level on export product upgrading of high-tech industry agglomeration has not passed the significance test. Based on industry heterogeneity, the electronic and communication equipment manufacturing industry, medical equipment and instrument manufacturing industry, and the computer and office equipment manufacturing industry in the high-tech industry have played a significant role in promoting export product upgrading, while the pharmaceutical manufacturing industry and aerospace and equipment manufacturing industry are not significant.
6.2. Recommendations
Overall, this paper verifies that high-tech industry agglomeration can be used as the internal driving force to upgrade export products. Based on the above research, this paper puts forward the following recommendations.
First, the government should increase support for high-tech industries and promote the level of high-tech industry agglomeration. The research results show that the agglomeration of the high-tech industry has a significant effect on export product upgrading at the national level. At present, China’s economy is in the recovery period after the epidemic. The government should further reduce the amount of tax payment or provide more discount services to help high-tech enterprises tide over difficulties so as to realize the sustainable development of high-tech industry agglomeration.
Second, strengthen investment in education and improve the regional education level. The development of high-tech industries is inseparable from high-level talents, and the cultivation of high-level talents is inseparable from education. Local governments should carry out relevant industry education and training activities according to their own regional characteristics to cultivate sufficiently skilled labor for local high-tech industries. However, the government should strengthen the training of high-tech talents, increase investment in colleges and universities, scientific research institutes and enterprises with R&D capacity in the region, encourage them to innovate and develop high-technology, and promote product upgrading with technological development.
Third, promote the balanced development of China’s high-tech industries, especially the pharmaceutical manufacturing industry. The research results show that pharmaceutical manufacturing industry agglomeration has a poor role in promoting exports upgrading, the pharmaceutical manufacturing industry is in the downstream of the medical industry, and its development level is directly related to people’s health. At this stage, many domestic drugs have insufficient independent R&D and production capacity, long-term dependence on imports and lack of patent protection, which have led to the relatively backward development of China’s pharmaceutical manufacturing industry. In order to alleviate this contradiction, it is necessary to gradually strengthen the independent research and development capabilities of related drugs and increase the localization rate of high-end drugs. This requires the government to give full play to its intervention role, encourage major scientific research institutions to strengthen drug R&D, and further promote the development of the pharmaceutical industry.
Fourth, expand openness and improve the open innovation capability of industries. The government should accurately grasp the new trend of economic globalization and the new requirements of openness. To establish a more perfect and dynamic open economic system, we should not only promote regional economic development at the economic level, but also learn foreign advanced technology from the technical level through the knowledge spillover effect, so as to provide better support and a better platform for China’s open industry and provide impetus for China’s sustainable development.
Fifth, formulate policies for the development of high-tech industries according to local conditions and regional characteristics. Research shows that different regions are quite different in terms of economic foundation, infrastructure, market environment, factor endowments, which makes the development and agglomeration of high-tech industries in these regions have a certain gap. The development of high-tech industry should be combined with regional resource advantages. The eastern region should further optimize the internal organizational structure of industry clusters, further stimulate innovation vitality, form strong core industries, and promote and lead the transformation of China’s high-tech industries from middle- and low-end industry agglomeration to high-end industry agglomeration. The central region should properly combine local characteristics, strengthen and improve supporting infrastructure, cultivate high-tech industries with local characteristics, optimize industrial structure and promote the rapid development of high-tech industry agglomeration. The western region should increase infrastructure construction, improve the market system, and continuously optimize the market business environment, encourage the development of high-tech industry, and create a favorable environment for the development of high-tech industry.
This paper discusses the relationship between open innovation and regional sustainable development from the cluster level, filling the gap in the previous literature, which is only based on the enterprise or regional level, but at the same time, this paper does not go deep into the research on the cluster organization relationship, and future research will be involved. This paper only uses the data of China’s high-tech industries, but does not conduct comparative research cooperation with other industries and other developed economies. Therefore, when it comes to other industries and other economies, the interpretation of results should be cautious. Future research may involve the impact of industrial agglomeration in different economies or different representative industries on the upgrading of export products so as to comprehensively study and discuss this issue.
Author Contributions
K.P. wrote the paper and revised the manuscript. F.H. was involved in the result analysis and discussion. R.L. organized and performed the data collection. All authors have read and agreed to the published version of the manuscript. K.P. and F.H. are the corresponding authors of this article.
Funding
This research was supported by the National Social Science Foundation of China. (grant number: 21AZD108); Natural Science Foundation of Beijing Municipality (grant number: 9222021); National Natural Science Foundation of China (grant number: 72172072, 71673022).
Institutional Review Board Statement
Not applicable.
Informed Consent Statement
Not applicable.
Data Availability Statement
The datasets generated and analyzed during the current study are available from the corresponding author on reasonable request.
Conflicts of Interest
The authors declare no conflict of interest.
References
- Srholec, M. High-Tech Exports from developing countries: A symptom of technology spurts or statistical illusion? Rev. World Economics 2007, 143, 227–255. [Google Scholar] [CrossRef]
- Porter, M.E. The five competitive forces that shape strategy. Harv. Bus. Rev. 2008, 86, 1–78. [Google Scholar]
- Rodrik, D. What’s so special about China’s exports. China World Econ. 2006, 14, 1–19. [Google Scholar] [CrossRef]
- Schott, P.K. The relative sophistication of Chinese exports. Econ. Policy 2008, 53, 6–49. [Google Scholar]
- Amiti, M.; Freund, C. The Anatomy of China’s Export Growth; Policy Research Working Paper; Series 4628; The World Bank: Washington, DC, USA, 2008. [Google Scholar] [CrossRef]
- Xu, B.; Lu, J. Foreign direct investment, processing trade and the sophistication of China’s exports. China Econ. Rev. 2009, 20, 425–439. [Google Scholar] [CrossRef]
- Liu, Q.; Lu, Y. Firm investment and exporting: Evidence from China’s value-added tax reform. J. Int. Econ. 2015, 97, 392–403. [Google Scholar] [CrossRef]
- Jarreau, J.; Poncet, S. Export sophistication and economic growth: Evidence from China. J. Dev. Econ. 2011, 97, 281–292. [Google Scholar] [CrossRef]
- Greenaway, D.; Kneller, R. Exporting, productivity and agglomeration. Eur. Econ. Rev. 2008, 52, 919–939. [Google Scholar] [CrossRef]
- Liu, X.; Zhang, X. Industrial agglomeration, technological innovation and carbon productivity: Evidence from China. Resour. Conserv. Recycl. 2021, 166, 105330. [Google Scholar] [CrossRef]
- Koenig, P.; Mayneris, F.; Poncet, S. Local export spillovers in France. Eur. Econ. Rev. 2010, 54, 622–641. [Google Scholar] [CrossRef]
- Hong, J.; Yu, W.; Guo, X.; Zhao, D. Creative industries agglomeration, regional innovation and productivity growth in China. Chin. Geogr. Sci. 2014, 24, 258–268. [Google Scholar] [CrossRef]
- Su, D.N.; Sheng, B.; Shao, C.D. Industrial agglomeration and firms’ export product quality upgrading. China Ind. Econ. 2018, 11, 117–135. [Google Scholar]
- Wilson, J.S.; Mann, C.L.; Otsuki, T. Trade facilitation and economic development: A new approach to quantifying the impact. World Bank Econ. Rev. 2003, 17, 367–389. [Google Scholar] [CrossRef]
- Wilson, J.S.; Mann, C.L.; Otsuki, T. Assessing the benefits of trade facilitation: A global perspective. World Econ. 2005, 28, 841–871. [Google Scholar] [CrossRef]
- Portugal, P.A.; Wilson, J.S. Export performance and trade facilitation reform: Hard and soft infrastructure. World Dev. 2012, 40, 1295–1307. [Google Scholar] [CrossRef]
- Khandelwal, A.K.; Schott, P.K.; Wei, S.J. Trade liberalization and embedded institutional reform: Evidence from Chinese exporters. Am. Econ. Rev. 2013, 103, 2169–2195. [Google Scholar] [CrossRef]
- Aghion, P.; Howitt, P. The Economics of Growth; MIT Press: Cambridge, MA, USA, 2009. [Google Scholar]
- Huizingh, E.K.R.E. Open innovation: State of the art and future perspectives. Technovation 2011, 31, 2–9. [Google Scholar] [CrossRef]
- Laursen, K.; Salter, A. Open for innovation: The role of openness in explaining innovation performance among UK manufacturing firms. Strateg. Manag. J. 2006, 27, 131–150. [Google Scholar] [CrossRef]
- Zhu, X.X.; Xiao, Z.X.; Dong, M.C.; Gu, J. The fit between firms’ open innovation and business model for new product development speed: A contingent perspective. Technovation 2019, 86, 75–85. [Google Scholar] [CrossRef]
- Rauter, R.; Globocnik, D.; Perl-Vorbach, E.; Baumgartner, R.J. Open innovation and its effects on economic and sustainability innovation performance. J. Innov. Knowl. 2018, 4, 226–233. [Google Scholar] [CrossRef]
- Parida, V.; Westerberg, M.; Frishammar, J. Inbound Open Innovation Activities in High-Tech SMEs: The Impact on Innovation Performance. J. Small Bus. Manag. 2012, 50, 283–309. [Google Scholar] [CrossRef]
- Hung, K.P.; Chou, C. The impact of open innovation on firm performance: The moderating effects of internal R&D and environmental turbulence. Technavation 2013, 33, 368–380. [Google Scholar]
- Kennedy, S.; Whiteman, G.; van den Ende, J. Radical Innovation for Sustainability: The Power of Strategy and Open Innovation. Long Range Plan. 2017, 50, 712–725. [Google Scholar] [CrossRef]
- Hamdani, J.; Wirawan, C. Open Innovation Implementation to Sustain Indonesian SMEs. Procedia Econ. Financ. 2012, 4, 223–233. [Google Scholar] [CrossRef]
- Van, G.E.; Gonzalez, A.C.; Mulder, I. Open Innovation Strategies for Sustainable Urban Living. Sustainability 2019, 11, 3310. [Google Scholar]
- Maier, G.; Selacek, S. Spillovers and Innovations: Space, Environment and the Economy; Springer: Vienna, Austria, 2005. [Google Scholar]
- McPhillips, M. Innovation by proxy–clusters as ecosystems facilitating open innovation. J. Enterp. Manag. Innov. 2020, 16, 101–128. [Google Scholar] [CrossRef]
- Lis, A.M.; McPhillips, M.; Lis, A. Sustainability of Cluster Organizations as Open Innovation Intermediaries. Sustainability 2021, 12, 10520. [Google Scholar] [CrossRef]
- Cano, J.A.; Londono-Pineda, A.; Castro, M.F.; Paz, H.B.; Rodas, C.; Arias, T. A Bibliometric Analysis and Systematic Review on E-Marketplaces, Open Innovation, and Sustainability. Sustainability 2022, 14, 5456. [Google Scholar] [CrossRef]
- Ge, Y. Globalization and industry agglomeration in China. World Dev. 2009, 37, 550–559. [Google Scholar] [CrossRef]
- Yang, N.; Hong, J.; Wang, H.; Liu, Q. Global value chain, industrial agglomeration and innovation performance in developing countries: Insights from China’s manufacturing industries. Technol. Anal. Strateg. Manag. 2020, 32, 1307–1321. [Google Scholar] [CrossRef]
- Howitt, P. Endogenous growth and cross-country income diferences. Am. Econ. Rev. 2000, 90, 829–846. [Google Scholar] [CrossRef]
- Aghion, P.; Akcigit, U.; Howitt, P. What do we learn from schumpeterian growth theory? Handb. Econ. Growth 2014, 2, 515–563. [Google Scholar]
- Acemoglu, D.; Akcigit, U.; Hanley, D. Transition to clean technology. J. Political Econ. 2016, 124, 52–104. [Google Scholar] [CrossRef]
- Toulemonde, E. Acquisition of skills, labor subsidies, and agglomeration of firms. J. Urban Econ. 2006, 59, 420–439. [Google Scholar] [CrossRef]
- Gabe, T.M.; Abel, J.R. Shared knowledge and the coagglomeration of occupations. Reg. Stud. 2016, 50, 1360–1373. [Google Scholar] [CrossRef]
- Guliyeva, A.; Averina, L.; Grebennikov, O.; Shpakov, A. Regional gap in human capital: Determinants of education and urbanization. In Proceedings of the E3S Web of Conferences, Ekaterinburg, Russian Federation, 23–25 July 2021; Volume 301, p. 03004. Available online: Scimagojr.com (accessed on 1 March 2021).
- Claver, N.D.; Castejon, C.F.; Gracia, F.S. External economies as a mechanism of agglomeration in EU manufacturing. Appiled Econ. 2010, 87, 20–54. [Google Scholar] [CrossRef][Green Version]
- Wen, Z.L.; Zhang, L.; Hou, J.T.; Liu, H.Y. Mediating effect test program and its application. J. Psychol. 2004, 36, 614–620. [Google Scholar]
- Zhou, M.; Li, Y.N.; Yao, X. Human capital expansion and export upgrading of China’s urban manufacturing industry: Evidence from the expansion of college enrollment. J. Manag. World 2019, 5, 64–77. [Google Scholar]
- Zhang, Y.Y.; Bai, D.B.; Wang, J. Industry agglomeration and export behavior of Chinese Enterprises: A study based on enterprise labor cost. World Econ. Res. 2019, 11, 46–64. [Google Scholar]
- Tao, C.L.; Zhang, J.Z.; Cheng, B.D.; Liu, Y. An assessment of the impact of spatial agglomeration on the quality of China’s wood processing industry products. Sustainability 2019, 11, 3961. [Google Scholar] [CrossRef]
- Zheng, J.Y.; Hu, H. Industrial agglomeration and product quality improvement of food enterprises: Empirical analysis based on data from Chinese enterprises. Food Sci. Technol. 2022, 42, 38521. [Google Scholar] [CrossRef]
- Han, D.G. Does firm agglomeration improve production efficiency?: A Korean experience. J. Econ. Stud. 2008, 26, 269–291. [Google Scholar]
- Zhang, H. How does agglomeration promote the product innovation of Chinese firms? China Econ. Rev. 2015, 35, 105–120. [Google Scholar] [CrossRef]
- Jang, S.; Kim, J.; von Zedtwitz, M. The importance of spatial agglomeration in product innovation: A microgeography perspective. J. Bus. Res. 2017, 78, 143–154. [Google Scholar] [CrossRef]
- Goncalves, E.; Taveira, J.G.; Labrador, A.; Pio, J.G. Is trade openness a carrier of knowledge spillovers for developed and developing countries? Struct. Chance Econ. Dyn. 2021, 58, 66–75. [Google Scholar] [CrossRef]
- Loecker, D.J. Do exports generate higher productivity? Evidence from Slovenia. J. Int. Econ. 2007, 73, 69–98. [Google Scholar] [CrossRef]
- Hausmann, R.; Hwang, J.; Rodrik, D. What you export matters. J. Econ. Growth 2007, 12, 1–25. [Google Scholar] [CrossRef]
- Arguello, R.; Garcia-Suaza, A.; Valderrama, D. Exporters’ agglomeration and the survival of export flows: Empirical evidence from Colombia. Rev. World Econ. 2020, 156, 703–729. [Google Scholar] [CrossRef]
- Yuan, P.; Xu, D.Y. Influence of higher education on regional innovation-An empirical study based on spatial econometrics measured by China provincial data. In Proceedings of the 2016 3rd International Conference on Advanced Education and Technology and Management Science, Bangkok Thailand, 17 September 2016; pp. 59–63. [Google Scholar]
- Caniels, M.; Van den Bosch, H. The role of Higher Education Institutions in building regional innovation systems. Pap. Reg. Sci. 2011, 90, 271–286. [Google Scholar] [CrossRef]
- Goldman, B.; Klier, T.; Walstrum, T. Withi -industry agglomeration of occupations: Evidence from census microdata. J. Reg. Sci. 2019, 59, 910–930. [Google Scholar] [CrossRef]
- Laforet, S. Organizational innovation outcomes in SMEs: Effects of age, size and sector. J. World Bus. 2013, 48, 490–502. [Google Scholar] [CrossRef]
- Hirschey, M.; Skiba, H.; Wintoki, M.B. The size, concentration and evolution of corporate R&D spending in US firms from 1976 to 2010: Evidence and implications. J. Corp. Financ. 2012, 18, 496–518. [Google Scholar]
- Anokhin, S.; Wincent, J.; Parida, V.; Chistyakova, N.; Oghazi, P. Industrial clusters, flagship enterprises and regional innovation. Entrep. Reg. Dev. 2019, 31, 104–118. [Google Scholar] [CrossRef]
- Li, L.C.; Li, F.F.; Tao, C.L.; Cheng, B.D. The impact of spatial agglomeration on export of forest products manufacturing in China: Evidence from enterprises’ data. J. Sustain. For. 2019, 38, 743–754. [Google Scholar] [CrossRef]

Publisher’s Note: MDPI stays neutral with regard to jurisdictional claims in published maps and institutional affiliations. |
© 2022 by the authors. Licensee MDPI, Basel, Switzerland. This article is an open access article distributed under the terms and conditions of the Creative Commons Attribution (CC BY) license (https://creativecommons.org/licenses/by/4.0/).