Article

Geospatial Multi-Criteria Approach for Ranking Suitable Shallow Aquifers for the Implementation of an On-Farm Solar-PV Desalination System for Sustainable Agriculture

1
Laboratory of Wastewaters and Environment, Centre of Water Researches and Technologies (CERTE), Technopark Borj Cedria, Touristic Road of Soliman, BP 273, Soliman 8020, Tunisia
2
Center of Applied Research (CAR), University of Applied Sciences Karlsruhe, Moltkestraße 30, 76133 Karlsruhe, Germany
*
Author to whom correspondence should be addressed.
Sustainability 2022, 14(13), 8113; https://doi.org/10.3390/su14138113
Submission received: 13 May 2022 / Revised: 16 June 2022 / Accepted: 28 June 2022 / Published: 2 July 2022

Abstract

:
The main purpose of this study was to assess and rank suitable shallow aquifers for the implementation of a solar-PV desalination system (SmaIrriCube) in small-scale farms in arid and semi-arid Mediterranean regions, such as Tunisia. A GIS-based Multi-Criteria Decision Analysis (MCDA-GIS) model was developed. A SMART method was applied to evaluate the relative importance of the criteria and the Weighted Sum Model was used to generate the suitability map, in line with technology efficiency (SmaIrriCubeEff) and farmer acceptability (SmaIrriCubeAcc). The overall results showed that 188 out of the 204 Tunisian shallow aquifers are potentially viable for implementing the SmaIrriCube system. For SmaIrriCubeEff, the central and southern aquifers were found to be the most suitable, with a Suitability index (Si) exceeding 0.5, mostly due to the high solar irradiation and evaporation rate. In terms of acceptability, the southern aquifers are the most preferable, with a Si higher than 0.56, due to high solar irradiation, evaporation rate and groundwater quantity and quality. The results also indicated that the removal of evaporation and solar photovoltaic modules significantly affected the aquifer ranking, with the southern and central aquifers being the most sensitive to these criteria. The GIS-MCDA approach was proven to be a practical, upgradable and time/cost-efficient solution for decision-making, which can be extended to other technologies and/or regions with similar climatic characteristics.

1. Introduction

Worldwide, groundwater is an important and precious resource in supporting irrigated agriculture, especially where the surface water resources are insufficient, as groundwater provides nearly 40% of the world’s irrigated areas [1]. Unregulated and uncontrolled exploitation of these resources has caused several groundwater management problems, including water table depletion, increased salinity and quality deterioration; thus, raising serious concerns about the sustainability of irrigated agriculture [2,3]. The situation is particularly critical in the Mediterranean countries; in many arid and semi-arid regions, the limited availability and accessibility of irrigation water has pushed some farmers to rely on their shallow brackish wells in order to meet the ever-increasing water requirements of agriculture [4,5]. However, direct irrigation with brackish water may reduce crop productivity and damage the environment, soils, and aquifers in the long term in a way that may not be easily recoverable [6,7].
Concern is currently growing in these countries about the improvement and development of the groundwater management for sustainable agriculture development. In this regard, an integrated water management strategy was implemented, which calls for the development of unconventional water resources, such as the desalination of brackish groundwater. The use of desalination technologies is a promising solution to relieve the stress and shortage problems of fresh water, improve the productivity, efficiency and sustainability of water use, i.e., “more crop per drop”, increase farm productivity and enhance economic well-being [7,8].
Within the joint research EU-PRIMA SmaCuMed project, a small scale, on-farm, solar-driven desalination system, based on the reverse osmosis (RO) and membrane capacitive deionization (MCDI) desalination technologies and using an evaporation pond for brine management, was proposed as a promising solution [9]. The SmaCuMed project provides a sustainable, innovative, cost effective and robust solution for groundwater desalination in the field of smart irrigation, for sustainable agriculture in the Mediterranean region.
The selection of effective, suitable locations for this innovative system is critical to the success of the project and largely depends on various independent factors related to feed water availability (quantity and quality), land topography, climate, and environmental conditions of the study area, etc. A Multi-Criteria Decision Analysis coupled with the Geographical Information System (GIS-MCDA) represents a promising evaluation solution in the sustainable decision-making processes when multiple management objectives with large spatial data volumes cannot be simultaneously optimized [10,11]. It is a set of techniques that comprehensively evaluates the integrated performance of numerous alternatives, using multiple decision criteria and constraints [11].
Due to their great versatility and ability to manage a large volume of spatial data from a variety of sources, GIS-MCDA has been increasingly applied in numerous environmental contexts over the last few decades. In particular, it was used to rank the sustainable desalination plant locations in the United Arab Emirates [12], to plan and manage the suitable location for a community-scale brackish-water desalination plant installation in Gaza [13], to evaluate solar farm locations in Spain [14], to identify optimal locations for a hybrid wind solar–PV systems installation in western Turkey [15] and in China [16], and to select the most appropriate sites for solar-farm deployment in Greece [17]. The same methodology is used by Charabi et al. [18] to assess the land suitability for a large PV farm implementation in Oman and by Grubert et al. [19] to identify favorable locations for solar seawater desalination plants around the world. Other studies in Iran used GIS-MCDA to identify suitable sites for the implementation of solar and wind-powered desalination systems [20,21,22].
Despite extensive research employing the GIS-MCDA approach, to the best of the authors’ knowledge, all of the research has been conducted in relation to site selection, and no study has yet been applied at the aquifer level. Considering an aquifer as an elementary unit represents a key element that could produce guidelines to direct the national water resources policy for decentralized brackish groundwater desalination, and could be included in the water policy of arid and semi-arid countries.
In addition, most of the previous studies have focused on the factors influencing the renewable energy systems and/or desalination process while no integrated analytical framework has been deployed that incorporates solar energy, brackish groundwater resources, desalination technology and discharge management modules. Integrating a multitude of criteria, such as quality of water, availability of land for brine disposal, solar energy availability, the irrigator’s willingness to pay for desalination, availability, etc. is always a challenging and up-to-date issue. Identifying aquifers suitable for such integrated technologies could help to complete sustainability assessments of the water–energy–food nexus. It contributes to the attainment of the UN Sustainable Development Goals. especially numbers 2, 6, 8, 10–13 and 16. These involve ensuring the availability and sustainable management of water, food security and improved nutrition, sustainable economic growth, combating climate change and promoting inclusive societies for sustainable development. The very last objective is focused on improving the well-being of the citizens.
In this context, the purpose of this study is to identify and rank the suitable shallow aquifers in an arid and semi-arid Mediterranean region to implement an on-farm small-scale solar desalination unit for agricultural use without causing any environmental damage. For that, an approach synergizing a multi-criteria methodology with GIS, is applied while considering the significant environmental, climatic and topographic criteria. Tunisia was chosen as the study area to carry out this evaluation.

2. Materials and Methods
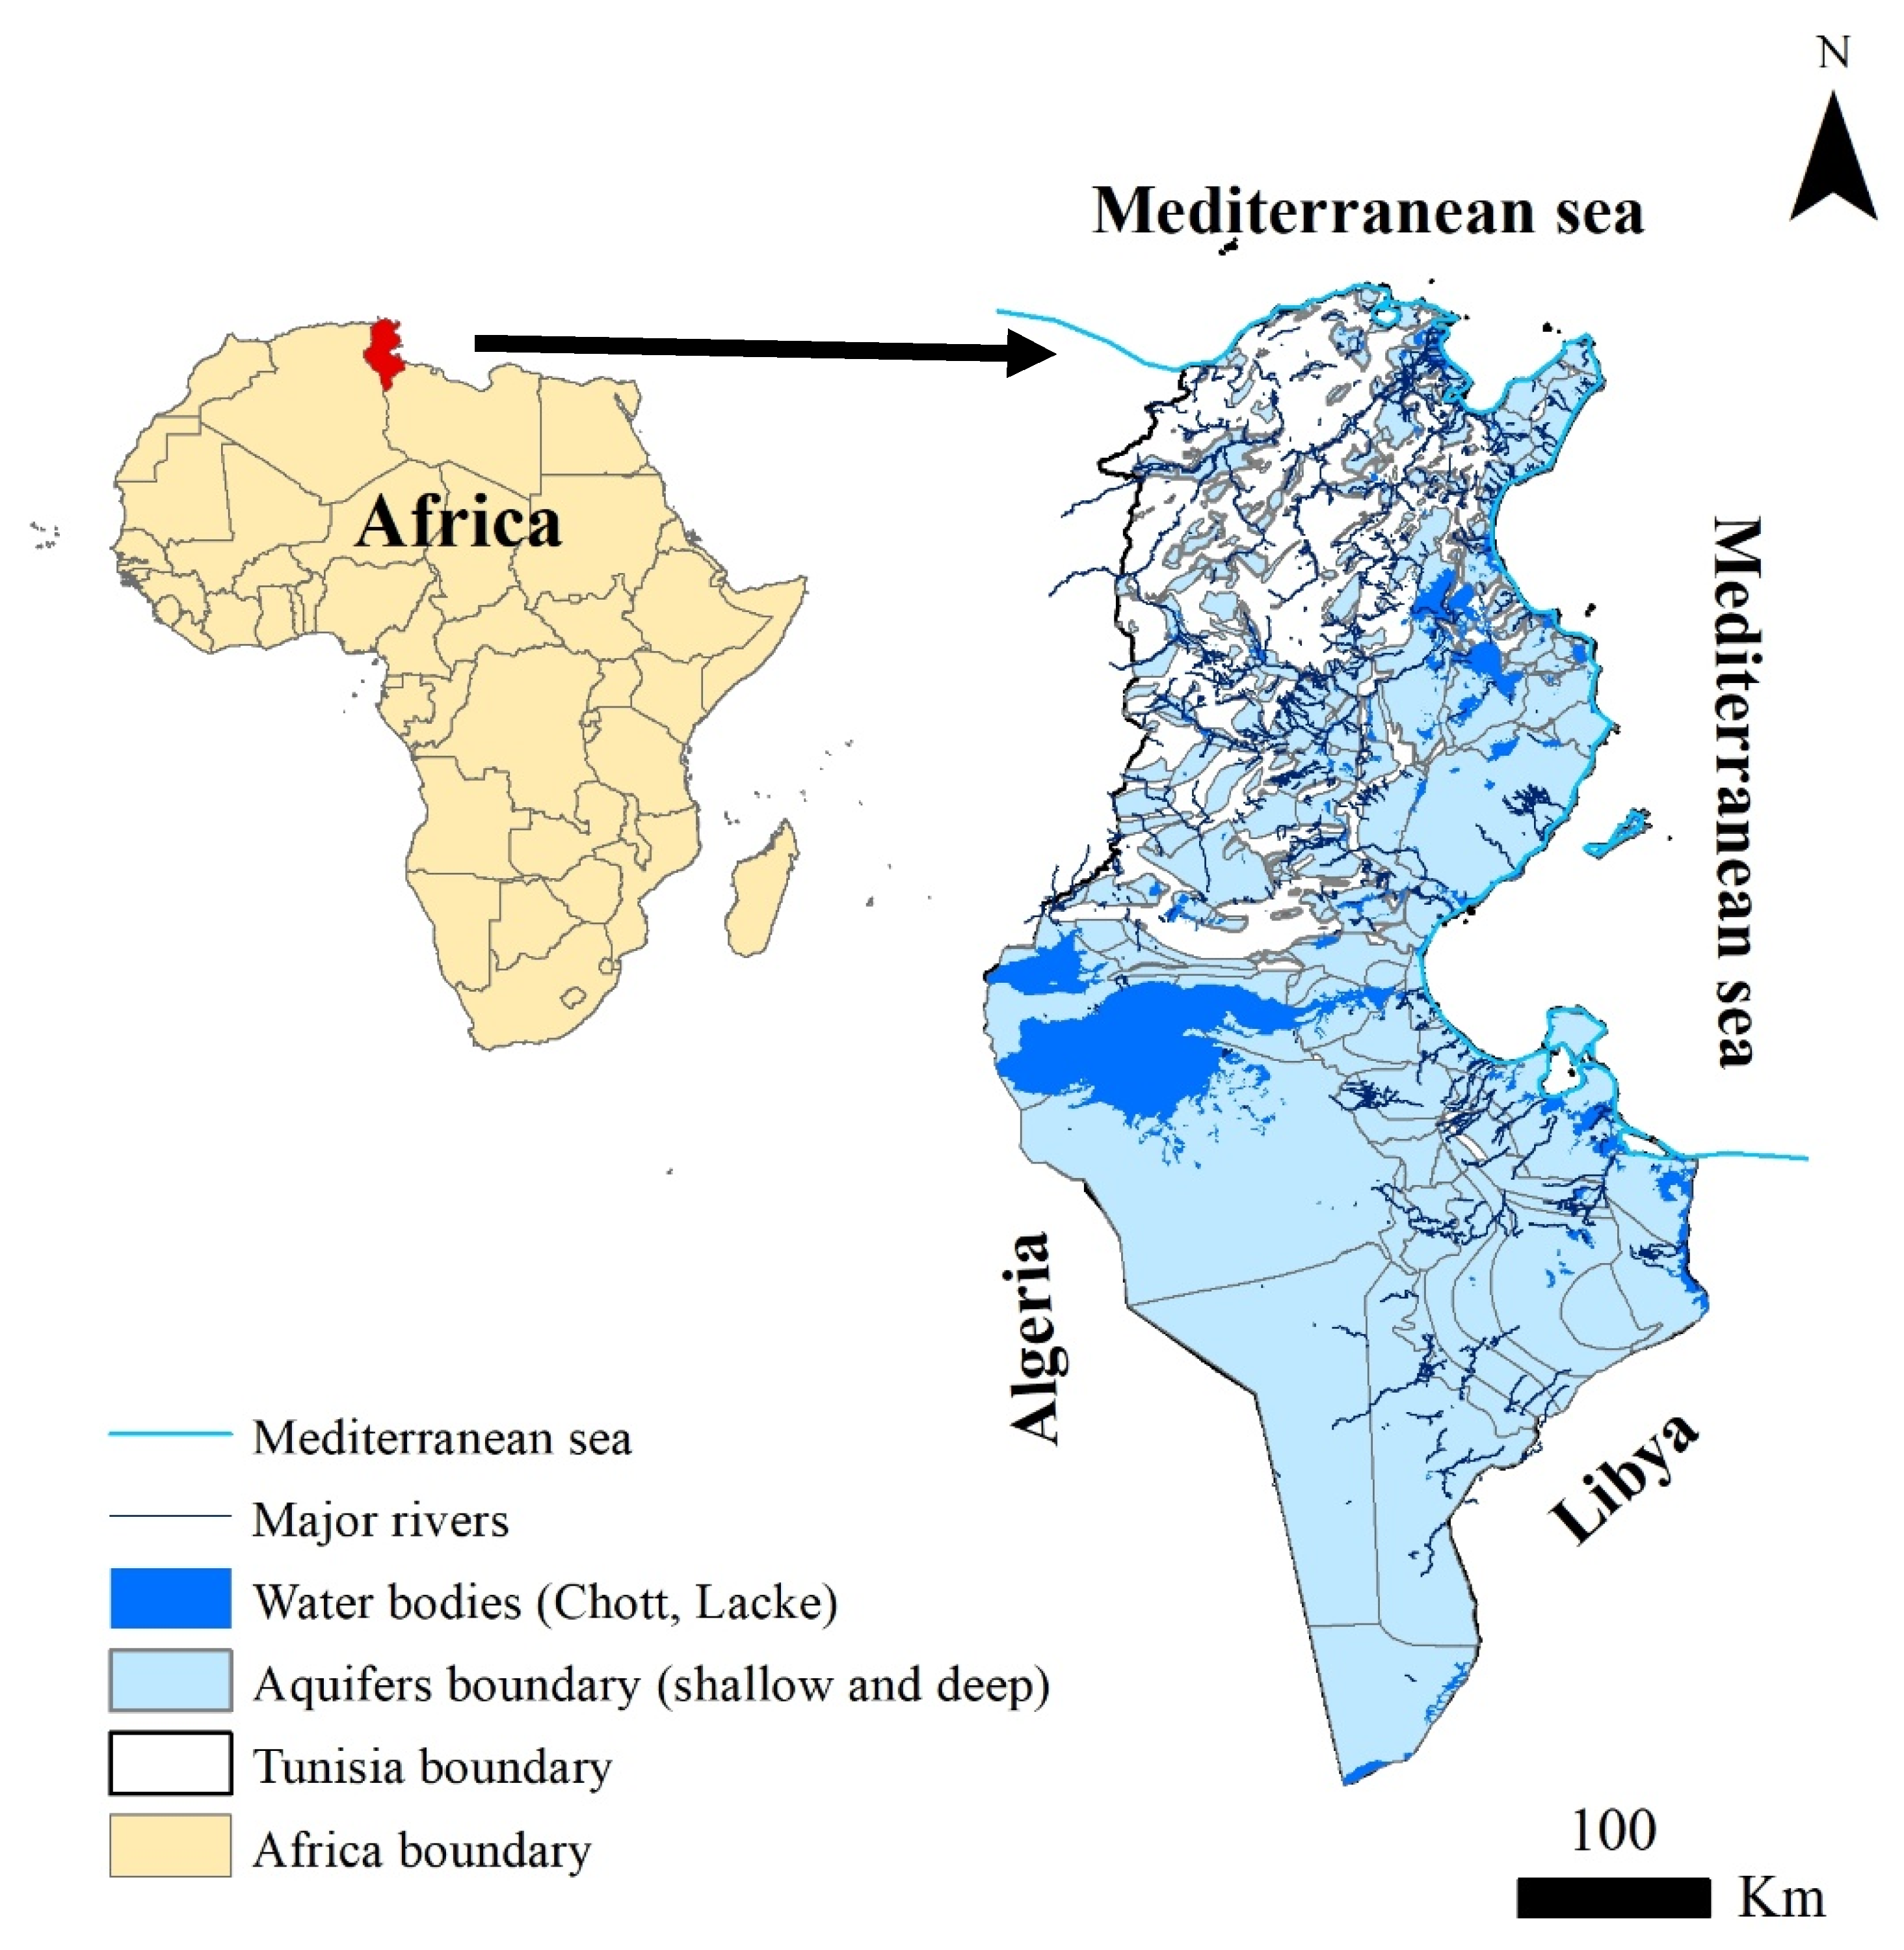
2.1. Study Area

Tunisia is a Maghreb country, located in North Africa between latitudes 30°00′–38°00′ N and longitudes 7°00′–12°00′ E. It is bordered by the Mediterranean Sea to the North and East, by Algeria to the West and by Libya to the South-East (Figure 1). It covers an area of approximately 16.36 Mha and had a population of 11.7 million in 2019, with a relative growth rate of 1.6% per year (INM, 2020). The study area is characterized by a climate that is sub-humid in the north, semi-arid in the center and arid in the south. The mean annual temperature for Tunisia is 20.4 °C, with average monthly temperatures ranging from a low of 10 °C in the winter months (December to February) to a high of 27 °C in the summer months (June to August) [23].
The mean annual rainfall is characterized by an uneven spatial distribution, ranging generally from less than 100 mm/year. in the south to more than 1200 mm/year. in the extreme north [24]. The rainy season is concentrated from September to April. The average annual evaporation rate varies from 1000 to 3000 mm/year. These climatic conditions favor the development of an agriculture sector, where around 20% of the area is arable land. The fertile plains of the north produce cereals (wheat and barley) and vegetables (tomatoes, peppers, onions, etc.); the Cap Bon peninsula specializes in oranges and vineyards; the central regions produce olives, while dates are mainly grown in the oases of the Sahara region. The naturally available water reserves in Tunisia represented approximately 4875 Mm3 in 2017. It has been estimated that around 44% of the country’s water resources come from groundwater [25]. They are distributed between 204 shallow aquifers (745 Mm3) and 340 deep aquifers (1429 Mm3) [26].

2.2. Multi-Criteria Decision Analysis (MCDA)

The overall methodology for ranking the suitable shallow aquifers for a small-scale solar-PV desalination system installation is summarized in two phases. The first focused on the conceptualization of the different steps of multi-criteria decision analysis (MCDA). It consisted of defining the problem and objectives; selecting the constraints, alternatives and criteria; assessing the priority weighting of the selected criteria by the Simple Multi Attribute Rating Technique method (SMART) and the aggregation of the criteria through the Weighted Sum Model (WSM). A sensitivity analysis was performed, based on One-At-Time method model. The second phase consisted of collecting and analyzing geospatial data through the application of a set of GIS operators, in order to produce a suitable shallow aquifers map for solar energy-based desalination for agricultural use.

2.2.1. Description of Problem

The low availability and the non-uniform spatio-temporal distribution of fresh water resources has pushed farmers to draw on low quality groundwater in order to fulfill the mounting agricultural water demand. This has short-term and long-term impacts on crop productivity, soil quality and the environment in general. This situation could worsen if appropriate measures are not adopted. One reliable and affordable solution is to implement on-farm groundwater desalination systems with low energy consumption and low negative environmental impact.
The research project SmaCuMed “Smart irrigation cube for sustainable agriculture in the Mediterranean region” [9] proposes an innovative sustainable solution, being an economically viable, socially acceptable, and environmentally friendly method of treating brackish groundwater for smart irrigation (Figure 2). The Smart Irrigation Cube “SmaIrriCube” is a modular system which utilizes solar power as a convenient renewable energy source to provide the energy requirements for pumping and treating saline water at low cost, while reducing the airborne emissions of pollutants from fossil fuel energy consumption. The desalinated groundwater is used for irrigation to sustain crop productivity. The desalination technology is based on membrane capacitive deionization (MCDI) and low-pressure reverse osmosis (LPRO). The MCDI technology is used mainly to desalinate water with a low salt content in a maximum range of 3–5 g/L. The LPRO technology is used to desalt low to high saline water between 3 and 10 g/L. The combination of both of the technologies could increase the efficiency of the desalination system. The system proposes evaporating the concentrated brine in evaporation ponds, avoiding the negative impact of brine discharge on the environment and groundwater. In addition, the salts can be harvested and marketed. Evaporation ponds are a cost-effective option appropriate for small scale desalination units in arid and semi-arid areas if land is available and where solar radiation is abundant.

2.2.2. Identification of Alternatives

The alternatives that are suitable for the installation of the SmaIrriCube system are all shallow or deep aquifers that are affected by salinization. For this study, only the shallow aquifers were taken into consideration, since aquifer depth is considered to be an economic factor. It is directly related to the unit cost of pumping. The suitable shallow aquifers were identified by determining several parameters considered as constraints. Based on previous studies and expert judgment [19,27,28,29,30,31,32], three main constraints were identified: water salinity; agricultural area; and evaporation rate.
The type of desalination technology used depends mainly on the quality of the feed water to be desalinated [33]. In our study, the LPRO and/or MCDI desalination technologies were used to desalinate brackish water with total dissolved solids (TDS) between 1 and 10 g/L. Thus, the shallow aquifers with TDS lower than 1 g/L and higher than 10 g/L were removed from the study. In addition, the SmaIrriCube system was to be installed for agricultural use. Therefore, the areas with no agricultural land (zero hectare) were excluded from the analysis. Furthermore, the brine disposal method was not applicable for regions with an annual evaporation rate lower than 1000 mm/year [34]. A shallow aquifer was considered suitable if it simultaneously met the feasibility conditions of all of these constraints.

2.2.3. Selection of Decision-Making Criteria

To select the suitable aquifers for the SmaCuMed system installation using MCDA techniques, it is crucial to choose the most determining criteria that will influence the decision problem under analysis. In the literature, a wide range of criteria were found which may have an important role on the modules of the SmaIrriCube system, including Global Horizontal Irradiation [12,28,30,35], number of sun hours/day [36], temperature [28,30,36,37], evaporation [38,39], rainfall [31,38,39], humidity [21,31,38,39], wind speed [36], water salinity [30], water quantity [40], groundwater level [30], well density [40], LULC [30,41], soil salinity [31], soil texture [31], elevation [31,37,41] and slope [30,31,40].
According to previous research, the consideration of six to eight criteria for a MCDA study is the most favorable option. In this research, eight main frequently used criteria were carefully selected, in line with the study objective, comprehensive literature review and expert knowledge. The eight selected criteria are provided in Table 1.

2.2.4. Determination of Criteria Weights

After establishing the set of criteria, the Simple Multi Attribute Rating Technique (SMART) weighting method was used to assign weights to each of the criterion and determine their relative importance in the final decision-making result [44,45]. The SMART weighting method is the simplest and the most widely used multi-criteria decision method. It consists of ranking the criteria in decreasing order of importance compared to the objective. The least important criterion is assigned an importance of 10. The next least important one is assigned a number higher than 10 reflecting the ratio of relative importance to the least criterion, and so on for the remaining criteria. In this study, the importance values (Ii) were attributed based on expert opinions. The importance of the values were then normalized (Wi) into weights summing to 1 by dividing the importance values of each criterion (Ii) with the total weight of all of the criteria (In) (Table 2).

2.2.5. Aggregation of Criteria

The criteria aggregation involved different steps. In the first step, the alternatives that were the suitable shallow aquifers and the eight criteria were expressed in matrix format as Equation (1), where A1, A2, …, Am are the feasible alternatives; C1, C2, …, C8 are the evaluation criteria and xij is the performance value of alternative Ai under criterion Cj:
C1 … Cj … C8
X = A 1 A i A m ( x 11 x i 1 x m 1     x 1 j x ij x mj     x 18 x i 8 x m 8 ) ;   i = 1 ,   ,   m ;   j = 1 ,   ,   n
In the second step, the decision matrix X was normalized, according to the linear max/min normalization Equation (2) for the profit criteria (i.e., C1, C3, C4, C6 and C7) and Equation (3) for cost criteria (i.e., C2, C5 and C8), in order to eliminate the impact of the criteria units on the rankings of alternatives and thus limit their values to between 0 and 1 [46]:
X j = x j     x j   min x j   max x j   min
or
X j =   1 x j     x j   min x j   max x j   min
where Xj is the normalized value of xj; xj is the value of criteria j; xj min is the smallest performance value of criteria j; and xj max is the largest performance value of criteria j. Thus, the normalized matrix XN of X is defined as follows:
X N = ( X 11 X i 1 X m 1     X 1 j X ij X mj     X 1 m X in X mn )
It should be noted that we considered two types of linear normalization for groundwater salinity (C5), depending on the aspect we focused on: the efficiency of the technology or acceptability to the farmer of the desalinated groundwater. In terms of technology efficiency, the lower the salinity, the more suitable the aquifer is for desalination. In this case the most suitable salinity is between 1 and 3 g/L. On the other side, farmers do not consider salinity between 1 and 3 g/L high enough to justify mobilizing funds. They are more likely to accept investment to desalinize groundwater when salinity is between 3 and 7 g/L, which is the most suitable interval of salinity in this case.
Finally, in the third step, the Weighted Sum Model (WSM) was employed as the aggregation technique for the current study. WSM is the simplest available method, applicable to single-dimensional problems. The assumption that governs this model is the additive utility assumption. That is, the overall value of each alternative is equivalent to the products’ total sum given by the following formula [47]:
S i = max   ij n X ij · W j ;   for   i = 1 ,   2 ,   3 ,   ,   m
where Si represents the overall suitability index of the ith alternative, ranging from 0 to 1; m is the number of alternatives, n is the number of decision criteria; Xij is the normalized score of the ith alternative with respect to the jth criterion; and wj is the normalized weight of the jth criterion.
In the maximization case, the alternatives with a higher suitability index value have a higher order in the ranking.

2.2.6. Sensitivity Analysis

The main criticism about employing the MCDA approach to solve a problem is the subjectivity that is associated with allocating weights to the criteria [48,49]. To overcome such a limitation, a sensitivity analysis was performed as a “final check” to investigate the changes in outcome with the weights. Several sensitivity analysis methods can be found in the literature [48,49]. In this study, the One-At-a-Time (OAT) approach was applied [49]. The OAT consists of investigating the stability of the evaluation by changing one criterion weight at a time and dividing its remaining weight between the other criteria by making it proportional to their original weights, then observing changes in the rankings of criteria; then, identifying the most sensitive criteria to weight changes; finally, visualizing the changes in the overall alternatives ranking. For this purpose, we analyzed the impact of increasing/decreasing each main criterion weight (water salinity, water quantity, global horizontal irradiation and agricultural area) by 10 and 20%, one at a time. The Tables illustrating the sensitivity analysis results are provided in Appendix A.
To assess the sensitivity analysis results, the Spearman’s rank correlation coefficient (rs) was employed [50] as one of the most usable and important coefficients for determining the correlation between the results obtained by the various approaches. This coefficient measures the similarity between two sets of rankings, i.e., between the rankings obtained with the original models and the rankings obtained with the sensitivity analysis results. It is calculated by using the following equation:
r s = 1 [ 6 i = 1 N d i 2 N ( N 2 1 ) ]
where N denotes the number of alternatives and di is the difference between the alternatives’ ranks in the MCDA models and the sensitivity analysis scenario. A rs value greater than 0.8 indicates a high level of agreement between two rank orderings. If rs is close to 0, then there is no agreement between the rankings. Finally, if rs is close to −1, the rankings are almost reversed.

2.2.7. Evaluating the Removal Influence of Evaporation and Photovoltaic Modules from SmaIrriCube Systems on Shallow Aquifers Ranking

In order to study the efficiency of the evaporation ponds and the photovoltaic modules of the SmaIrriCube systems on the overall shallow aquifers ranking, three criteria weight scenarios were computed separately. For the first scenario, the evaporation pond was neglected from the study (E0); since the proposed small-scale MCDI/LPRO desalination units in this research have a low concentration of salt discharge, the evaporation pond can be replaced by a deep well injection. Therefore, a weight of zero was assigned to the evaporation criterion (WE = 0). For the second scenario, the solar photovoltaic module was omitted (PV0), as the initial costs of the materials, installation and maintenance of the PV module are high. Thus, this is the biggest downside of the PV system and the major problem for the low-income farmers. Here, it is assumed that the electricity grid is abundant throughout the study area. Thus, the stakeholder can use electric energy instead of the photovoltaic energy. In this case, a weight of zero was assigned to the GHI and Temperature criteria (WGHI = 0 and WT = 0). For the last scenario, both the evaporation ponds and the photovoltaic modules were removed from the study (E0-PV0). In this scenario, a weight equal to zero is assigned to the evaporation, GHI and temperature criteria (WE = 0; WGHI = 0 and WT = 0).
The SMART weighting method was then re-applied to determine the new criteria weighting. Table 3 shows the weights’ criteria distribution for the three generated scenarios, where the priority order of criteria according to the SMART method was retained.

2.3. Geospatial Analysis

2.3.1. Thematic Spatial Layers and Model Setup

In order to fulfill the requirements of this study, various datasets were gathered, processed, analyzed and integrated into a GIS database, including SRTM, satellite data, agricultural map and statistical data. Table 4 summarizes the datasets used in this study and their sources.
The Shuttle Radar Topographic Mission (SRTM) Digital Elevation Model (DEM) with 30 m spatial resolution was downloaded from USGS website [51] and used to derive the slopes (%) map. The Global Horizontal Irradiation (kWh/m2/year) and Temperature (°C) maps were downloaded freely from the Global Solar Atlas website with a spatial resolution of 1 km and a long-term coverage of 24 years from 1994 to 2018 [52]. The evaporation data were provided by the National Meteorological Institute (INM) of Tunisia from the year 2010 to 2020. The agricultural areas (ha) were extracted and calculated from the Land Use/Land Cover (LULC) map of the year 2019, derived from the FAO Water Productivity Open-access portal (WaPOR) with 100 m spatial resolution [24]. The well density was calculated using the well number per aquifer obtained directly from the “Agricultural map”, the official spatial database owned by the Tunisian Ministry of Agriculture (Ministry of Agriculture, 2015). The groundwater quantity was obtained from the statistical report of the General Directorate of Water Resources (DGRE) in 2015 [53]. The salinity of shallow aquifers was determined based on the minimum and the maximum Total Dissolved Solids (TDS) statistical data published in the same DGRE report of 2015 [53]. The criteria data were generated and geospatialized.

2.3.2. Mapping Shallow Aquifers Suitability for SmaIrriCube System Installation

Two separate robust maps of shallow aquifer suitability for SmaIrriCube system were produced after summing the weighted normalized criteria spatial datasets; the first map integrates the normalized map of salinity according to the technology efficiency (SmaIrriCubeEff). The second map integrates the normalized salinity map of farmer acceptability (SmaIrriCubeAcc).

3. Results

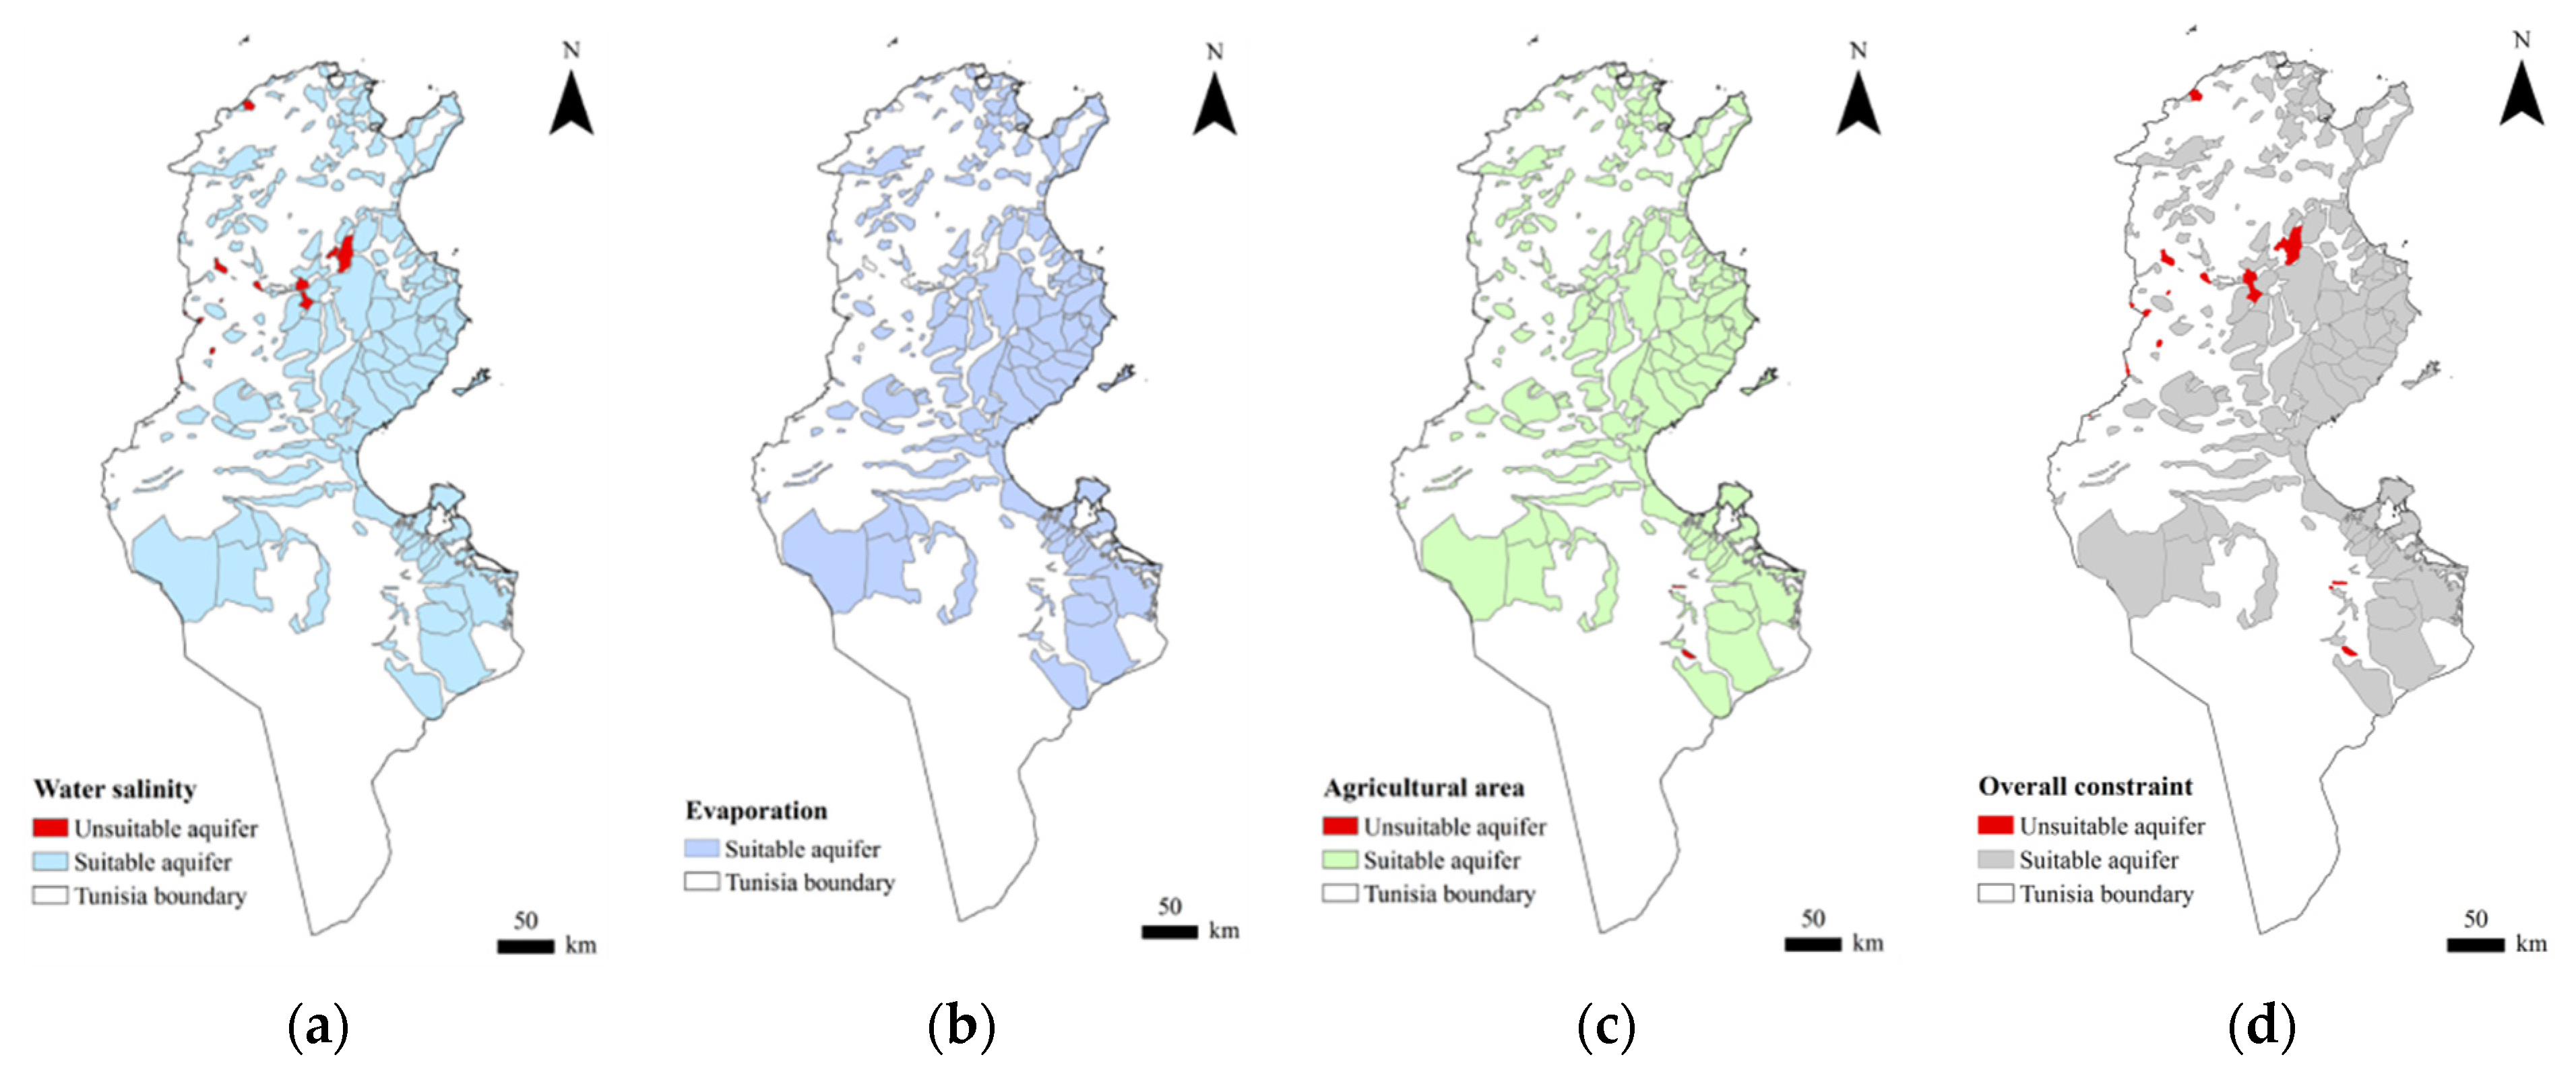
3.1. Evaluation of Constraints

The constraint map of salinity (Figure 3a) shows that twelve aquifers have TDS lower than 1 g/L, mainly located in the North-West and Center-West. These aquifers do not require any treatment and are thus unsuitable for the SmaIrriCube system. For the evaporation constraint, all of the areas have an evaporation rate greater than 1000 mm/year, which is suitable for this research (Figure 3b). In terms of the agricultural area constraint, four areas mainly located in the South-East are unsuitable as they are not agricultural land (Figure 3c). The overall constraint map (Figure 3d), obtained by the intersection of the three constraint layers, shows that a total of 188 shallow aquifers from the 204 analyzed were found to be potentially suitable for installing the SmaIrriCube system and, thus, were analyzed for suitability mapping.

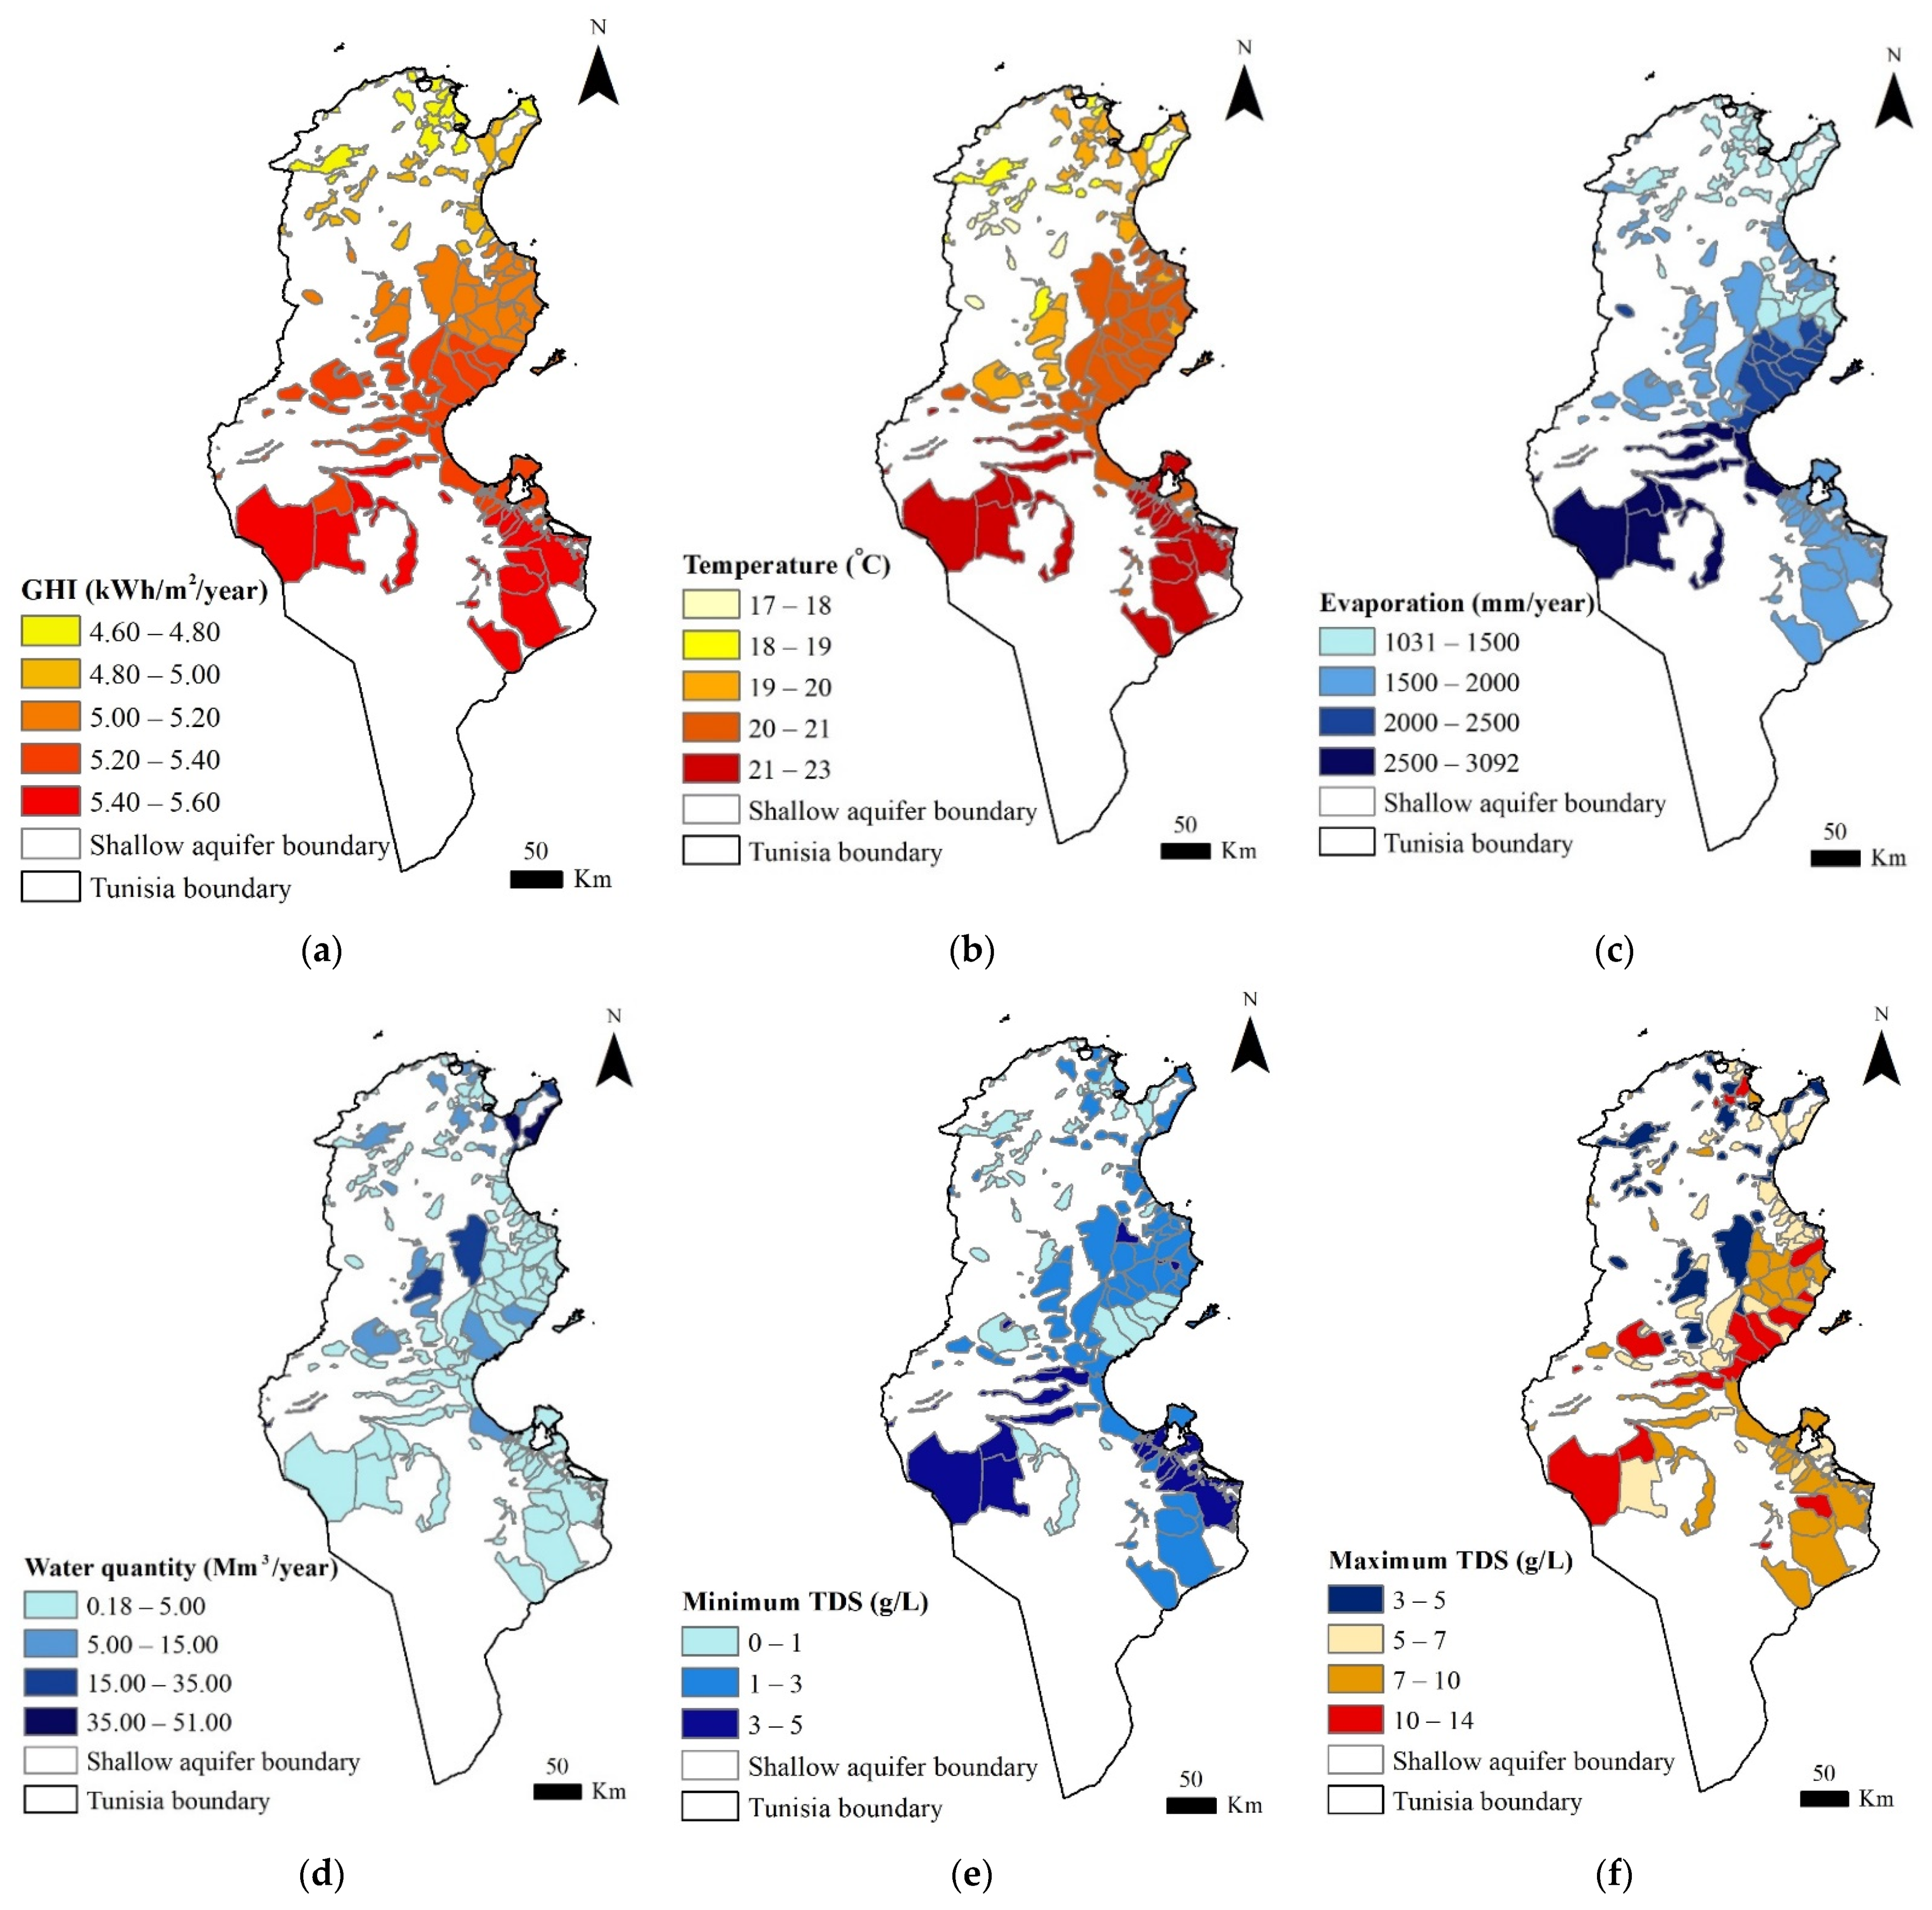
3.2. Evaluation of Main Criteria

Figure 4a–i present the spatial distribution of the criteria used to rank the suitable shallow aquifers for the SmaIrriCube system implementation, including global horizontal irradiation, temperature, evaporation, water quantity, maximum and minimum TDS, well density, agricultural area and land slope. Figure 4a reveals that the average annual GHI ranges from 4.60 kWh/m2/year. in the extreme north to more than 5 kWh/m2/year. in the south. The average annual temperature varies between 16 and 23 °C. It increases gradually from north to south (Figure 4b). The average annual evaporation ranges from 1031.30 to 3092.30 mm/year. The lowest evaporation occurs mainly in the north and increases gradually to the south, where the solar irradiation is important (Figure 4c). The shallow aquifer resources are characterized by unequal allocation and variable quality in terms of salinity. The shallow water resources vary between 0.18 and 51 Mm3/year. They are more available in the northern and central aquifers than in the southern aquifers (Figure 4d). The shallow aquifer salinity is fairly high in the south, moderate in the center and low in the north (Figure 4e,f). The well density per aquifer ranges from less than 0.05 to 0.73. It is higher mainly in the north-east (Figure 4g). The agricultural areas vary from 4 to 112,659 ha. The areas are abundant in the center, moderately present in the north and weak in the south (Figure 4h). The land slope varies between 2.35 and 33.60%. The land area is almost flat; more than 80% has an average slope lower than 5% (Figure 4i).

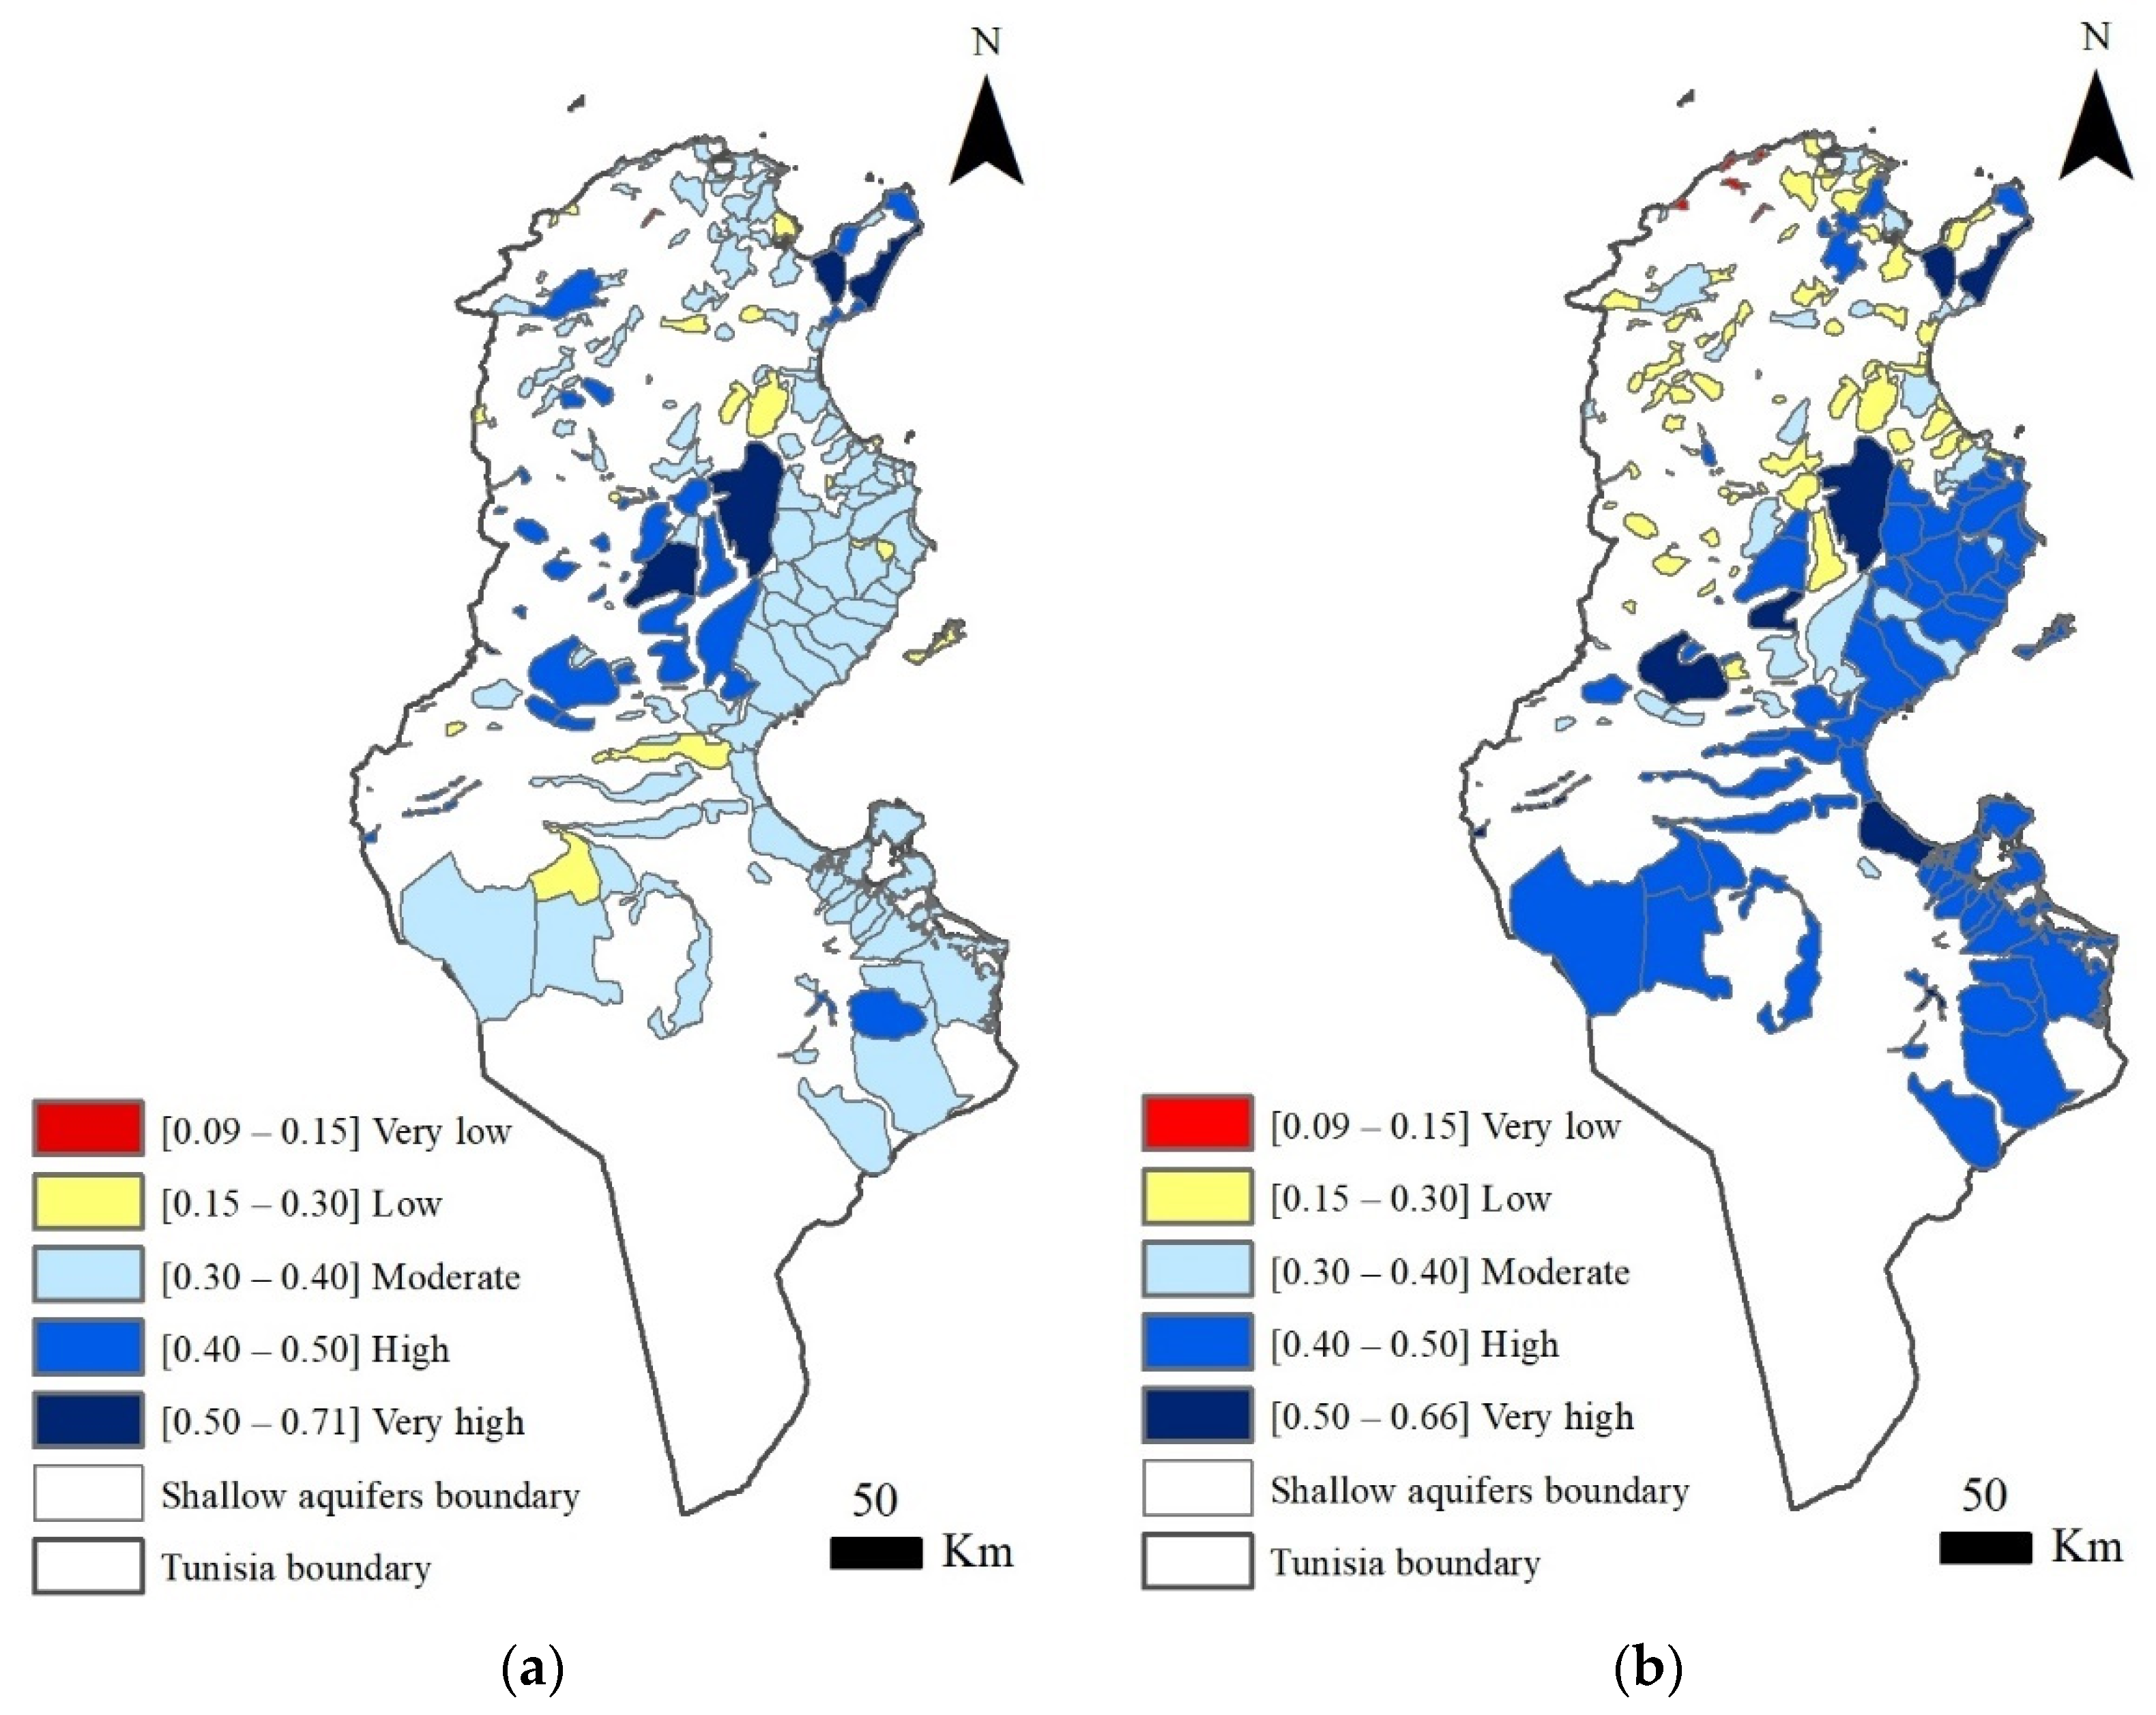
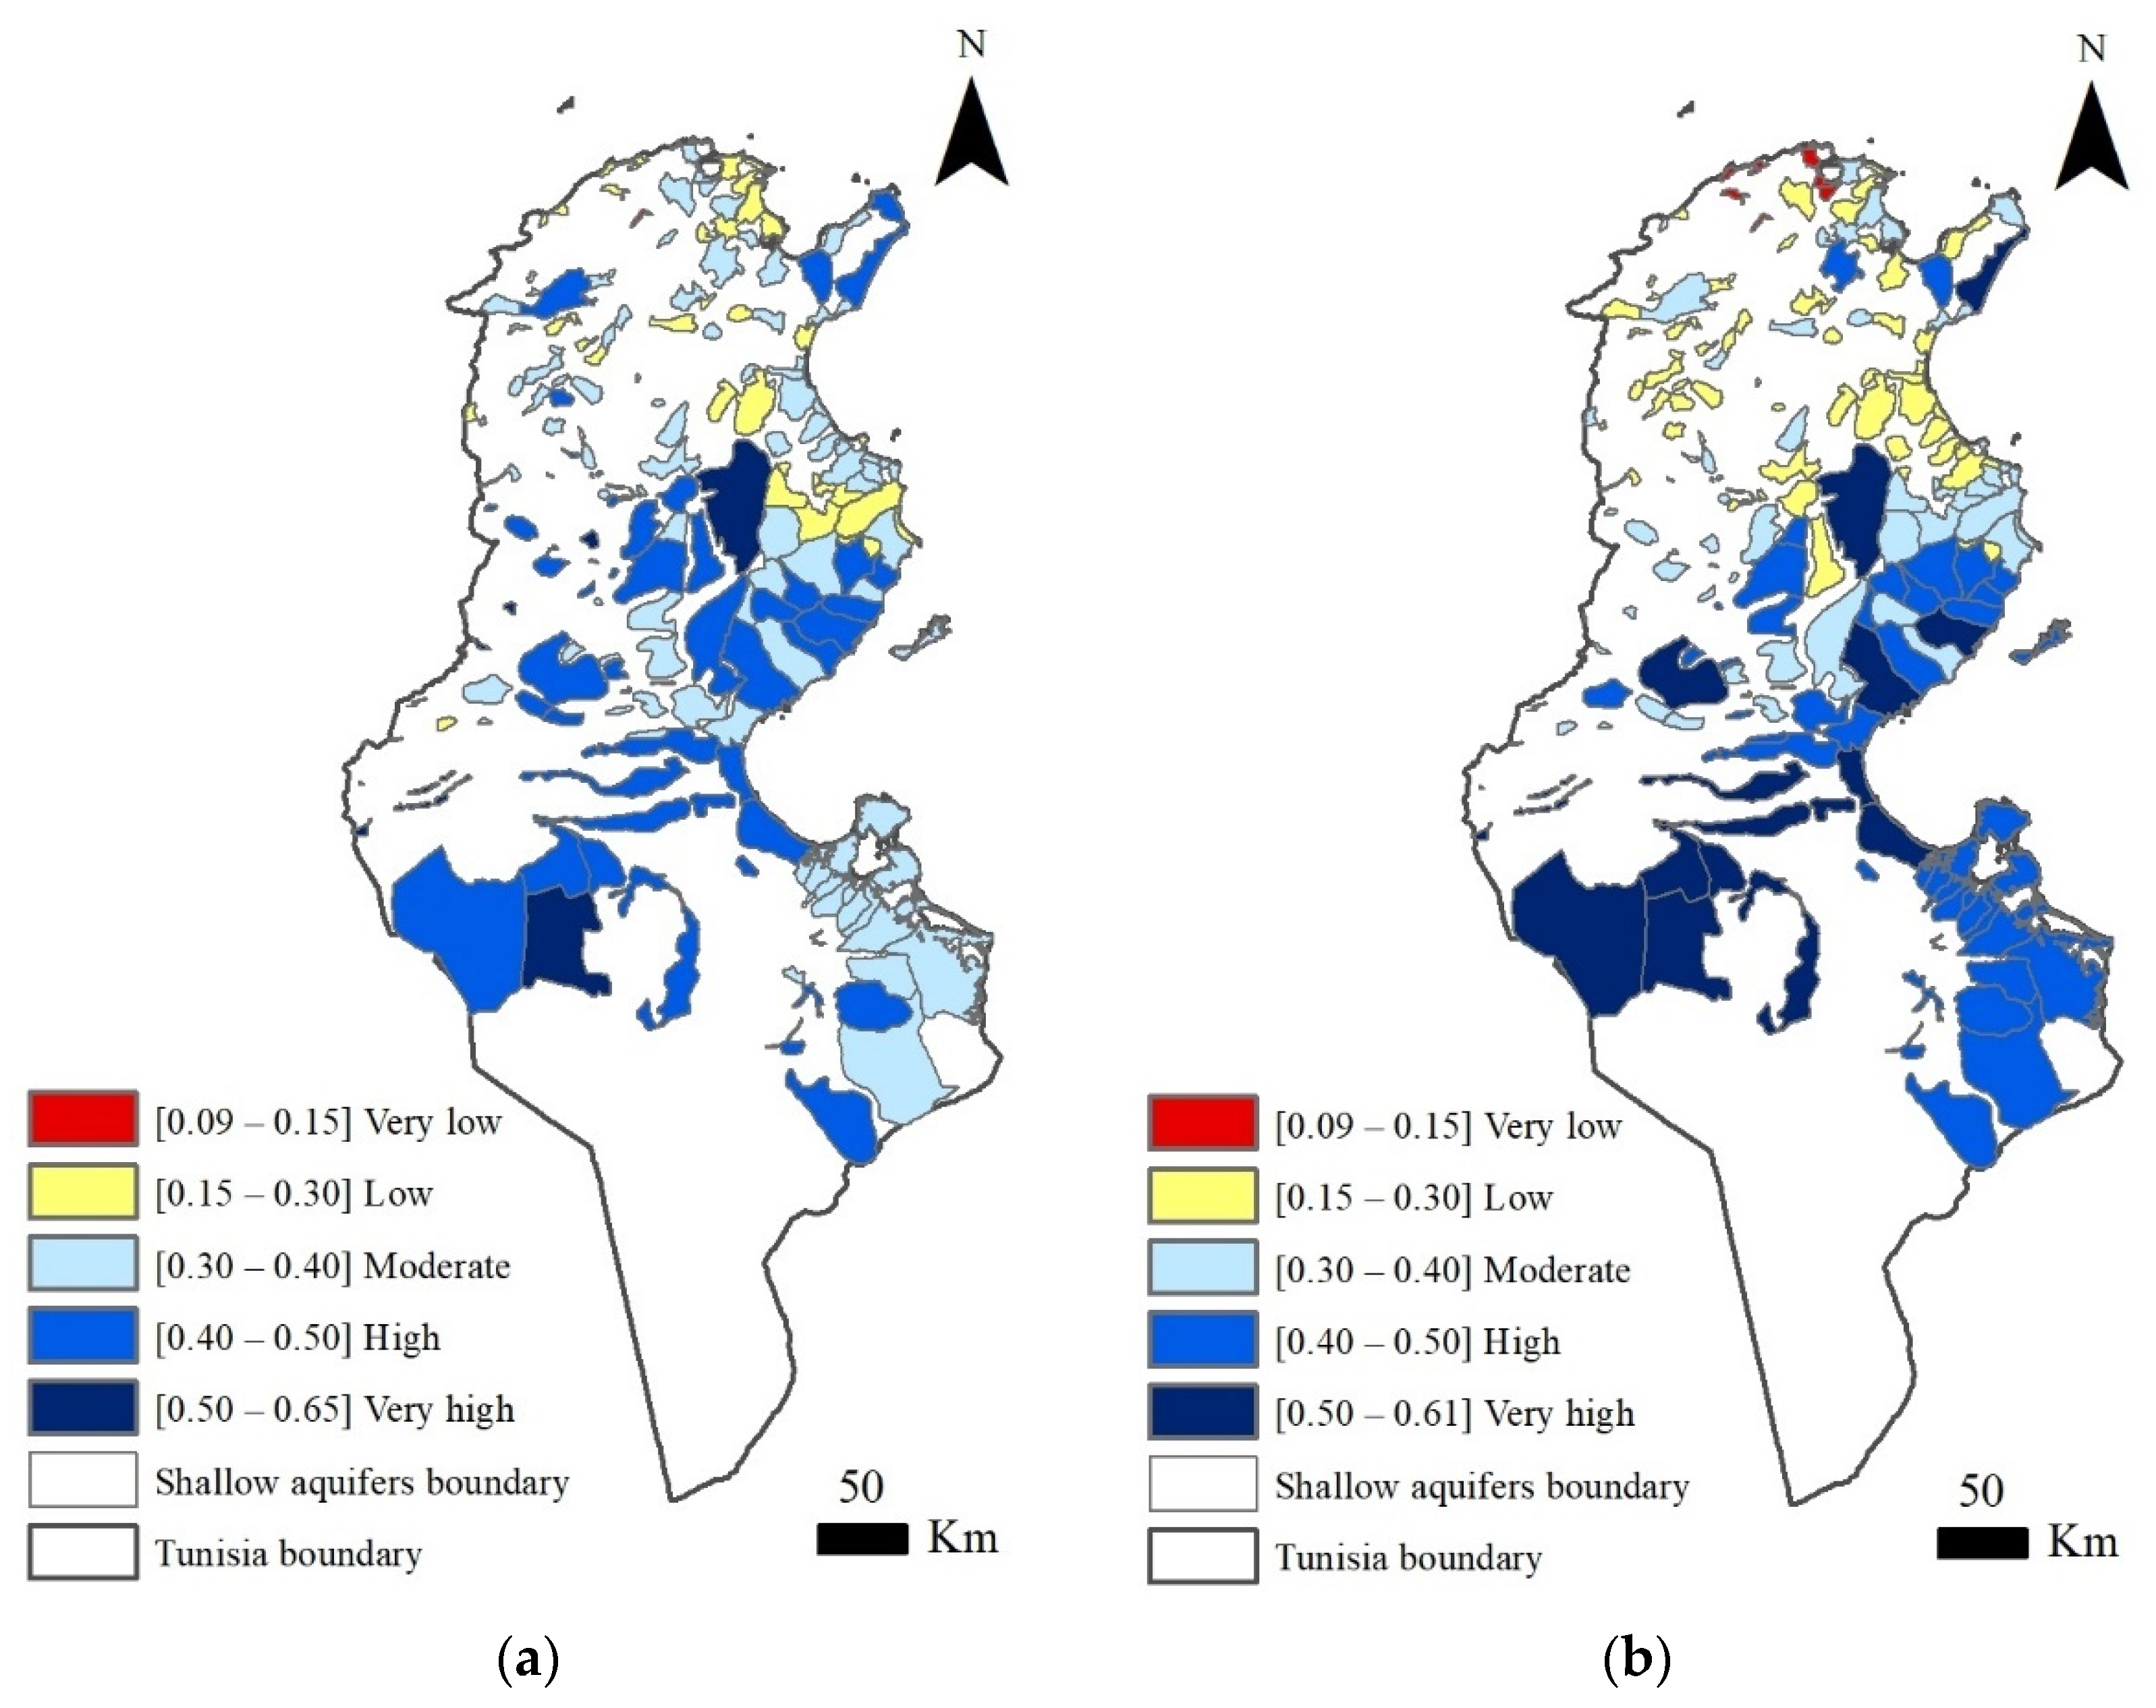
3.3. Suitable Shallow Aquifers Ranking for SmaIrriCube Systems Implementation

Applying the GIS-based MCDA approach allowed the evaluation of shallow aquifers’ suitability for the SmaIrriCube system implementation in Tunisia, based on eight selected criteria including global horizontal irradiation, temperature, evaporation, water quantity, water salinity, well density, agricultural area and land slope. Figure 5a,b present the spatial distribution of the suitability index variation to rank the suitable shallow aquifers for the implementation of the SmaIrriCubeEff and SmaIrriCubeAcc systems. The suitability maps are reduced to five scales of suitability levels: very low (Si between 0.09 and 0.15); low (0.15–0.30); moderate (0.30–0.40); high (0.40–0.50) and very high (0.50–0.65).
Due to the high number of alternatives ranked (188), it is not possible to display the whole ranking in a table. Thus, Table 5 only provides the detailed information of eight chosen alternatives, from the best ranked to the worst shallow aquifer for the installation of SmaIrriCubeEff and SmaIrriCubeAcc systems.
The results reveal that the suitability index (Si) varies from 0.09 to 0.65 for SmaIrriCubeEff and from 0.09 to 0.61 for SmaIrriCubeAcc (Figure 5a,b). In general, the suitability maps illustrate that the most preferable aquifers are mainly located in the southern and central areas, while the least suitable are found in the north.
The results provided in Table 5 indicate that the Kairouan Plain is the most suitable shallow aquifer for installing the SmaIrriCubeEff system in terms of the index rankings with an Si of 0.65. Here, the lower salinity (1–3 g/L), the higher agricultural area (112,659 ha) and the water availability (26 Mm3/year) are the major indicators of the highest suitability for this aquifer. The Djerid Oasis is the second-ranking suitable aquifer with an Si of 0.53 due to high water availability (36 Mm3/year), abundant solar irradiation (5.36 kWh/m2/year) and high evaporation rate (2526 mm/year). The aquifer of Oum Laksab follows in third place with an Si of 0.52. Here, the lower salinity (1–3 g/L) and the higher evaporation rate (21,423 mm/year) contribute to the overall suitability. Therefore, these top three shallow aquifers are strongly recommended for the installation of the SmaIrriCubeEff system. Meanwhile, Hencha, Ain Bou Mourra and Haut-Joumine are ranked as the least preferable aquifers, respectively, with an Si decreasing to 0.09. This can be explained by the low availability of groundwater resources (less than 2 Mm3/year) and the low rate of evaporation (less than 1819 mm/year).
Figure 5b and Table 5 illustrate that the SmaIrriCubeAcc results present a wide range of variations in the aquifer ranking compared to SmaIrriCubeEff. The Djerid Oasis aquifer becomes the highest ranked alternative with a slight increase in Si equal to 0.62. This aquifer is mainly characterized by moderate water salinity (3–7 g/L), a high amount of water resources (36 Mm3/year), high level of global solar irradiation, (5.36 kWh/m2/year) and evaporation rate (2526 mm/year). Nefzaoua Southern is ranked as the second most preferable aquifer, with an Si of 0.57. The third ranking aquifer is Gabes South with an Si value around 0.56. These last two aquifers are characterized by moderate water salinity (3–7 g/L) and a high evaporation rate exceeding 2757 mm/year. Therefore, the shallow aquifers of Djerid Oasis, Nefzaoua Southern and Gabes South are strongly recommended for installing the SmaIrriCubeAcc system. In contrast, the aquifers of Oeud Sejnane, Kef Abed and Haute-Joumine have poor suitability for SmaIrriCubeAcc implementation, as they have the lowest Si value of less than 0.13. This is mainly caused by the low amount of groundwater (less than 3 Mm3/year) and the low rate of salinity (1–3 g/L).
Since the criterion of water salinity has the highest weighting among the other criteria, it has a significant impact on the final results. The shallow water resources, solar irradiation, agriculture area and evaporation have an equally important influence in the decision analysis process as they have the same weight (Table 2). Thus, it should be noted that it is necessary to carefully select weight values, because ranking results are strongly determined by a weighted combination of selected criteria, formulated into indicator weight.

3.4. Sensitivity Analysis

Spearman’s correlation coefficients results obtained by comparing the initial alternatives rankings of the SmaIrriCubeEff model and the SmaIrriCubeAcc model with the rankings obtained through the OAT sensitivity analysis scenarios applied to groundwater salinity, groundwater quantity, global horizontal irradiation, agricultural area and evaporation criteria weights are summarized in Appendix B. The results of increasing and decreasing the weights of the five main criteria, one-at-a-time between −20 and +20%, show that there is a strong correlation in the rankings between the considered scenarios, since all of Spearman’s correlation coefficients values are higher than 0.86. In addition, for the SmaIrriCubeEff system implementation, the Kairouan plain, Djerid Oasis and Ain el Kerma aquifers, which initially had high ratings, remain at the top of the ranking under all of the scenarios and the ranking of the last three shallow aquifers, namely the Hencha, Ain Bou Mourra and Haute-Joumine aquifers, remain almost the same.
For the SmaIrriCubeAcc, the sensitivity analysis scenarios also give the same results in terms of the ranking order of the alternatives, where the Djerid Oasis, Nefzaoua Southern and Gabes South aquifers maintain the top three rankings and the Oeud Sejnane, Kef Abed and Haut-Joumine aquifers remain the lower ranked alternatives.
It may be inferred that the selected SMART approach is quite robust and the decision-making process was not found to be highly influenced by slight variations in the weights of groundwater salinity, groundwater quantity, global horizontal irradiation and agricultural criteria, one at time. This can prove the validity and credibility of the ranking results and point towards successful use of the method in the future.

3.5. Evaluating the Removal Influence of Evaporation and Photovoltaic Modules from SmaIrriCube System on Shallow Aquifers Ranking

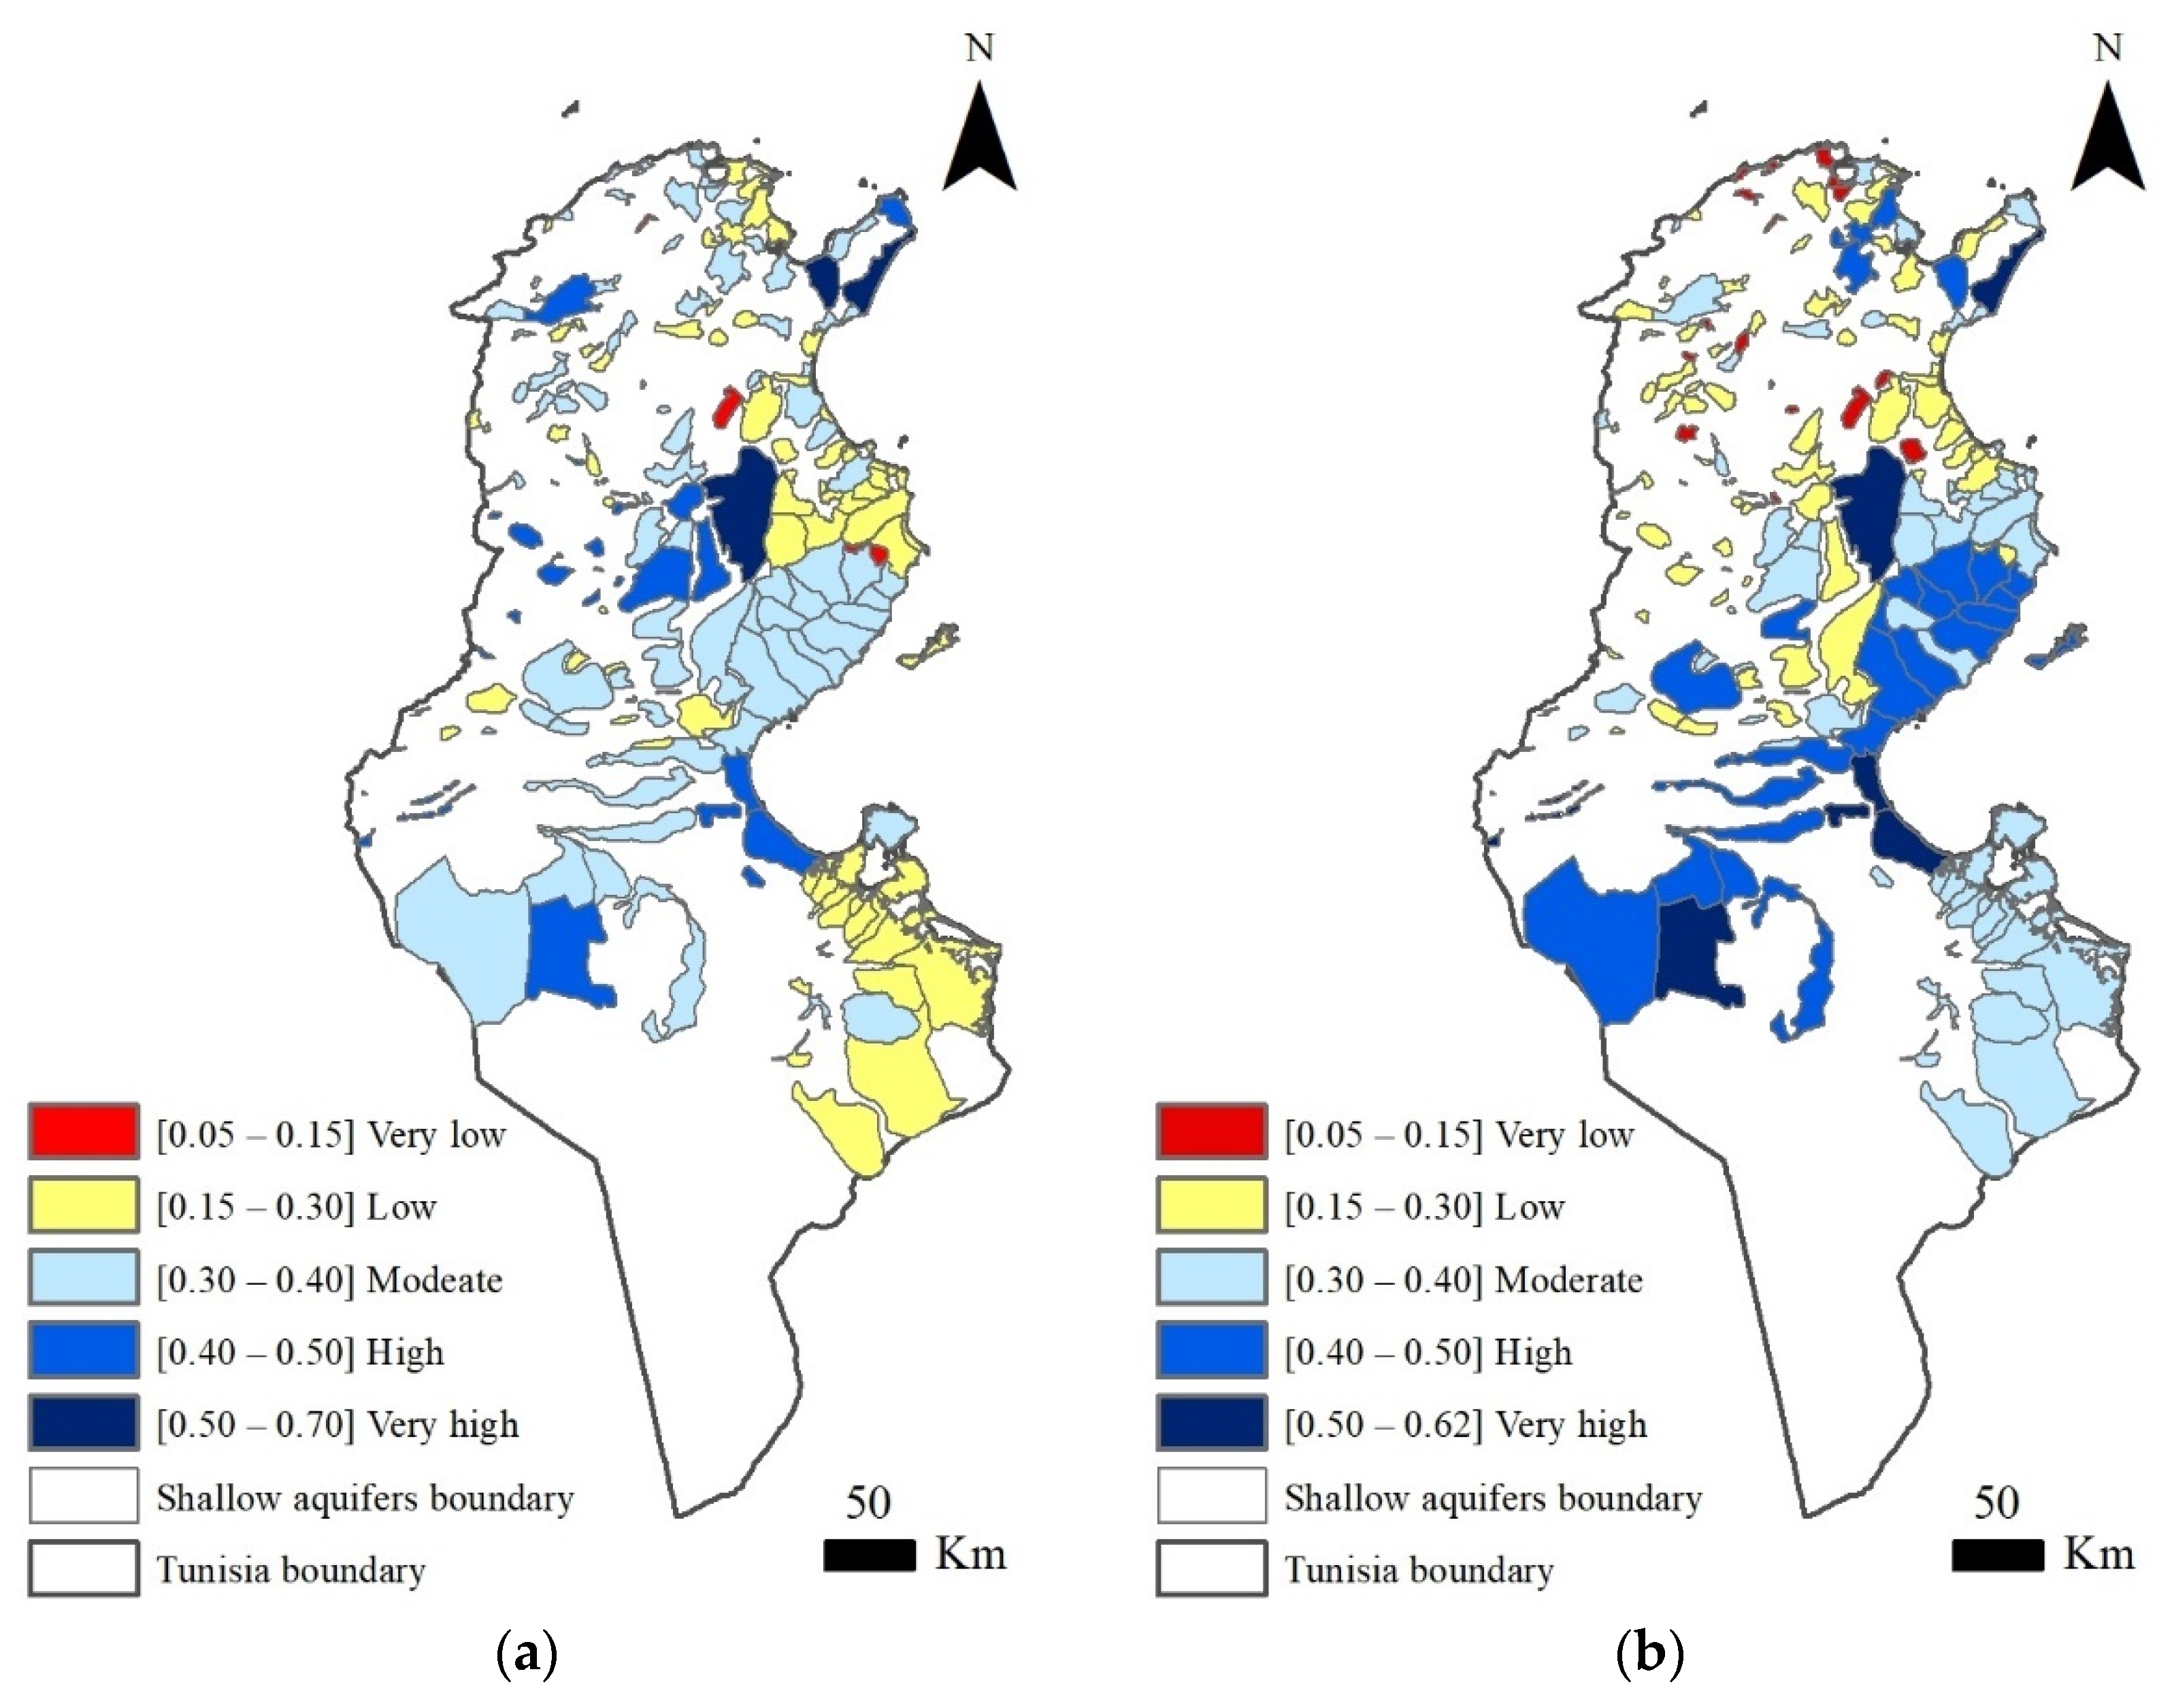
3.5.1. Suitable Shallow Aquifers Ranking for Scenarios SmaIrriCubeEff-E0 and SmaIrriCubeAcc-E0 Systems Implementation

Figure 6a,b present the spatial distribution of the suitability index after excluding the evaporation module from the SmaIrriCubeEff and SmaIrriCubeAcc systems, respectively.
The SmaIrriCubeEff-E0 suitability map shows that the most suitable shallow aquifers are located in the central-west and the Cap Bon peninsula, while the least suitable are found mainly in the northern part of the country. The aquifers in the south and central-east of the country are characterized by a moderate suitability (Figure 6a). The SmaIrriCubeAcc-E0 suitability map illustrates that the south, central-east and Cap Bon peninsula aquifers are categorized from high to very high suitability. The aquifers in the central-west and the northern area have the lowest suitability (Figure 6b).
Compared with the results of Section 3.3, the Si ranges increased slightly to 0.09–0.71 for the SmaIrriCubeEff-E0 scenario, and to 0.09–0.66 for SmaIrriCubeAcc-E0. Figure 5 and Figure 6 show that disregarding the “Evaporation” criterion noticeably changes the ranking alternatives. The south and central aquifers are more affected by this criterion than the northern aquifers, as the evaporation rate in these areas is important, exceeding 2000 mm/year. (Figure 4c).
For the SmaIrriCubeEff-E0 scenario, the results in Table 6 indicate that the Kairouan Plain aquifer maintains the top ranking, with an Si of 0.71. The second and the third position in the ranking are occupied by the aquifers of Grombalia with an Si of 0.58, and Eastern Coast with an Si of 0.57, respectively. Here, the removal of the “Evaporation” criterion from the analysis significantly improves the ranking of the “Grombalia” and “Eastern Coast” alternatives from 11th to 2nd and from 14th to 3rd position, respectively. The Hencha, Ain Bou Mourra and Haut-Joumine aquifers are still ranked among the least preferable aquifers, with only a slight change in the suitability index values. In addition, Table 6 indicates that the aquifers of the Eastern Coast, Djerid Oasis and Kairouan plain become the top three most suitable shallow aquifers for the SmaIrriCubeAcc-E0 system installation, with Si values of 0.66, 0.59 and 0.56, respectively. Here, disregarding the Evaporation criterion changes the suitability order of the Eastern Coast and Kairouan plain aquifers, respectively from 5th to 1st and 10th to 3rd position, and downgrades the priority order of Djerid Oasis aquifer from first to second. The lower ranked alternatives are the aquifers of Meknas-Barkoukech, Kef Abed and Haut Joumine.

3.5.2. Suitable Shallow Aquifer Ranking for Scenarios SmaIrriCubeEff-PV0 and SmaIrriCubeAcc-PV0 Systems Implementation

The spatial distribution of the suitability index values after excluding the solar photovoltaic module from SmaIrriCubeEff and SmaIrriCubeAcc are presented in Figure 7a,b, respectively.
The suitability maps of SmaIrriCubeEff-PV0 and SmaIrriCubeEff-PV0 show a slight variation in the Si ranges and a significant change in the suitable aquifers order compared to the original SmaIrriCubeEff and SmaIrriCubeAcc scenarios (Section 3.3). In fact, the Si varies from 0.05 to 0.70 for the SmaIrriCubeEff-PV0 scenario and from 0.05 to 0.62 for the SmaIrriCubeAcc-PV0 scenario. The visual analysis of Figure 7a,b show that the aquifers located in the south and center are the most sensitive to the removal of the energy photovoltaic module, i.e., the elimination of the criteria “Global Horizontal Irradiation” and “Temperature”, as these areas are characterized by a high solar irradiation exceeding 5.20 kWh/m2/year, and a high temperature above 20 °C (Figure 4a,b).
As illustrated in Table 7 for the SmaIrriCubeEff-PV0 scenario, a considerable change in the ranking of aquifers is noted, except for the Kairouan Plain aquifer, which maintains the highest position with an Si of 0.70, followed by the Grombalia aquifer (from 11th to 2nd position) with an Si of 0.53 and the Eastern Coast aquifer (from 14th to 3rd position) with an Si of 0.50. The least preferable aquifers remain the Hencha, Ain Bou Mourra and Haute Joumine with slight changes in their suitability index values.
For the SmaIrriCubeAcc-PV0 scenario, the top three ranking alternatives become the aquifers of Eastern Coast (from fifth to first position), the Oasis of Djerid (from first to second position) and Kairouan Plain (from 10th to 3rd position) with an Si of 0.62, 0.61 and 0.54, respectively. The aquifers of Oeud B. Hassine, Kef Abed and Haute Joumine are the bottom ranking alternatives, with an Si lower than 0.11.

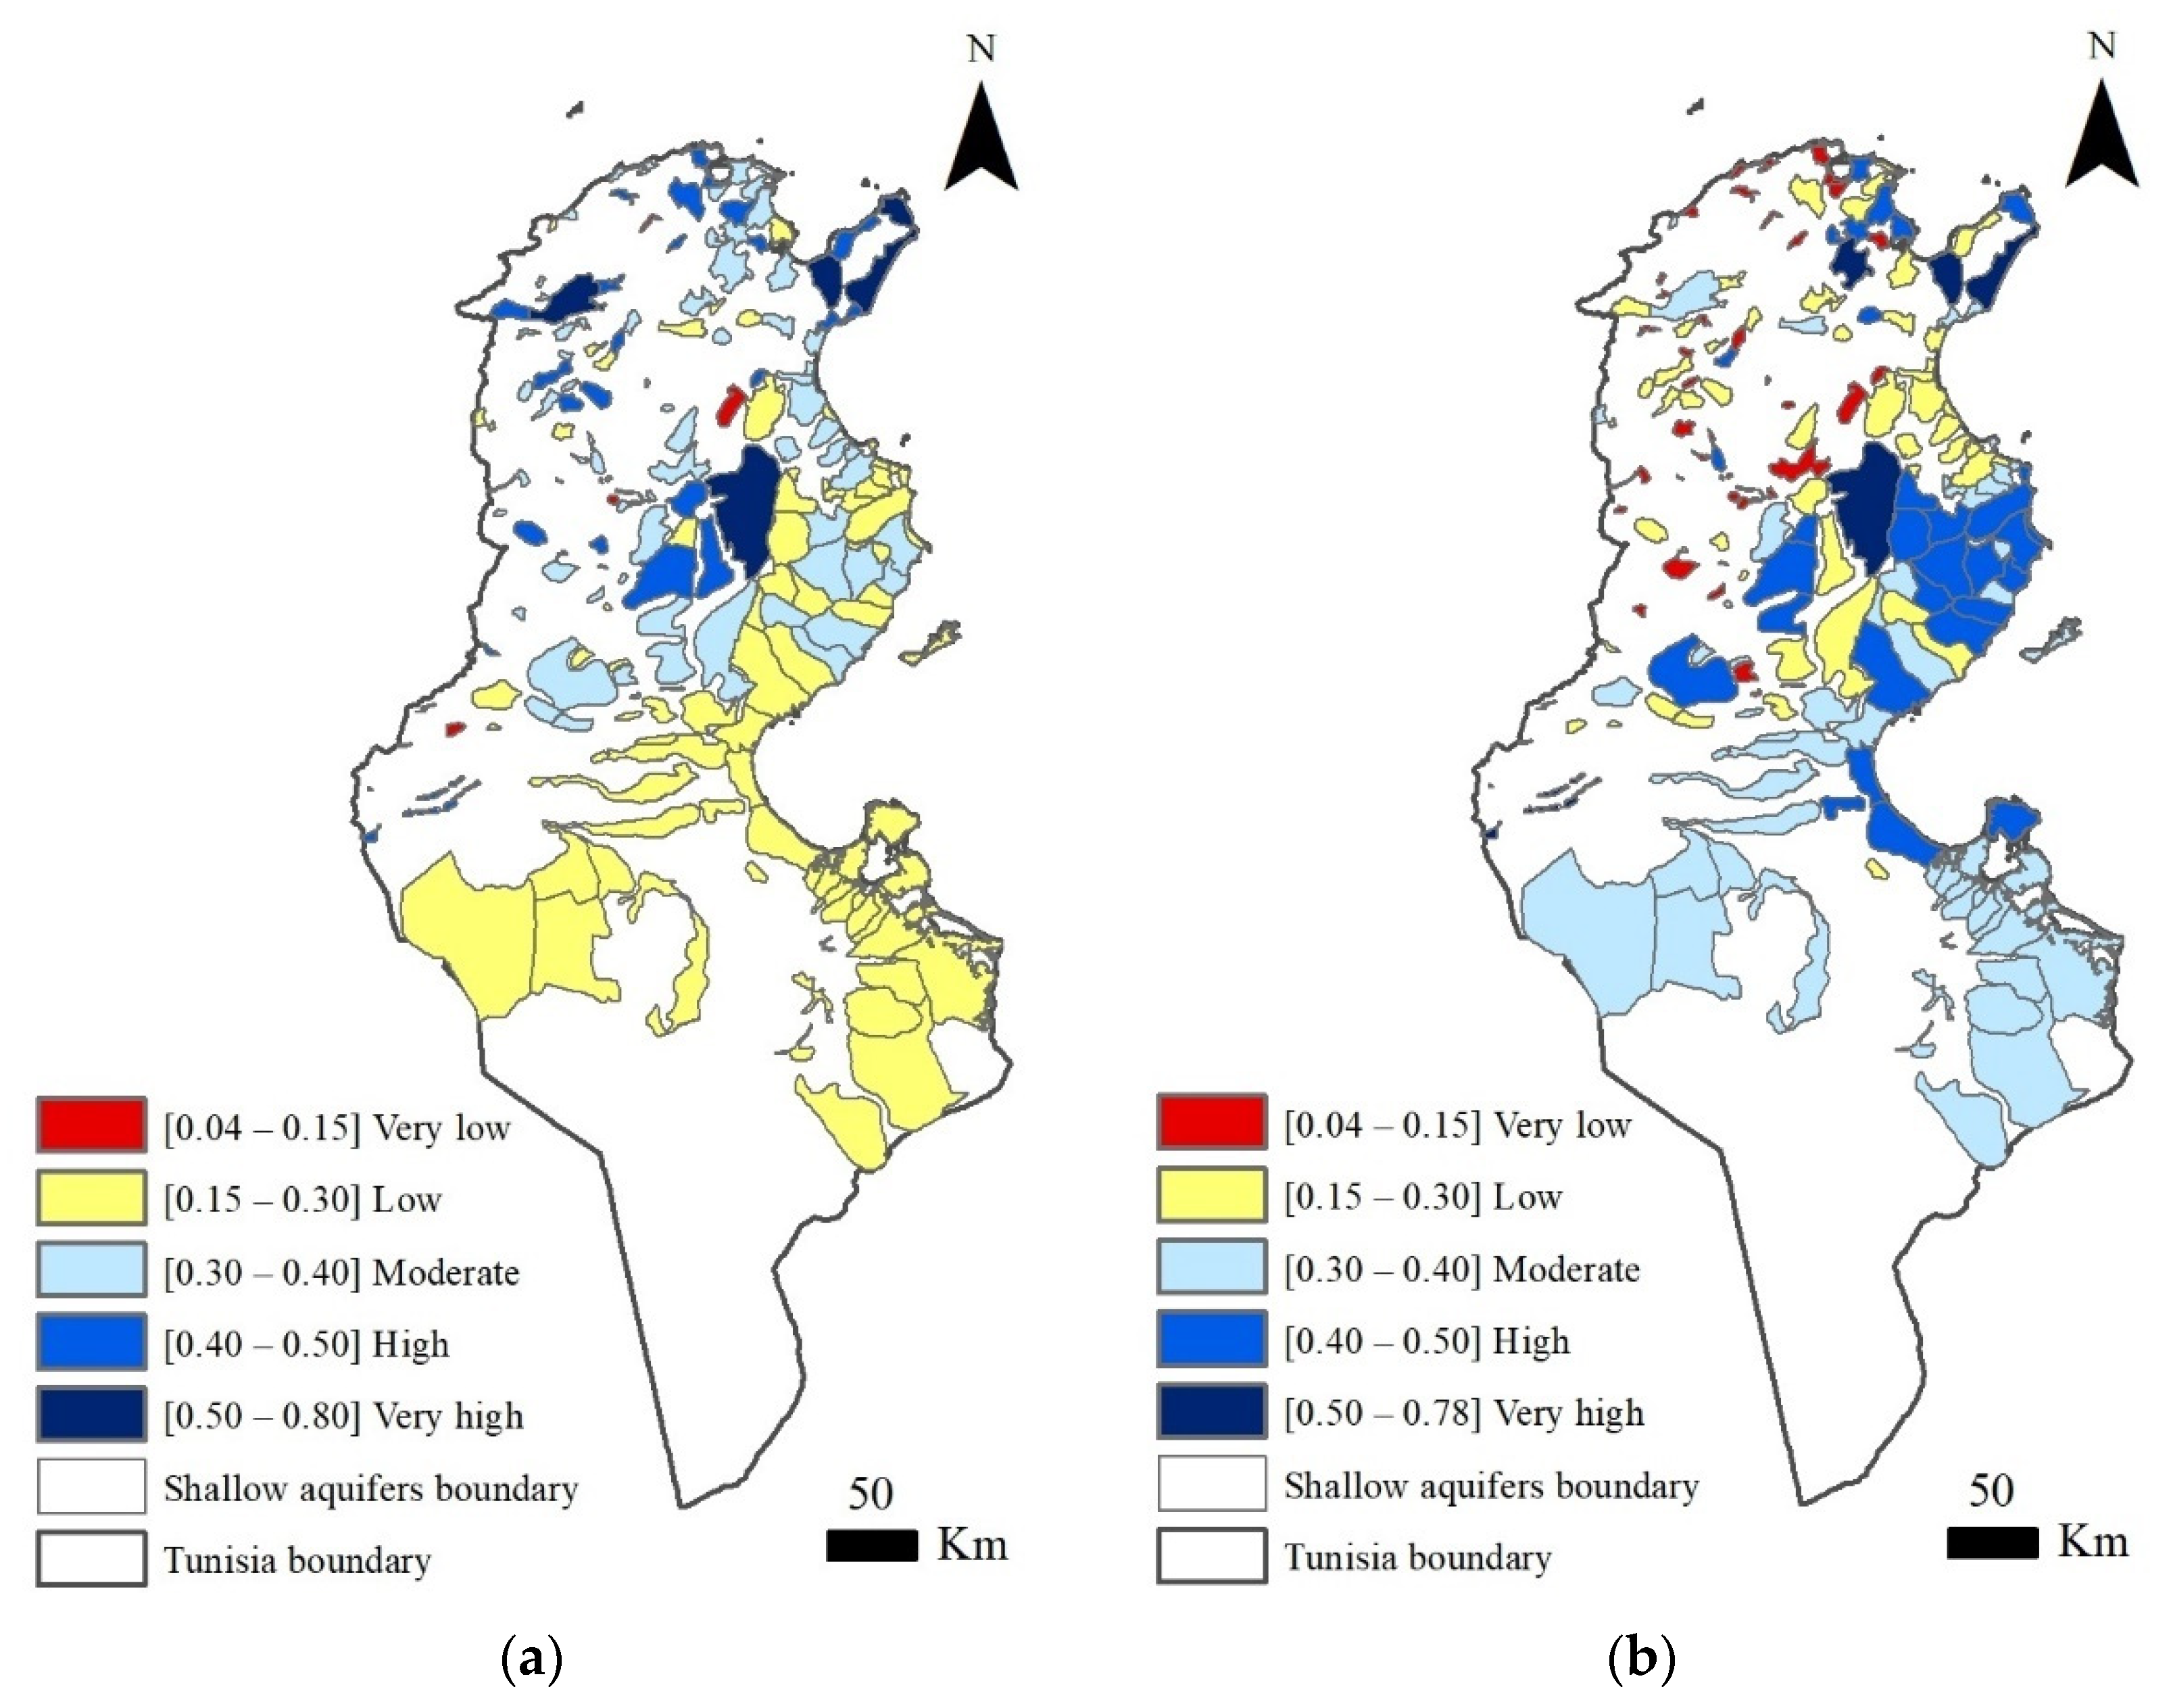
3.5.3. Suitable Shallow Aquifer Ranking for System Implementation for SmaIrriCubeEff-E0-PV0 and SmaIrriCubeAcc-E0-PV0 Scenarios

Figure 8a,b present the spatial distribution of suitability index after discarding both the evaporation and solar photovoltaic modules from the SmaIrriCubeEff and SmaIrriCubeAcc systems.
The suitability map for the SmaIrriCubeEff-E0-PV0 shows that some shallow aquifers in central-west and the Cap Bon peninsula are categorized by high to very high suitability. The aquifers in the extreme north and some in the center have moderate suitability, while the aquifers in the south and central-east of the country are characterized by low suitability. In comparison with the original SmaIrriCubeEff and SmaIrriCubeAcc scenarios (Section 3.3), the suitability maps of the SmaIrriCubeEff-E0-PV0 and SmaIrriCubeAcc-E0-PV0 show slightly variations in the Si ranges and a significant change in the order of suitability. In fact, Si varies from 0.04 to 0.80 for the SmaIrriCubeEff-E0-PV0 scenario, and from 0.04 to 0.78 for the SmaIrriCubeAcc-E0-PV0 scenario. The visual analysis of Figure 8 show that the aquifers located in the southern part are the most sensitive alternatives to the elimination of the evaporation and solar photovoltaic modules, as these areas are characterized by a significant solar irradiation, a high temperature and evaporation rate. Thus, the Global Horizontal Irradiation, Temperature and Evaporation criteria have a great effect on the result of the aquifers’ suitability ranking.
Table 8 shows that for the SmaIrriCubeEff-E0-PV0 scenario, the Eastern Coast, Grombalia and Kairouan Plain aquifers are the top three ranking alternatives, with an Si higher than 0.60. For the SmaIrriCubeAcc-E0-PV0 scenario, the Eastern Coast, Grombalia and Kairouan Plain aquifers are the top three ranking alternatives, with Si values of 0.78, 0.59 and 0.59, respectively. The Ain Bou Mourra, El Bouajer and Haute Joumine aquifers are the bottom ranking alternatives in the two scenarios, with only slight changes in the suitability index values.

4. Discussion

The methodology applied is a simple but efficient MCDA tool, aimed at selecting the suitable aquifers for on-farm PV desalination units for irrigation, and ranking them according to multiple criteria. The methodology is established to be used in different countries and regions of the world, and not limited to Tunisia. The criteria selected and the weights given were based on international literature and experts from different technical and research fields and from different countries from Europe and North Africa. The WSM aggregation method is simple and successfully employed in different scientific disciplines and regions over the world. The spatial data used are easy to get for most of the globe and many of them, such as GHI, are available on the web for free. However, considering the local conditions to set the minimum and the maximum values in the process of normalization does not allow for a comparison of the suitability index outcomes between different study areas across the world, but only between sites or aquifers in the studied spatial extent; such as the Tunisian aquifers, in our case.
This work, being the first one carried out at a national level, considering the aquifer as an elementary unit, and taking into account all of the components of the desalination system, is of special interest for Tunisia. It provides elements to help with the introduction of on-farm PV desalination technology as an unconventional water supply option for agriculture, and to establish legislative rules for brine disposal.
Integrating this option into the national water strategy is a matter of time because of the lamentable water situation in many of the Tunisian phreatic aquifers. However, the use of desalted brackish water for agriculture drives a drastic, imminent increase in the demand for groundwater resources; thus, compromising the fragile aquifers system through over-drafting, seawater intrusion and other environmental negative impacts. Therefore, it is important to deal with groundwater desalination carefully and to consider this option as the last resort and the ultimate solution in an integrated water resource management framework. Indeed, some of the semi-arid countries in the world have adopted the on-farm desalination system, especially Spain. To tackle the scarcity of water in the south part of the country, the on-farm desalination of brackish water was implemented since 2004 and considered as an economically more viable and socially more acceptable solution than a water inter-basins transfer scenario [54]. Because of the high demand for groundwater, causing high aquifer depletion and water quality deterioration, this practice is currently reaching its limit and it is massively abandoned by the farmers [54].
The evaporation pond is an interesting environmental solution for the brine disposal however not considering this option in the MCA approach highlights the important changes in the ranking of Tunisian aquifers for the desalination system. It is less effective in certain regions, especially in the north east where evaporation is lower and where land is fertile and more expensive. It is possible to find other more effective solutions that could be more attractive for the farmers, such as surface water discharge (river or sea) and deep well injection [55,56]. However, these options are very site-specific and should be preceded by environmental impact studies and need approval from the local or national authorities in order to avoid the negative impact on the environment [57,58].

5. Conclusions

The GIS-based multi-criteria decision analysis (MCDA-GIS) was used to identify and rank the suitable shallow aquifers where the SmaIrriCube system, a novel small-scale solar PV desalination system, is technically suitable, economically feasible, and practically efficient by considering a significant number of criteria encompassing climate, water resources, topography and land use.
The overall results indicate that 188 from 204 shallow aquifers are identified as unsuitable for the implementation of the SmaIrriCube system. The results highlight the great potential of the Kairouan Plain, Djerid Oasis and Oum Laksab aquifers for future SmaIrriCubeEff system implementation, due to lower groundwater salinity and higher solar irradiation, evaporation rate and groundwater availability. Meanwhile, the aquifers of Djerid Oasis, Nefzaoua Southern and Gabes South are more suitable for the SmaIrriCubeAcc system installation. This is may be explained by the higher global horizontal irradiation, evaporation rate and groundwater availability. The removal of the evaporation and solar photovoltaic modules from the SmaIrriCubeAcc and SmaIrriCubeEff significantly affected the ranking of the southern and central aquifers, as they are the most sensitive to the solar irradiation, temperature and evaporation criteria.
Therefore, the developed MCDA-GIS methodology could be adapted to similar analyses for other regions and is useful for assessing the aquifer suitability for other solar desalination technologies at a farm scale, while carefully identifying the appropriate criteria for the local context and the particular preferences of the decision-makers. This research is an aquifer-scale assessment for future SmaIrriCube system set up. In the case of an actual implementation project, a specific, detailed site-selection analysis must be carried out, with more comprehensive criteria and enhanced data.

Author Contributions

Conceptualization, R.M. and M.A.; methodology, R.M. and M.A.; validation, M.A., E.E.C.K., U.H. and J.H.; formal analysis, R.M., M.A.; investigation, R.M., M.A.; writing—original draft preparation, R.M.; writing—review and editing, R.M., M.A., E.E.C.K., U.H. and J.H.; visualization, R.M. and M.A.; supervision, M.A. and J.H. All authors have read and agreed to the published version of the manuscript.

Funding

SmaCuMed project is supported by the BMBF/Germany, MESRS/Tunisia, DHESR/Morocco and FCT/Portugal and is part of the PRIMA programme supported by the European Union.

Institutional Review Board Statement

Not applicable.

Informed Consent Statement

Not applicable.

Data Availability Statement

Not applicable.

Acknowledgments

This study was conducted in the framework of EU-PRIMA project SmaCuMed “Smart irrigation cube for sustainable agriculture in the Mediterranean region” (Reference Number: 2019-SECTION2-24). The authors gratefully acknowledge the German Federal Ministry of Education and Research (BMBF, under grant agreement number 01DH20005A) and the Tunisian Ministry of Higher Education and Scientific Research (MESRS) for funding this work.

Conflicts of Interest

The authors declare no conflict of interest.

Appendix A

Table A1. Weight of criteria after varying “evaporation” dimension using SMART method.
CriteriaOriginal Wi−20% Wi−10% Wi+10% Wi+20% Wi
Well density 0.0200.0250.0230.0170.014
Slope 0.0300.0350.0330.0270.024
Temperature 0.0400.0450.0420.0370.034
Evaporation0.1780.1390.1580.1980.218
Agricultural area 0.1780.1840.1810.1750.173
Global horizontal irradiation 0.1780.1840.1810.1750.173
Groundwater quantity 0.1780.1840.1810.1750.173
Groundwater salinity 0.1980.2040.2010.1950.192
Total 1.0001.0001.0001.0001.000
Table A2. Weight of criteria after varying “agriculture area” dimension using SMART method.
CriteriaOriginal Wi−20% Wi−10% Wi+10% Wi+20% Wi
Well density 0.0200.0250.0230.0170.014
Slope 0.0300.0350.0330.0270.024
Temperature 0.0400.0450.0420.0370.034
Evaporation0.1780.1840.1810.1750.73
Agricultural area 0.1780.1390.1580.1980.218
Global horizontal irradiation 0.1780.1840.1810.1750.173
Groundwater quantity 0.1780.1840.1810.1750.173
Groundwater salinity 0.1980.2040.2010.1950.192
Total 1.0001.0001.0001.0001.000
Table A3. Weight of criteria after varying “global horizontal irradiation” dimension using SMART method.
CriteriaOriginal Wi−20% Wi−10% Wi+10% Wi+20% Wi
Well density 0.0200.0250.0230.0170.014
Slope 0.0300.0350.0330.0270.024
Temperature 0.0400.0450.0420.0370.034
Evaporation0.1780.1840.1810.1750.173
Agricultural area 0.1780.1840.1810.1750.173
Global horizontal irradiation 0.1780.1390.1580.1980.218
Groundwater quantity 0.1780.1840.1810.1750.173
Groundwater salinity 0.1980.2040.2010.1950.192
Total 1.0001.0001.0001.0001.000
Table A4. Weight of criteria after varying “groundwater quantity” dimension using SMART method.
CriteriaOriginal Wi−20% Wi−10% Wi+10% Wi+20% Wi
Well density 0.0200.0250.0230.0170.014
Slope 0.0300.0350.0330.0270.024
Temperature 0.0400.0450.0420.0370.034
Evaporation0.1780.1840.1810.1750.173
Agricultural area 0.1780.1840.1810.1750.173
Global horizontal irradiation 0.1780.1840.1810.1750.173
Groundwater quantity 0.1780.1390.1580.1980.218
Groundwater salinity 0.1980.2040.2010.1950.192
Total 1.0001.0001.0001.0001.000
Table A5. Weight of criteria after varying “groundwater salinity” dimension using SMART method.
CriteriaOriginal Wi−20% Wi−10% Wi+10% Wi+20% Wi
Well density 0.0200.0250.0230.0170.014
Slope 0.0300.0350.0330.0270.024
Temperature 0.0400.0450.0420.0370.034
Evaporation0.1780.1840.1810.1750.173
Agricultural area 0.1780.1840.1810.1750.173
Global horizontal irradiation 0.1780.1840.1810.1750.173
Groundwater quantity 0.1780.1840.1810.1750.173
Groundwater salinity 0.1980.1580.1780.2180.238
Total 1.0001.0001.0001.0001.000

Appendix B

Table A6. Spearman’s rank correlation coefficient for Evaporation criterion variation.
Original Model Sensitivity Analysis Scenarios
−20% Wi−10% Wi+10% Wi+20% Wi
SmaIrriCubeEff0.890.970.980.87
SmaIrriCubeAcc0.900.991.000.89
Table A7. Spearman’s rank correlation coefficient for agriculture area criterion variation.
Original Model Sensitivity Analysis Scenarios
−20% Wi−10% Wi+10% Wi+20% Wi
SmaIrriCubeEff0.890.950.990.93
SmaIrriCubeAcc0.860.970.990.99
Table A8. Spearman’s rank correlation coefficient for global horizontal irradiation criterion variation.
Original Model Sensitivity Analysis Scenarios
−20% Wi−10% Wi+10% Wi+20% Wi
SmaIrriCubeEff0.850.960.970.89
SmaIrriCubeAcc0.980.900.990.94
Table A9. Spearman’s rank correlation coefficient for groundwater quantity criterion variation.
Original Model Sensitivity Analysis Scenarios
−20% Wi−10% Wi+10% Wi+20% Wi
SmaIrriCubeEff0.880.970.980.86
SmaIrriCubeAcc0.890.990.990.97
Table A10. Spearman’s rank correlation coefficient for groundwater salinity criterion variation.
Original Model Sensitivity Analysis Scenarios
−20% Wi−10% Wi+10% Wi+20% Wi
SmaIrriCubeEff0.860.960.980.89
SmaIrriCubeAcc0.870.980.990.90

References

  1. Water in Agriculture. Available online: https://www.worldbank.org/en/topic/water-in-agriculture#1 (accessed on 22 April 2022).
  2. Jakemann·, A.; Randall, O.; Huntt, J.; Andrewwross, J.-D. Integrated Groundwater Management Concepts, Approaches and Challenges; Springer Nature: Berlin, Germany, 2016. [Google Scholar]
  3. Achu, A.L.; Thomas, J.; Reghunath, R. Multi-Criteria Decision Analysis for Delineation of Groundwater Potential Zones in a Tropical River Basin Using Remote Sensing, GIS and Analytical Hierarchy Process (AHP). Groundw. Sustain. Dev. 2020, 10, 100365. [Google Scholar] [CrossRef]
  4. Awaad, H.A.; Mansour, E.; Akrami, M.; Fath, H.E.S.; Javadi, A.A.; Negm, A. Availability and Feasibility Ofwater Desalination as a Non-Conventional Resource for Agricultural Irrigation in the MENA Region: A Review. Sustainability 2020, 12, 7592. [Google Scholar] [CrossRef]
  5. Closas, A.; Molle, F. Groundwater Governance in MENA; IWMI: Gujarat, India, 2016. [Google Scholar]
  6. Mateo-Sagasta, J.; Burke, J. Agriculture and Water Quality Interactions: A Global Overview SOLAW TR08; FAO: Roma, Italy, 2011. [Google Scholar]
  7. Kumar, R.; Ahmed, M.; Bhadrachari, G.; Thomas, J.P. Desalination for Agriculture: Water Quality and Plant Chemistry, Technologies and Challenges. Water Sci. Technol. Water Supply 2018, 18, 1505–1517. [Google Scholar] [CrossRef] [Green Version]
  8. Burn, S.; Hoang, M.; Zarzo, D.; Olewniak, F.; Campos, E.; Bolto, B.; Barron, O. Desalination Techniques—A Review of the Opportunities for Desalination in Agriculture. Desalination 2015, 364, 2–16. [Google Scholar] [CrossRef]
  9. SmaCuMed—An Innovative Smart Irrigation Cube for Sustainable Agriculture. Available online: https://smacumed.eu/ (accessed on 20 April 2022).
  10. Belton, V.; Hodgkin, J. Facilitators, Decision Makers, D.I.Y. Users: Is Intelligent Multicriteria Decision Support for All Feasible or Desirable? Eur. J. Oper. Res. 1999, 113, 247–260. [Google Scholar] [CrossRef]
  11. Figueira, J.; Greco, S.; Ehrgott, M. Multiple Criteria Decision Analysis: State of the Art Surveys; Springer: New York, NY, USA, 2005; Volume 78, ISBN 0387230815. [Google Scholar]
  12. Dweiri, F.; Khan, S.A.; Almulla, A. A Multi-Criteria Decision Support System to Rank Sustainable Desalination Plant Location Criteria. Desalination 2018, 444, 26–34. [Google Scholar] [CrossRef]
  13. Dawoud, O.; Ahmed, T.; Abdel-Latif, M.; Abunada, Z. A Spatial Multi-Criteria Analysis Approach for Planning and Management of Community-Scale Desalination Plants. Desalination 2020, 485, 114426. [Google Scholar] [CrossRef]
  14. Sánchez-Lozano, J.M.; Teruel-Solano, J.; Soto-Elvira, P.L.; Socorro García-Cascales, M. Geographical Information Systems (GIS) and Multi-Criteria Decision Making (MCDM) Methods for the Evaluation of Solar Farms Locations: Case Study in South-Eastern Spain. Renew. Sustain. Energy Rev. 2013, 24, 544–556. [Google Scholar] [CrossRef]
  15. Aydin, F.; Sarptas, H. Spatial Assessment of Site Suitability for Solar Desalination Plants: A Case Study of the Coastal Regions of Turkey. Clean Technol. Environ. Policy 2020, 22, 309–323. [Google Scholar] [CrossRef]
  16. Yunna, W.; Geng, S. Multi-Criteria Decision Making on Selection of Solar-Wind Hybrid Power Station Location: A Case of China. Energy Convers. Manag. 2014, 81, 527–533. [Google Scholar] [CrossRef]
  17. Vagiona, D.G. Comparative Multicriteria Analysis Methods for Ranking Sites for Solar Farm Deployment: A Case Study in Greece. Energies 2021, 14, 8371. [Google Scholar] [CrossRef]
  18. Charabi, Y.; Gastli, A. PV Site Suitability Analysis Using GIS-Based Spatial Fuzzy Multi-Criteria Evaluation. Renew. Energy 2011, 36, 2554–2561. [Google Scholar] [CrossRef]
  19. Grubert, E.A.; Stillwell, A.S.; Webber, M.E. Where Does Solar-Aided Seawater Desalination Make Sense? A Method for Identifying Sustainable Sites. Desalination 2014, 339, 10–17. [Google Scholar] [CrossRef] [Green Version]
  20. Mostafaeipour, A.; Saidi-Mehrabad, M.; Rezaei, M.; Qolipour, M. The Ranking of Southern Ports and Islands of Iran for Seawater Desalination Plants Using ELECTRE III Method. J. Renew. Energy Environ. 2017, 4, 10–22. [Google Scholar]
  21. Mostafaeipour, A.; Mohammadi, S.M.; Najafi, F.; Issakhov, A. Investigation of Implementing Solar Energy for Groundwater Desalination in Arid and Dry Regions: A Case Study. Desalination 2021, 512, 115039. [Google Scholar] [CrossRef]
  22. Paktinat, H.; Faraji, H.A.; Kian, A.R. Solar Desalination Plant Site Suitability through Composing Decision-Making Systems and Fuzzy Logic in Iran (Using the Desert Areas Approach). Desert 2014, 19, 111–119. [Google Scholar]
  23. Tunisia—Summary|Climate Change Knowledge Portal. Available online: https://climateknowledgeportal.worldbank.org/country/tunisia (accessed on 20 April 2022).
  24. FAO. Water Productivity. Available online: https://wapor.apps.fao.org/home/WAPOR_2/1 (accessed on 20 April 2022).
  25. MARHP. Rapport National Du Secteur De L’eau. 2017. Available online: http://www.onagri.nat.tn/uploads/statistiques/PRINT-2019%20Secteur-eau.pdf (accessed on 12 May 2022).
  26. Closas, A.; Imache, A.; Mekki, I. Groundwater Governance in Tunisia—A Policy White Paper; USAID: Washington, DC, USA; IWMI: Gujara, India, 2017. [Google Scholar]
  27. Sánchez-Lozano, J.M.; García-Cascales, M.S.; Lamata, M.T. Evaluation of Suitable Locations for the Installation of Solar Thermoelectric Power Plants. Comput. Ind. Eng. 2015, 87, 343–355. [Google Scholar] [CrossRef]
  28. Sánchez-Lozano, J.M.; García-Cascales, M.S.; Lamata, M.T. Comparative TOPSIS-ELECTRE TRI Methods for Optimal Sites for Photovoltaic Solar Farms. Case Study Spain. J. Clean. Prod. 2016, 127, 387–398. [Google Scholar] [CrossRef]
  29. Alami Merrouni, A.; Elwali Elalaoui, F.; Mezrhab, A.; Mezrhab, A.; Ghennioui, A. Large Scale PV Sites Selection by Combining GIS and Analytical Hierarchy Process. Case Study: Eastern Morocco. Renew. Energy 2018, 119, 863–873. [Google Scholar] [CrossRef]
  30. Al Garni, H.Z.; Awasthi, A. Solar PV Power Plant Site Selection Using a GIS-AHP Based Approach with Application in Saudi Arabia. Appl. Energy 2017, 206, 1225–1240. [Google Scholar] [CrossRef]
  31. Aldababseh, A.; Temimi, M.; Maghelal, P.; Branch, O.; Wulfmeyer, V. Multi-Criteria Evaluation of Irrigated Agriculture Suitability to Achieve Food Security in an Arid Environment. Sustainability 2018, 10, 803. [Google Scholar] [CrossRef] [Green Version]
  32. Sayed, E.; Riad, P.; Elbeih, S.; Hagras, M.; Hassan, A.A. Multi Criteria Analysis for Groundwater Management Using Solar Energy in Moghra Oasis, Egypt. Egypt. J. Remote Sens. Space Sci. 2019, 22, 227–235. [Google Scholar] [CrossRef]
  33. Afify, A. Prioritizing Desalination Strategies Using Multi-Criteria Decision Analysis. Desalination 2010, 250, 928–935. [Google Scholar] [CrossRef]
  34. Lenntech. Brine Evaporation Ponds. Available online: www.lenntech.com/processes/brine-evaporation-ponds.htm#ixzz6nSrr81V7 (accessed on 9 November 2021).
  35. Sánchez-Lozano, J.M.; Henggeler Antunes, C.; García-Cascales, M.S.; Dias, L.C. GIS-Based Photovoltaic Solar Farms Site Selection Using ELECTRE-TRI: Evaluating the Case for Torre Pacheco, Murcia, Southeast of Spain. Renew. Energy 2014, 66, 478–494. [Google Scholar] [CrossRef]
  36. Lee, A.H.I.; Kang, H.Y.; Lin, C.Y.; Shen, K.C. An Integrated Decision-Making Model for the Location of a PV Solar Plant. Sustainability 2015, 7, 13522–13541. [Google Scholar] [CrossRef] [Green Version]
  37. Liu, J.; Xu, F.; Lin, S. Site Selection of Photovoltaic Power Plants in a Value Chain Based on Grey Cumulative Prospect Theory for Sustainability: A Case Study in Northwest China. J. Clean. Prod. 2017, 148, 386–397. [Google Scholar] [CrossRef]
  38. Ahmed, M.; Shayyab, W.H.; Hoey, D.; Al-Handaly, J. Brine Disposal from Reverse Osmosis Desalination Oman and the United Arab Emirates; Elsevier: Amsterdam, The Netherlands, 2001; Volume 133. [Google Scholar]
  39. Ahmed, M.; Shayya, W.H.; Hoey, D.; Al-Handaly, J. Brine Disposal from Inland Desalination Plants Research Needs Assessment. Water International 2002, 27, 194–201. [Google Scholar] [CrossRef]
  40. Banat, F.; Subiela, V.; Qiblawey, H. Site Selection for the Installation of Autonomous Desalination Systems (ADS). Desalination 2007, 203, 410–416. [Google Scholar] [CrossRef]
  41. Mohamed, S.A. Application of Geo-Spatial Analytical Hierarchy Process and Multi-Criteria Analysis for Site Suitability of the Desalination Solar Stations in Egypt. J. Afr. Earth Sci. 2020, 164, 103767. [Google Scholar] [CrossRef]
  42. Salim, M.G. Selection of Groundwater Sites in Egypt, Using Geographic Information Systems, for Desalination by Solar Energy in Order to Reduce Greenhouse Gases. J. Adv. Res. 2012, 3, 11–19. [Google Scholar] [CrossRef] [Green Version]
  43. Perpiña Castillo, C.; Batista e Silva, F.; Lavalle, C. An Assessment of the Regional Potential for Solar Power Generation in EU-28. Energy Policy 2016, 88, 86–99. [Google Scholar] [CrossRef]
  44. Edwards, W.; Barron, F.H. SMARTS and SMARTER: Improved Simple Methods for Multi-Attribute Utility Measurement. Organ. Behav. Hum. Decis. Processes 1994, 60, 306–325. [Google Scholar] [CrossRef]
  45. Alinezhad, A.; Khalili, J. International Series in Operations Research & Management Science New Methods and Applications in Multiple Attribute Decision Making (MADM); Springer: Berlin/Heidelberg, Germany, 2019; Volume 277. [Google Scholar]
  46. Çelen, A. Comparative Analysis of Normalization Procedures in TOPSIS Method: With an Application to Turkish Deposit Banking Market. Informatica 2014, 25, 185–208. [Google Scholar] [CrossRef] [Green Version]
  47. Triantaphyllou, E. Multi-Criteria Decision Making Methods: A Comparative Study; Springer: Boston, MA, USA, 2000; pp. 5–21. [Google Scholar]
  48. Triantaphyllou, E.; Sánchez, A. A Sensitivity Analysis Approach for Some Deterministic Multi-Criteria Decision-Making Methods. Decis. Sci. 1997, 28, 151–194. [Google Scholar] [CrossRef]
  49. Saltelli, A.; Ratto, M.; Andres, T.; Campolongo, F.; Cariboni, J.; Gatelli, D.; Salsana, M.; Tarantola, S. Global Sensitivity Analysis: The Primer; Wiley: Hoboken, NJ, USA, 2008. [Google Scholar]
  50. Kottegoda, N.T.; Rosso, R. Statistics, Probability, and Reliability for Civil and Environmental Engineers, 2nd ed.; McGraw-Hill: Singapore, 1997. [Google Scholar]
  51. EarthExplorer. Available online: https://earthexplorer.usgs.gov/ (accessed on 22 April 2022).
  52. Global Solar Atlas. Available online: https://globalsolaratlas.info/map?c=11.609193,8.4375,3 (accessed on 22 April 2022).
  53. Direction Génerale des Ressources en Eau (DGRE). (Ouagadougou, Burkina Faso). Situation de l’exploitation Des Nappes Phréatiques. Unpublished work. 2015. [Google Scholar]
  54. Zarzo, D.; Campos, E.; Terrero, P. Spanish Experience in Desalination for Agriculture. Desalination Water Treat. 2013, 51, 53–66. [Google Scholar] [CrossRef]
  55. Katal, R.; Ying Shen, T.; Jafari, I.; Masudy-Panah, S.; Hossein Davood Abadi Farahani, M. An Overview on the Treatment and Management of the Desalination Brine Solution. In Desalination—Challenges and Opportunities; IntechOpen: London, UK, 2020. [Google Scholar]
  56. Soliman, M.N.; Guen, F.Z.; Ahmed, S.A.; Saleem, H.; Khalil, M.J.; Zaidi, S.J. Energy Consumption and Environmental Impact Assessment of Desalination Plants and Brine Disposal Strategies. Process Saf. Environ. Prot. 2021, 147, 589–608. [Google Scholar] [CrossRef]
  57. Jenkins, S.; Paduan, J.; Roberts, P.; Schlenk, D.; Weis, J. Management of Brine Discharges to Coastal Waters Recommendations of a Science Advisory Panel Panel Members. Available online: https://www.waterboards.ca.gov/water_issues/programs/ocean/desalination/docs/dpr051812.pdf (accessed on 12 May 2022).
  58. Abualtayef, M.; Al-Najjar, H.; Mogheir, Y.; Seif, A.K. Numerical Modeling of Brine Disposal from Gaza Central Seawater Desalination Plant. Arab. J. Geosci. 2016, 9, 1–18. [Google Scholar] [CrossRef]
Figure 1. Location of study area.
Sustainability 14 08113 g001
Figure 2. Flow diagram of pilot-scale SmaIrriCube unit.
Sustainability 14 08113 g002
Figure 3. Maps of (a) water salinity constraint; (b) evaporation constraint; (c) agriculture area constraint and (d) overall constraint.
Sustainability 14 08113 g003
Figure 4. Spatial distribution of criteria used to rank suitable shallow aquifers for SmaIrriCube system set up: (a) Global Horizontal Irradiation (kWh/m2/year); (b) Temperature (°C); (c) Evaporation (mm/year); (d) Water quantity (Mm3/year); (e) Minimum TDS (g/L); (f) Maximum TDS (g/L); (g) Well density; (h) Agricultural area (ha) and (i) Slope (%).
Sustainability 14 08113 g004aSustainability 14 08113 g004b
Figure 5. Spatial distribution of suitability index variation for the installation of (a) SmaIrriCubeEff and (b) SmaIrriCubeAcc systems.
Sustainability 14 08113 g005
Figure 6. Spatial distribution of suitability index variation for the implantation of (a) SmaIrriCubeEff-E0 and (b) SmaIrriCubeAcc-E0 systems.
Sustainability 14 08113 g006
Figure 7. Spatial distribution of suitability index variation for the implementation of (a) SmaIrriCubeEff-PV0 and (b) SmaIrriCubeAcc-PV0 systems.
Sustainability 14 08113 g007
Figure 8. Spatial distribution of suitability index variation for the implementation of (a) SmaIrriCubeEff-E0-PV0 and (b) SmaIrriCubeAcc-E0-PV0 systems.
Sustainability 14 08113 g008
Table 1. Description of the selected criteria used in this study.
Category IDCriteriaUnitJustification References
Climate C1Global Horizontal IrradiationkWh/m2/yearThe Global Horizontal Irradiation (GHI) is the total solar radiation incident on a horizontal surface. It can be converted into sustainable-produced electricity by using photovoltaic (PV) technology. Higher radiation levels increase the electrical energy produced by the system. Thus, the higher the GHI, the better the electricity production will be. [28,30,32,42,43]
C2Temperature°CSolar PV panel efficiency is affected negatively by the increase in the atmospheric temperature. The more sunshine a panel receives, the hotter the panel gets, and thus the conversion efficiency decreases. Furthermore, high temperature values affect the module’s lifetime and durability. [28,30,36,37]
C3Evaporation rateMm/yearEvaporation is the most important climate factor for brine evaporation. The evaporation process of brine increases with the increase in the evaporation rate. [38,39]
Water resources C4Groundwater quantity Mm3/yearDesalination technology is suitable for use where the volume of brackish groundwater is available and renewable, providing sufficient quantities for desalination plants and safeguarding its continuous operation.[40]
C5Groundwater salinityg/LGroundwater salinity is one of the most critical water quality criteria. An aquifer with low salinity has the highest suitability for water desalination, and the suitability decreases with the increase in the salinity level. [19,31,32,33,42]
C6Well density Well density per aquifer is an economic factor to avoid the high cost of constructing and maintaining a new well. It is more cost-effective to use existing well water for desalination. An aquifer with the highest well density has the highest suitability, and the suitability decreases with the decrease in the well density.[40]
Land Use C7Agricultural areashaThe brackish groundwater desalination process in our study is intended for agricultural applications. Thus, areas of high agricultural use are more suitable to host the SmaIrriCube system. [30]
Topography C8Land slope%The SmaIrriCube system is highly affected by land slope. Slopes affect the feasibility of the system and increase investment costs. In general, areas with low land slope are considered the most suitable to minimize financial expenditure. [30,31,38,39,40]
Table 2. Priority and weight of criteria using the SMART method.
CriteriaIi Wi
Well density 100.020
Slope150.030
Temperature200.040
Evaporation900.178
Agricultural area 900.178
Global horizontal irradiation 900.178
Groundwater quantity 900.178
Groundwater salinity 1000.198
Total 5051.000
Table 3. SMART weighting for the generated scenarios.
CriteriaScenario 1Scenario 2Scenario 3
Pi WiPi WiPi Wi
Well density 100.02100.03100.03
Slope 150.04150.04150.05
Temperature 200.050-0-
Evaporation0-900.230-
Agricultural area 900.22900.23900.30
GHI900.220-0-
Groundwater quantity 900.22900.23900.30
Groundwater salinity 1000.241000.251000.33
Total 4151.003951.003051.00
Table 4. Datasets used in the research study.
Data Data Source Extracted Data Acquisition Date
SRTM DEMEarthexplorer.usgs.gov
(accessed on 20 July 2021)
Slope
Satellite dataGlobalsolaratlas.info
(accessed on 22 July 2021)
Global horizontal irradiation1994 to 2018
Temperature1994 to 2018
Wapor.apps.fao.org
(accessed on 22 July 2021)
LULC2019
Agricultural MapMARHPWell density
Statistical data DGRE reportGroundwater quantity 2015
Groundwater salinity2015
INMEvaporation2010–2020
Table 5. Characteristics of suitable shallow aquifer ranking for the implementation of SmaIrriCubeEff and SmaIrriCubeAcc systems.
Rank Shallow Aquifer_Name SiPerformance Matrix
C1C2C3C4C5C6C7C8
SmaIrriCubeEff
Best ranked aquifers Kairouan Plain (Kairouan)0.655.0520.011819.4026.00[1.5–3.9]0.04112,6593.65
Djerid Oasis (Tozeur)0.535.3622.762526.0036.00[4.0–7.0]0.2129092.94
Oum Laksab (Gafsa-Kasserine)0.525.3418.182142.828.30[1.0–2.0]0.136273.92
Ain el Kerma (Tozeur)0.525.4021.002526.004.55[1.5–3.5]0.48435.36
Kasserine Plain (Kasserine)0.515.1017.282392.901.44[1.0–1.5]0.731373.23
Worst ranked aquifers Hencha (Sfax-Mahdia)0.215.1020.081031.31.5[5.0–7.0]0.0269853.52
Ain Bou Mourra (Kairouan)0.214.9618.671819.42.0[0.0–1.2]0.0284526.20
Haut-Joumine (Bizerte)0.094.6817.9112202.0[0.5–1.5]0.09280020.34
SmaIrriCubeAcc
Best ranked aquifersDjerid Oasis (Tozeur)0.615.3622.76252636.00[4.0–7.0]0.2329092.94
Nefzaoua Southern (Kebili)0.575.4822.093092.300.63[4.0–6.5]0.000037824.89
Gabes South (Gabes)0.565.3520.892757.109.00[2.5–7.0]0.0214,3423.86
Nefzaoua Eastern (Kebili)0.565.5121.803092.300.47[0.4–6.8]0.00014224.54
Eastern Coast (Nabeul)0.564.8318.921238.8050.00[1.5–7.0]0.1840,3784.43
Worst ranked aquifersOeud Sejnane (Bizerte)0.134.6118.6512202.90[1.0–1.5]0.1344445.42
Kef Abed (Bizerte)0.124.6219.1212201.00[1.0–3.0]0.0358628.87
Haut-Joumine (Bizerte)0.094.6817.9112202.00[0.5–1.5]0.09280020.34
Table 6. Suitability index values of eight chosen alternatives, from the best ranked to the worst shallow aquifer for SmaIrriCubeEff-E0 and SmaIrriCubeAcc-E0 scenarios.
Rank SmaIrriCubeEff-E0SmaIrriCubeAcc-E0
Shallow Aquifer NameSiShallow Aquifer NameSi
Best ranked aquifers Kairouan Plain (Kairouan)0.71Eastern Coast (Nabeul)0.66
Grombalia (Nabeul)0.58Djerid Oasis (Tozeur)0.59
Eastern Coast (Nabeul)0.57Kairouan Plain (Kairouan)0.56
Oum Laksab (Gafsa-Kasserine)0.51Gafsa North (Gafsa)0.53
Upstream Sidi Bouzid (Sidi Bouzid)0.51Grombalia (Tataouin)0.52
Worst ranked aquifers El Bouajer (Kasserine)0.18Meknas-Barkoukech (Jandouba)0.14
Ain Bou Mourra (Kasserine)0.17Kef Abed (Bizerte)0.13
Haute Joumine (Bizerte)0.09Haut Joumine (Bizerte)0.09
Table 7. Suitability index values of eight chosen alternatives, from the best ranked to the worst shallow aquifer for SmaIrriCubeEff-PV0 and SmaIrriCubeAcc-PV0 scenarios.
Rank SmaIrriCubeEff-PV0SmaIrriCubeAcc-PV0
Shallow Aquifer NameSiShallow Aquifer NameSi
Best ranked aquifers Kairouan Plain (Kairouan)0.70Eastern Coast (Nabeul)0.62
Grombalia (Nabeul)0.55Djerid Oasis (Tozeur)0.61
Eastern Coast (Nabeul)0.53Kairouan Plain (Kairouan)0.54
Djerid Oasis (Tozeur)0.49Gabes south (Gabes)0.53
Kasserine plain (Kasserine)0.49Nefzaoua Southern (Kebili)0.52
Worst ranked aquifers Ain Bou Mourra (Kasserine)0.15Oeud B. Hassine (Bizerte)0.11
Hencha (Sfax-Mahdia)0.13Kef Abed (Bizerte)0.11
Haute Joumine (Bizerte)0.05Haut Joumine (Bizerte)0.05
Table 8. Suitability index values of eight selected alternatives, from the best ranked to the worst shallow aquifer for SmaIrriCubeEff-E0-PV0 and SmaIrriCubeAcc-E0-PV0 scenarios.
Rank SmaIrriCubeEff-E0-PV0SmaIrriCubeAcc-E0-PV0
Shallow Aquifer NameSiShallow Aquifer NameSi
Best ranked aquifers Kairouan Plain (Kairouan)0.80Eastern Coast (Nabeul)0.78
Grombalia (Nabeul)0.68Grombalia (Nabeul) 0.59
Eastern Coast (Nabeul)0.66Kairouan Plain (Kairouan)0.59
Middle valley of Medjerda (Jandouba-Baja)0.55Oasis of Djerid (Tozeur)0.57
El Haouaria Plain (Nabeul)0.54Oeud Chafrou (Manouba)0.51
Worst ranked aquifers Ain Bou Mourra (Kasserine)0.15Ain Bou Mourra (Kairouan)0.07
El Bouajer (Kasserine)0.13El Bouajer (Kasserine)0.05
Haute Joumine (Bizerte)0.05Haut Joumine (Bizerte)0.04
Publisher’s Note: MDPI stays neutral with regard to jurisdictional claims in published maps and institutional affiliations.

