1. Introduction
It is nowadays evident that fresh water is an essential but limited resource that is threatened by human activity [
1]. Water-related ecosystems worldwide are currently facing many challenges such as water stress, water pollution, water scarcity, and lack of cooperation in transboundary water bodies. This affects the living conditions of billions of people, compromising the availability of drinking water, sanitation and hygiene services, and the survival of many animal and vegetable species [
2]. In particular, lakes are fragile ecosystems, facing problems as acidification, eutrophication, and water-level fluctuation [
3], providing many ecosystem services, affecting life quality, and impacting local and regional economy. The achievement of Sustainable Development Goal (SDG) 6, “Ensure access to water and sanitation for all”, is still very far off and there is a need of resources and initiatives for the implementation of integrated water bodies management, starting from their monitoring, provided that protecting is easier than restoring [
4].
The progress of SDGs is measured through their indicators that are computed by national statistic offices mainly relying on traditional monitoring techniques. The number of indicators that are included in the global SDG database nearly doubled from 2016 (115) to 2021 (211), but despite this considerable progress on the availability on the SDGs, the United Nations confirm that big data gaps still exist in all areas in terms of geographic coverage, timeliness, and the level of disaggregation that are required [
5].
The SDG 6 Synthesis Report 2018 (United Nations 2018) identified four main challenges for its achievement: political engagement, data scarcity, climate change, and a financing gap. It suggests methods of good governance, capacity development, elimination of inequalities, and the use of smart technologies as solutions to these issues.
Ferrari et al. [
6] argued that there is an urgent need for a renewal of the Environmental Monitoring Assessment (EMA) and proposed to consider Citizen Science (CS) for data production as a possible strategy. CS and community-based monitoring (CBM) programs are increasing in number and breadth, generating volumes of scientific data [
7]. In fact, worldwide, decision-makers and nongovernmental organizations are increasing their use of CS to enhance their ability to monitor environmental-related issues [
8], also thanks to and increasing level of CS data quality. In a review of more than 60 papers, Aceves-Bueno et al. [
9] proved through a comparison method that between 51% and 62% of the CS data was accurate and that 73% at least was valuable and comparable.
In addition to data creation, CS has been proved to have other positive effects. The recently published “Best practices in Environmental Monitoring” [
10] recognize the benefits of CS distinguishing between policy, scientific, and social values. Volunteer contribution can in fact help in identifying problems and increasing the level of detail of the environmental monitoring through systematic observations and data collections with peculiar spatial and temporal resolution. Citizens can be involved in the co-design of tools and policies, training, and field campaigns reducing the distance from decision-makers, increasing awareness, and suggesting behavioral change.
Recent studies have also specifically proven the potential of CS for the direct assessment of SDGs indicators. The work of Fritz et al. [
11] was the first to highlight the need of novel data sources for measuring the SDGs, suggesting the high potential of CS for this purpose. Fraisl et al. [
12] followed the previously traced roadmap by surveying in which measure CS was already contributing and could potentially contribute to SDG indicators. They found that 33% of SDG indicators could benefit from CS data and that SDG 6 was among those with more available potential inputs.
Another interesting aspect was the situation in June 2020 [
12], of nearly 40 Tier III indicators, with no internationally established methodology or standards yet available for their measurement. The ongoing process of indicator update and refinement in the last document from March 2021, allowed to have no more Tier III indicators, but still 111 Tier II indicators, that are conceptually clear, with internationally established methodology and standards, but without a regular data production by countries [
13]. In the next years, CS data collection, if properly supported by the competent authorities, can play a relevant role to transform some of these Tier II indicators into Tier I (with data that are regularly produced) becoming data reliable sources for their calculation where other monitoring techniques struggle to get started. For achieving this result, the involvement of competent authorities in SDG-oriented monitoring campaigns is needed [
6].
Water quality is recognized as a field of application where many efforts are still needed in the perspective of the achievement of the SDG 6. Njue et al. [
14] reviewed more than 70 CS articles in the last two decades within the context of hydrology, affirming that CS is becoming more and more popular and cost-effective, representing a promising approach for data collection. Quilivan et al. [
15] reviewed a specific SDG indicator (6.3.2, Proportion of bodies of water with good ambient water quality), highlighting potential for utilising a CS approach for its monitoring. Also, Shen and Varis [
16] highlighted the importance of public acceptance, together with economic, infrastructural and technological aspects, for the sustainability of water management activities.
Conrad and Hilchey [
8] stressed the importance of having more case studies where decision-makers make an effective use of CS data. The co-design of projects is suggested to establish strong ties between research and public engagement, enhancing the long-term sustainability of monitoring networks [
14]. This is confirmed by the work of Capdevila et al. [
17], that in a review of more than 50 articles identified the interaction between citizens and institutions as a key factor to enable a systematic analysis and design of CS projects in the future.
1.1. SIMILE Project and Its CS Activities
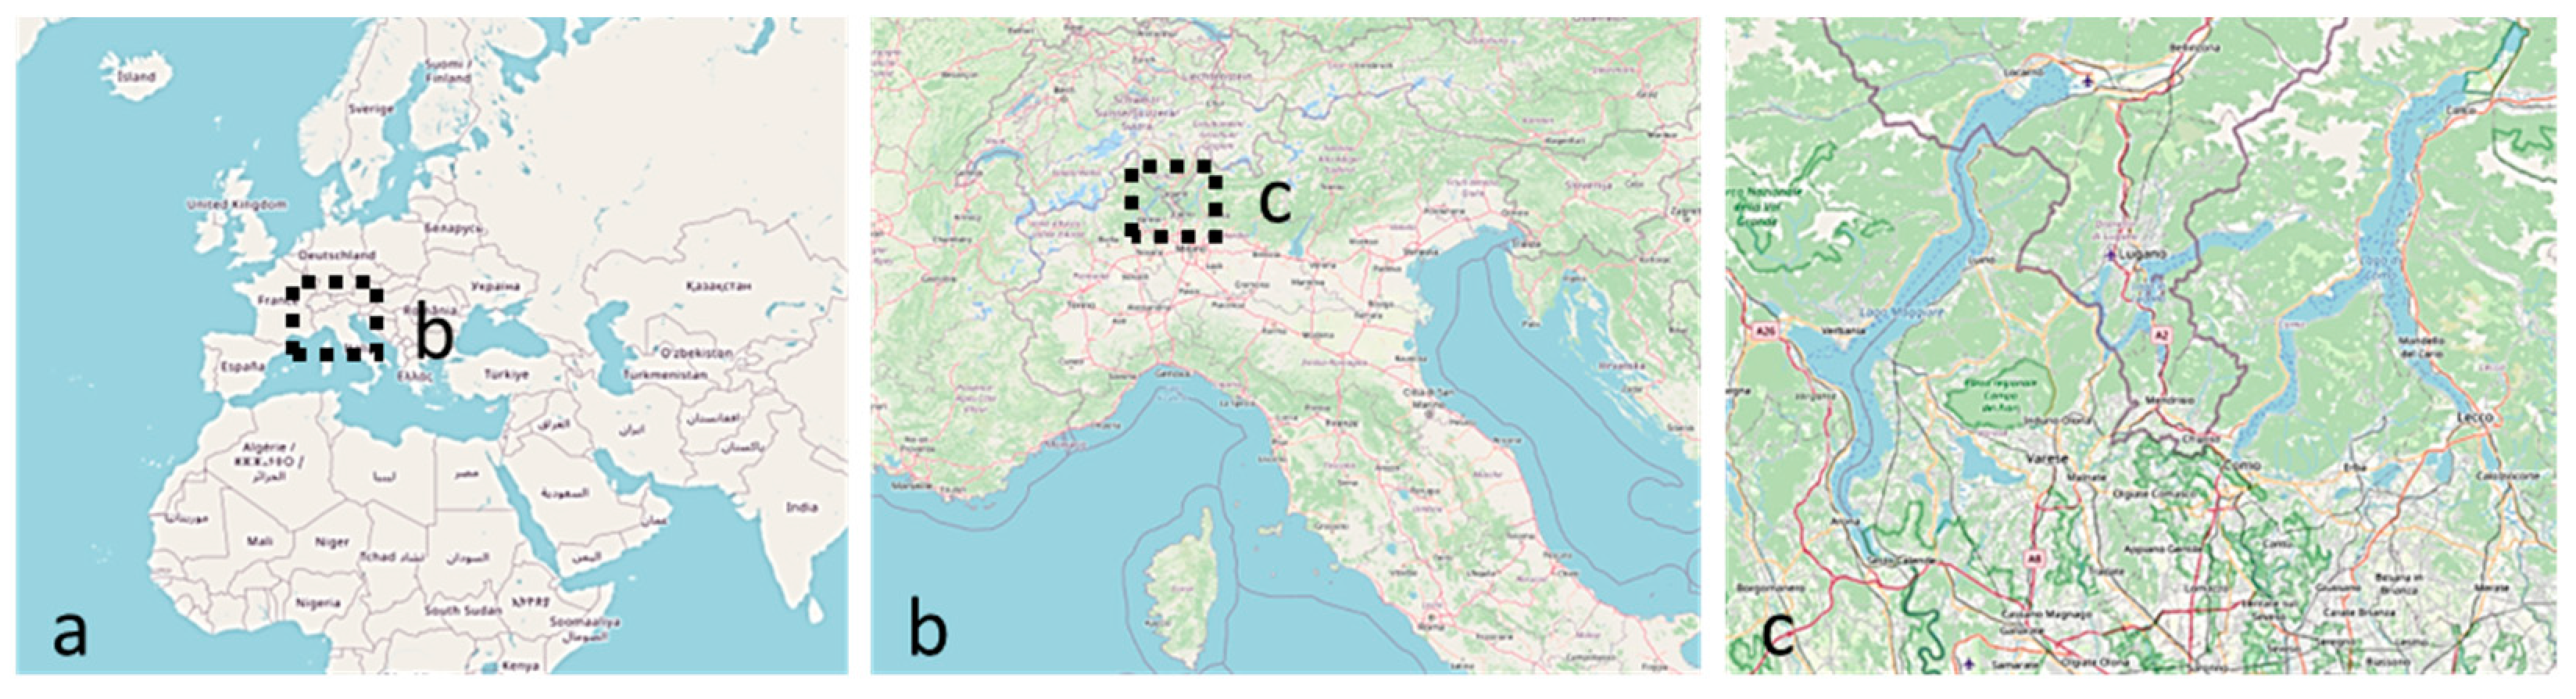
SIMILE (Informative System for the Integrated Monitoring of Insubric Lakes and their Ecosystems), funded by the Interreg Italy-Switzerland 2014–2020 program, is a three-year project that was started in 2019 aiming to protect the water quality of the cross-border Insubric Lakes (Como, Lugano, and Maggiore,
Figure 1) by strengthening their coordinated management and stakeholder participation in the processes of knowledge and monitoring of the water resource [
18].
The strategy for achieving these goals is the development of innovative tools for collecting, managing, and sharing data to foster the monitoring and maintenance of the water quality by the local authorities. Images from European Space Agency (ESA) Sentinels and National Aeronautics and Space Administration (NASA) Landsat [
19] are integrated with high-frequency sensors, placed on buoys and floating platforms [
20], and with Volunteered Geographic Information (VGI) produced with a CS approach. These three monitoring techniques were chosen to complement each other in terms of spatial and temporal coverage. In the paper, in situ sensors are identified as high-frequency monitoring (HFM) and water quality parameter maps derived from satellite images as remote sensing (RS).
One of the novel aspects of the project is the integration, supported by geoinformatics tools and techniques, of the three above-mentioned monitoring techniques. The challenge was on one side technical, to implement a high number of different tools and processes, interlinking their data, and on the other side motivational, convincing volunteers of their importance despite the existence of more sophisticated and automated data gathering techniques. In fact, as noticed by Jalbert and Kinchy [
21], the deployment of sensing technologies is often seen as a threat by citizens, afraid of losing importance as primary knowledge source. However, surveying the attitudes of nearly 70 volunteers, it was noticed that having access to the results of more accurate sources (laboratory analyses) was positively seen, even if not a main motivational driver [
22].
1.2. CS Tools and Activities of SIMILE Project
CS in SIMILE has been designed as a service [
23] with the purpose of establishing a long-lasting cooperation between local authorities, research bodies, associations, and citizens. Given the vastness of the project area, differently from most the CS projects dealing with water monitoring, the strategy that was adopted was trying to involve a high number of participants reducing the commitment that was required for every volunteer [
24]. The absence of costs, complicated protocols, minimum commitment for regular monitoring campaigns, and experience requirements virtually allowed everyone with a smartphone to contribute, counting on educational opportunity and civic sense as main drivers for motivation.
The citizens contribution to the SIMILE project mostly consists of field-based data collection through the SIMILE–Lake Monitoring mobile application [
25], hereinafter referred to as App, open source and freely available for IOS and Android operative systems. The App allows contributors to collect pictures; to provide details regarding phenomena observed on the water, such as algae or litter; and to store measured parameters, such as temperature, turbidity, and others. The App is also intended as an aggregator of lake-related events that are organized by local stakeholders, and as a direct communication channel for environmental alerts. Both things can be autonomously uploaded through the SIMILE Web App [
26] (
https://simile.como.polimi.it/SimileWebAdministrator/faces/index.xhtml accessed on 24 May 2022) by associations and environmental agencies that are adhering to the project. This was done to motivate the local actors to a continuative engagement even beyond the project duration. In addition, the App contain links to the other dedicated online tools containing the data that are gathered through the HFM and RS [
27]. All the developed tools and the acquired data are open and easily scalable for including additional water basins, as recommended by European Commission [
10], with the goal of increasing citizens’ awareness showing the existing connection and cooperation between policy and science.
In particular, the App was also co-designed in three steps. First, with private tables with the partner Environmental Agencies, to integrate with the existing protocols ensuring that employees could see it has an opportunity more than a burden. Second, through surveys that are shared with the community for detailing map view and usability aspects [
28], and finally organizing an open co-design workshop whose precious insights guided the release of the current App version (2.4.0). Activities for supporting and promoting the use of the App were organized: they included seminars, public presentations, trainings for Public Administration (PA) employees, and activities with the schools.
As a first step, a total of 127 municipalities falling within the Italian side of the project area were identified and notified about the existence of the App and the project with the proposal to set up partnerships or events. Among them, 40 belong to the Como province, 22 to Lecco, 30 to Varese, 16 to Novara and 12 to Verbania. All the associations of the same municipalities were also taken into account for the same purpose, mailing those related to environment, water sports and hobbies, for a total of 92. The same geographic criteria of lake proximity was used to identify all the schools with students ranging from 11 to 18 years old. A set of multidisciplinary educational proposals was prepared with dedicated activities for the different age groups and sent to 83 first level (11–14 years old) and 159 second level (14–18 years old) secondary schools. Additional details on the activities that were performed with the schools are given in
Section 2.4.
Given the composition of the project partners [
29], the involvement of volunteers in data collection [
30], the focus on the observation of the environment, the use of ICT, and the purpose of establishing a long-term activity [
31], SIMILE can be considered as a Citizen Observatory (CO) at a preliminary stage. Using SIMILE as a case study, this article confirms the positive findings of the literature related to CS and its complementary nature with respect to other monitoring methods aiming to demonstrate CS positive impact on SDG 6 targets and indicators even beyond their established calculation methods.
1.3. SDG 6 Indicators Related to SIMILE Project
Focusing on SDG 6, it can be noticed that the first four indicators (6.1.1 to 6.3.2) are Tier II while the remaining ones (6.4.1 to 6.b.1) are Tier I. The countries that are interested by SIMILE project, Italy and Switzerland, are respectively 26th and 16th in the SDG index rank, and both present challenges for SDG 6 mainly related to water scarcity [
32,
33]. The SDG targets mostly affected by SIMILE are 6.3 (water quality), 6.5 (transboundary cooperation), and 6.b (participation of local communities) and their related indicators. Before looking in detail how the project outcomes could directly help measuring or at least positively impact them, it is interesting to look at the performances of the two countries on these indicators (
Table 1).
Indicator 6.3.1 (proportion of domestic and industrial wastewater flows safely treated) has very high values for both countries. However, it might happen that both irregular domestic and industrial activities escape the actual protocols, overestimating the actual indicator value. For example, the municipalities of Angera and Arona on Maggiore Lake, recently conducted independent on field inspections on drains detecting dozens of irregular sites [
34]. In addition, important local companies dealing with water treatment are installing electronic devices for the early warning detection of pollutants in waste-water [
35].
Indicator 6.3.2 (proportion of bodies of water with good ambient water quality) results from three different values, namely rivers, lakes, and groundwater. While for Italy there are no available data, in Switzerland only the 36.4% of the open water bodies (lakes and artificial reservoirs) have a good water quality.
Indicator 6.5.1 (degree of integrated water resources management implementation 0–100) data are collected through a survey that includes questions regarding integrated water resources management (1.1.c), transboundary arrangements (1.2.c and 2.2.e), public participation (2.1.c and 2.2.b) with attention to vulnerable groups (2.2.c), and data sharing within countries (3.2.c and 3.2.d). Responses are self-declarations that are consolidated through consultations between relevant stakeholders, such as national and subnational line ministries and institutions that are involved in water resources management and other stakeholders such as associations, academia, and business.
Indicator 6.5.2 (proportion of transboundary basin area with an operational arrangement for water cooperation) is simply the ratio between the transboundary waters that are covered by an agreement and the total transboundary waters. Italia-Switzerland waters are limited to Lugano and Maggiore Lake and are jointly managed by the CIPAIS (International Commission for the Protection of Italian-Swiss Waters). As Italy has no other transboundary basins, it scores 100%, while Switzerland, sharing water basins with also French, Germany, and Austria, scores 90% due to the lack of an agreement with Austria. Working side-by-side with the institutional bodies, members of the CIPAIS, it was possible to notice that despite the existence of such arrangement, the monitoring and the management of the transboundary lakes still presents opportunities for being improved. In fact, lakes such as Maggiore and Lugano show on the two countries, differences in water quality indicators, reporting procedures of environmental warnings, and alert thresholds for specific pollutants [
36].
Indicator 6.b.1 (proportion of local administrative units with established and operational policies and procedures for participation of local communities in water and sanitation management) measures the percentage of municipalities or other units, with systematic procedures for public engagement on water-related issues. Data are currently not available for both countries and during the stakeholder involvement phase, neither ongoing initiatives nor larger community programs were found on the Italian side. After presenting the methods and the results of the SIMILE CS activities in the discussion section it will be shown how the project outcomes and data could support the related SDG 6 indicators.
2. Materials and Methods
The goal of the analysis that was performed on the SIMILE data is to understand the added value of CS in comparison to the other monitoring systems. The expected positive aspects of CS outcomes are mainly:
- (1)
to increase the knowledge about the lake ecosystem;
- (2)
to protect the lake by preventing undesired behaviors;
- (3)
to promote the attention and involvement of citizens in water quality monitoring and protection.
The first aspect was assessed through the analysis and inter-comparison of SIMILE data (CS, HFM, RS).
The assessment of the second aspect was carried out by evaluating the outcomes of the citizens’ involvement activities that were carried out in the first years of the project and the opinions of the people that were involved. The focus was mainly on the activities with the schools to understand their role in raising awareness.
Finally, the third aspect was simply measured through the increase in the number of App users over time.
2.1. CS Data Download and Cleaning
CS data were first downloaded through their RESTful API (
https://api-simile.como.polimi.it/v1/observations accessed on 6 December 2021) from 11 June 2020, day of the first contribution, to 6 December 2021. The last satellite image that is available is for 3 December 2021 and the buoy that last became operative started measuring at the end of October 2021. The processing of the georeferenced observations was then performed using the open software QGIS 3.16.
The raw dataset contained 281 citizens observations and among them, 151 contained at least a measure of a water quality parameter. For the purpose of this study, a preliminary filtering was necessary that was mainly based on the location of the contributions. The App is developed for the Insubric lakes (Como, Maggiore, and Lugano lakes) and it only displays contributions that are acquired inside those regions of interest. However, the App can already be used worldwide, and contributions that are acquired outside the project area are stored in the database and are visible on the Web App. In fact, eight contributions were collected around Italy on lakes, rivers, and seas, however, they were discarded for the purpose of this paper. In addition, 22 inputs that were located in the Insubric region at more than 500 m from the lake’s perimeter were also discarded. These acquisitions might have been due to users collecting data in the field and inserting them later on, once the area was left or due to trial observations. The available dataset is then composed of 251 (89% of the total observations) features. In
Section 3.1, the spatial and temporal distribution of the contributions is presented through tables and graphs; aggregating them by season, lake, and region; and comparing their value with simple demographic parameters to detect usage patterns.
2.2. Water Quality Assessment through CS Data
The proportion of observations with or without measures can be read as an indicator of the overall water quality. In fact, the presence of measures is neutral to water quality as they used to be taken despite the water conditions. “Simple observations” (without measures) instead, are often taken when something is considered wrong by the App user, even if it is an event of minor intensity. In fact, the phenomena listed in the “details” section are all things that normally shouldn’t be found in a clean ideal water body (harmful algae, excessive foams, litter, drains, oil stains, odors, and alien species or suffering animals). In addition, there were also 21 “empty” observations, containing no measure and no undesired phenomenon. These can be substantially divided in two types: App trials and incomplete measures. An example of App trials are observations simply reporting clean water including a picture of the lake. There was also a fisherman posting their fishing tackle writing in the other comments section “lake without current … maggots caught on the bottom but no fish … just a roach”. These two cases show how the App has been used also in a way not that was initially foreseen. Incomplete measures instead contain pictures of temperature or transparency measures, but the data have not been correctly uploaded in the ”add a measure section”. In certain cases, it was possible to edit them by looking at the pictures of the thermometers indicating the surface value, while for transparency the information was not enough to derive reliable values.
Observations have been divided by type and intensity and displayed on a map to highlight water quality-related issues. Observations have also been compared with official warnings that were received by the Environmental Agencies in the same period. It must be said that official warnings should include only phenomena that are classifiable as environmental urgency or emergency (extreme events) while, through the App, citizens are free to also share phenomena of minor entity. Both results can be found in
Section 3.2.
2.3. Inter-Comparison of CS, HFM and RS Data
The RS and data can be accessed through the dedicated SIMILE WebGIS [
27] (
https://www.webgis.eo.simile.polimi.it/ accessed on 24 May 2022) while the HFM data will be uploaded before the end of the project on the Business Intelligence (BI) platform, not yet online.
The intercomparison between the CS data and the HFM and RS ones has two main objectives. The first one is to show that the CS data are not redundant, they do not represent a duplicate of the other monitoring systems but, instead, are complementary. This is particularly true for the RS data where it is frequent to have missing data along the shores or because of the presence of clouds. Given the intrinsic differences among the temporal and spatial location, resolution, and measuring methods, comparing these data was particularly challenging. In fact, these data have heterogenous levels of spatial coverage, spatial resolution, and temporal frequency. RS products consist of raster maps covering the whole lake area with a resolution ranging from 30 m for temperature (Landsat-8) to 300 m for Chl-a and Turbidity (Sentinel-3) and a production frequency between 2 weeks and few days. HFM are .csv tables describing a limited number of points with a measure nearly every minute. In fact, given the high start-up costs and the periodic maintenance that is required by the floating buoys hosting the sensors, only five of them have been installed. They are, respectively, one in Maggiore Lake, located in Verbania; three in Como Lake, located in Blevio (Como side), Valbrona (Lecco side), and San Siro (upper part); and one in Lugano Lake, located in the Lugano gulf, covering only the Swiss side of the lake, divided in two by the bridge-dam of Melide.
All the sources that were used were generally reliable but presented some errors and outliers of different nature in the raw data that were removed before comparing them. The CS data acquisition procedure has been explained in previous sections, SIMILE RS and HFM data acquisition procedure are explained in [
37] and in [
38], respectively.
In addition, each monitoring technique measures a limited set of parameters, not always with the same methods as the others.
Table 2 shows the complete list of phenomena and parameters that are monitored.
RS covers a limited number of parameters with respect to the other techniques (temperature, chlorophyl-a, and total suspended matter). HFM provides a higher level of detail on very specific aspects, such as algal blooms, thanks to dedicated sensors for specific algal pigments (phycocyanin and phycoerythrin).
CS is the only way for monitoring specific kinds of environmental problems, such as the presence of litter, or capture local phenomena of low entity and short duration, with the coverage provided by the random distribution in space and time of volunteer activity.
The comparisons among the data that are acquired with the different techniques were possible for temperature, turbidity, and algal blooms.
Temperature presented no issues except for the lack of RS data within a reasonable distance in time, due to a monthly frequency, and space, due to the lack of data for the presence of clouds, to be matched with some of the CS data. The results are so presented in the
Section 3.3.
The inter-comparison of turbidity measures presented some issues. The first was related to the fact that the three measures from HFM, RS, and CS are different: HFM collects data in Nephelometric Turbidity unit (NTU) and Formazin Nephelometric Units (FNU), RS measures the concentration of total suspended matter in mg/L, and CS in measures transparency in terms of Secchi depth, in meters. In addition, the turbidity sensor of HFM, at the time of this article, has not been yet fully calibrated and the data that were collected were too often exceeding the upper threshold.
Algal blooms also presented some issues. For HFM, the problem was the absence of significant algal blooms within a reasonable distance from the installed buoys during the monitoring period. For RS, chlorophyl maps have a resolution of 300 m and the pixels on the shore, where most of the CS observations occurred, are often missing due to the noise that is introduced by the land portions that are included. For these reasons after a preliminary investigation that produced not relevant results, it has been decided to focus the analysis on more qualitative aspects of CS data.
First, among the available observations, only those containing a measure of temperature were selected. Second, two additional filtering steps were made. Only the on-land observations within a distance of 100 m from the lake perimeter were kept, with the purpose of excluding possible outliers or unreliable measures. The distance of 100 m was decided after a visual inspection of the contributions in relation to the lake perimeter to avoid discarding too many usable inputs. Then, another five observations that were located on rivers or on artificial basins were removed as they were considered not consistent with the lake monitoring. The final dataset is so composed of 40 features, including measures that were taken with both professional (accuracy: 0.1 °C) and non-professional tools.
2.4. Citizen Engagement: Schools, Associations and Municipalities
The data that were used in this article refer to the first two years of schools’ involvement in SIMILE CS activities. 2019/20 was the starting year of the project, when the effort was devoted to the development and release of the App, which was concluded in early spring of 2020. In addition, the restriction that was imposed by Covid-19 pandemic had a huge negative impact on CS activities, as it can be imagined. Out of the six in presence meetings which had been planned, just two took place as online seminars without any possibility of directly involving students in mapping activities.
The school year 2020/21 started as a regular one but it was immediately affected by quarantines, closures, and online teaching, compromising the continuity of the educational activities. Despite these difficulties, 10 classes from 4 schools were involved, for a total of nearly 250 students between 11 and 14 years old. The activity proposed, “Dal rifiuto al contributo” (“From waste to contribution”), consisted of the construction of Secchi disks from recycled materials for using them to collect transparency measures through the App. A similar activity was presented in [
39], where transparency measures taken with mini 3D-printed Secchi disks were uploaded via the TurbAqua App. Older students were also asked to collect temperature data using kitchen thermometers or better tools that were already owned by schools. The activity was articulated in a first explanatory meeting followed by a period of autonomous work, supervised by teachers, and by a conclusive meeting where students had the chance to view, from the geospatial point of view, the results of their own contributions and how these could be used to understand the change of water properties in different hours, days, and places. Pre- and post-tests [
40] were used to evaluate the students’ scientific and environmental literacy improvement and their satisfaction about the activity.
The App was also used to promote lake-related open events that were organized by local actors. Since July 2020 when the App was released, 11 events such as beach (organized by Legambiente Lecco, environmental association,
https://www.legambiente.it/ accessed on 24 May 2022), seabed (by GoDiving, divers association,
https://www.godiving.it/ accessed on 24 May 2022), and lake (by Proteus, environmental education center,
https://www.assoproteus.it accessed on 24 May 2022, with the Mandarin Oriental Hotel) clean-ups took place. Images of the events can be seen with the SIMILE WebApp. During these events, the App was presented to the participants and then used to report the result of the clean-up activities. In Autumn 2021, pH-meters and thermometers were distributed among some local associations supporting the project and living on the lake such as fishermen, canoeists, kayakers, and environmental associations. In addition, among the many official project presentations, three were hosted by municipalities.
In
Section 3.4, all these activities are presented showing: the total number of observations that were related to school activities and some examples of the tools that were realized by the students together with the results of incoming and outcoming skills surveys. The contribution of the schools was significant but it is not easy to precisely quantify its relevance with respect to other actors that were involved, as associations and municipalities. In fact, the App can be used even without being registered (678 subscribed users on a total of 830). This makes it more complicated to attribute observations to a particular user. Simple distance statistics and a proximity analysis using a hierarchical clustering algorithm were performed to evaluate the effectiveness of the different engagement initiatives. Finally, also the trend of App users from the release date is presented.
3. Results
3.1. CS Contribution in Time and Space
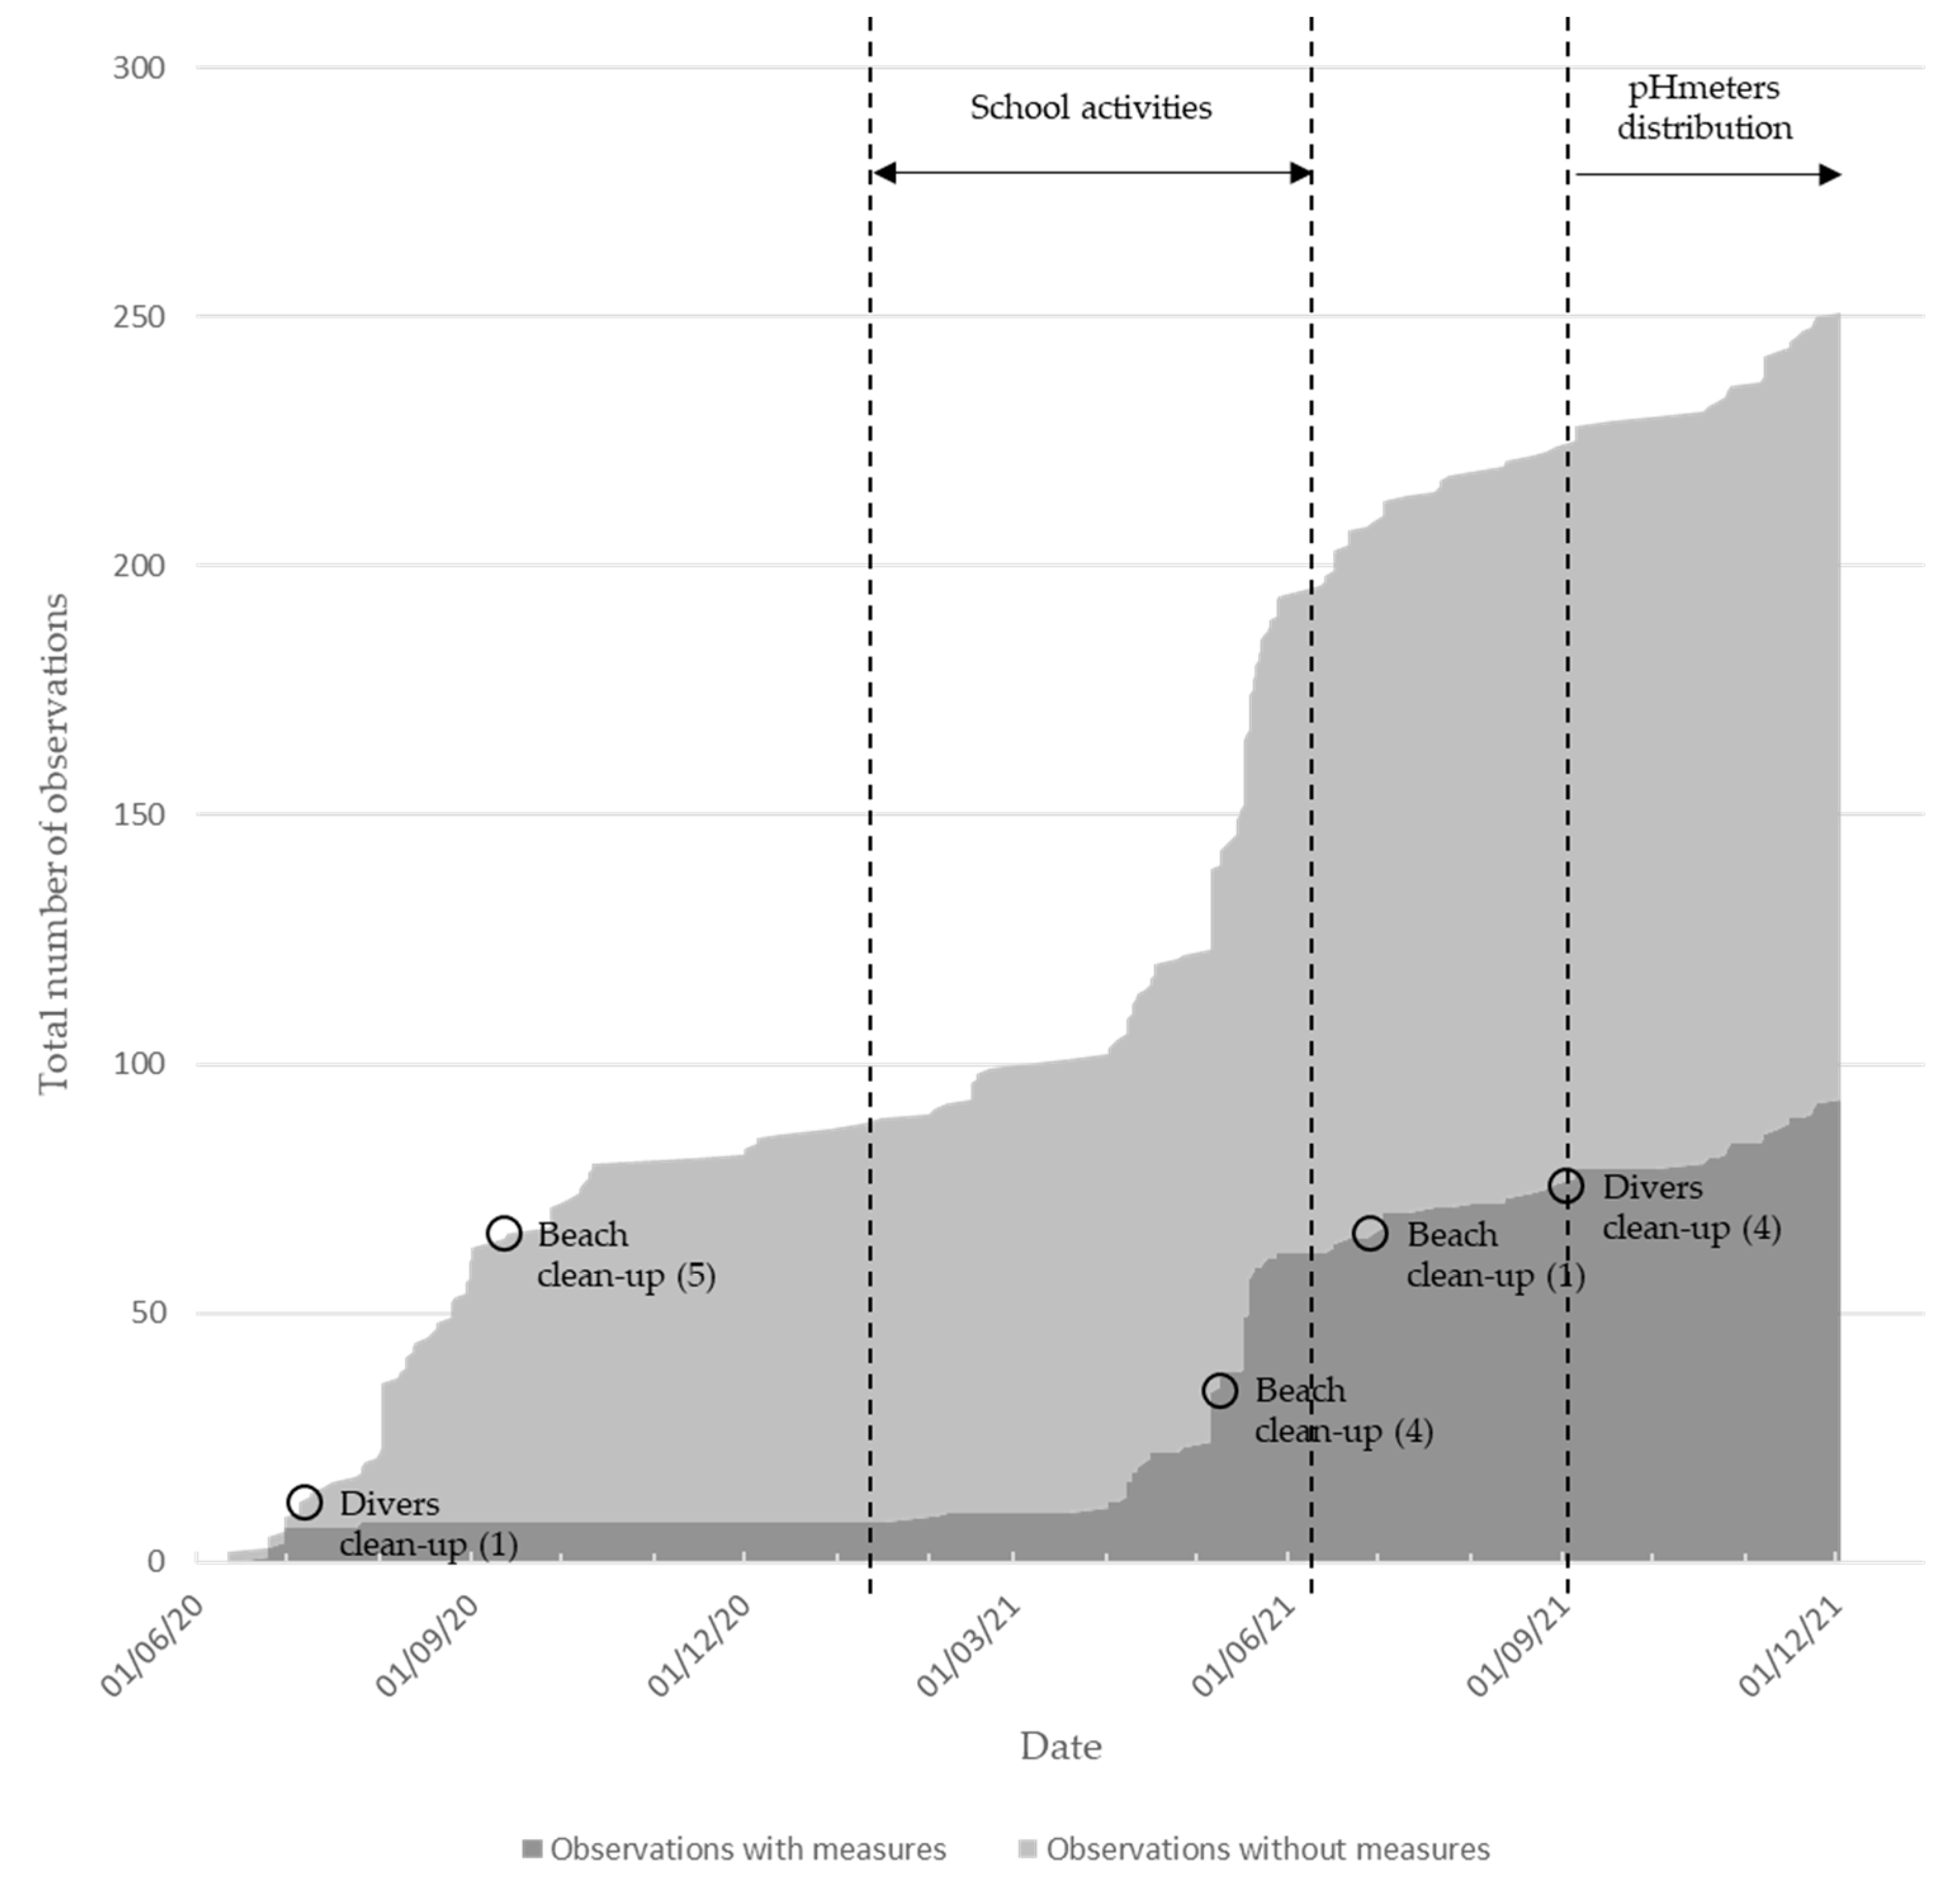
In a period of 543 days, 255 valid observations were gathered.
Figure 2 shows the distribution of the volunteer contributions over the period of interest together with the most relevant facts which could have influenced the data acquisition, such as public events, activities with schools, and the distribution of measurement tools.
It can be observed that in the last two months of the school activities nearly 90 new observations were added, half of them (54%) containing measures of transparency or temperature. It is also evident the difference between the overall contribution in summer, including last spring and first months of autumn, and the rest of the year. Public events create small peaks that are not followed by a visible constant increase.
Table 3 presents the total number of observations that were aggregated by season starting from the App launch to the time of writing the present article. The “measures” column indicates how many parameters were collected while the “details” column counts every observed phenomenon. In both cases, as more than one entry can be included in the same observation, the resulting value can be higher than the total number of observations. From the data, it can be noticed how the number of measures significantly increase after school activities in Spring 2021 and how details decrease in the cold months when lake quality is typically better.
Before looking to local patterns or trends, it must be said that the citizens contributions were unevenly spread between the three lakes and the three regions. If in a certain measure that could be expected due to the proportion between the lakes in terms of surface, the number of municipalities insisting on their perimeter and their population, the comparison with the number of observations that were collected through the App give interesting insights.
Table 4 and
Table 5 show the corresponding percentages to allow an easier comparison between the parameters.
As expected, Lombardy has the highest number of observations as it is the only region involving all three Insubric lakes. Piedmont values are aligned with the proportion of lake surface and are even higher than the population and municipalities share. No observation was collected in the Ticino Canton (
Figure 3).
Low values for the whole Lugano Lake are explained by the proportion of its surface between the Italian and the Swiss side, with the first counting one fifth of the population of the second. In addition, no schools in that area decided to participate to SIMILE activities. For this reason, the following comparisons will involve only Como and Maggiore Lakes, as the data for Lugano Lake are not significant.
3.2. CS Data for the Assessment of Water Quality
A total of 155 potential observations of “undesired phenomena” were reported, corresponding to the 61% of the total. The values tell us that the 82% of “simple observations” have been taken on Como Lake and just 15% on Maggiore Lake. On the opposite, 59% of measures come from Maggiore Lake and 38% from Como Lake. This result is in line with the official report by ARPA [
41] where lakes are classified according to multiple parameters in a synthetic quality evaluation following the Water Framework Directive [
42]. In the last update, covering the period from 2014 to 2019, Maggiore Lake presents a “good” ecological state while Como (and Lugano) are just “sufficient”.
It is interesting to notice how, even if no extreme event was observed, citizens uploaded nearly 150 observations of undesired phenomena. Considering the same period, the number of official warnings that were received is considerably smaller. They are reported here grouped by lake and distinguished among the different phenomena:
Como–9 oil stains (spillage of hydrocarbons), 6 foams, and 2 drains
Lugano–8 foams, 3 algae (all natural phenomena)
Maggiore–3 drains, 2 foams, 2 vegetal debris, 1 oil stain, and 1 algae
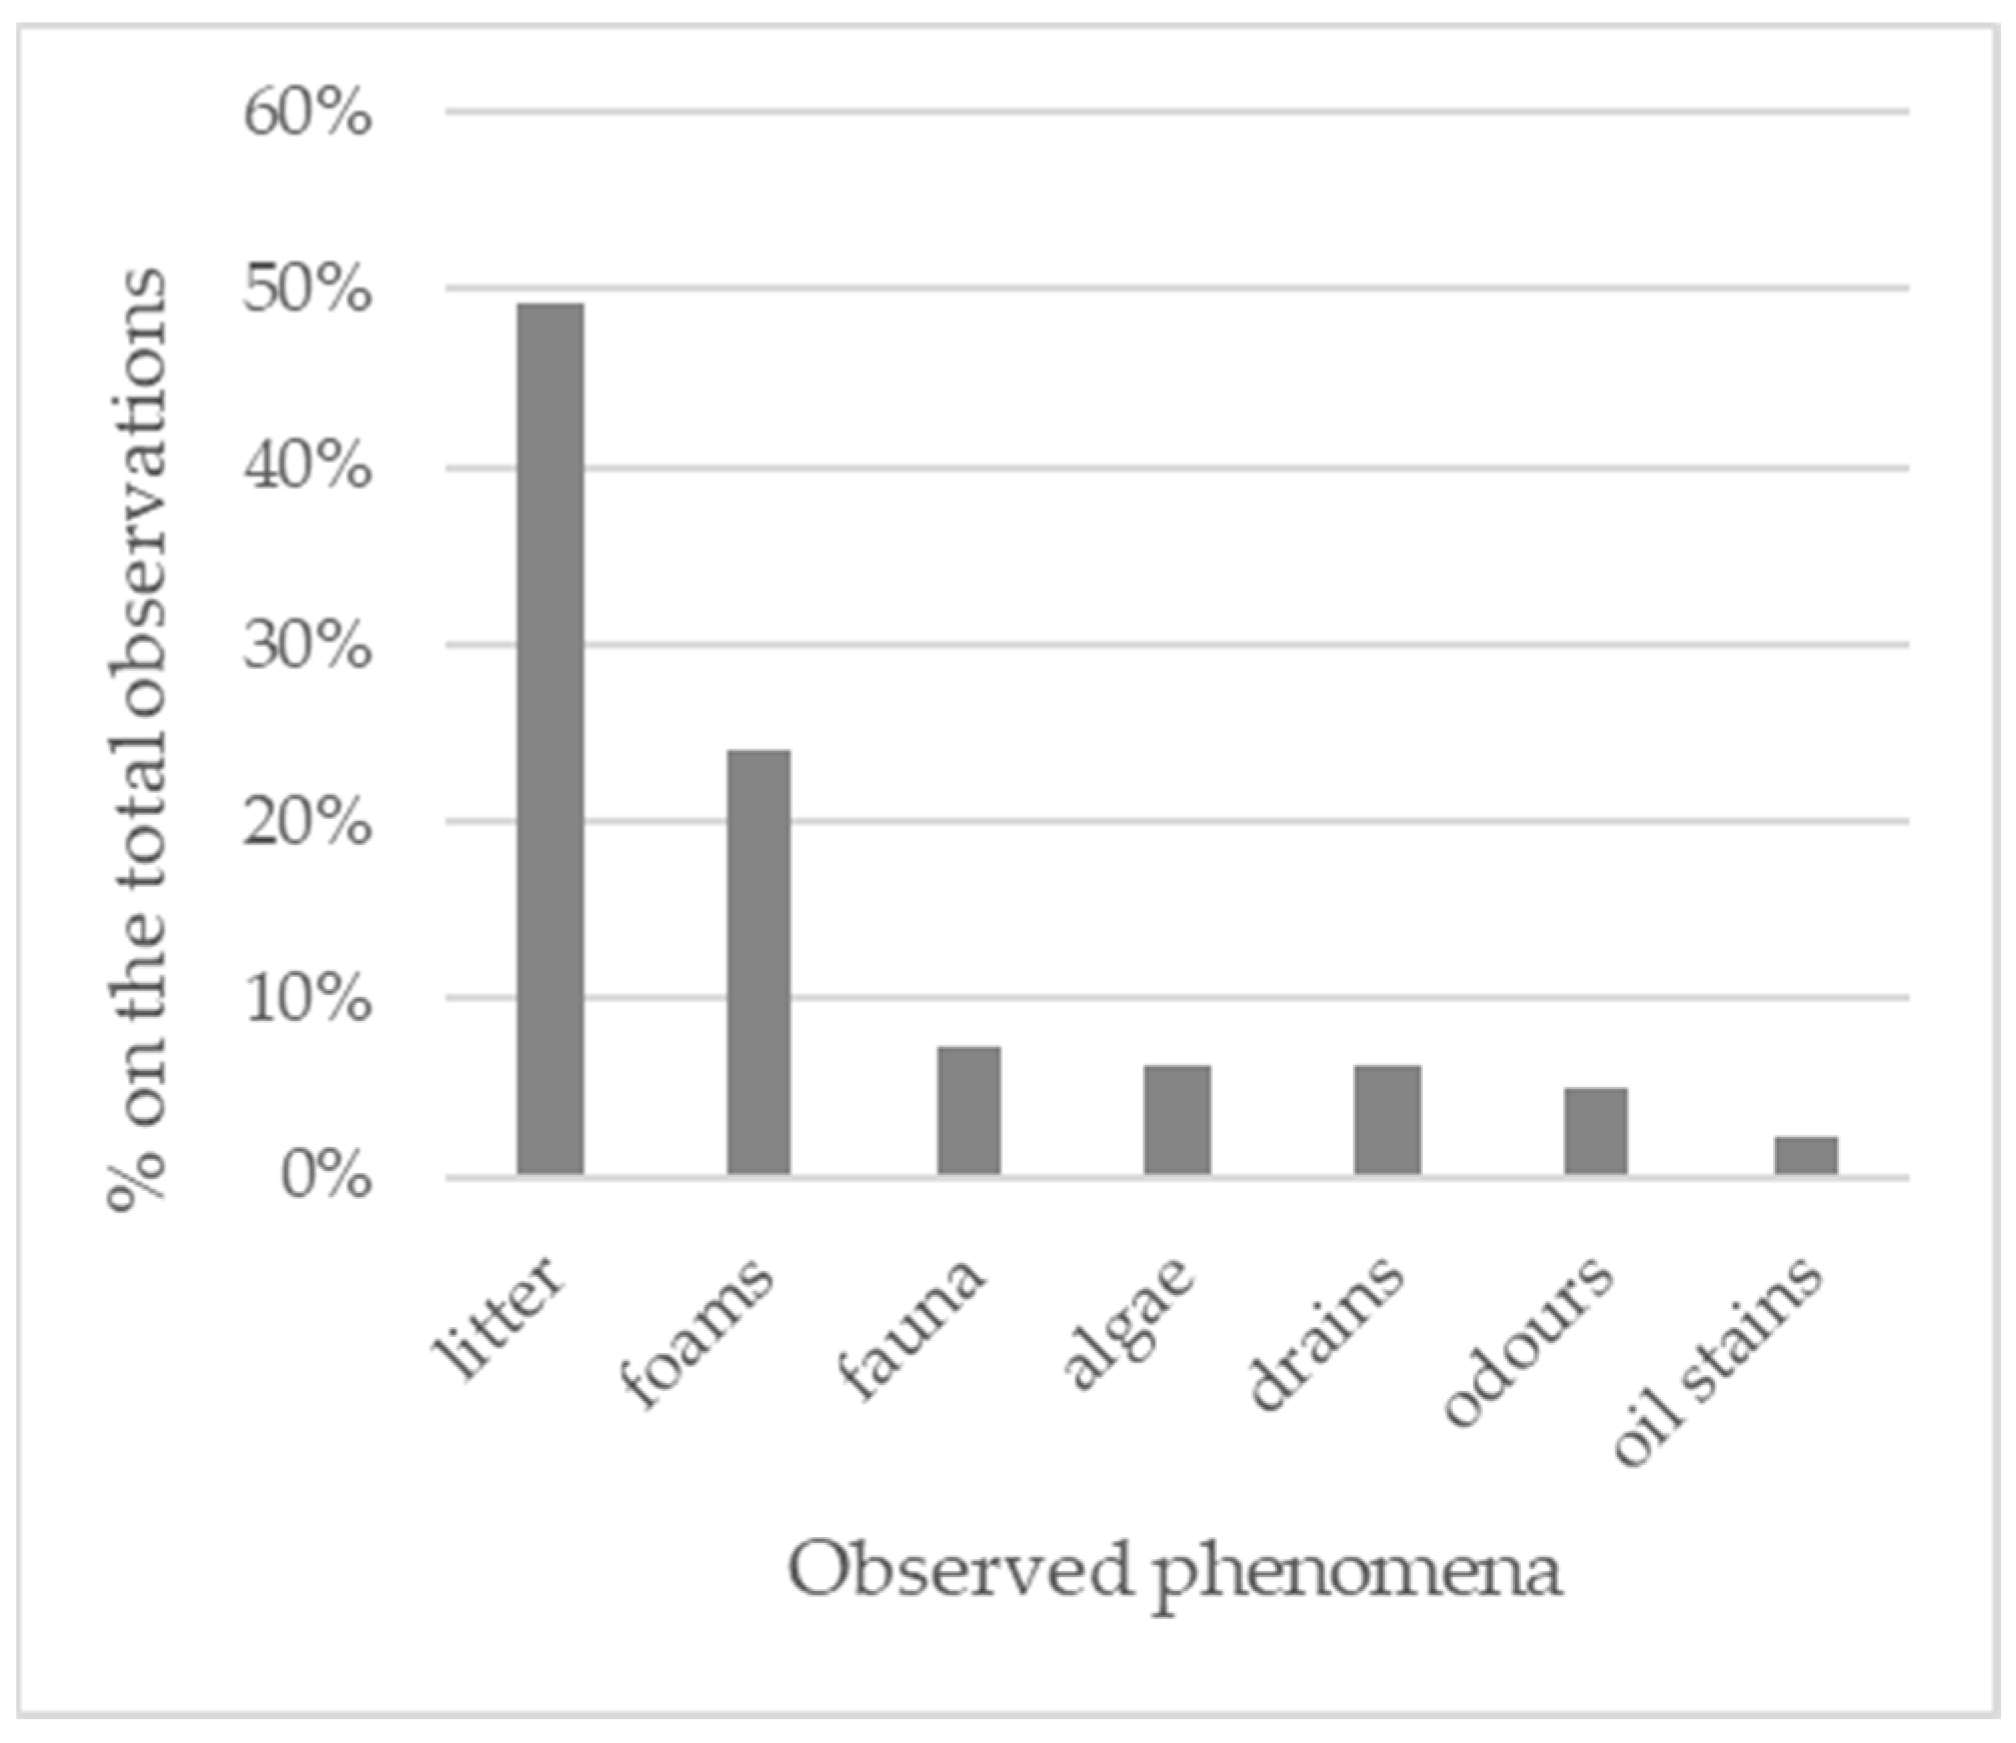
It can be noticed that the presence of litter was not reported, probably due to the impossibility to classify them as environmental emergency. However, as shown in
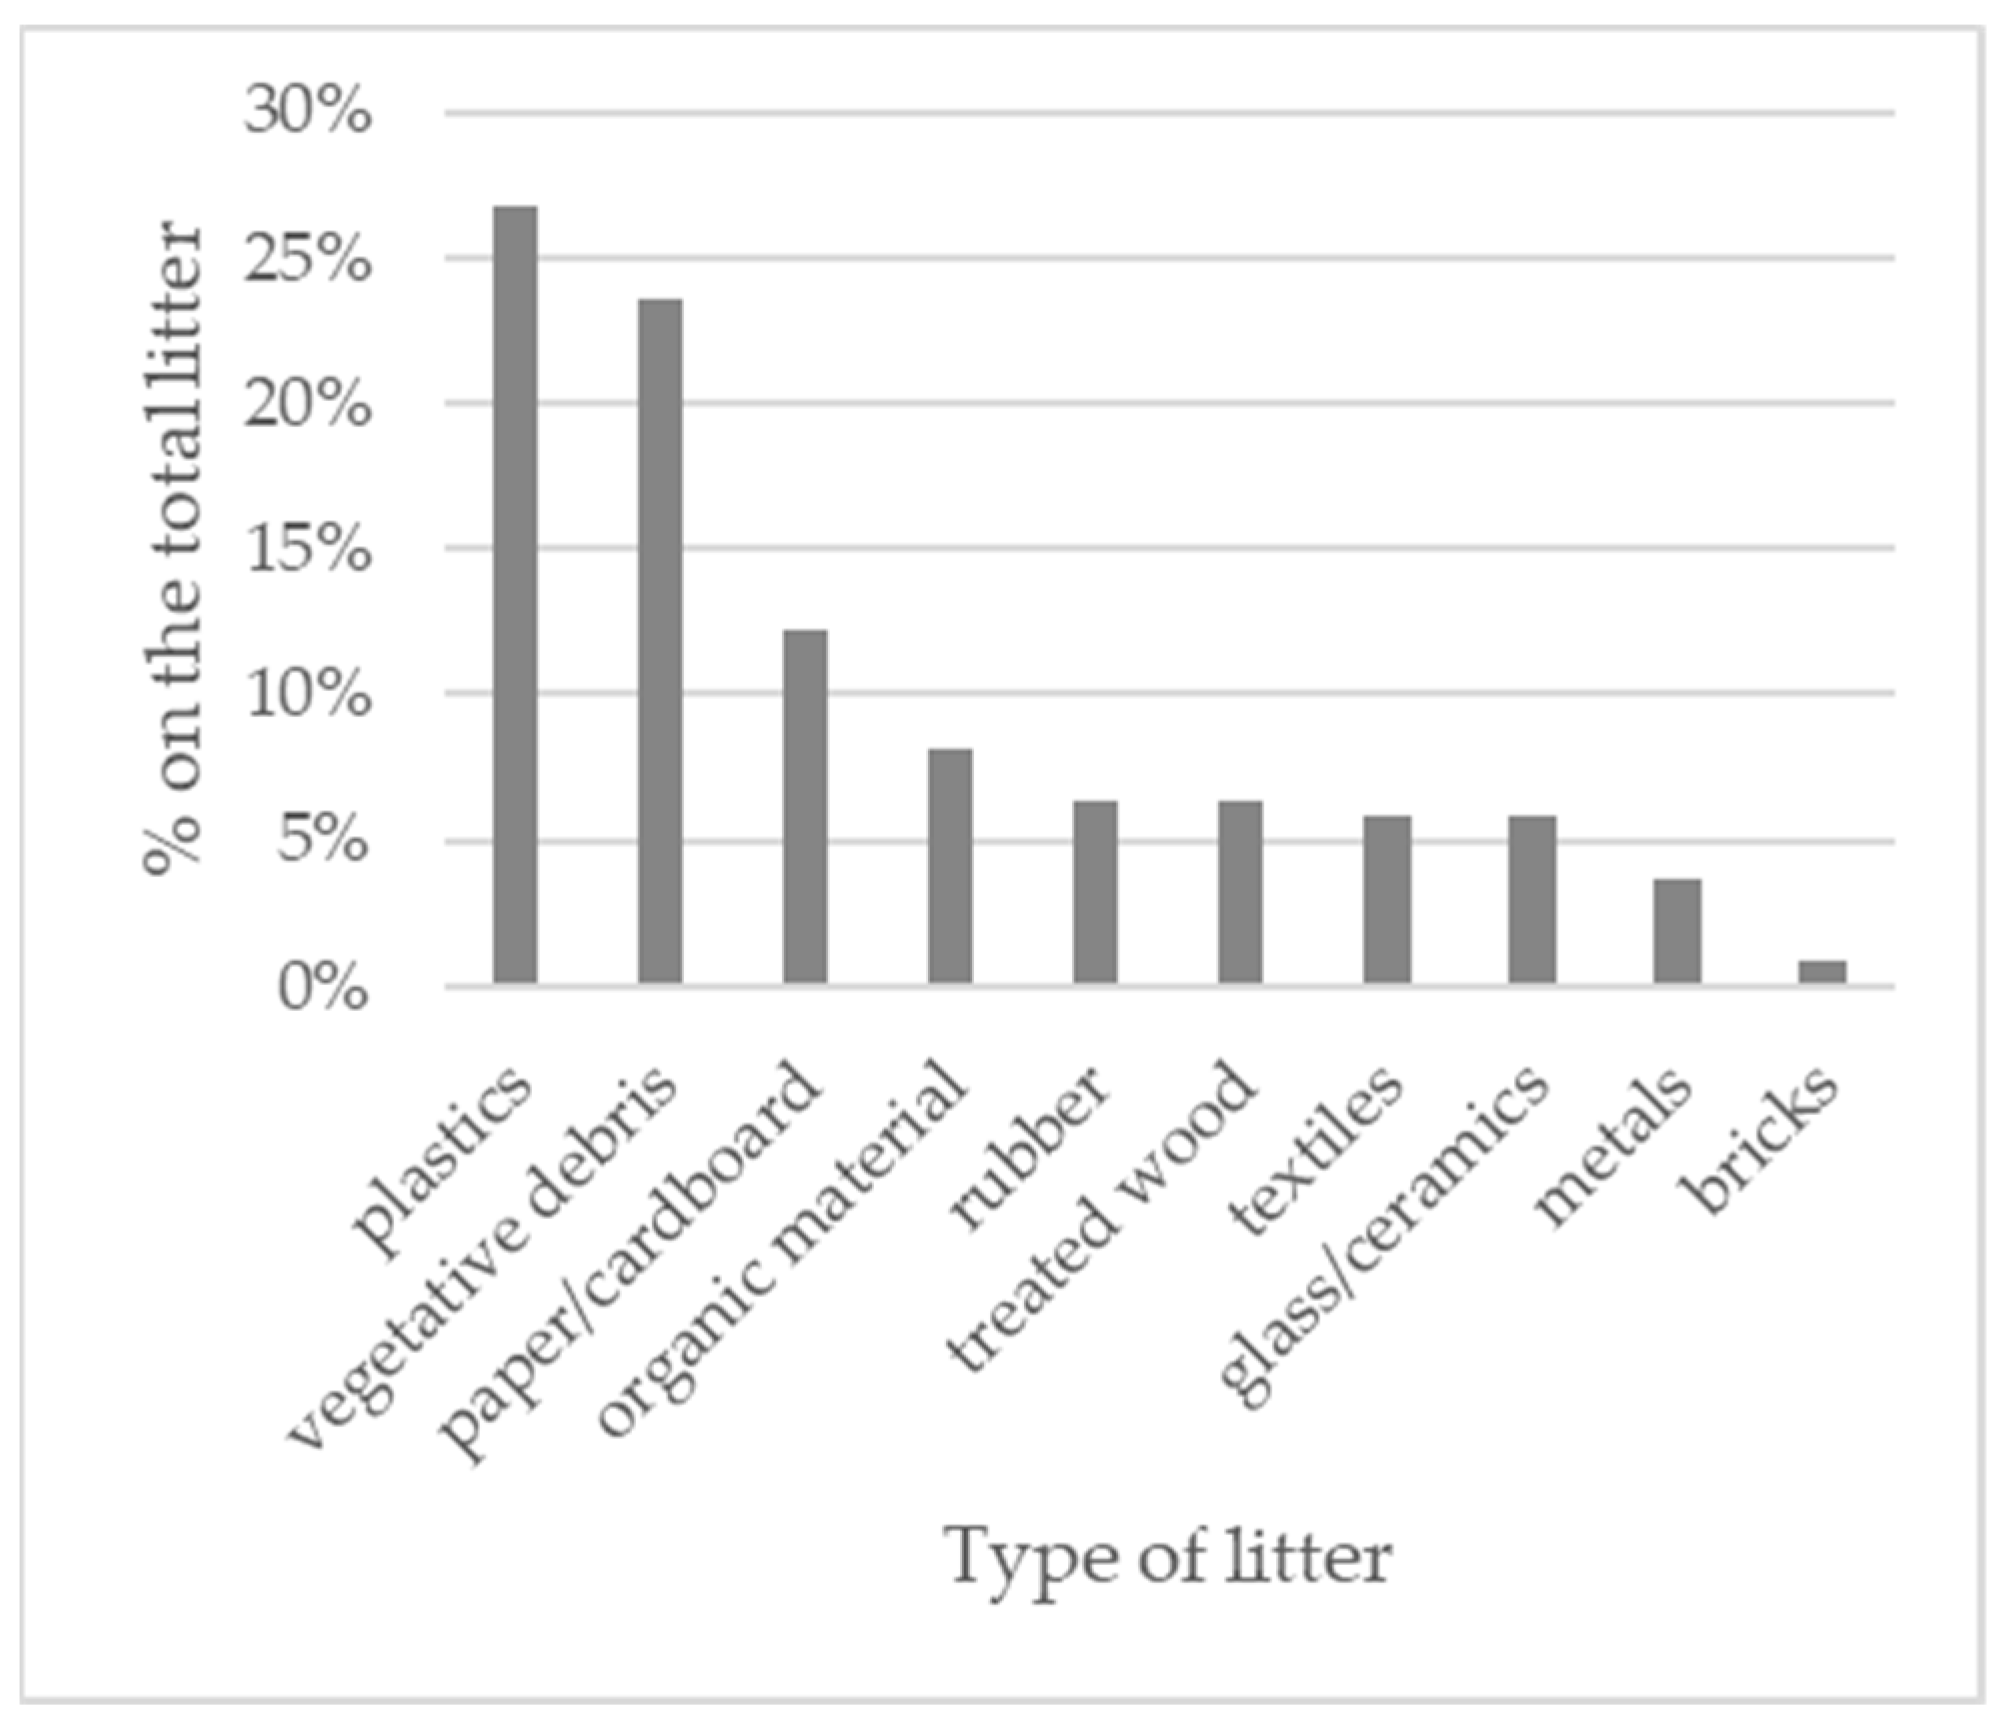
Figure 4, litter deserves particular attention as it represents almost the 50% of the observed phenomena (88 out of 179). Among them, 70 (32%) are vegetative debris or organic material, 29 (13%) including undesired but non-dangerous materials such as paper or bricks, while the remaining 121 (55%) include one or more items that are made of plastic, metal, glass, rubber, textiles, or treated wood.
Figure 5 presents the full detailed content of the observations reporting litter.
The presence of plastics as the most diffused kind of litter is in line with previous studies that highlighted the consistent presence of micro-plastics in the Italian Subalpine Lakes, including Maggiore and Como Lakes [
43,
44]. Regarding the data of
Figure 2, it must be specified that the fauna observations include mostly non-harmful phenomena. In fact, 12 out of 13 observations simply report the presence of birds or fishes and, luckily, only one refers to the presence of an alien species. The “fauna” item was introduced to give the possibility to report undesired phenomena that were related to the animals of the lake ecosystem such as death or suffering specimens, or alien species, referring to the European Union list of invasive alien species [
45].
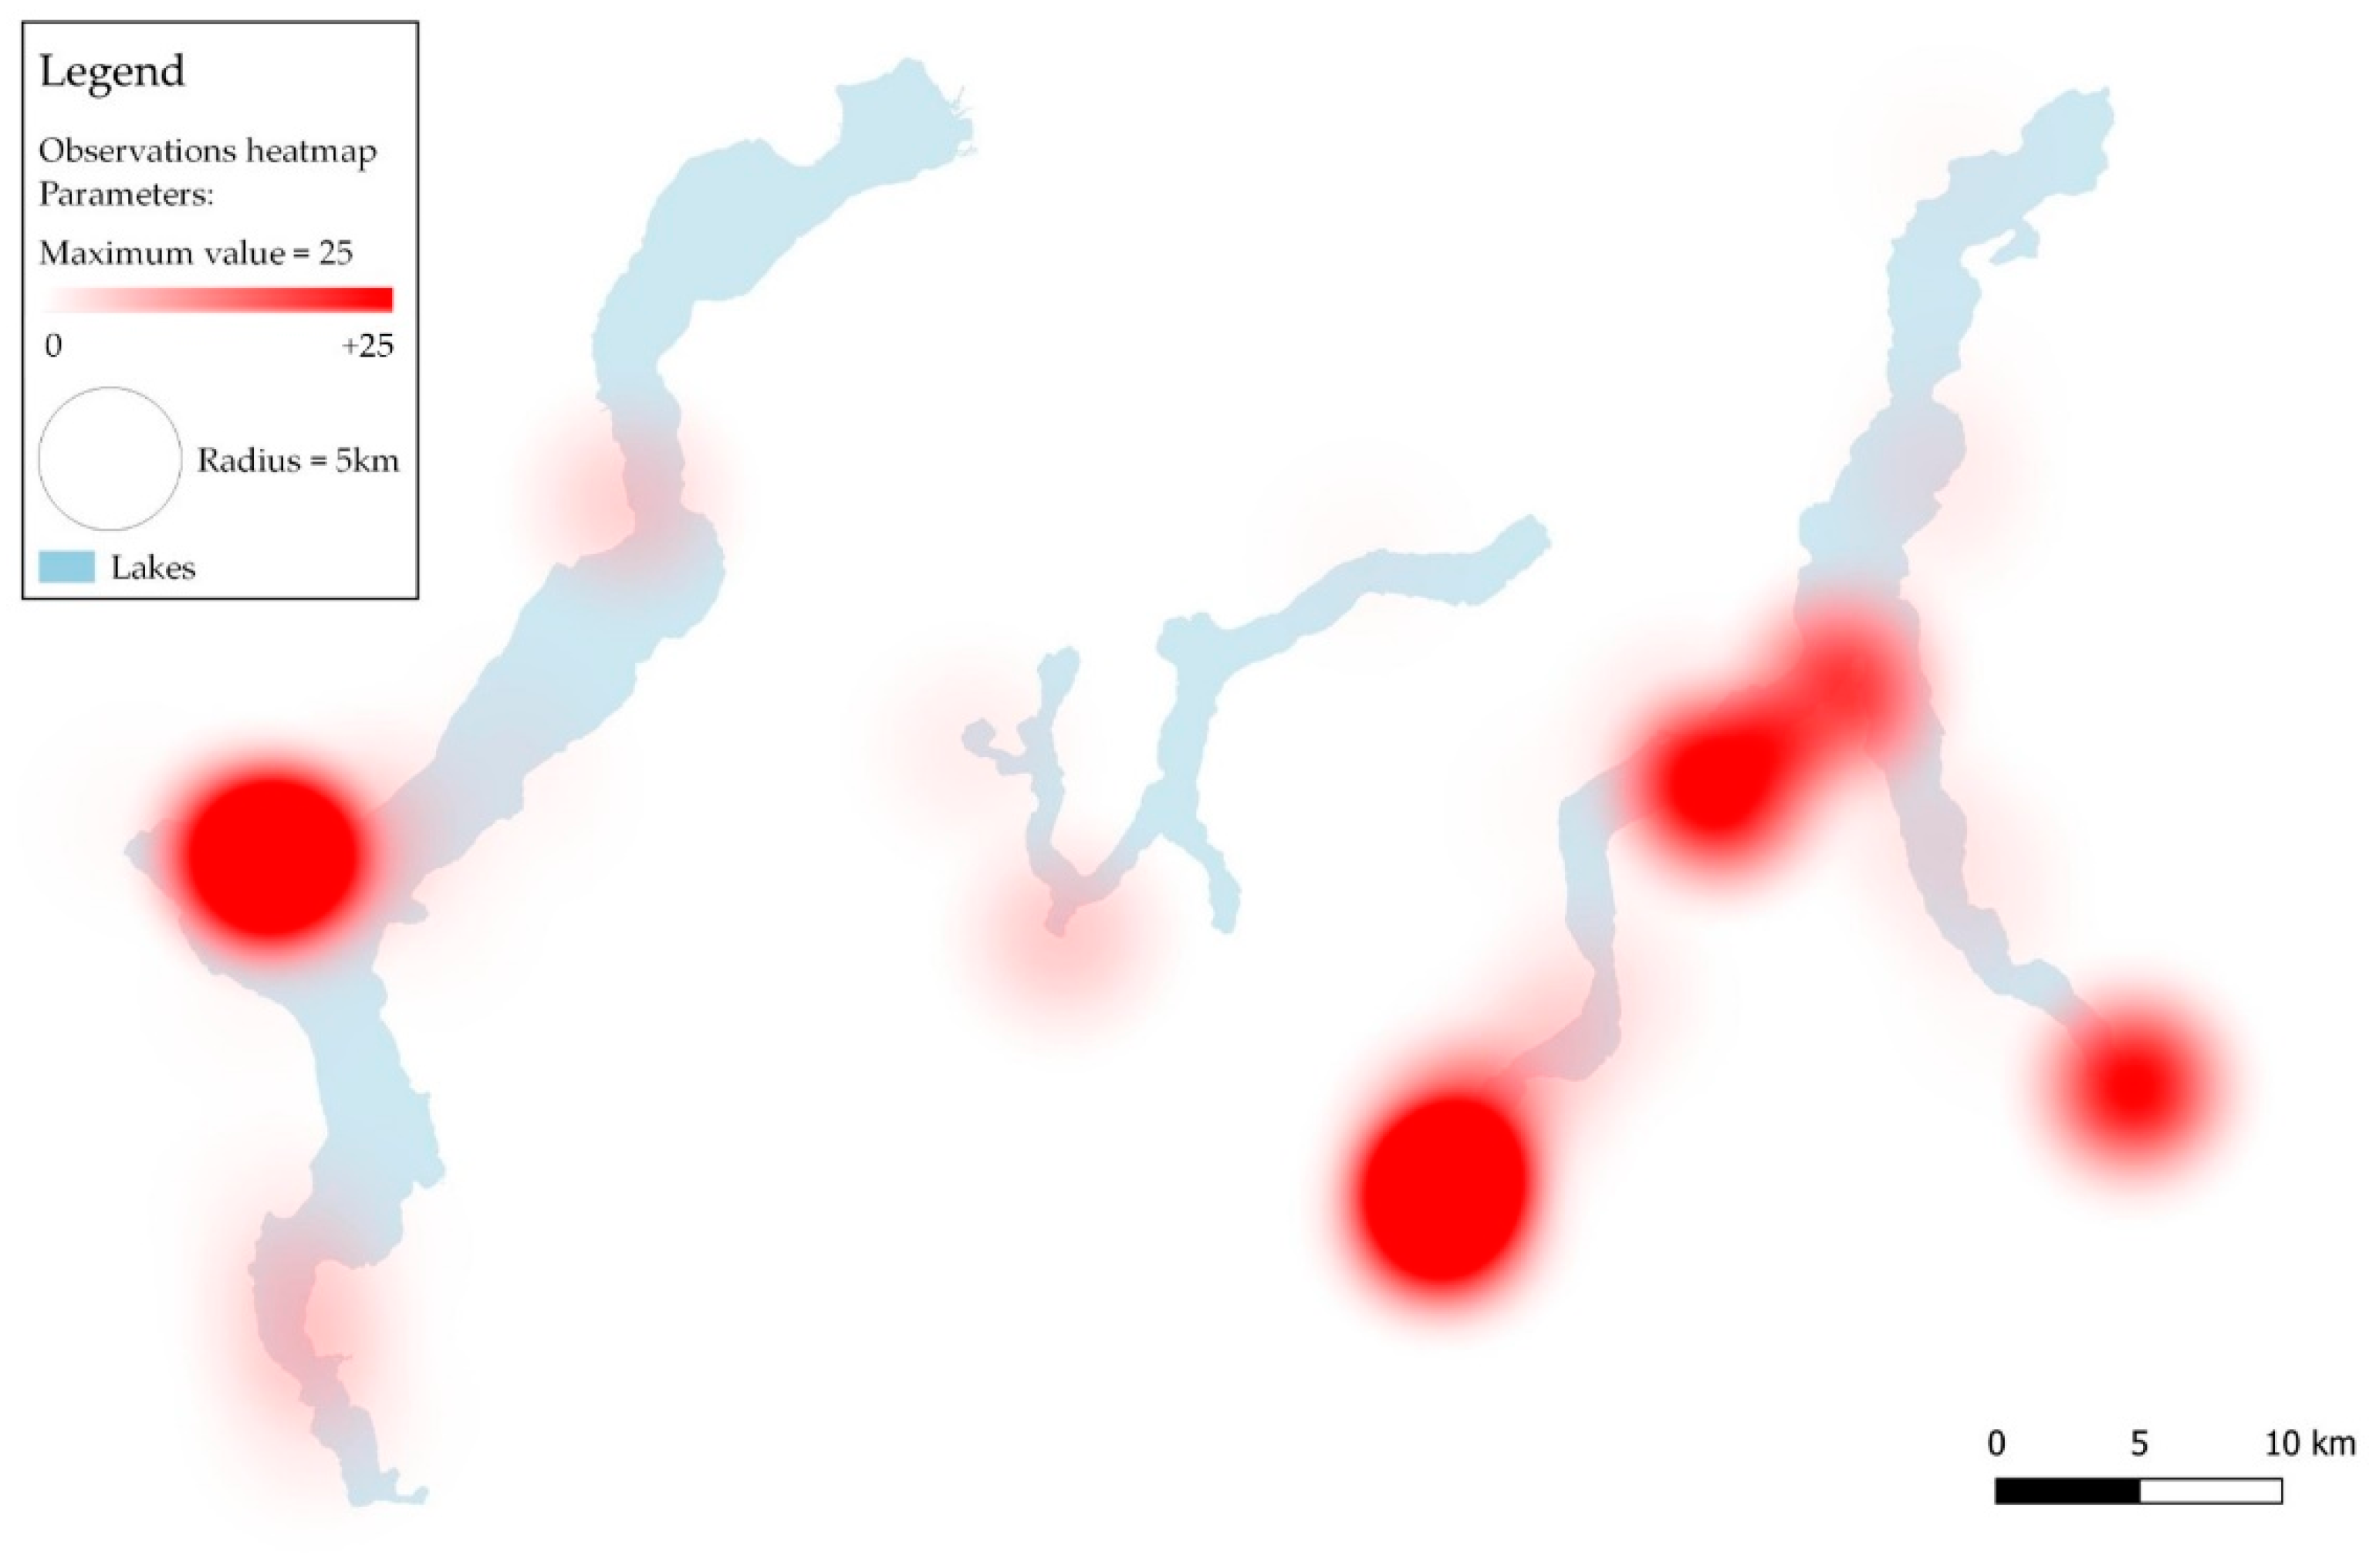
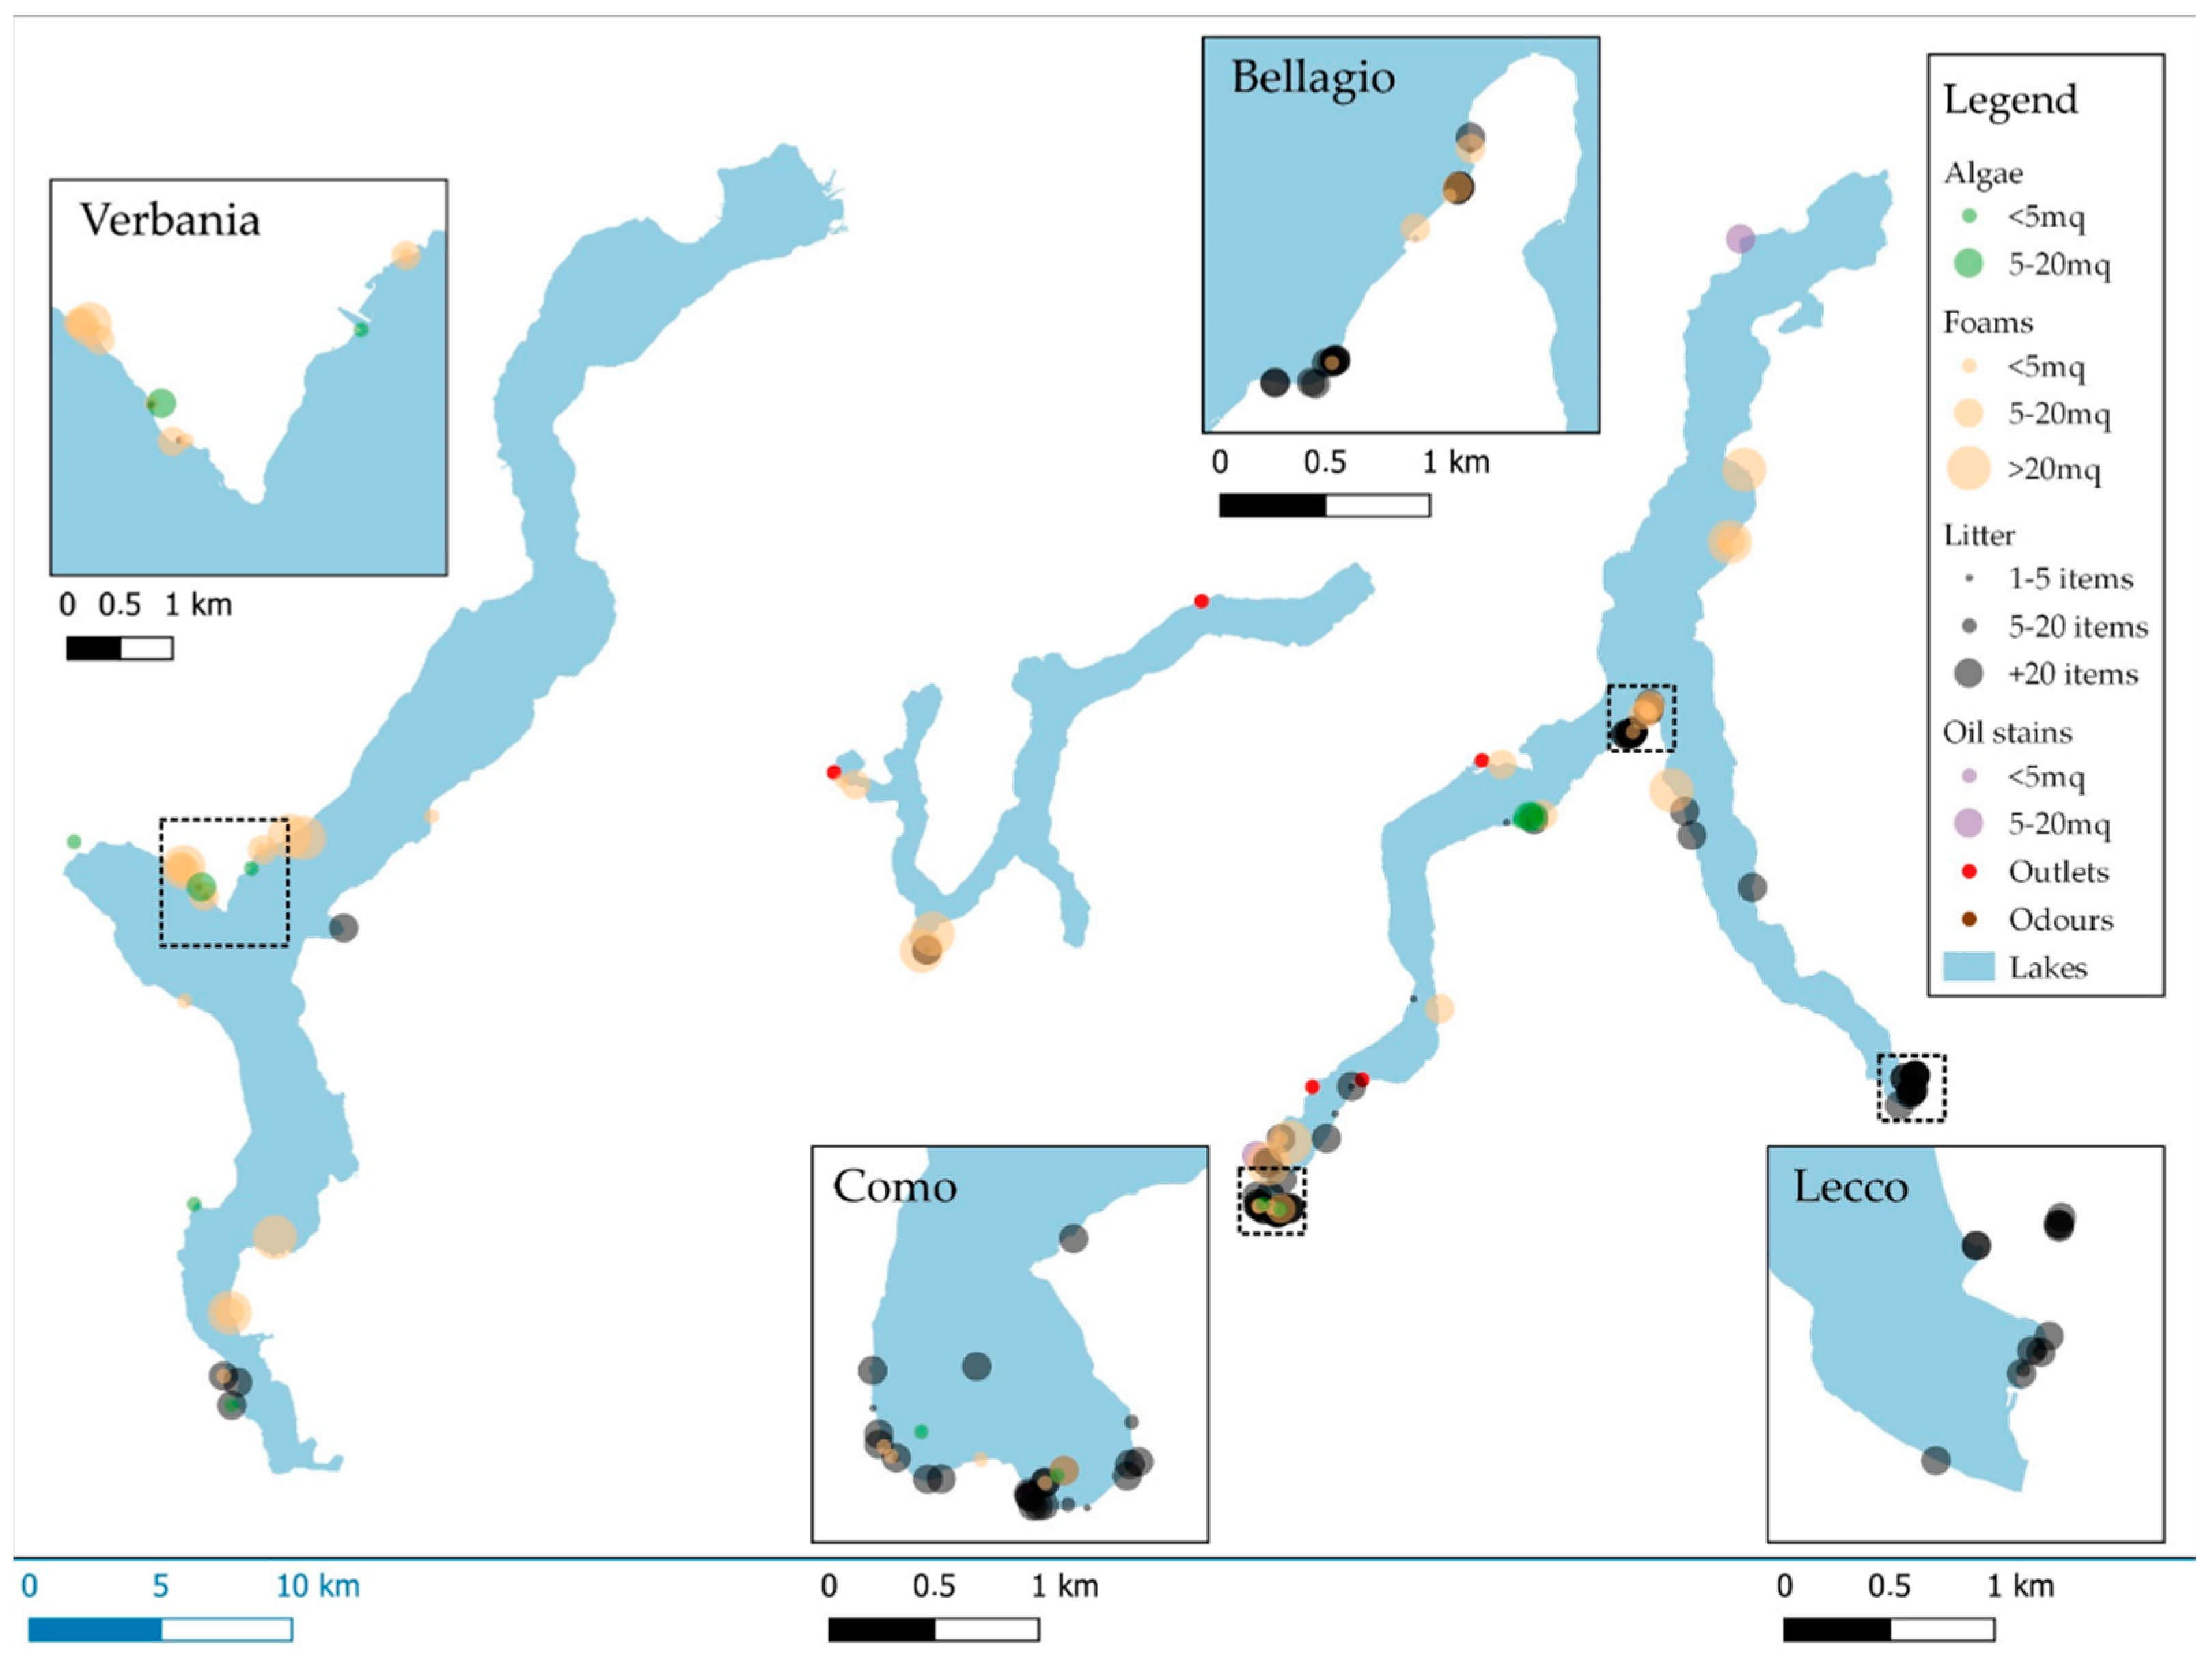
Figure 6 shows a map with the observations displayed in different colors according to their content type and scaled on the intensity of the observed phenomenon. It can be noticed how litter is much more frequent in the Como Lake, particularly in Como’s closed lake branch; foams evenly interest all the three lakes; some active outlets were detected in Como branch of Como Lake and in both parts of Lugano Lake.
3.3. Temperature Data Inter-Comparison
Comparing the distance in time and space between CS measures and the nearest RS pixel value revealed that no observation was perfectly overlapping. With respect to time, only 13 measures can be compared with a satellite image of plus or minus one week and among them, just five fall within a pixel with a valid value (which has not been masked, e.g., because of clouds).
Table 6 presents the CS measures with a corresponding RS value within a distance in time of 7 days and in space of 20 km. RS1 represents the closest correspondence in time.
It is not surprising that values do not match exactly, however, the differences among them are relatively small (1–2 °C) except for two cases in the last two rows. In the first one (07/11/21 11:07:36), a higher CS value can be partially explained by the distance from the shore of the two points, almost null for the CS measure and close to 300 m for the RS data. The second one (27/04/21 13:30:00) was taken with a non-professional tool. Between the RS and CS data, the average temperature difference was −0.52 °C and the standard deviation 2.44 °C. Excluding the last two measures, the average temperature difference becomes −0.44 °C and the standard deviation 1.39 °C.
Looking ant HFM data, there is the advantage of having measures taken almost at the same time, with differences in the order of 30 s and so neglectable. However, as there are a very limited number of buoys, the distance among them significantly increases. The remaining 27 measures are all located in Maggiore Lake, except for three, located in Como Lake. As the two buoys mount the same sensors and no particular trend emerged, the results are presented together.
Table 7 shows the corresponding values of temperature that were acquired with CS and HFM, their difference, and additional information on the CS measure as the distance from the buoy and from the shore, date and time, and the type of instrument used (professional or not).
Overall, there are 15 measures within 1 km from the buoy and just 3 within 100 m on a total of 27. The only two measures that are supposed to match (line 1 and 4) are those that were taken exactly nearby the buoy by CNR technicians during buoy’s maintenance operations. In fact, they have a very limited difference (0.01 °C and 0.32 °C). About the other values, neither the distance from the buoy, that from the shore nor the use of professional or amateur measurement tools show a clear correlation with the difference between CS and HFM temperature values (or its absolute value). Between HFM and CS data, the average temperature difference was 1.08 °C and the standard deviation 2.12 °C. Limiting the analysis to the observations within 1 km from the buoy, the values are similar, 1.12 °C for the average and 2.15 °C for the standard deviation.
3.4. Lake Water Quality Awareness through CS Activities
Thanks to the activity “Dal Rifiuto al Contributo” 145 lake observations, of which 94 including a measure, were gathered, equally distributed between Maggiore and Como Lake. Surveys were used to assess both the degree of satisfaction of the students and the skills before and after the activities using Google forms. The results of the incoming skills survey showed a good awareness on the words “monitoring” (93%), “ecosystem” (77%), and “remote sensing” (81%) while only the 16% had heard about “Citizen Science”. At the end of the activity, 97.2% of the students were “very satisfied”, 1.4% were “satisfied”, and only 1.4% were “not satisfied”. In the open answers they listed many key learnings that were achieved through this experience, namely: “lake is a precious asset and should not be polluted”; “how the transparency of lakes is measured”; how “to use a Secchi disk and the App”; “lake is not just water to be exploited as you wish, but a resource not to be wasted”; “every citizen can contribute”; “our waters are an important resource that we owe to maintain”; “lake is very important for the life of every living being”; “the monitoring of lakes”; and “new information of our planet”. In addition, the percentage of students that were aware of the meaning of CS increased by 41%, the percentage of those that were aware of eutrophication increased by 24%, and 90% of the students at the end of the activity, were able to measure water transparency and to share it through the App.
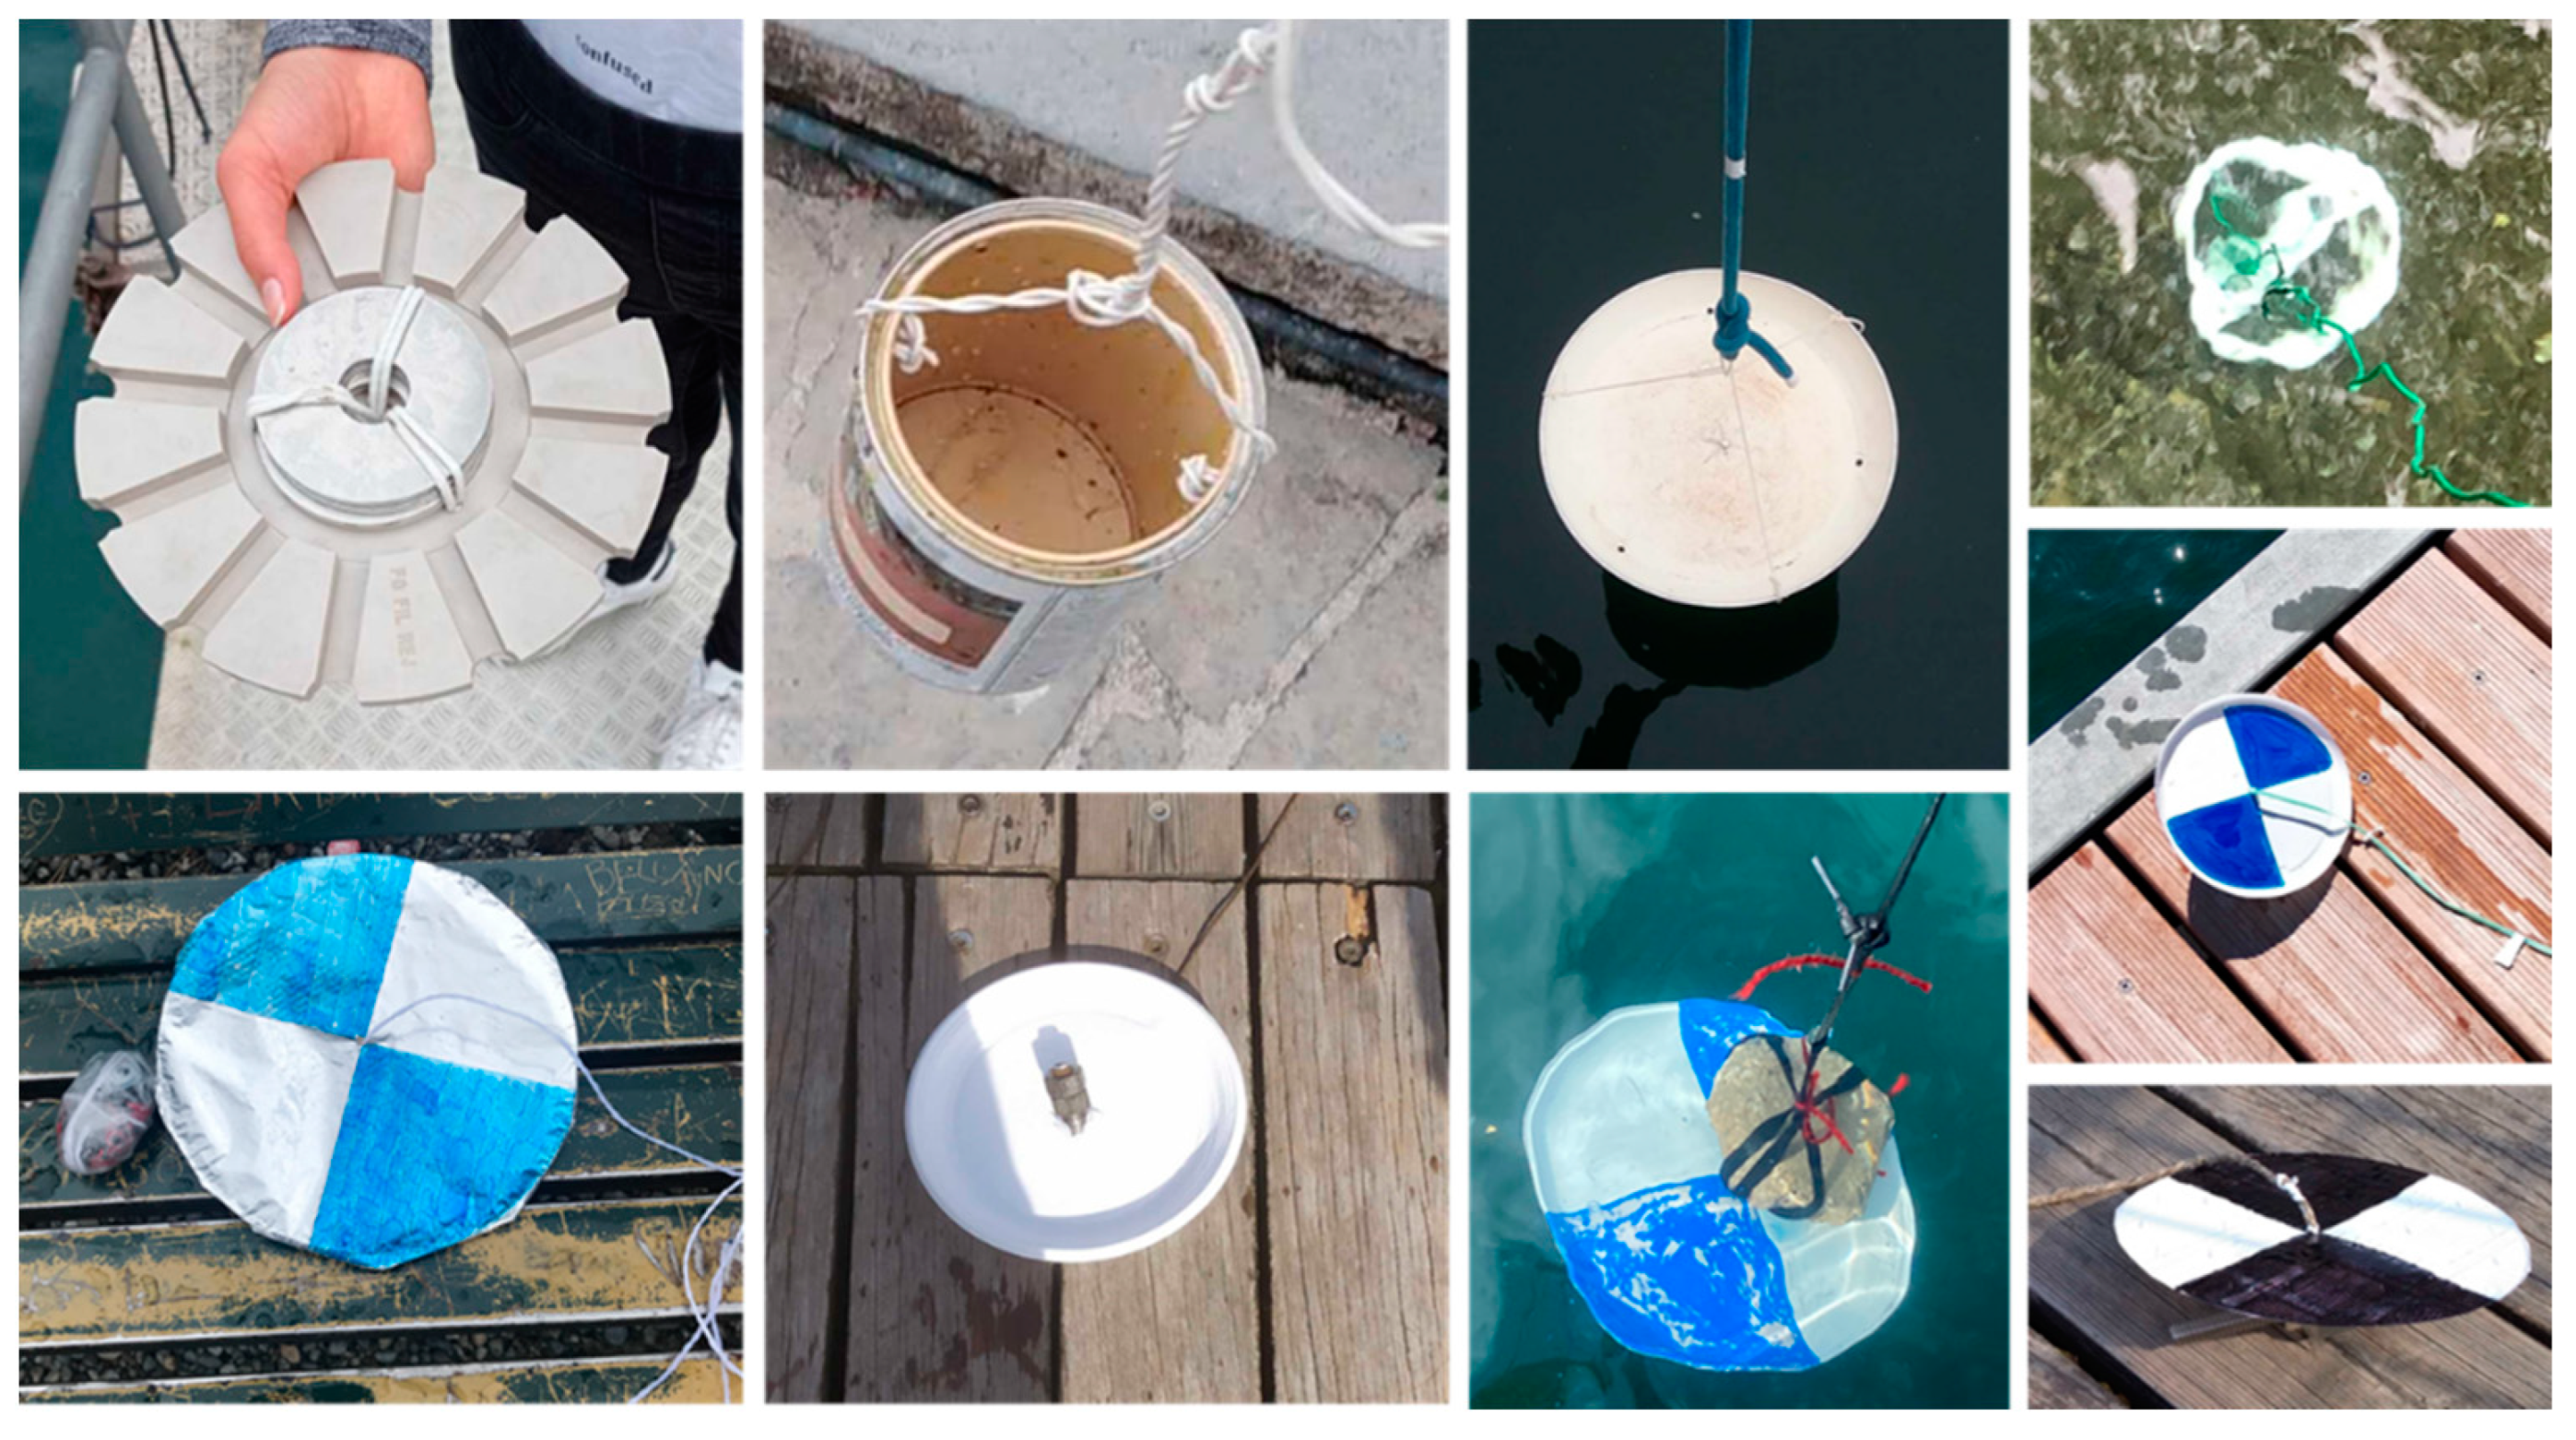
Figure 7 shows a collage of pictures of some of the handmade Secchi disks that were built by students from waste materials.
This activity involved students handcraft abilities in a period when most of the regular activities were suspended or performed online and allowed to reason with them on how different characteristics of the disks positively or negatively affected the final measure. In addition, the measures that were taken by the students were discussed in the classroom together with their professors explaining their possible variation with respect to changes of meteorological conditions, hour of the day, and survey point.
For the school year 2021–2022 the activities have been scheduled and the majority of meetings already took place. Thanks to a lowering of the Covid-19 impact and to the positive experience of the first year, the number of involved classes rose from 11 to 23 and the number of schools from 5 to 9. In the second year, 14 classes opted for the “Dal rifiuto al contributo” activity while with other 10 customized learning paths were developed to exploit the specific competences of the different typologies of schools. For example, students in computer science started the development of desktop and mobile applications that were based on SIMILE data (CS, HFM, RS), students in chemistry were performing microbiological analyses (Chl-a, TSM, Oxygen) and sharing the results on the SIMILE platform, and other two classes were learning how to handle satellite images and CS data in QGIS. Finally, a school received funding through the “Digitarsi” call of Cariplo Foundation for a project called SIMILE-off, developed with the support of the authors, that included capacity building for teachers on GIS. The classes that were involved were provided with pH-meter and thermometer to increase and standardize the quality of measures encouraging a wider and more regular participation.
By simply counting the number of observations within a certain distance from the involved schools, it is possible to notice that 141 out of 251 (56%) fall within a radius of 5 km, and 67 (27%) within a 1 km radius. Applying the same simple criteria to associations the numbers are significantly lower: 94 (37%) in 5 km and 11 (4%) in 1 km.
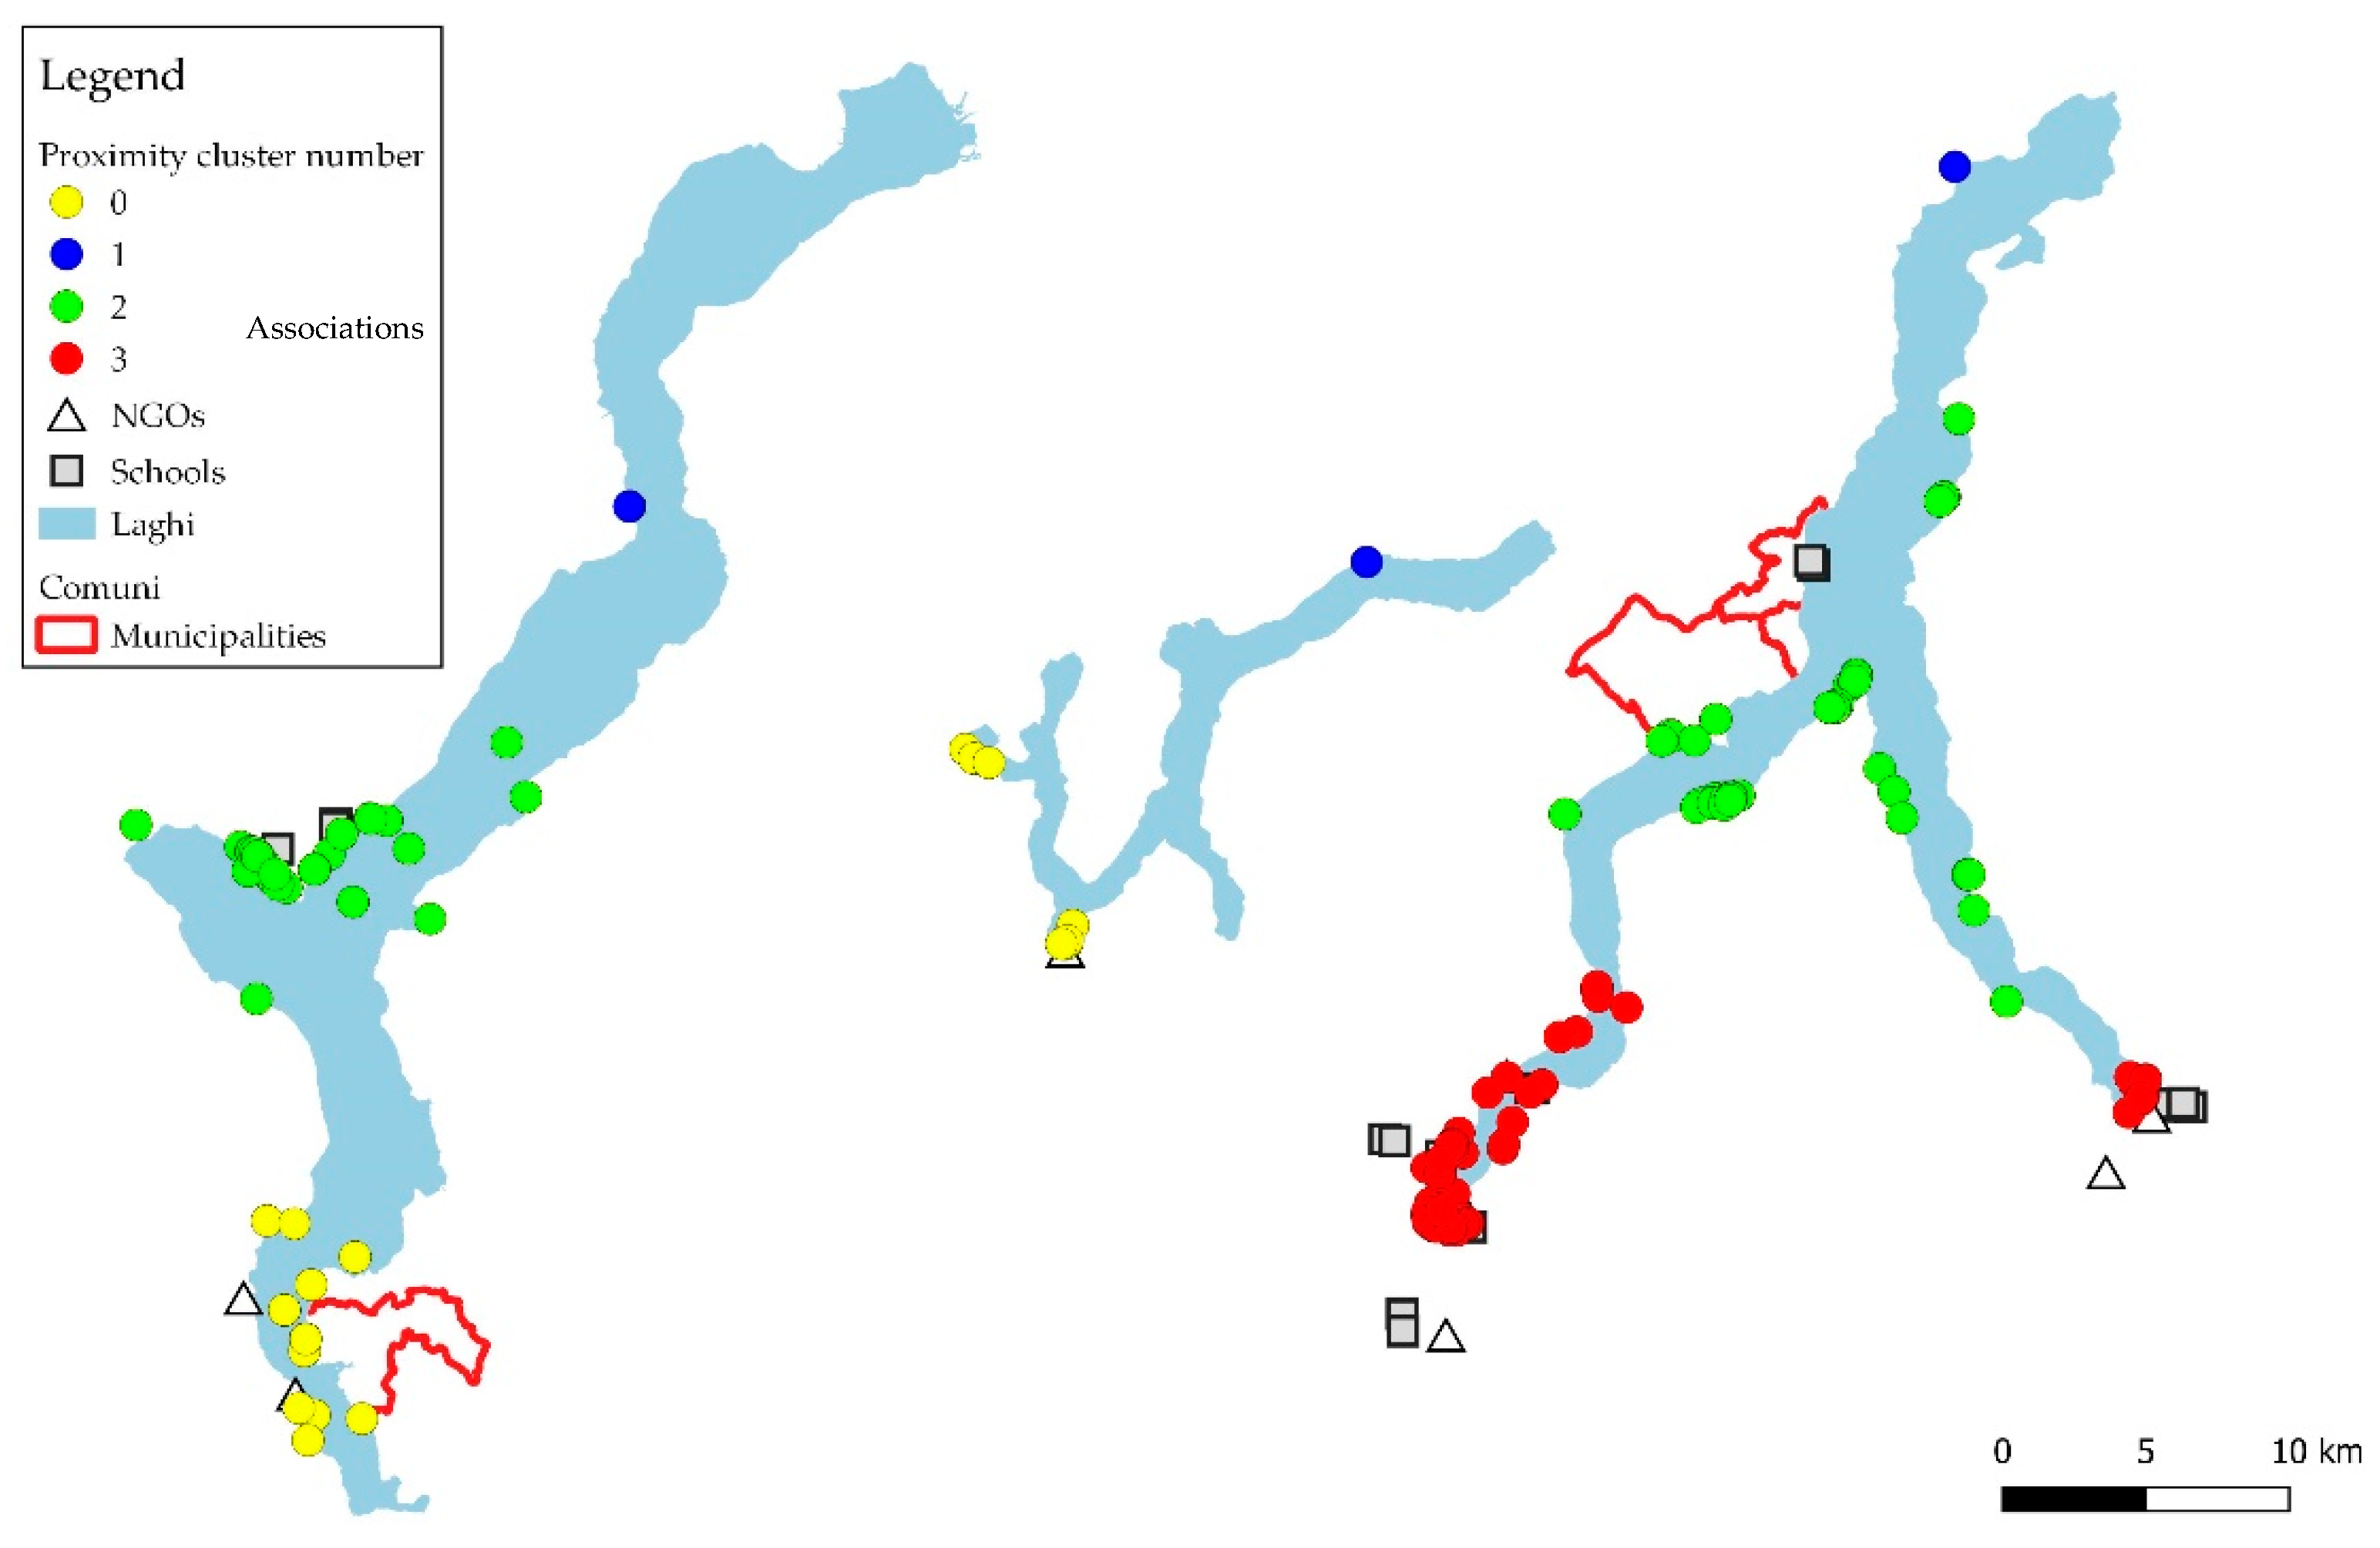
To better investigate this aspect a proximity analysis was conducted with the purpose of explaining observations in relationship to their linear distance to three kinds of hubs: schools, associations, and municipalities. For doing so, the QGIS Hierarchical Clustering plug-in [
29] to determine the most suitable number of clusters to use and then divide the observations accordingly. The cross comparison of the dendrogram and the WSS BSS diagrams suggested a division in four clusters.
Figure 8 shows a map with the observations divided in the four clusters and the position of schools, associations, and municipalities.
The blue dots (cluster 1, 9 points) represent outliers as they are far from every possible hub. The yellow dots (cluster 0, 25 points) have only associations nearby in the case of Lugano Lake and a single municipality in the southern part of Maggiore Lake. Green dots (cluster 2, 123 points) can be found in areas with active schools and no associations both in Maggiore and Como Lake. Finally, red dots (cluster 3, 94 points) are in those places with both Schools and associations that were actively participating. It emerges that municipalities are not a relevant factor, also due to their limited number, for justifying the presence of observations. The relevance of schools is confirmed. In fact, merging cluster 2 and 3, where proximity to schools is considered, 217 observations (85%) can be explained. It must be said that only those municipalities that activated initiatives for promoting the App were included in this analysis.
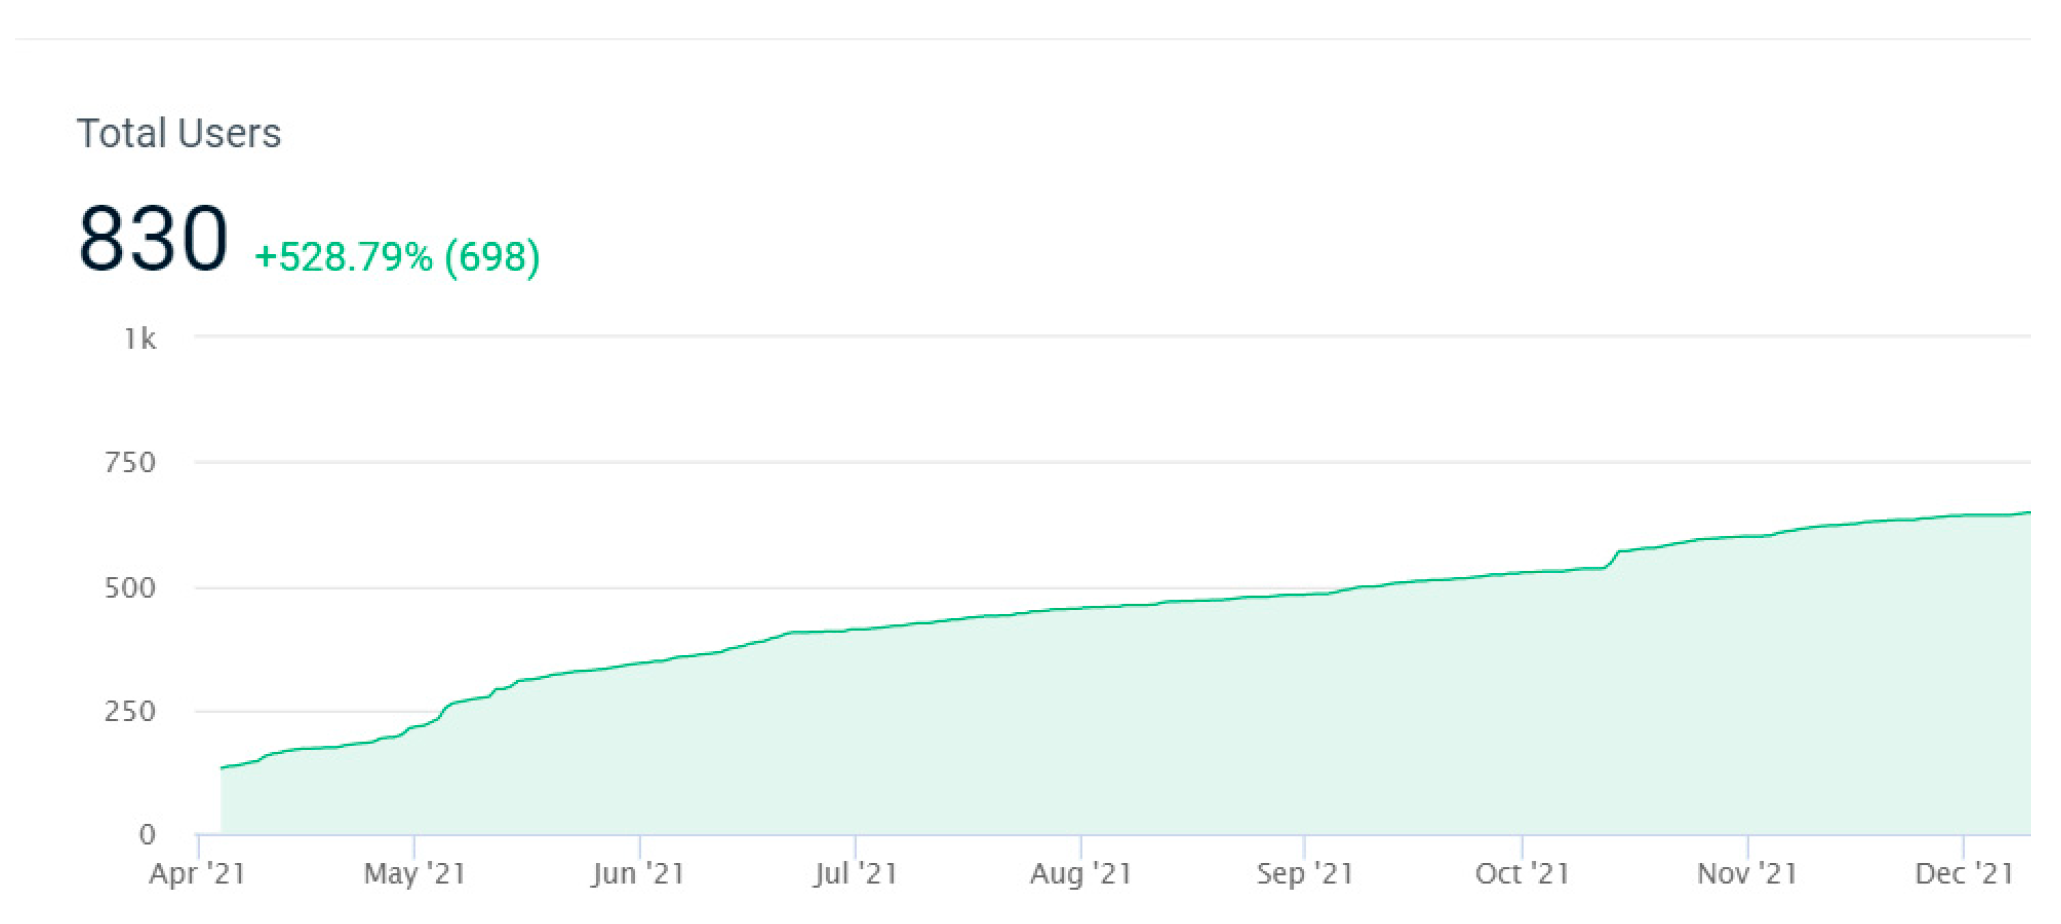
The last way of assessing the impact of the CS activity is considering the diffusion of the App. Looking at the graph of the App users (including only the registered ones), a regular growth can be noticed over the last 8 months, passing from 132 to 692, with an average of nearly 150 monthly active users (
Figure 9). This result tells us that there are many inactive users that never upload any content yet but still have access to the knowledge that is available in the App.
4. Discussion
Looking at the temporal distribution of the contributions, the limited numbers of the cold months can be explained by considering the better visual lake quality with respect to periods when the lakes are more productive, and by the fact that the conditions for people spending time outdoors are worse, both for time availability because of work and for climatic reasons. From the spatial point of view, observations are mostly concentrated in the most populated urban centers. This happens on one side because anthropic activity negatively affects water quality, as demonstrated by the predominance of litter among the observations (
Figure 4), and on the other, for the higher absolute number of citizens that were involved, not necessarily belonging to an association.
The absence of observations on the Swiss side is surely not a positive result in absolute terms for the project goals, but it stresses the importance of CS supporting activities and communication. In fact, this can be explained by the fact that because of limitations related to the COVID-19 pandemic complicating transboundary mobility, it was decided to not organize specific activities in support to CS (schools, associations, and municipalities) in Switzerland in the first years of the project. The limited impact of the events tells us that occasionally involved citizens hardly become regular contributors without a dedicated long-term goal, program, or activity. However, they allowed to reach a high number of people even just to inform them about the existence of the App.
Regarding water quality, looking at
Table 5 and
Figure 6 it is immediately clear the difference between Como and Maggiore Lakes. This result tells us that even looking only at the CS data, we can have an understanding about the state of a lake that is in accordance with the official environmental reports. Even if the data that were included in this study are limited, this could represent a cost-effective opportunity for context without high-quality and regular water monitoring protocols.
Even if perceived as negative by most of the citizens, many of the observed phenomena are natural. Communicating water quality is a crucial and tough task for Environmental Agencies as the topic is often improperly used for political attacks. For this reason, having a tool such as the App provides two main benefits. The first, is putting in the hands of citizens a user-friendly guide for knowing the lake and its ecosystem, reducing the knowledge gap between them and authorities. The second, is having the possibility of sending geo-referenced messages to provide feedback on potentially alarming phenomena, showing care, competence, and proactivity.
The results of the match between HFM, RS, and CS on temperature clearly show that CS data are comparable with the other monitoring tools and can be a useful complementary source. As CS data cover a larger area with respect to the buoys providing qualitative measures of phenomena that are measurable with specific quantitative parameters of the HFM, they can be considered for supporting the strategic planning of new buoys location or temporary campaigns of the existing ones.
Proximity analysis and the simpler spatial statistics revealed the crucial role that is played by the schools. The main reasons for this success, with respect to events and presentation, are probably related to motivation, training, and time availability. CS activities were carried out during school hours, requiring a limited extra-effort, and as an educational goal for civics, sometimes subject to evaluation. In addition, the time dedicated to project presentation and training was up to four times longer than those usually granted for other presentations.
Following the same structure that was used in
Section 1.1, it will be now presented how CS has or may positively affect, directly or indirectly, a subset of SDG 6 indicators.
Indicator 6.3.1 (proportion of domestic and industrial wastewater flows safely treated) can benefit from the presence of multiple citizens’ eyes on the lake to detect suspicious elements to be verified by environmental agencies. This already happened thanks to a set of observations of an active drain in consecutive days. Passing from the observation to the following actions is not immediate, but detecting the problem is already an important step that usually requires significant costs by the institutions.
The lake part of Indicator 6.3.2 (proportion of bodies of water with good ambient water quality) can benefit from CS tools and activities mainly in two ways. On the one side, CS activities aim to increase awareness and to promote sustainable behaviors, as demonstrated by the results of the school surveys, with a consequent positive impact on reducing water pollution of different nature. On the other side, CS data are of a unique nature and allow a fine-grain analysis of very local problems enabling the authorities to improve the knowledge of the environment and to eventually activate strategies to prevent harmful effects.
Indicator 6.5.1 (degree of integrated water resources management implementation) SIMILE project deals with many of the parameters that were used to compute its synthetic index that is presented in
Section 1.2. It focuses on integrated monitoring (1.1.c) of transboundary waters (1.2.c and 2.2.e) including HFM, RS, and CS. Public participation (2.1.c and 2.2.b) is encouraged by the App that can be used as a monitoring tool and as an aggregator of lake-related events where citizens can actively impact the lake environment. All the gathered data are already publicly shared (3.2.c and 3.2.d) and they are supposed to support the cross-boundary activity of environmental agencies and to reduce the distance with the population increasing their awareness.
Indicator 6.5.2 (proportion of transboundary basin area with an operational arrangement for water cooperation) will not be affected as the existing political agreements are already enough to satisfy the UN requirements. However, the proposed tool and activities aim to make the existing transboundary management more effective using IT solutions, as the SIMILE BI platform, and promoting the creation of a single lake community crossing the national and regional boundaries.
Indicator 6.b.1 (proportion of local administrative units with established and operational policies and procedures for the participation of local communities in water and sanitation management) calculation can be directly impacted. Some of the municipalities, local entities, and associations that supported the SIMILE project decided to formalize this collaboration through a patronage or an agreement where they commit to promote the diffusion of its tools and to organize dissemination or surveying activities. The above-mentioned agreement could be formalized in a more general document, without a specific reference to the SIMILE project, to be used for monitoring the activities of the public administration on community engagement.


