1. Introduction
According to the Plex’s seventh annual “State of the Smart” manufacturing report, 80% of manufacturers consider smart manufacturing to be critical to their future success. Smart manufacturing involves the use of an interconnected network of equipment, machinery, and processes. Integrating smart technologies such as IoT and other Lean Manufacturing and Industry 4.0 initiatives typically requires the use of specialised applications and platforms. Due to the costs of developing new applications, smaller manufacturers are often the last to benefit from custom purpose-built software solutions. Low-code development platforms (LCDP) provide an alternative solution [
1]. The advantages of an LCDP for manufacturing include shorter development life cycles, faster implementation of new processes, more efficient workflows, and less need for specialised IT.
A low-code platform is a set of tools for programmers and non-programmers. It enables quick generation and delivery of business applications with minimum effort to write in a coding language and requires the least possible effort for the installation and configuration of environments, as well as training and implementation. With a rapidly growing number of companies, the use of low-code solutions can be a significant step forward in creating essential business applications.
In 2017, Joe McKendrick published a report on the development of applications by non-programmers, titled “The Rise of the Empowered Citizen Developer: Is IT Possible Without IT” [
2]. This report shows that the main problem for business departments is the long waiting time for delivery of a business application to end-users and the long waiting time for requested data and reports. This leads to situations in which so-called ‘citizen development’ (software developing by non-programmers) takes place in business departments on its own, and with the use of common office platforms. More serious and responsible engagement of people who create such applications will certainly lead to the faster and better creation of business applications, especially if they are equipped with appropriate tools [
3,
4]. This leads us to the rise of new software development tools: low-code development platforms.
This paper will specifically focus on building applications to support the execution of business process tasks. In this regard, authors will focus on one aspect of low-code development, i.e., data entry form preparation in business process user interface. Two different approaches will be evaluated: the multi-form model and the single-form model.
The multi-form model assumes that input forms will be prepared separately for each user task in the business process being automated. The single-form model assumes that there will be one global input form for every task in the business process.
In real business processes, there are many tasks, each of which has its own electronic form with which to interact with users. Therefore, all the work required for form preparation must be replicated for each task that presents data for reading or editing by task executors.
When it comes to system implementation, a dilemma arises: whether to use one central form for the entire business process or use separate forms for each task. The use of one common form to manipulate the process data (single-form development model) seems to be an extremely desirable approach due to the smaller workload in terms of modelling and coding. In this case, all the work required for form preparation is performed only once, and not as many times as the number of tasks in the process (usually from five to even twenty). The question arises: is it possible to use the single-form development model without compromising the quality and completeness of the final solution, an IT system for supporting business processes?
The single-form development model allows one to define a global data model for the entire business process and develop only one form. The workload is much less than for the multi-form model, but each task must be handled by the same form. This makes it difficult to prepare specific forms for individual tasks.
This problem can be mitigated by defining the ‘data visibility matrix’ for each business process. It contains information about which variable from the process data is to be used in which task.
In further considerations, both approaches to building data entry forms will be compared to determine which approach is more effective.
In this context, the following structure of the article is proposed. In
Section 2, the state of the art, i.e., an overview of existing approaches and models related to increasing the efficiency of software development, is presented.
Section 3 includes the formulation of the research problem, the related motivational example, and the sufficient conditions, the fulfilment of which guarantees a shorter time spent implementing the business process (thanks to the single-form model approach).
Section 4 contains the results of the quantitative and qualitative experiments undertaken. In
Section 5, a discussion of the results obtained is presented.
2. State of the Art
The term ‘low-code development’ was first used by Clay Richardson in 2014 in a report for Forrester Research entitled: “New Development Platforms Emerge For Customer-Facing Applications” [
5]. Low-code platforms require less coding knowledge. That is why practically everyone, including business (‘citizen’) developers, is able to use a low-code development platform. This feature is extremely important in the current times as the market faces a serious lack of skilled software engineers.
Although the concept of low-code development is quite young, there are many platforms in the market supporting this idea [
6]. There is a lot of discussion about the usefulness of the platforms, and there are both supporters and opponents, including Abdullah Al Alamin [
7], Jason Bloomberg [
8], Marcus Woo [
9], and Myles F. Cio [
10]. The fact is that low-code platforms are evolving, and even stronger development is planned in the future. They are used in many branches of industry and trade as well as in administration units, as described by Arpan Bansal [
11], Raquel Sanchis [
1], and Cecilie Ness [
12].
Along with the development of technology, scientific articles that assess selected aspects of its technical functioning have emerged, e.g., Ana Nunes Alonso [
13], Ilene Wolff [
14], and Michele Missikoff [
15]. Some of them raise issues related to software development productivity [
16], which is the main problem considered in this article.
However, among these publications there are no articles that are strictly related to the problem of software development productivity, especially in the area of automated data entry form preparation in LCDPs. The literature separately addresses the issues of improving productivity and building user interfaces. There are practically no references to both together in the context of low-code platforms.
Various methods of generating user interfaces in an automated manner and based on models are discussed in the works of Claudia Veronica Serey Guerrero and Bernardo Lula [
17], Pierre A. Akiki, Arosha K. Bandara and Yijun Yu [
18], Lassaad Ben Ammar [
19], Gordana Milosavljević, Dragan Ivanović, Dušan Surla and Branko Milosavljević [
20], and D.I. Heimann [
21]. A more practical approach, supported by examples of applications, is presented by Christophe Kolski, Jean Vanderdonckt, and Henry Lieberman [
22,
23,
24,
25,
26,
27], Jano van Hemert, Jos Koetsier, Livia Torterolo, Ivan Porro, Maurizio Melato, and Roberto Barbera [
28], and P. Bocciarelli [
29].
The problem of user interface generation is reviewed in the work of Mary Ann [
30], and the formal point of view is presented by Jürgen Engel, Christian Märtin, Christian Herdin, and Peter Forbrig [
31]. The problem of appliance methods is described by G. Dodig-Crnkovic et al. in [
32].
Productivity improvement is also discussed in many studies. Some of them are strictly related to the productivity of creating user interfaces. The book section “Evaluation of Model-Based User Interface Development Approaches” in “Human-Computer Interaction. Theories, Methods, and Tools” by Jürgen Engel, Christian Herdin, and Christian Märtin [
33] deserves special attention. The authors propose the PaMGIS framework developed at Augsburg University of Applied Sciences to support user interface designers without profound software development skills to specify the diverse models, which allow for at least semi-automated generation of user interface source code. They also evaluated the existing model-based user interface development frameworks in order to elicit new ideas to improve the applicability of their PaMGIS solution. Valeriya Gribova, in the book section “Methods for Decreasing Time and Effort during Development and Maintenance of Intellectual Software User Interfaces” in “Advanced Intelligent Computing Theories and Applications With Aspects of Theoretical and Methodological Issues” [
34] proposes methods for automated development and maintenance of intellectual software user interfaces. She uses an ontology-based approach that intends to decrease effort and time for user interface development and maintenance. Gregory Alan Bolcer, in the article “User interface design assistance for large-scale software development” [
35], addresses the specific design problems of style and integration consistency throughout the user interface development process and aids in the automated feedback and evaluation of a system’s graphical user interface according to knowledge-based rules and project-specific design examples.
The literature describes issues similar to those covered in this article, i.e., software development productivity in the area of automated data entry form preparation in LCDPs (
Table 1). However, due to the highly specific formulation of the problem and the highly focused scope of our research, the problem described in the paper should be treated as part of a larger whole that contributes to the overall productivity of the user interface. The problem as such was not formulated by other scientists and was not solved. In this regard, our research is new and unique.
3. Motivation and Research Problem
3.1. Motivation
Let us consider a situation where there is a business process (
), as shown in
Figure 1. The process includes five User Tasks (
). This kind of tasks means that a human performer executes the task with the use of a software application, i.e., data entry form. This means that five data entry forms (
) must be prepared in order to handle all process tasks (
.
However, the business process operates on a certain range of data (
Table 2). These data can be read and modified by a user. To allow a user to operate on the data, the data entry forms must be prepared.
Let us consider that we use the single-form model for data entry form preparation. That means that a data entry form must be created for each task in the business process.
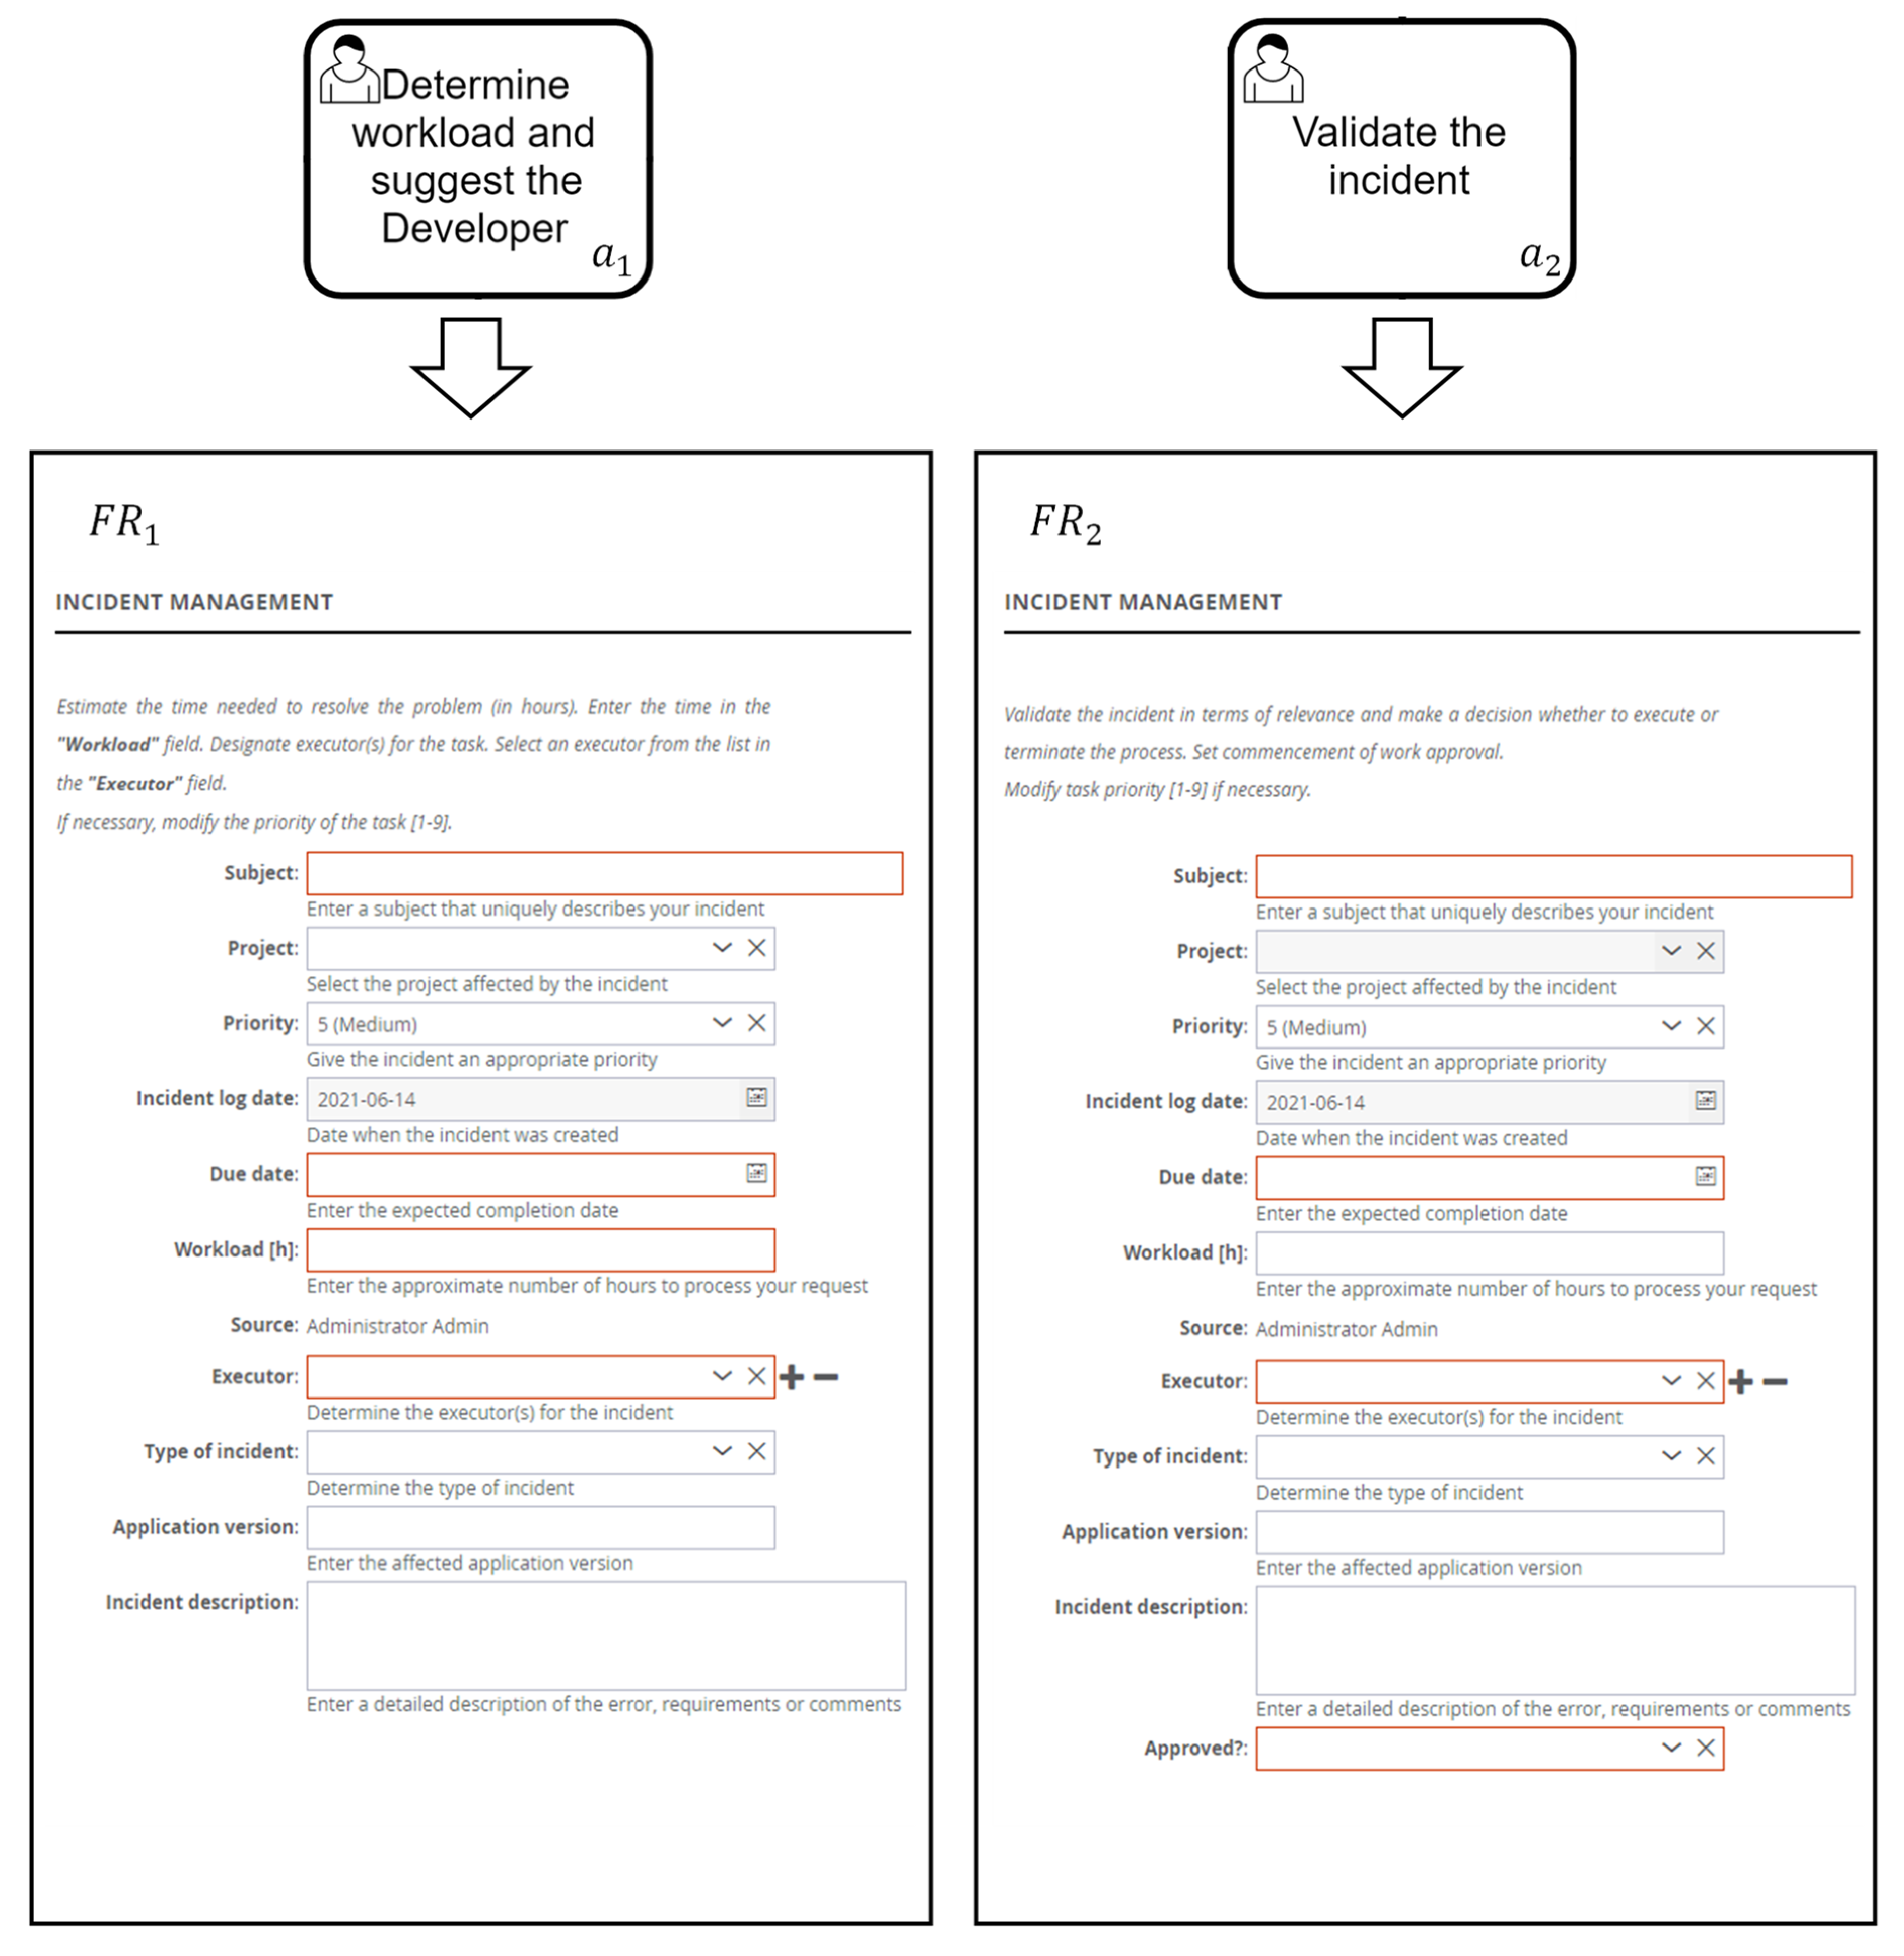
Figure 2 presents the forms that should be created for tasks
and
. As is evident, they only differ regarding one variable.
The construction of all the data entry forms (
for the business process (
) requires the necessity of building the same elements many times (e.g., re-construction of fields for variables
). After analysing the data processed by individual tasks, it can be seen that the tasks have a significant number of common variables (
Table 3). In the case under consideration, twelve variables (
) are common to all five forms (
). This means that the use of the multi-form model approach to the construction of these forms entails a redundancy of work related to creating fields for these variables (the form items for each of these variables are created five times). In the considered case, the construction of forms for tasks
of the process from
Figure 1 requires the creation of 63 fields (form items).
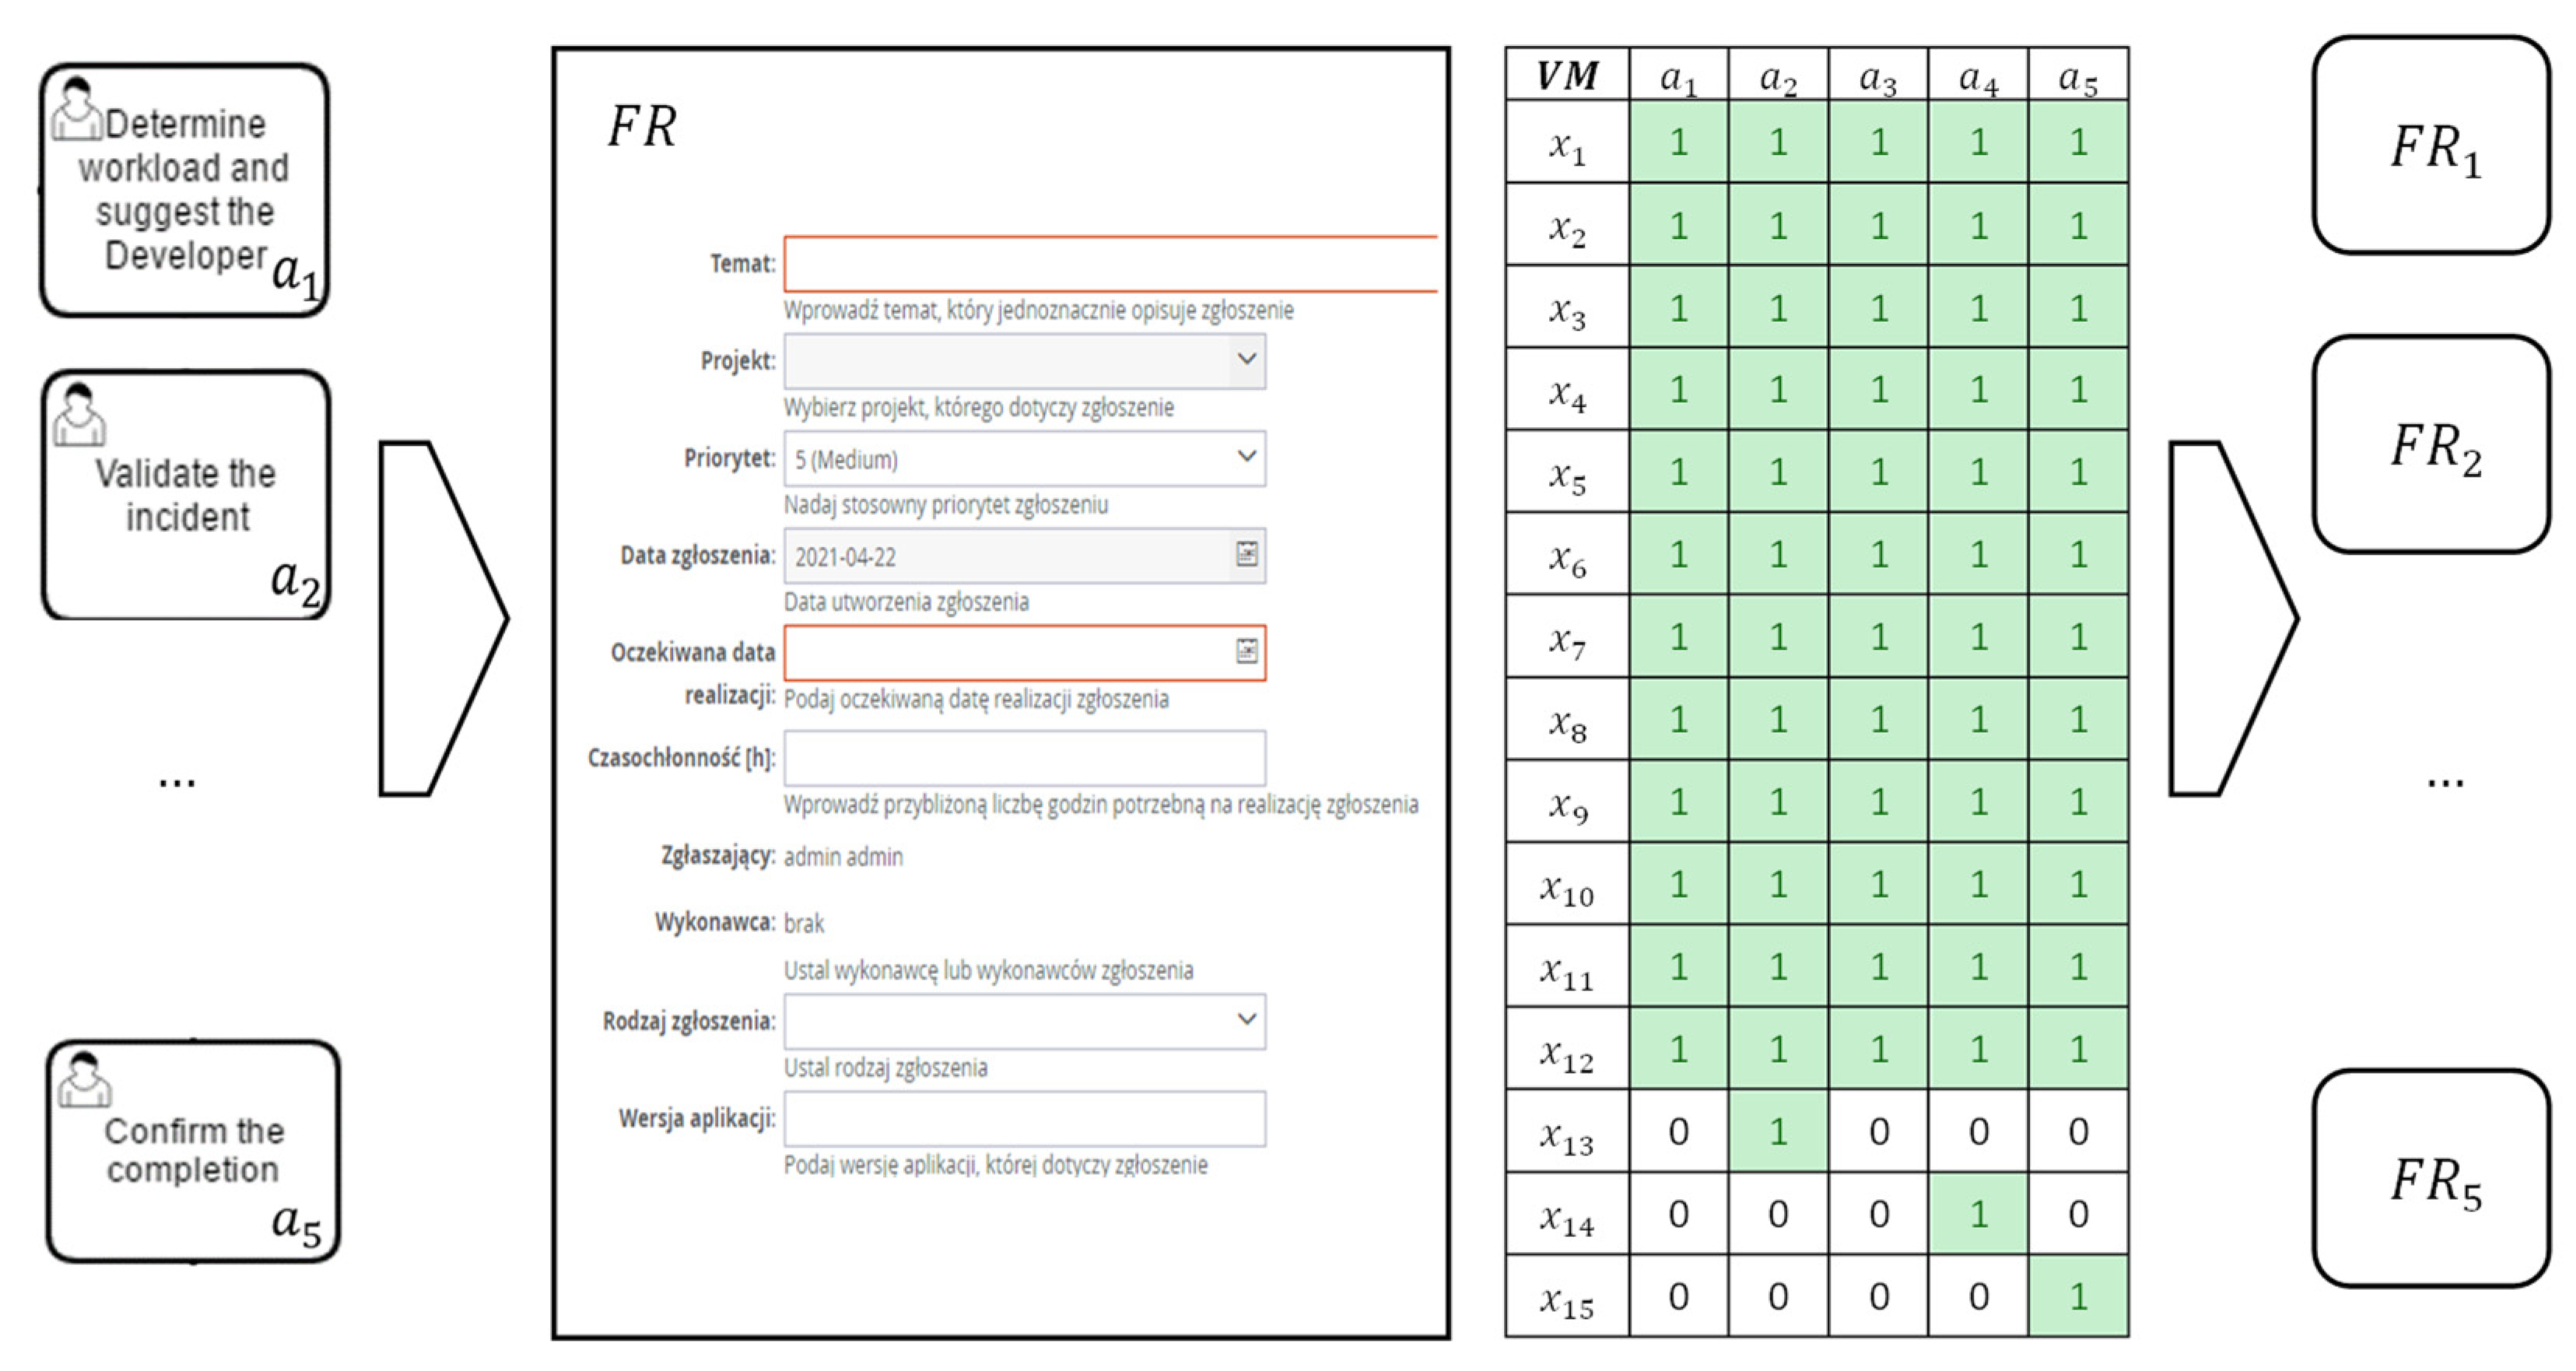
An alternative approach, the single-form model, is illustrated in
Figure 3. In this approach, only one electronic form that serves all tasks is built (
) and the so-called visibility matrix (
) is prepared. The VM is the binary matrix that represent the binary relation between the variables used in a business process and the business process’ tasks. It indicates which field is relevant to which task in terms of reading and modifying of process data by a business user (
Table 3). Based on the VM, data entry forms can be generated automatically for each task. In this case, the construction of the
form requires the creation of 15 fields and a VM of size 15 × 5. It should be noted that the time for building one form field (hereinafter denoted by the variable
) is much longer than the time for determining the value of a single cell of the VM (hereinafter denoted by the variable
). This means that the use of the single-form model approach to generate task forms
has almost four times less cost than in the case of using the multi-form model.
Table 3 shows the VM for the (
) business process. The ‘x’ sign in the matrix cell indicates that the given variable is used in the given business process task.
The above example shows that the construction of the data entry forms used in the given business process (
) can be done in many ways (multi-form model or single-form model), which, due to the redundancy of work, result in different costs of their implementation (and thus a different working time). In a situation where many tasks of a business process share the same resources (variables in
Table 3), it may turn out that the construction of a common form (
) and VM that enables its parameterisation for individual tasks of the process (
) may be less expensive than the traditional approach commonly used by developers of building a separate form for each task (multi-form model).
It should be emphasised that the benefit of use in the single-form model approach occurs due to the presence of the tasks in the process that share multiple variables; in other words,
Table 2 is ‘dense’. Practice shows that this approach becomes ineffective for processes whose tasks share very few variables. In this approach, the problem considered in the current paper concerns the evaluation of the costs of applying the presented approaches. In other words, an answer is sought to the question: what features of the business process (and its tasks) determine the advantage (lower implementation costs) of the single-form model approach over the multi-form model approach (or vice versa)?
3.2. Statement of Research Problem
In general, a business process (see
Figure 1) can be represented as a directed graph defined as a pair:
where, for BPMN notation:
means the set of vertices represent:
flow nodes:
containing events (
), activities/user tasks (
) and gateways (
). For example, the process shown in
Figure 1 includes 3 events
, 5 user tasks
and 3 gateways
,
data objects
. For example, the process shown in
Figure 1 includes 5 data objects
.
is the set of edges. It consists of:
set of edges representing sequence flows
. For example, the business process (
) shown in
Figure 1 includes 12 sequence flows
,
set of edges representing message flows ,
set of edges representing data associations
. For example, the business process (
) shown in
Figure 1 includes 12 edges of the data association type
,
set of edges representing conversation links .
The implementation of the
business process defined in this way includes a number of stages, among which the construction of forms for handling tasks from the
set deserves special attention. The BPMN notation does not provide for formal data models. Thus, data related to specific tasks
can be modeled in many different ways [
36,
37].
Let us simply assume that each task of the process is related to a finite set of variables . Access to variables from the set is usually implemented through the set of GUI forms. The form dedicated to task of the process allows the user to specify the values of the variables needed to accomplish this task. The size of the form (number of fields in the form) is determined by the number of variables and equals .
Programmers and citizen developers can use two approaches to modelling data usage in the GUI:
multi-form model, in which a separate form () is built for each task of the process. In this case, the number of forms is equal to the number of tasks in the process: ,
single-form model, in which all the forms for each task are automatically generated from a so-called master form () together with the VM: .
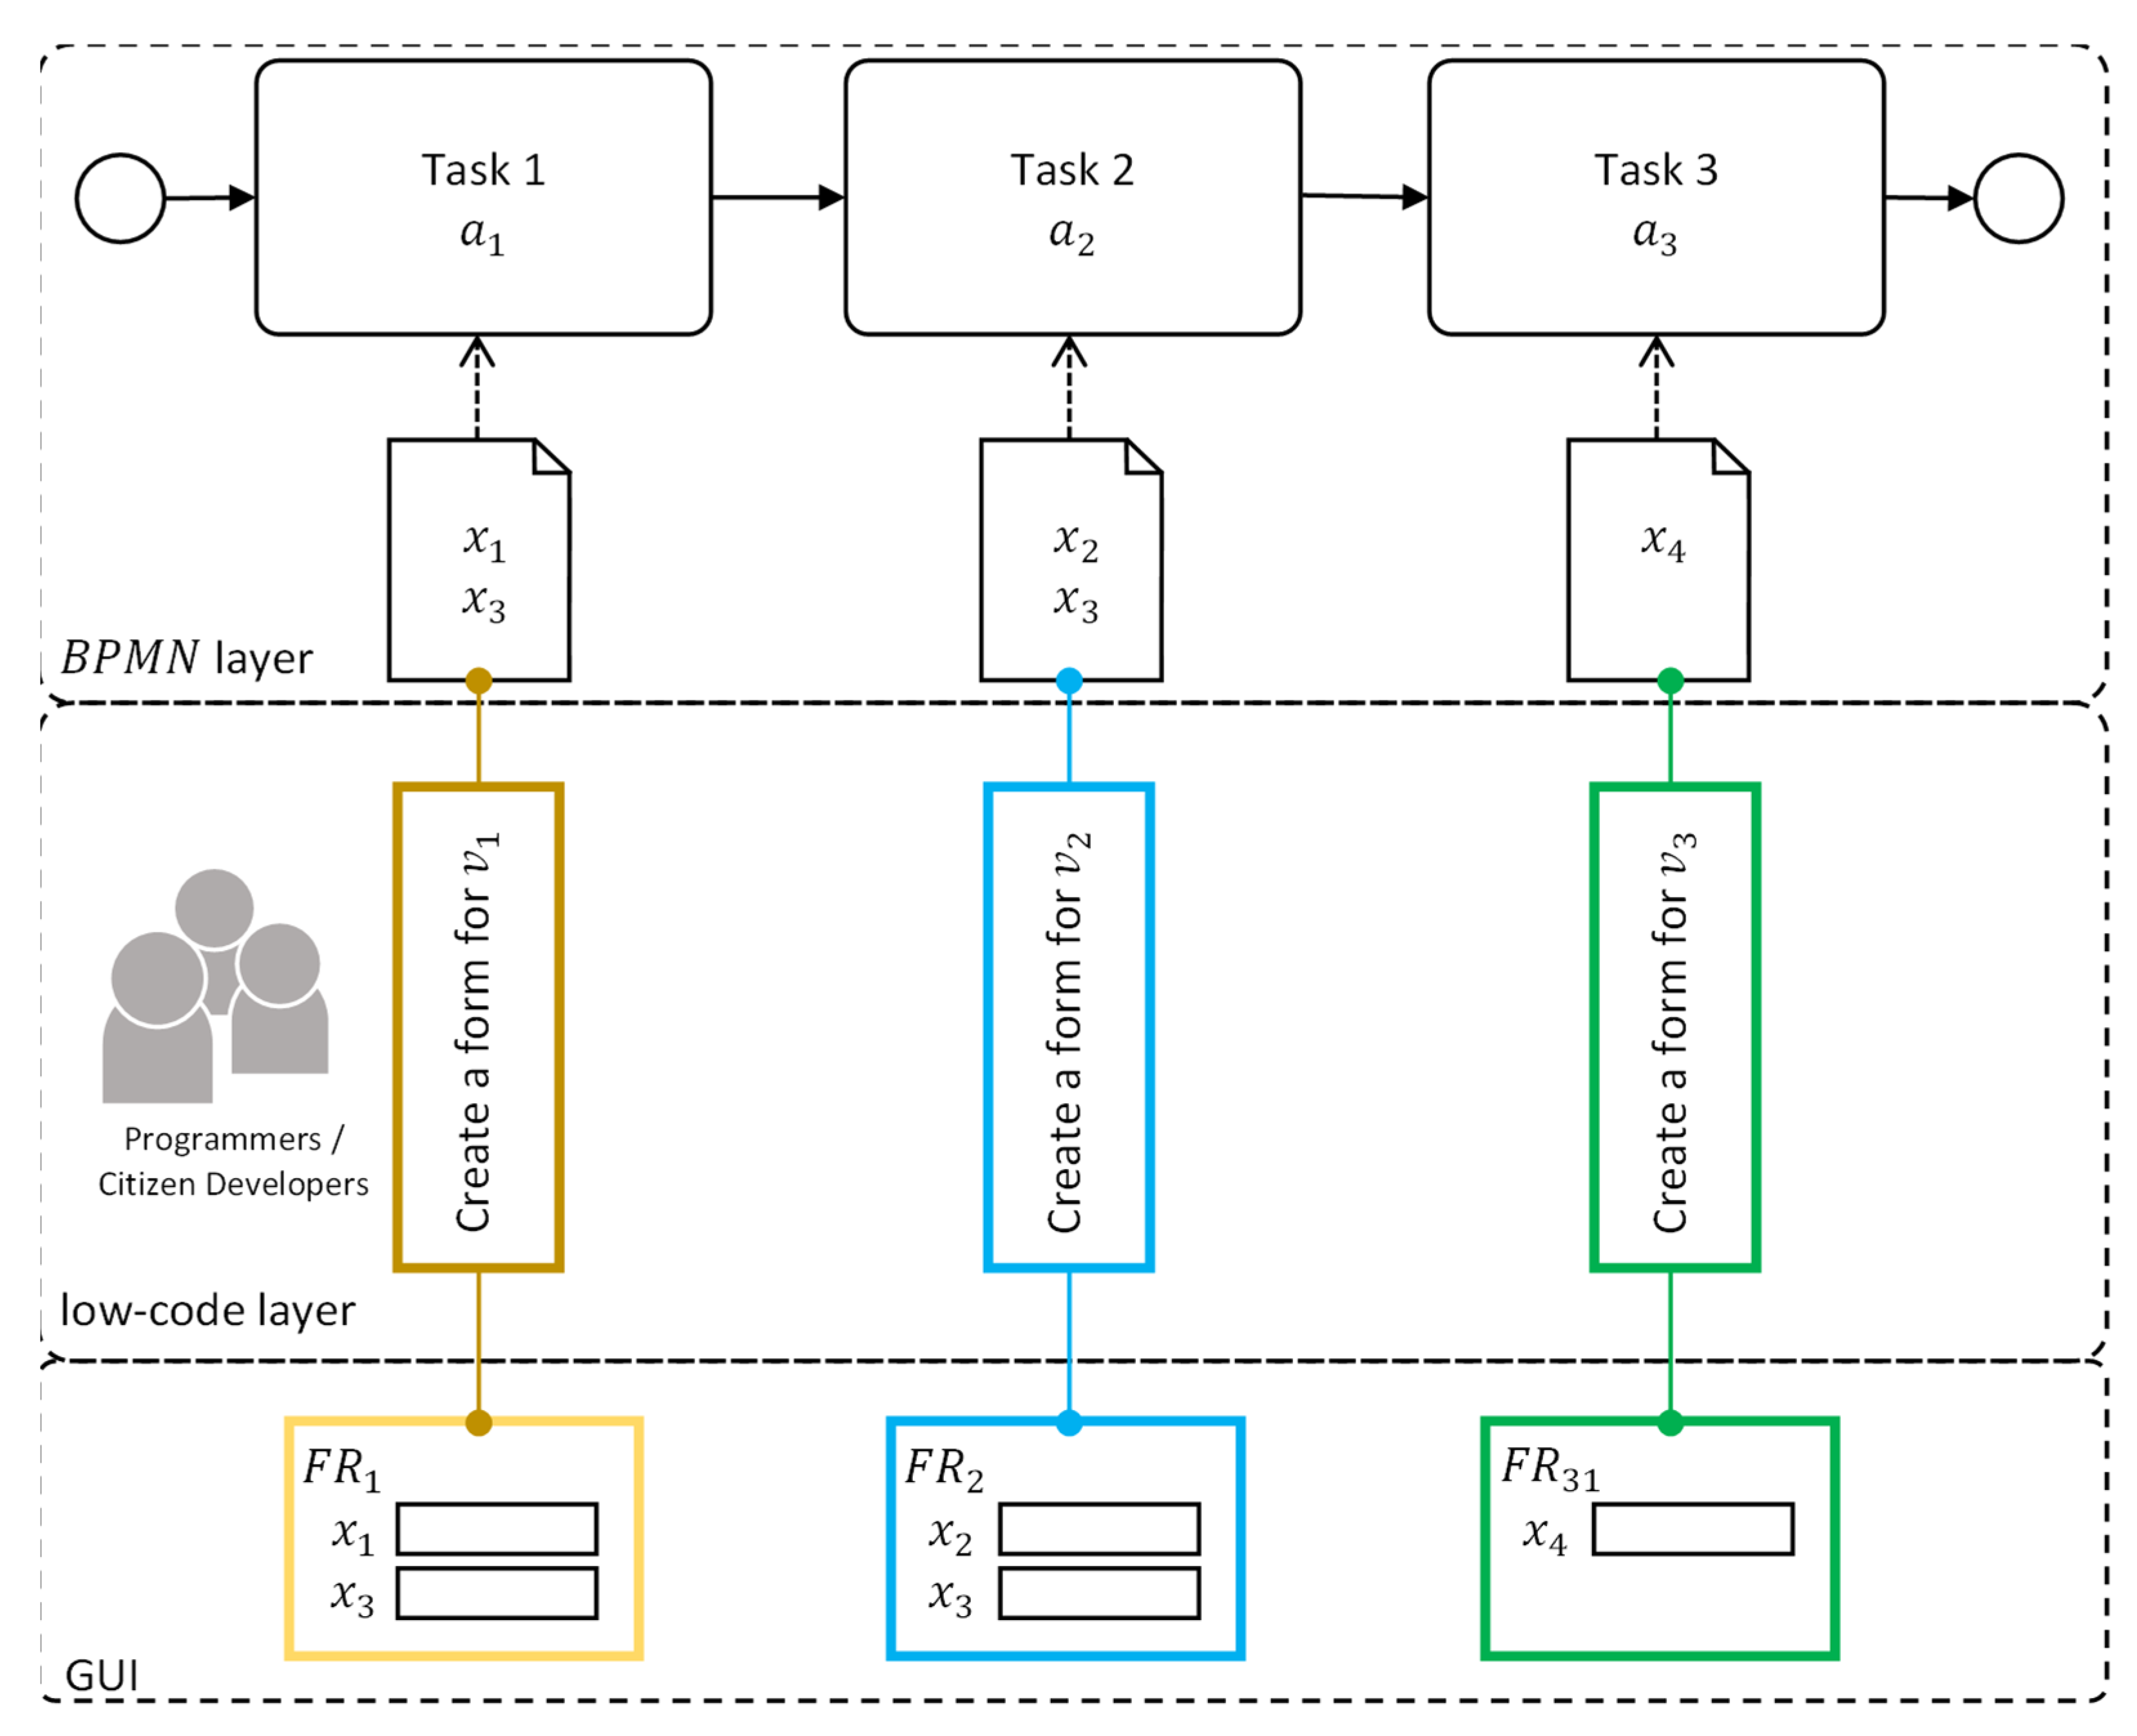
Figure 4 presents the concept of constructing forms for
process tasks in accordance with the multi-form model approach. This approach assumes that programmers or citizen developers construct the set of separate forms (
) for each task
. As shown in the example in the previous section (
Figure 2), this approach involves redundant work in situations where tasks use the same variables (which is often the case in practice). Avoiding redundant work is possible thanks to the use of a single-form model.
The master form (
) used in the single-form model approach utilises all the
process variables:
cardinality of which equals to
. While
is the matrix
, elements
determine the visibility of the variable
in the
form of the task
:
where
equals 1 when variable
is necessary in the
form of the task
and equals 0 (zero) when variable
is not necessary in the
form of the task
.
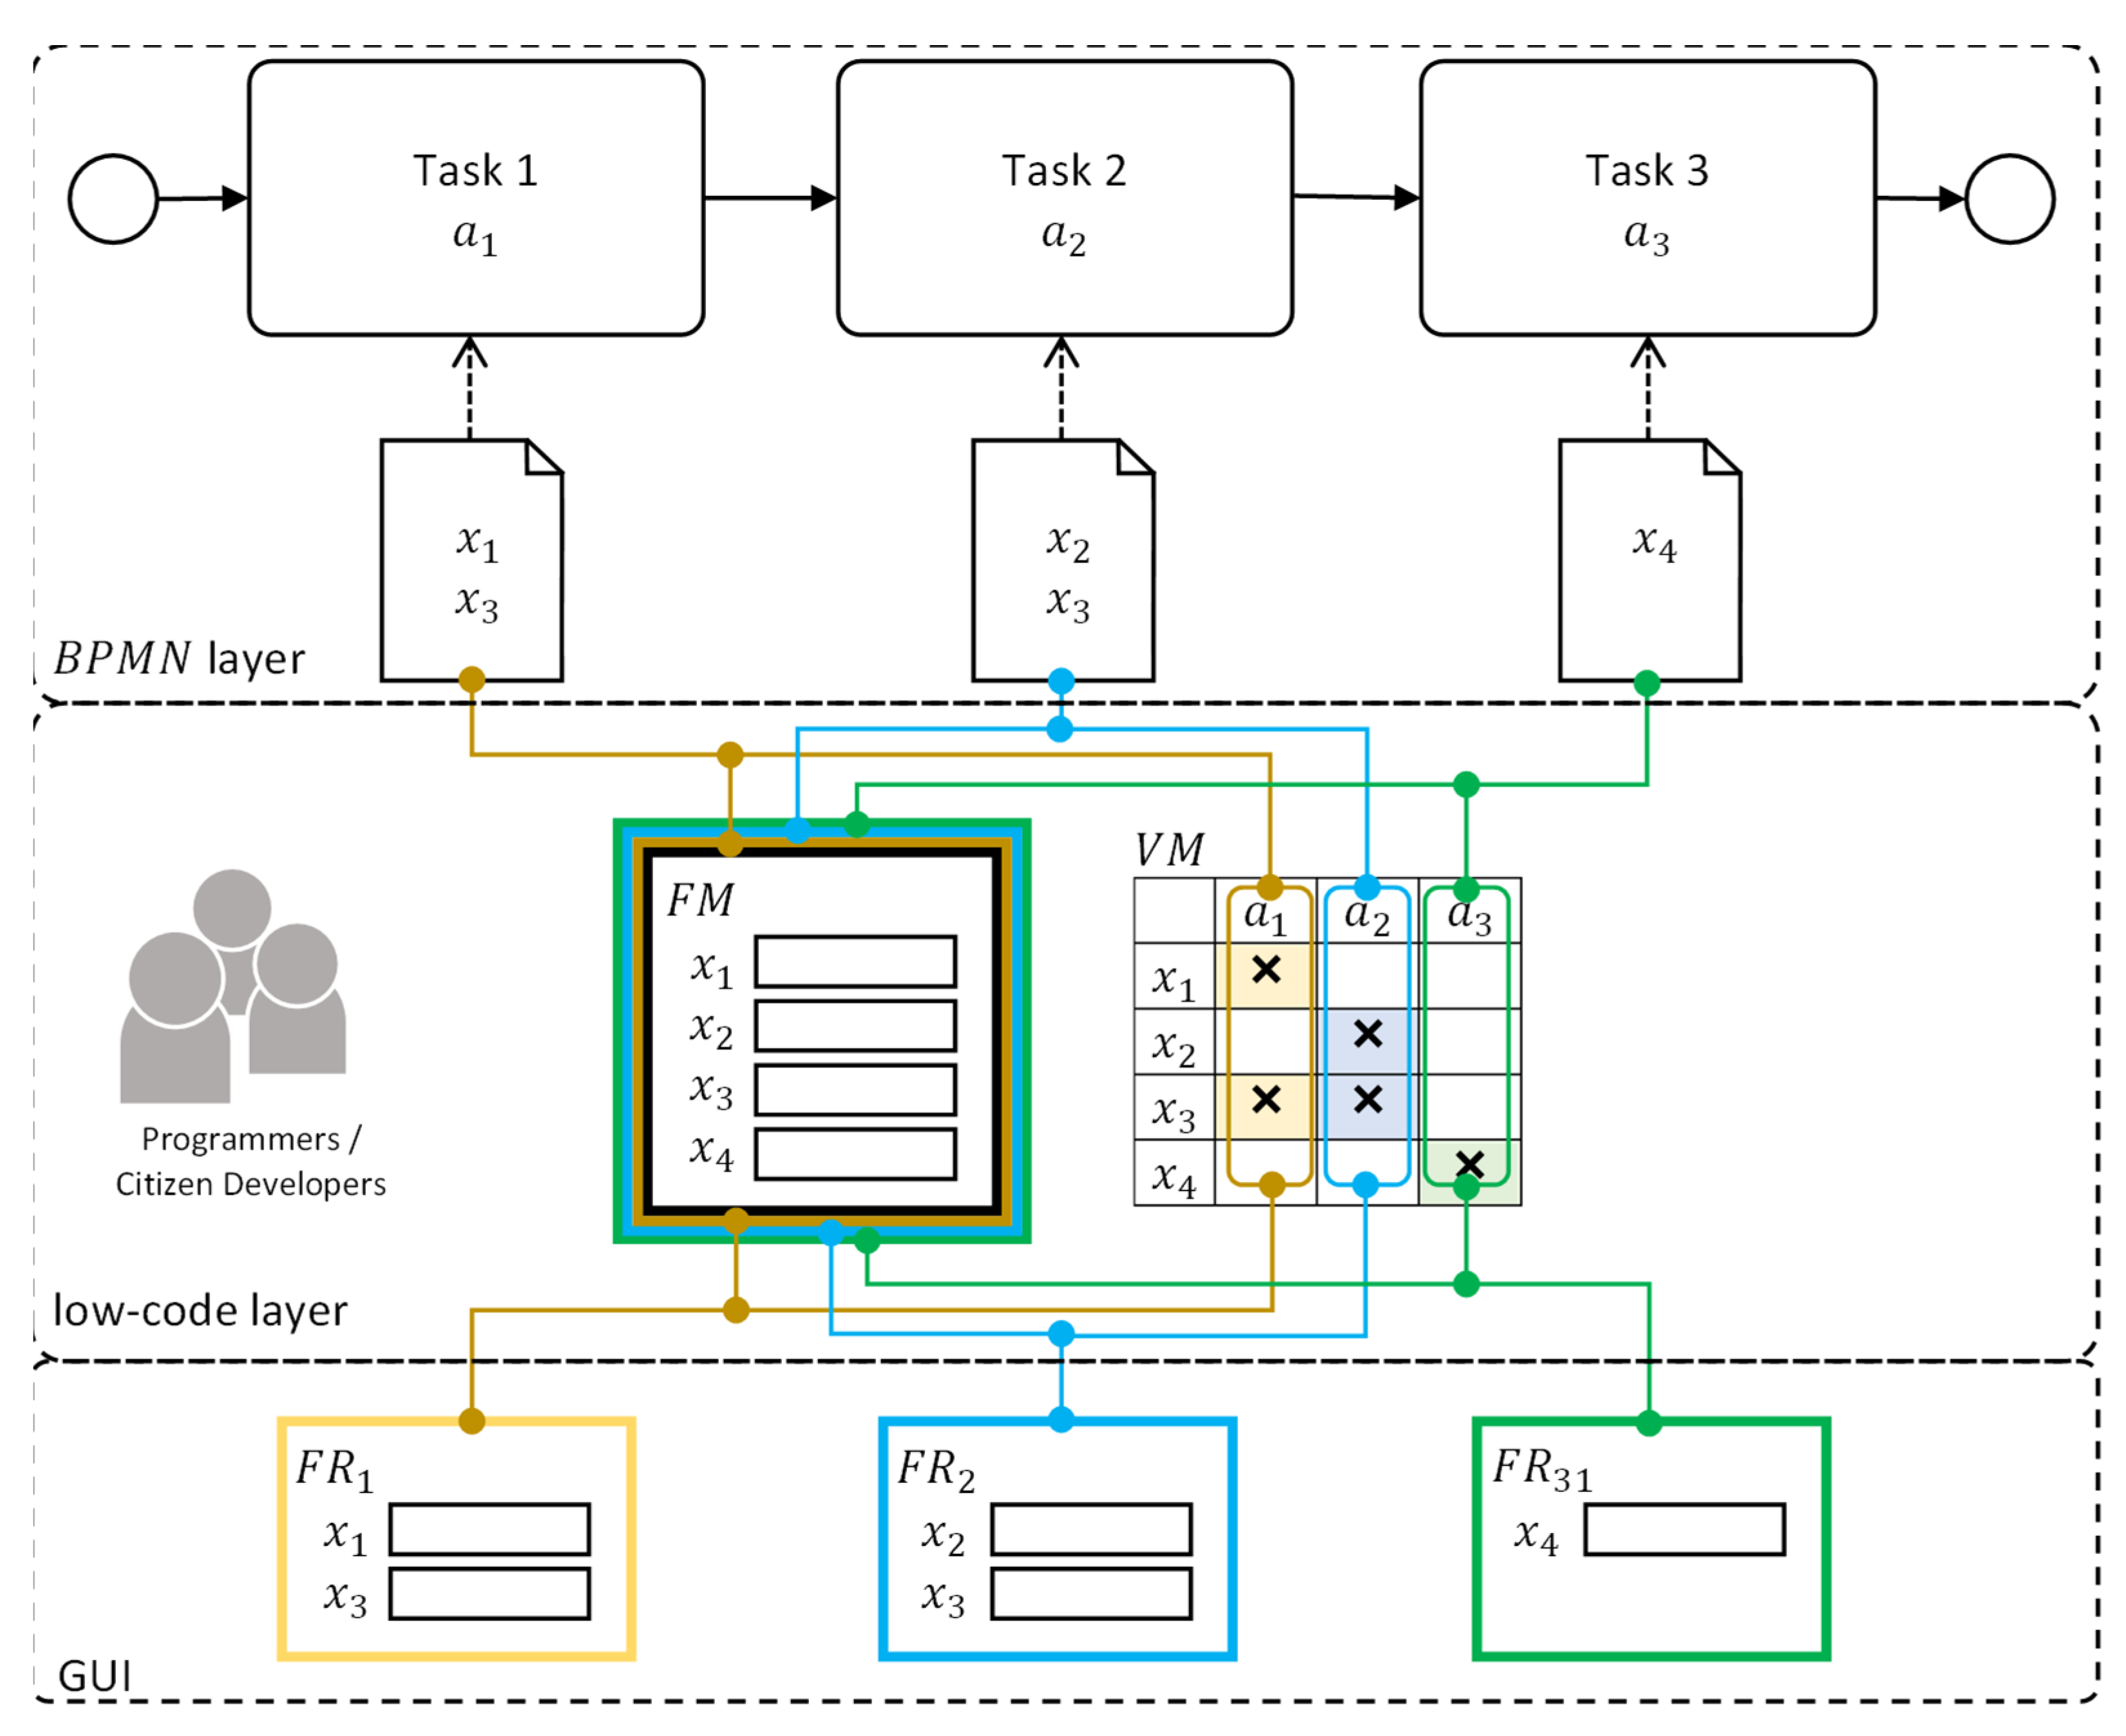
The principle of construction of the
form, based on
, is illustrated in
Figure 5. This approach assumes that for a given process (
, programmers or citizen developers are responsible for building the FM and VM. The forms
(GUI layer), designed to handle individual tasks, are generated automatically from the FM based on the data contained in the VM. In other words, each of the
forms are obtained from
FM by hiding unnecessary fields.
3.3. Sufficient Condition
Answering this question requires formulating conditions, the fulfilment of which guarantees lower implementation costs using the single-form model approach (). For this purpose, the following auxiliary variables are introduced, which characterise, inter alia, effectiveness of project teams.
: a coefficient that determines how many times the filling time of one visibility matrix cell is shorter than the construction time of one form field (it is usually the goal of the project team to keep the TCA as low as possible),
: a coefficient that determines how many times the form initialisation time is longer than the construction time of one form field,
: the density of the VM, .
It is assumed that the cost
of the implementation of the
process in the single-form model approach consists of the time to prepare a blank form (
), the time to embed all the process variable fields into the form (
), and the time to fill the whole VM (
):
For example, assuming that the effectiveness of a developer implementing the
process shown in
Figure 1 (
) is as follows,
time to embed one variable field into the form: (5 min),
time to prepare a blank form: [s] (10 min),
time to fill one cell of the VM: [s],
The time needed to prepare the data entry forms for the tasks equals (7350 s).
Similarly, the cost
of the implementation of the
process in the multi-form model approach consists of the time required to prepare
blank forms (
) and the time required to embed the variable field into them
:
Assuming the same developer efficiency parameters, the time of the developer’s work related to the preparation of forms in accordance with the multi-form model is (21,900 s). This means that the use of a single-form model in the case under consideration allows for a threefold reduction in the developer’s working time. Therefore, the question arises, under which conditions is the use of a single-form model in user interface preparation still profitable (in the sense of a shorter delivery time )?
The single-form model approach is preferable to the multi-form model approach when:
Considering (2) and (3), this inequality can be written as:
Considering further that
,
, and
:
where
determines the limit value (minimum) of the density (
) of the VM for which condition (4) is met, i.e., the single-form model is less expensive than the multi-form model (cost-effective threshold density;
). The above condition leads to the following theorem:
Theorem 1. For given process BP (1), the inequality is satisfied if the inequalityis satisfied.
Proof. The proof results directly from the argumentation (4)–(11). □
The presented theorem should be interpreted as follows. If the density of the for the (1) business process is greater than (3), then its implementation is more beneficial (i.e., it requires less working time) with the use of the single-form model approach: .
As already mentioned in the example given in
Figure 1, the value of
is greater than
. This is due to the fact that the density value
is greater than
; thus, the Theorem 1 condition is met.
The condition developed is essentially a criterion for applying one of the two modeling approaches. The choice of the best model depends on the density () of the VM (which depends on the BP process structure) and on which reflects the project team’s production capacity (represented by TCA and TBA coefficients). In this context, in addition to assessing the profitability of a specific modeling approach, the introduced measures can be used to determine the changes to be made in the BP process structure or in the configuration of the project team to be able to effectively produce software using a given model. In other words, the analysis of the variables determining the values of D and DG (verification of the fulfillment of the condition ) allows the determination of what values will enable the use of an arbitrarily chosen approach. The synthesis of the development environment parameters related to this approach may lead to the following question: achieving what values of the TCA and TBA parameters of the project team will allow the use of the single-form model approach?
Thus, the proposed condition enables a quantitative assessment of the complexity of the BP process being modeled (parameter D), the effectiveness of the project team (parameter DG), and the selected modeling approach (D > DG).
The developed condition was used in a series of experiments, the results of which are presented in the next section.
4. Experimental Results
In order to verify the evaluation method proposed in this paper, both qualitative and quantitative experiments were conducted.
Qualitative experiments are aimed at defining the conditions that should be met by a business process to make its implementation advantageous with the single-form model approach. They were also conducted to assess what determines the choice of method, i.e., which factors (properties of business processes and developers’ skills) influence the assessment.
Quantitative experiments are intended to answer the question of which values of important parameters in real business processes and real project teams affect the choice of method the most. On this basis, it can be assessed which method works better for the implementation of real systems.
4.1. Qualitative Experiments
The aim of the qualitative experiments is to assess the variability of the , depending on the change in the value of the and project teams’ effectiveness coefficients as well as on the change in the size of the . In this context, the experiments were divided into three groups.
4.1.1. Assessment of Conditions under Which It Is Advisable to Use the Single-Form Model for the Business Process BP1
Let us consider a situation where the efficiency of a developer implementing the business process
from
Figure 1 (
) is as follows:
time to embed one variable field into the form: (5 min),
time to prepare a blank form: [s] (10 min),
time to fill one cell of the : [s].
The aim of the experiment is to assess for which density values (
) of the VM the use of the single-form model is more advantageous (requires less of the developer’s time) than the use of the multi-form model. In practice, a high
density value means a large number of variables shared by business process tasks (the same variables appear in many data entry forms). In the experiment, the value of the variable
was assumed to be successively
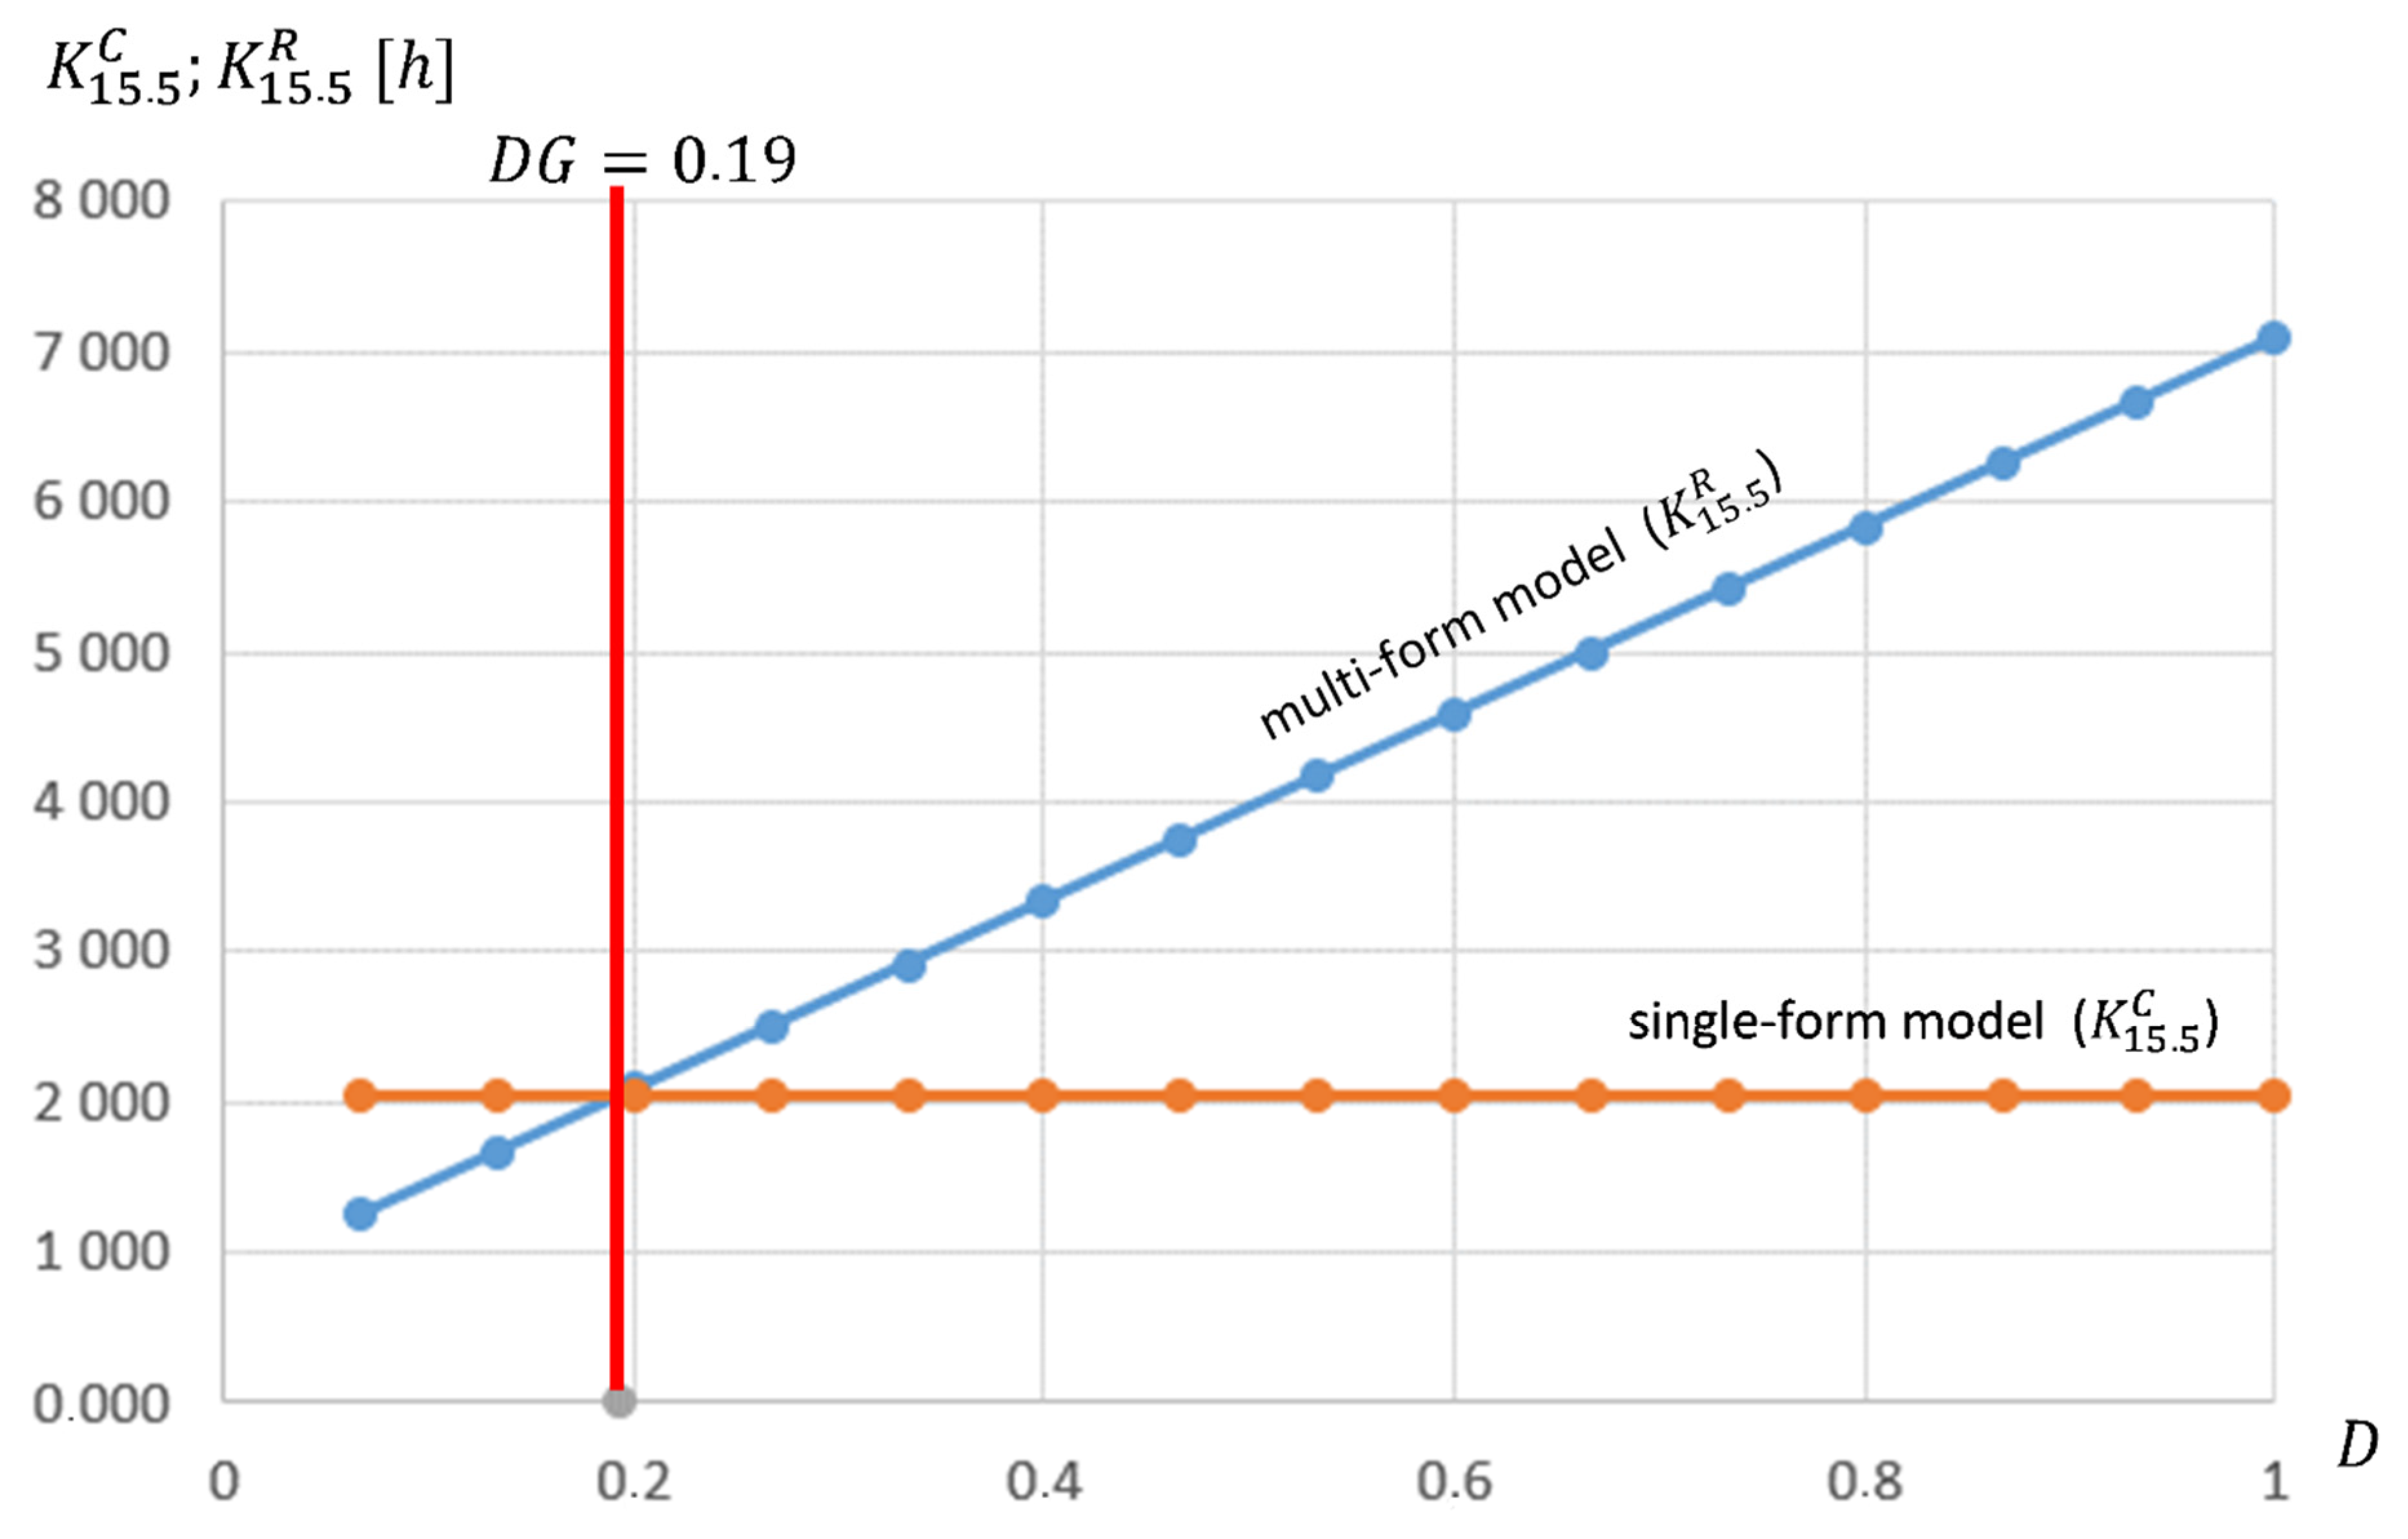
. The results of the experiment are presented in
Figure 6.
The experiment confirmed the correctness of the conditions developed under Theorem 1. According to the experiment, the single-form model is more favourable when . It is worth noting that in the extreme case of , the implementation of the business process using the multi-form model approach is 3.5 times more expensive than in the case of the single-form model.
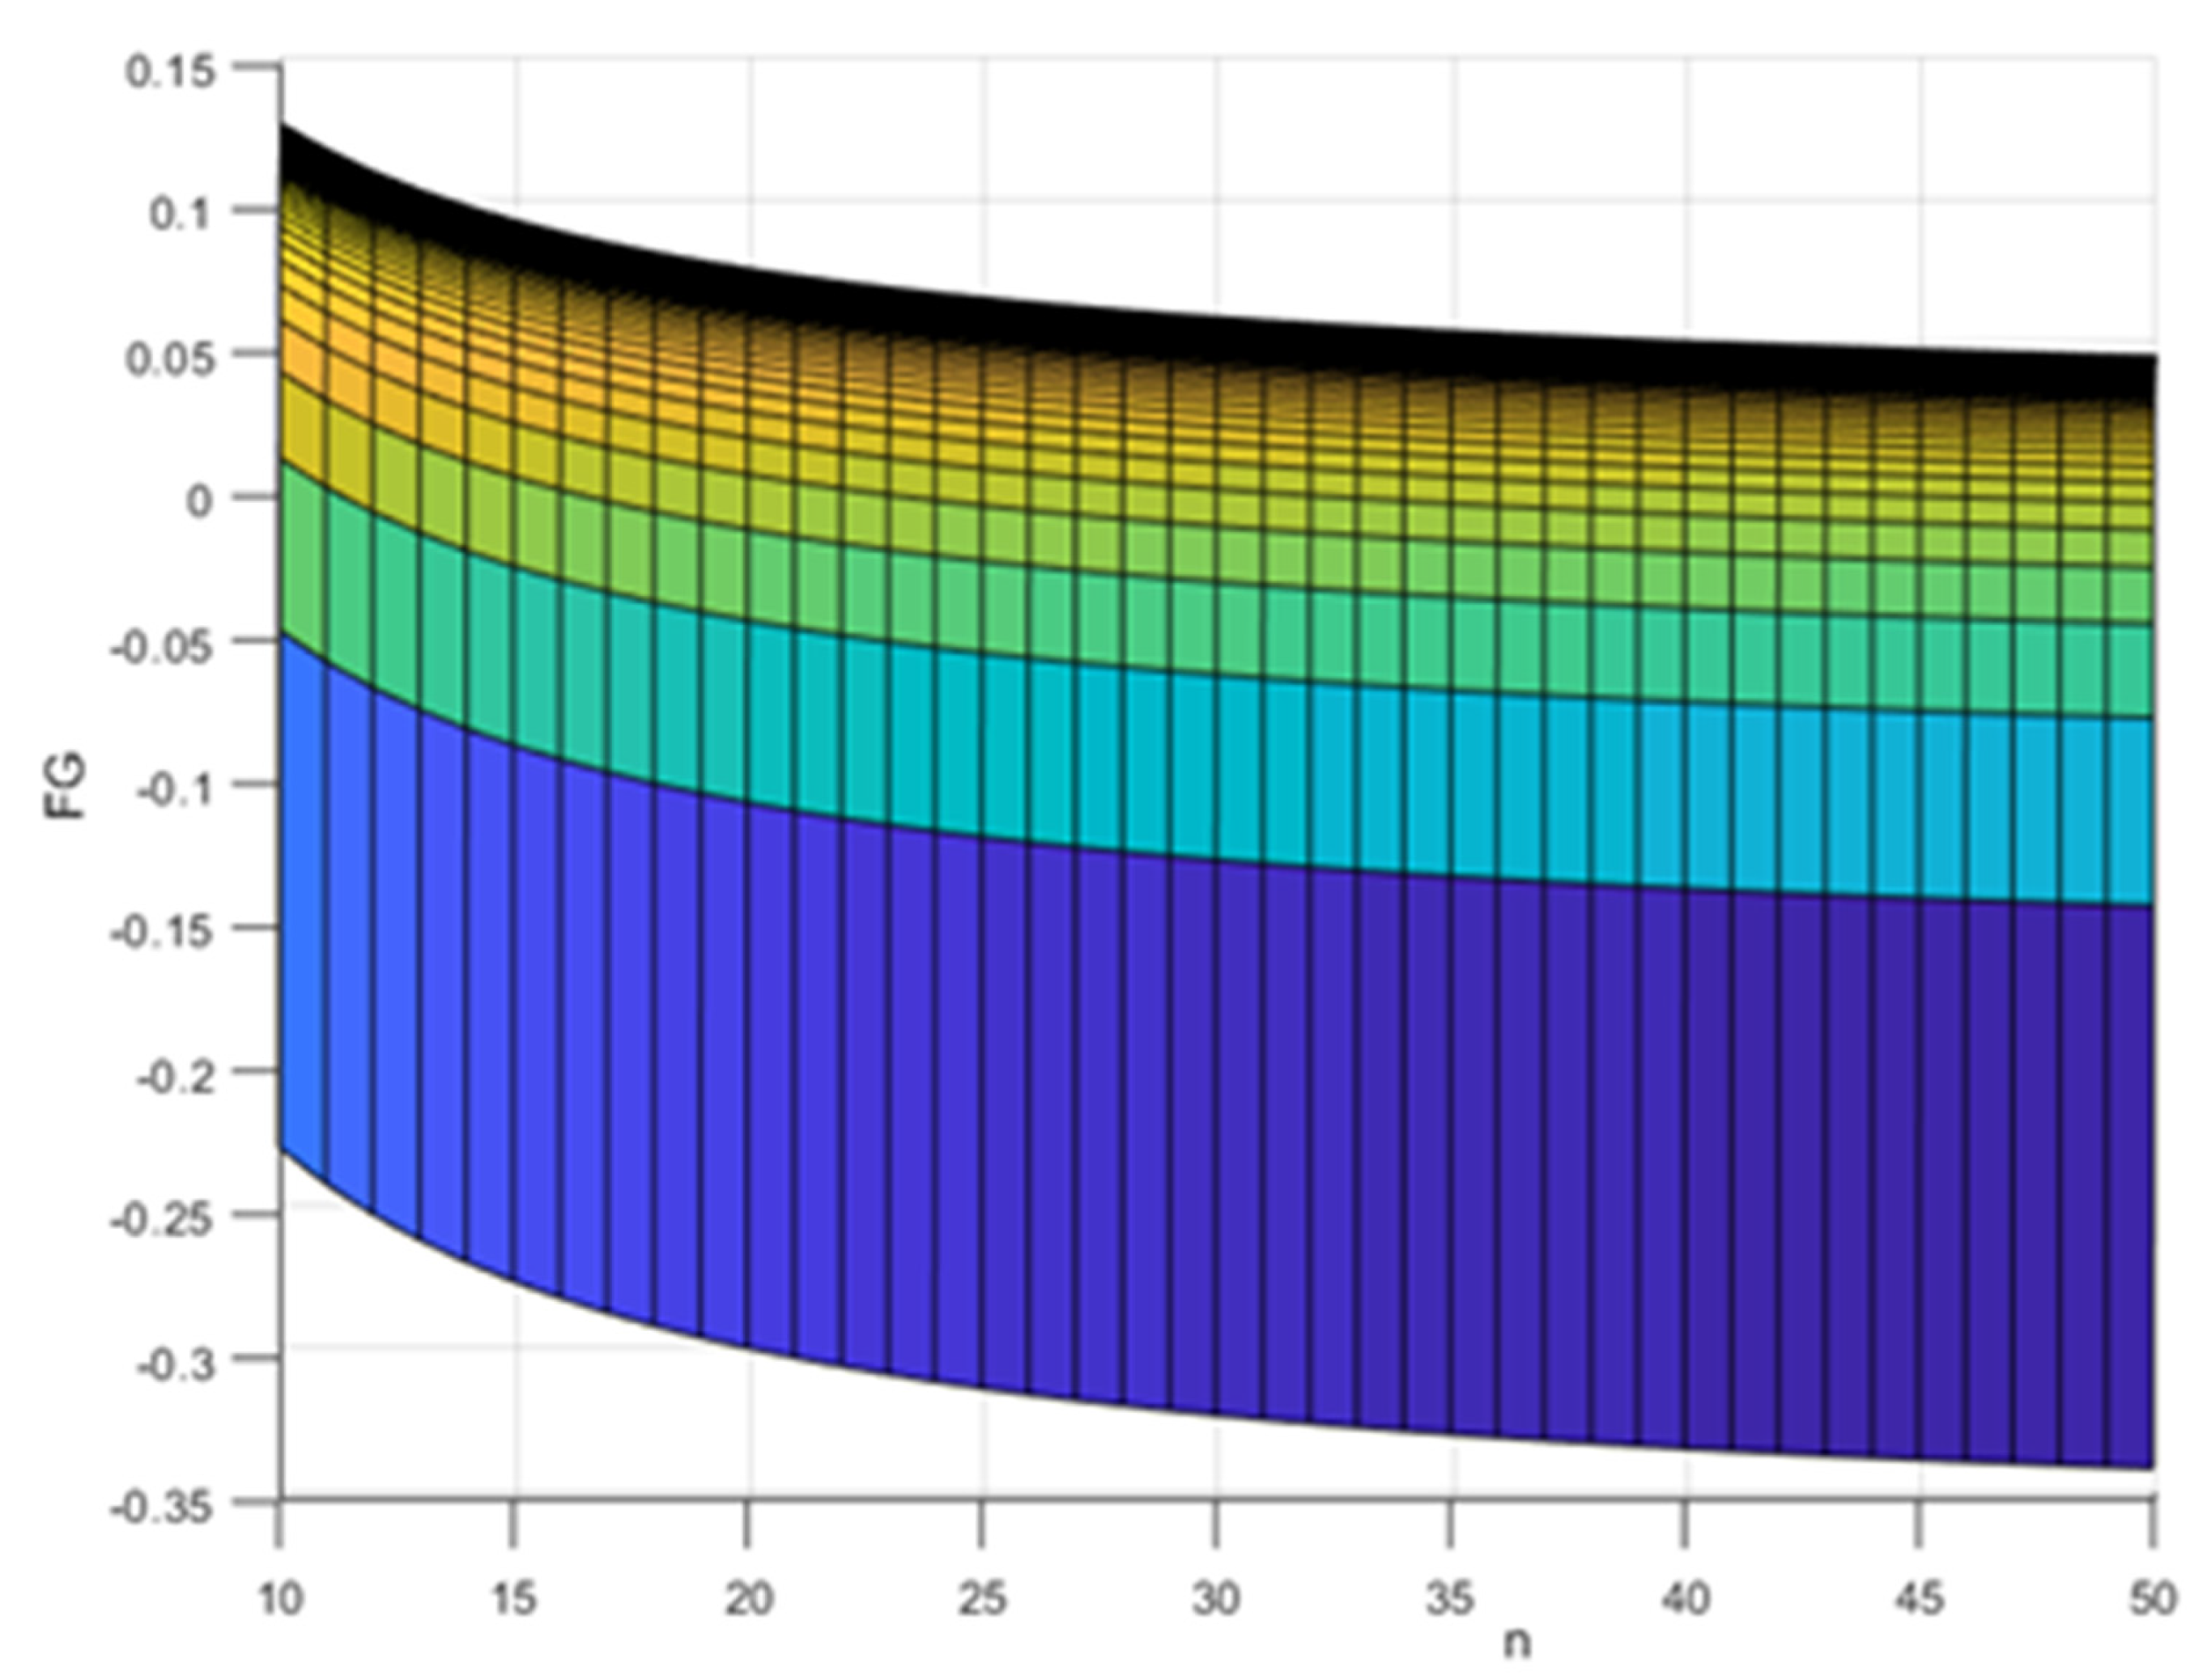
4.1.2. Assessment of the Variability of the DG, Depending on the Change in the Value of the Project Team’s Efficiency Coefficients TCA and TCB
For the purposes of the experiments, it was assumed that the size of the is constant and equals ; , while the coefficients of effectiveness are variable and take the following values: ; .
For such parameters, the minimum of the was determined for which the single-form model is less expensive than the multi-form model, i.e., .
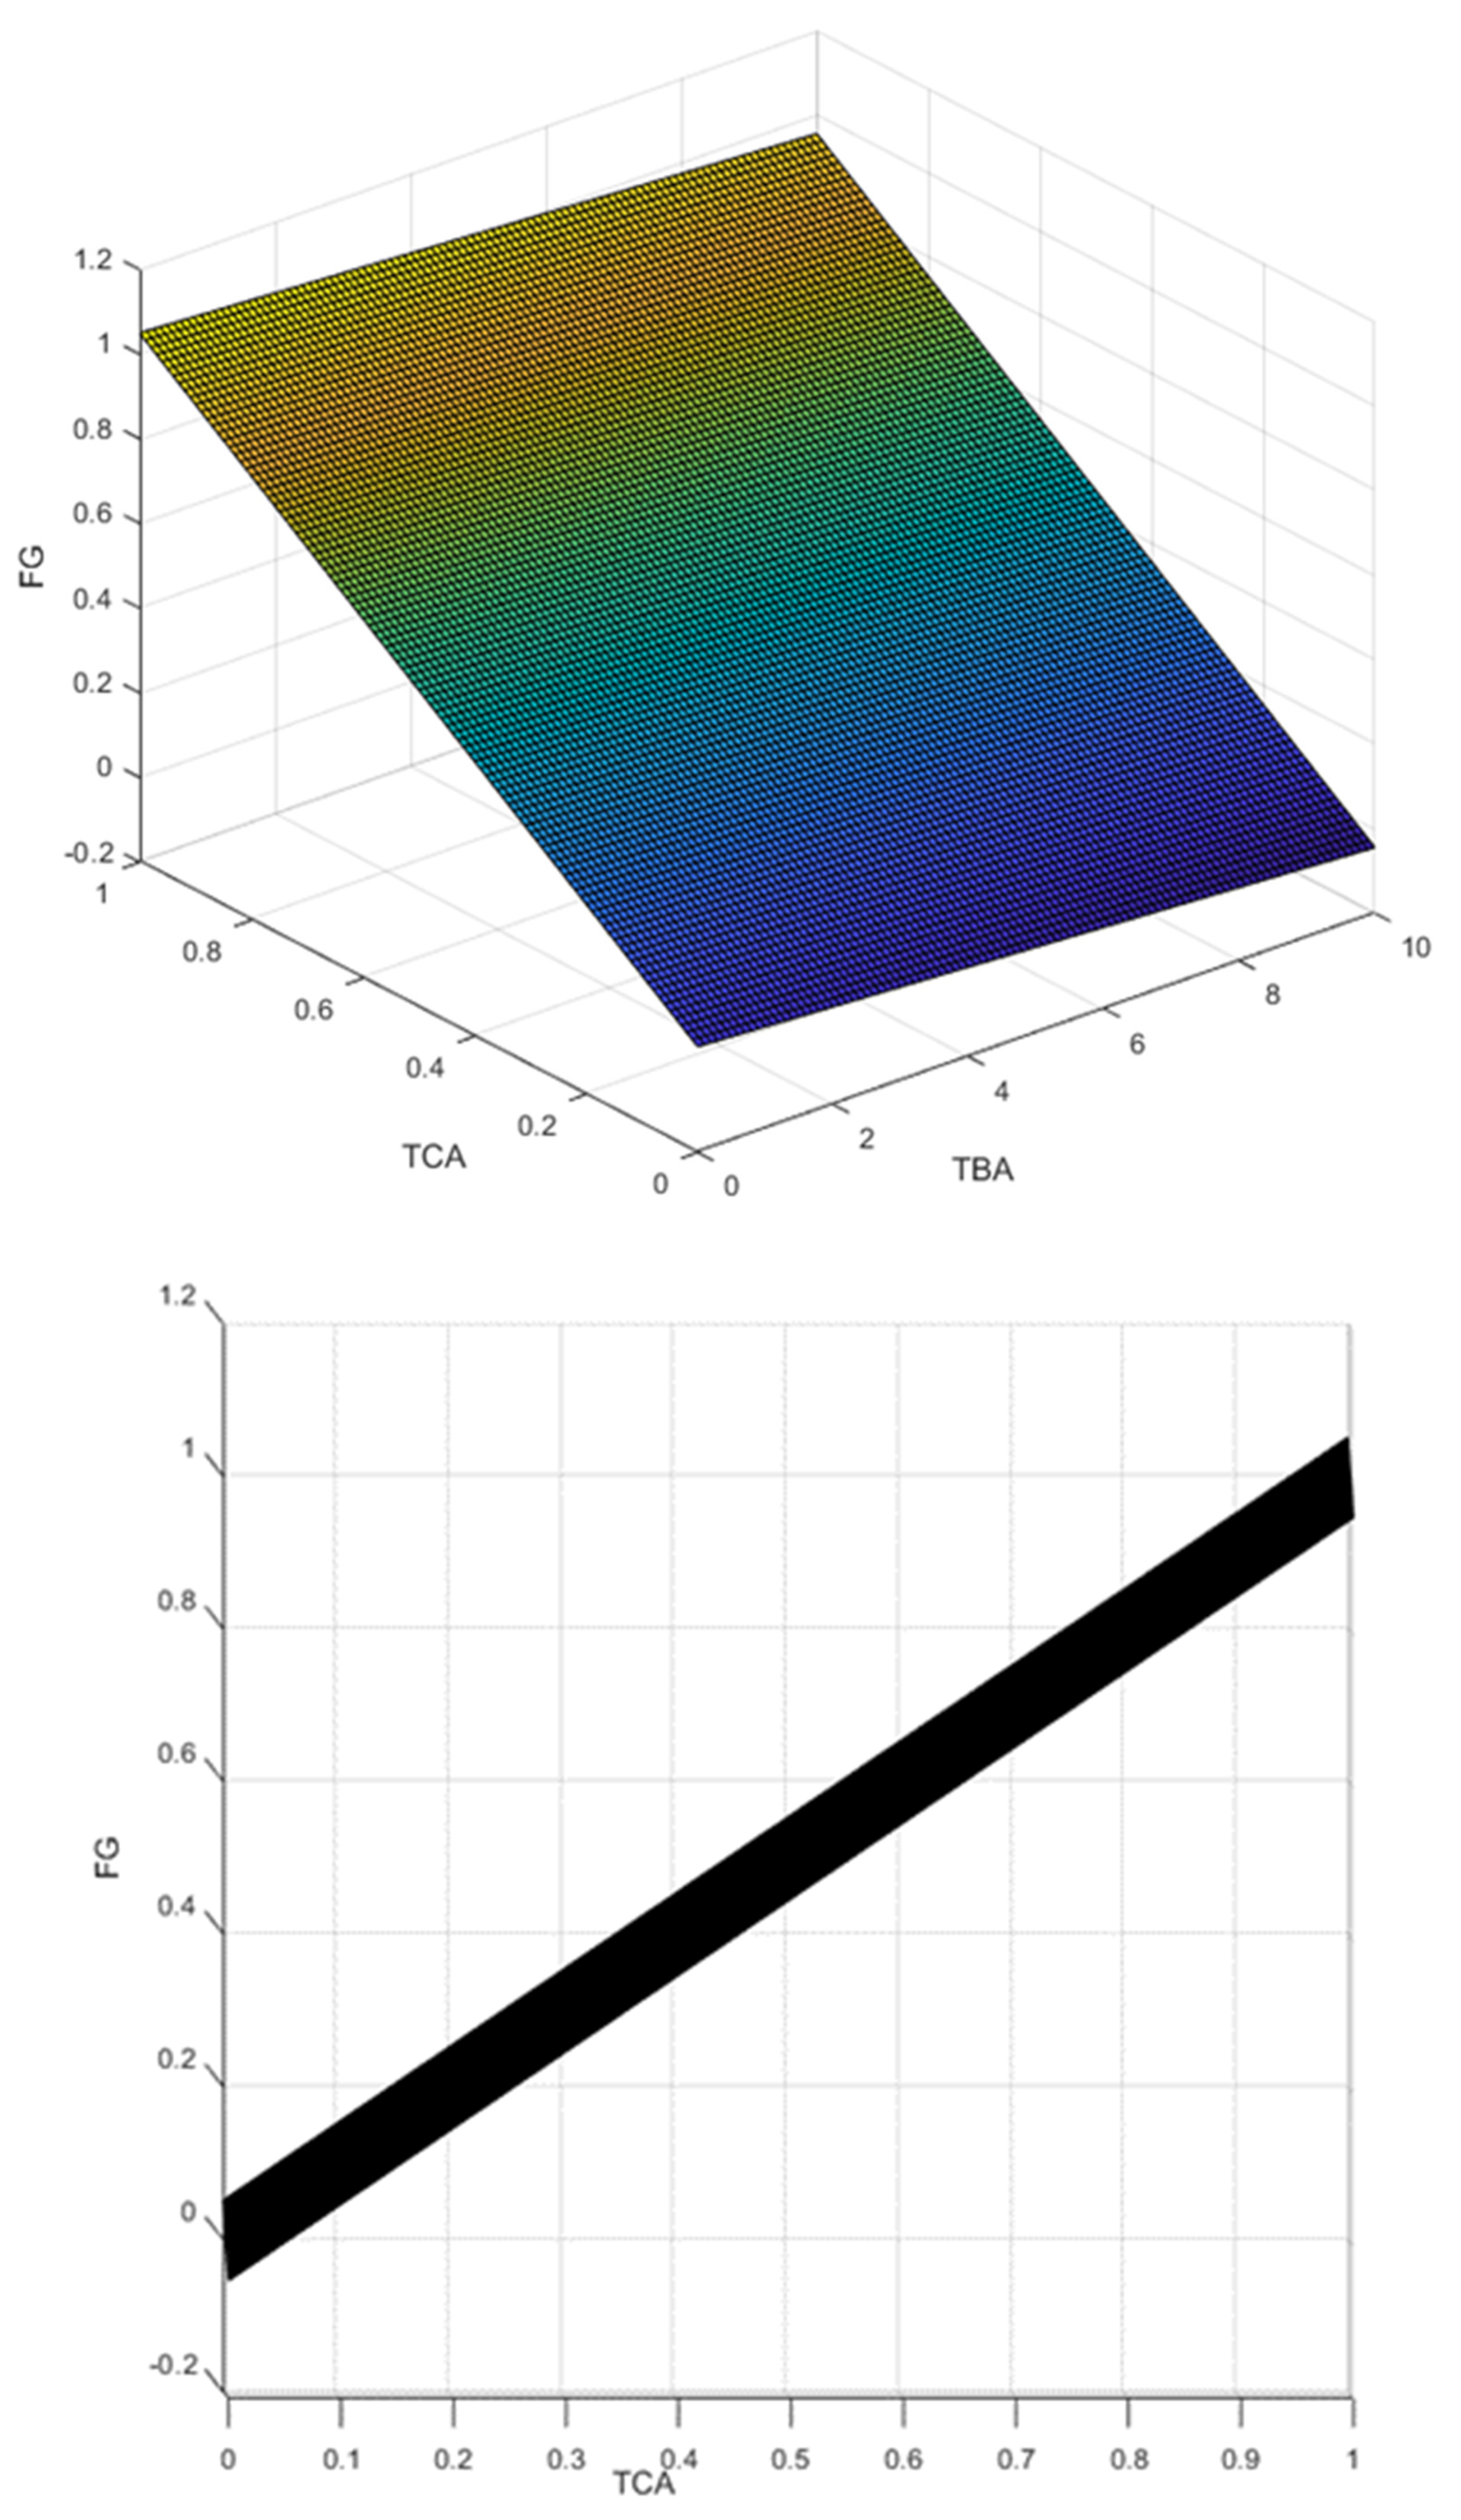
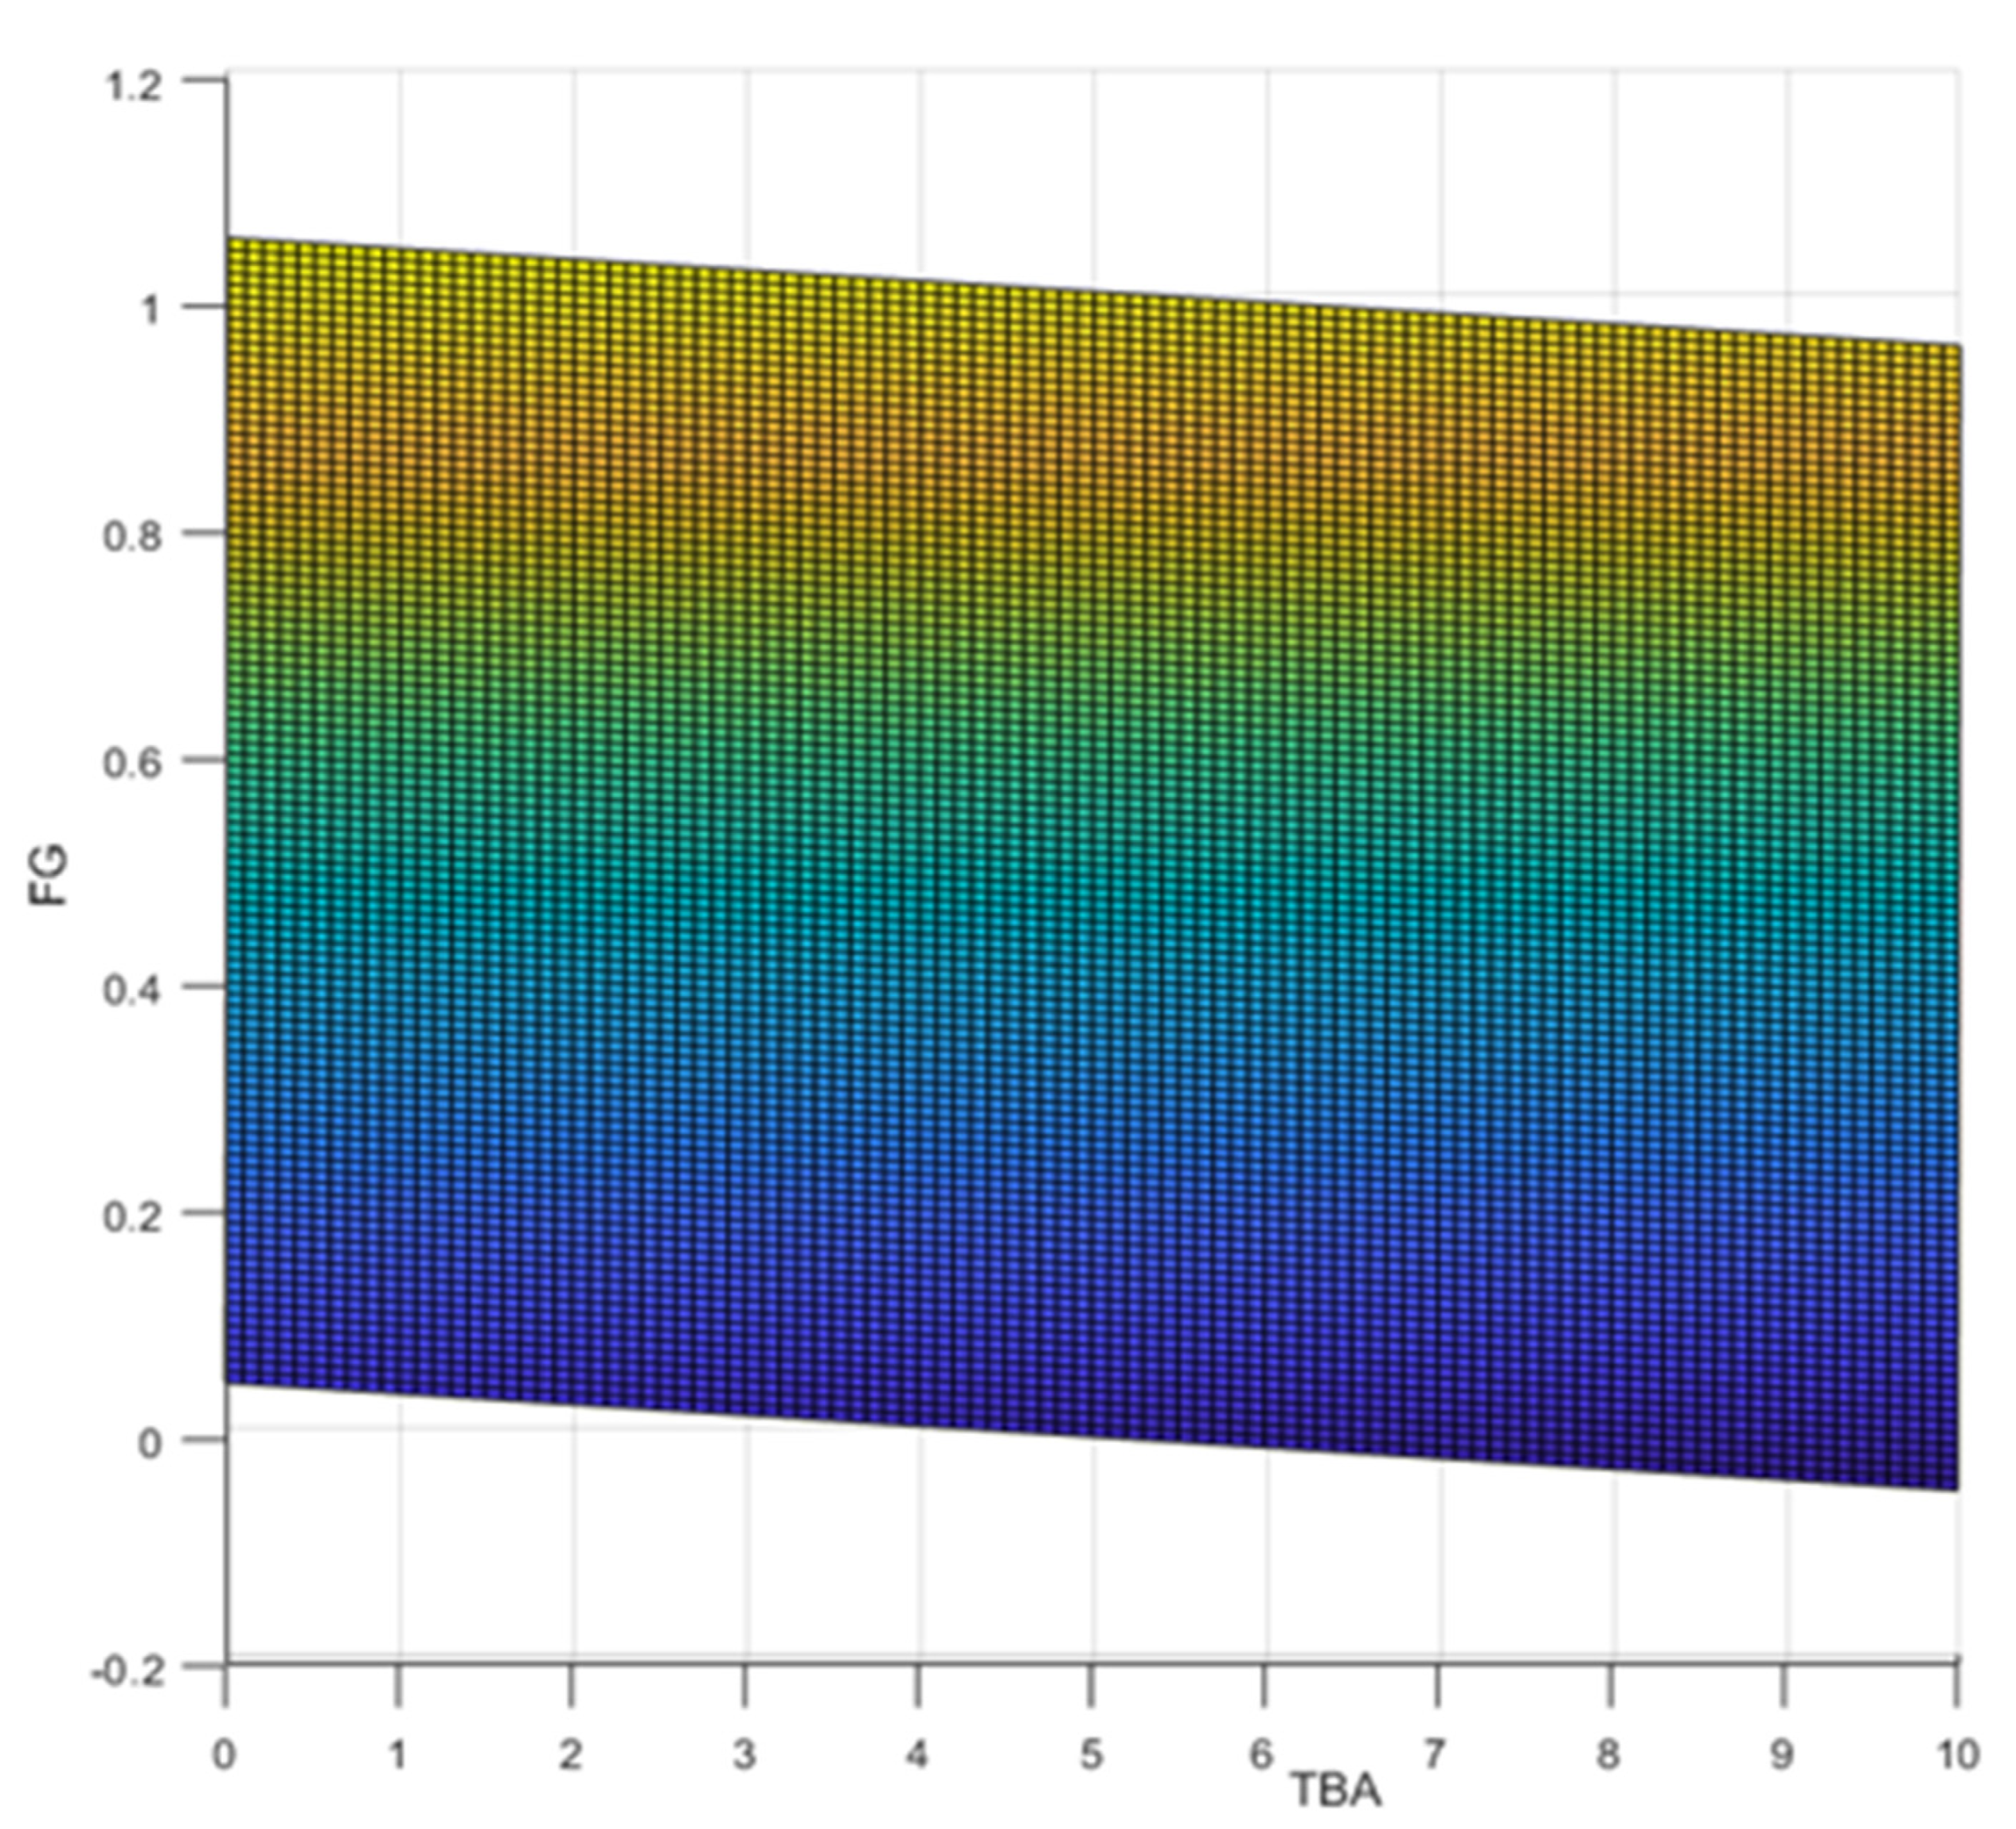
The obtained results are presented in the diagram in
Figure 7. As can be seen, the
coefficient has the greatest influence on the value of
. Along with its increase,
approaches the value of one, which in practice means that the use of
the single-form model approach is not profitable. The sensitivity of the
value to changes in the
coefficient is much lower.
The above observation leads to the following conclusion:
A low value occurs with a low value. This means that managers should strive to lower the TCA of project teams. In other words, within development teams, it is important to keep the time to fill one cell of the VM () as short as possible. The smaller it is (in relation to the time to embed one variable field into the form; ), the greater the benefit of using the single-form model approach.
4.1.3. Assessment of the Variability of the DG, Depending on the Change in the Size of the VM
For the purposes of the experiments, it was assumed that the coefficients of efficiency are constant and equal ; , while the size of the varies in the range ; .
For such parameters, the minimum of the was determined for which the single-form model is less expensive than the multi-form model, i.e., .
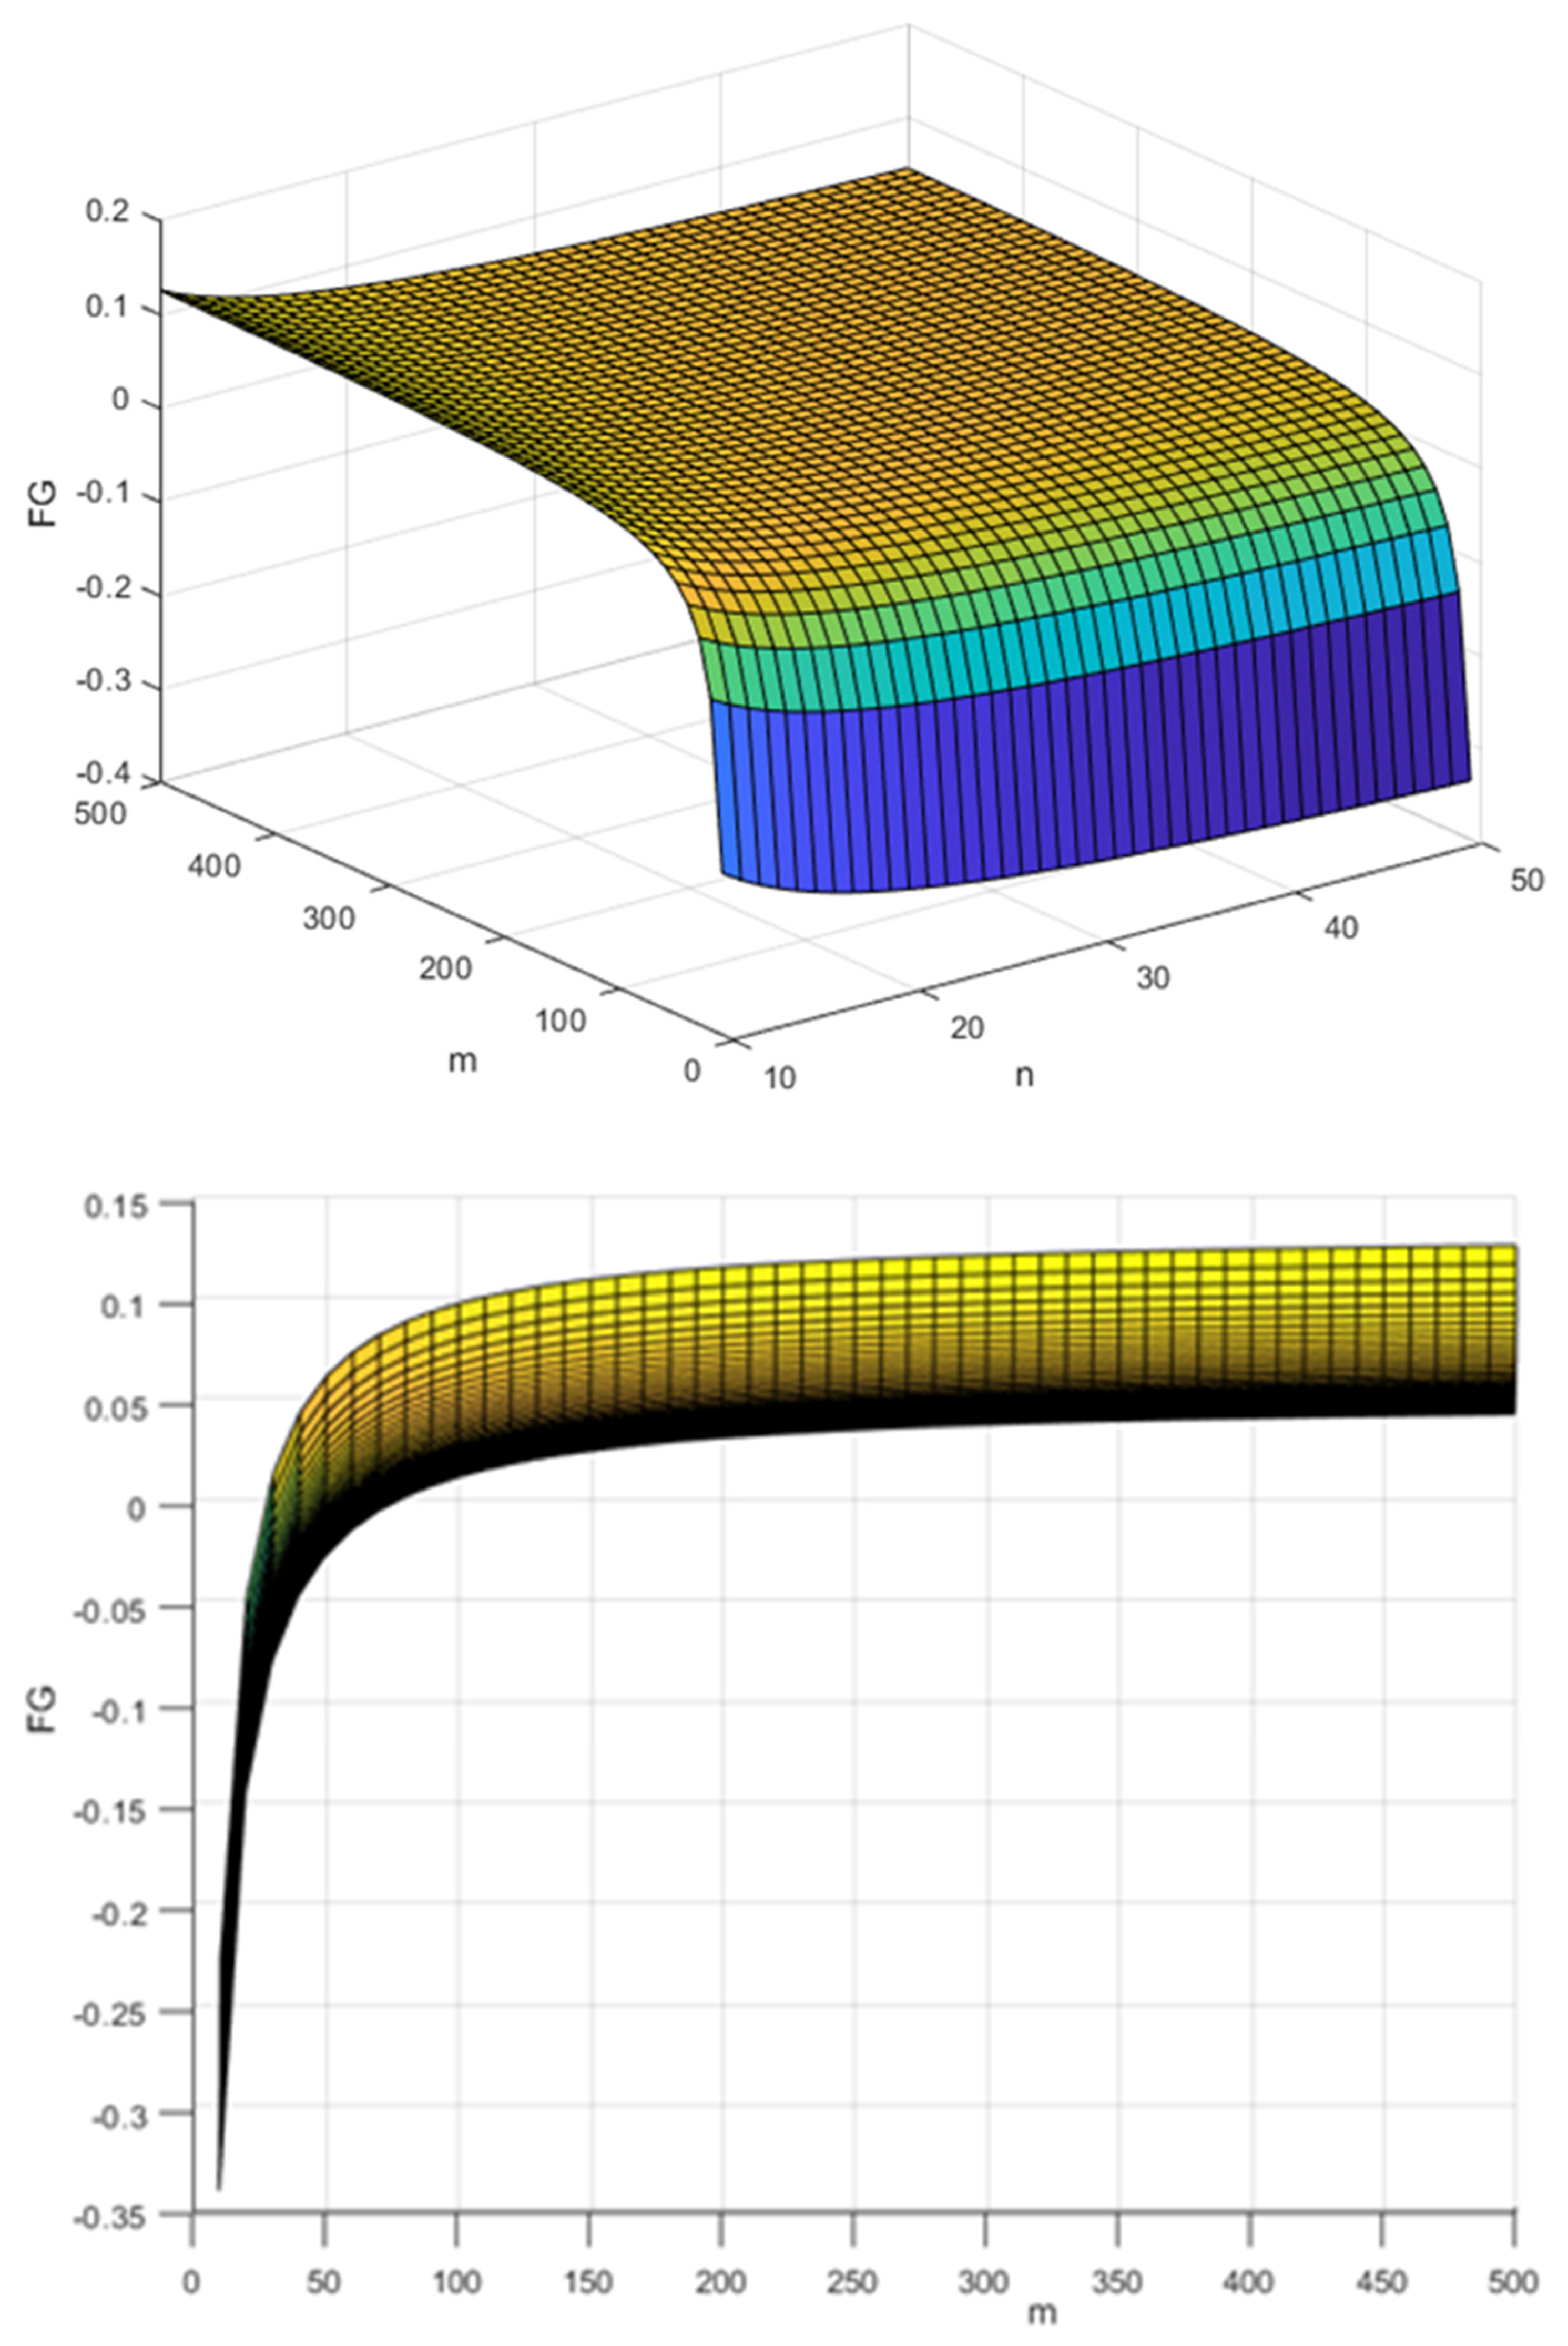
The obtained results are presented in the diagram in
Figure 8. The presented diagrams show that the
is slightly dependent on the variability of parameters
and
m (
). However, it is worth noting that
decreases with the increase in the number of tasks and with the decrease in the number of variables.
The single-form model approach is therefore dedicated to processes with a large .
4.2. Quantitative Experiments
The purpose of quantitative experiments is to assess the value of the and recommend a more favourable modelling approach for real implementations of business processes.
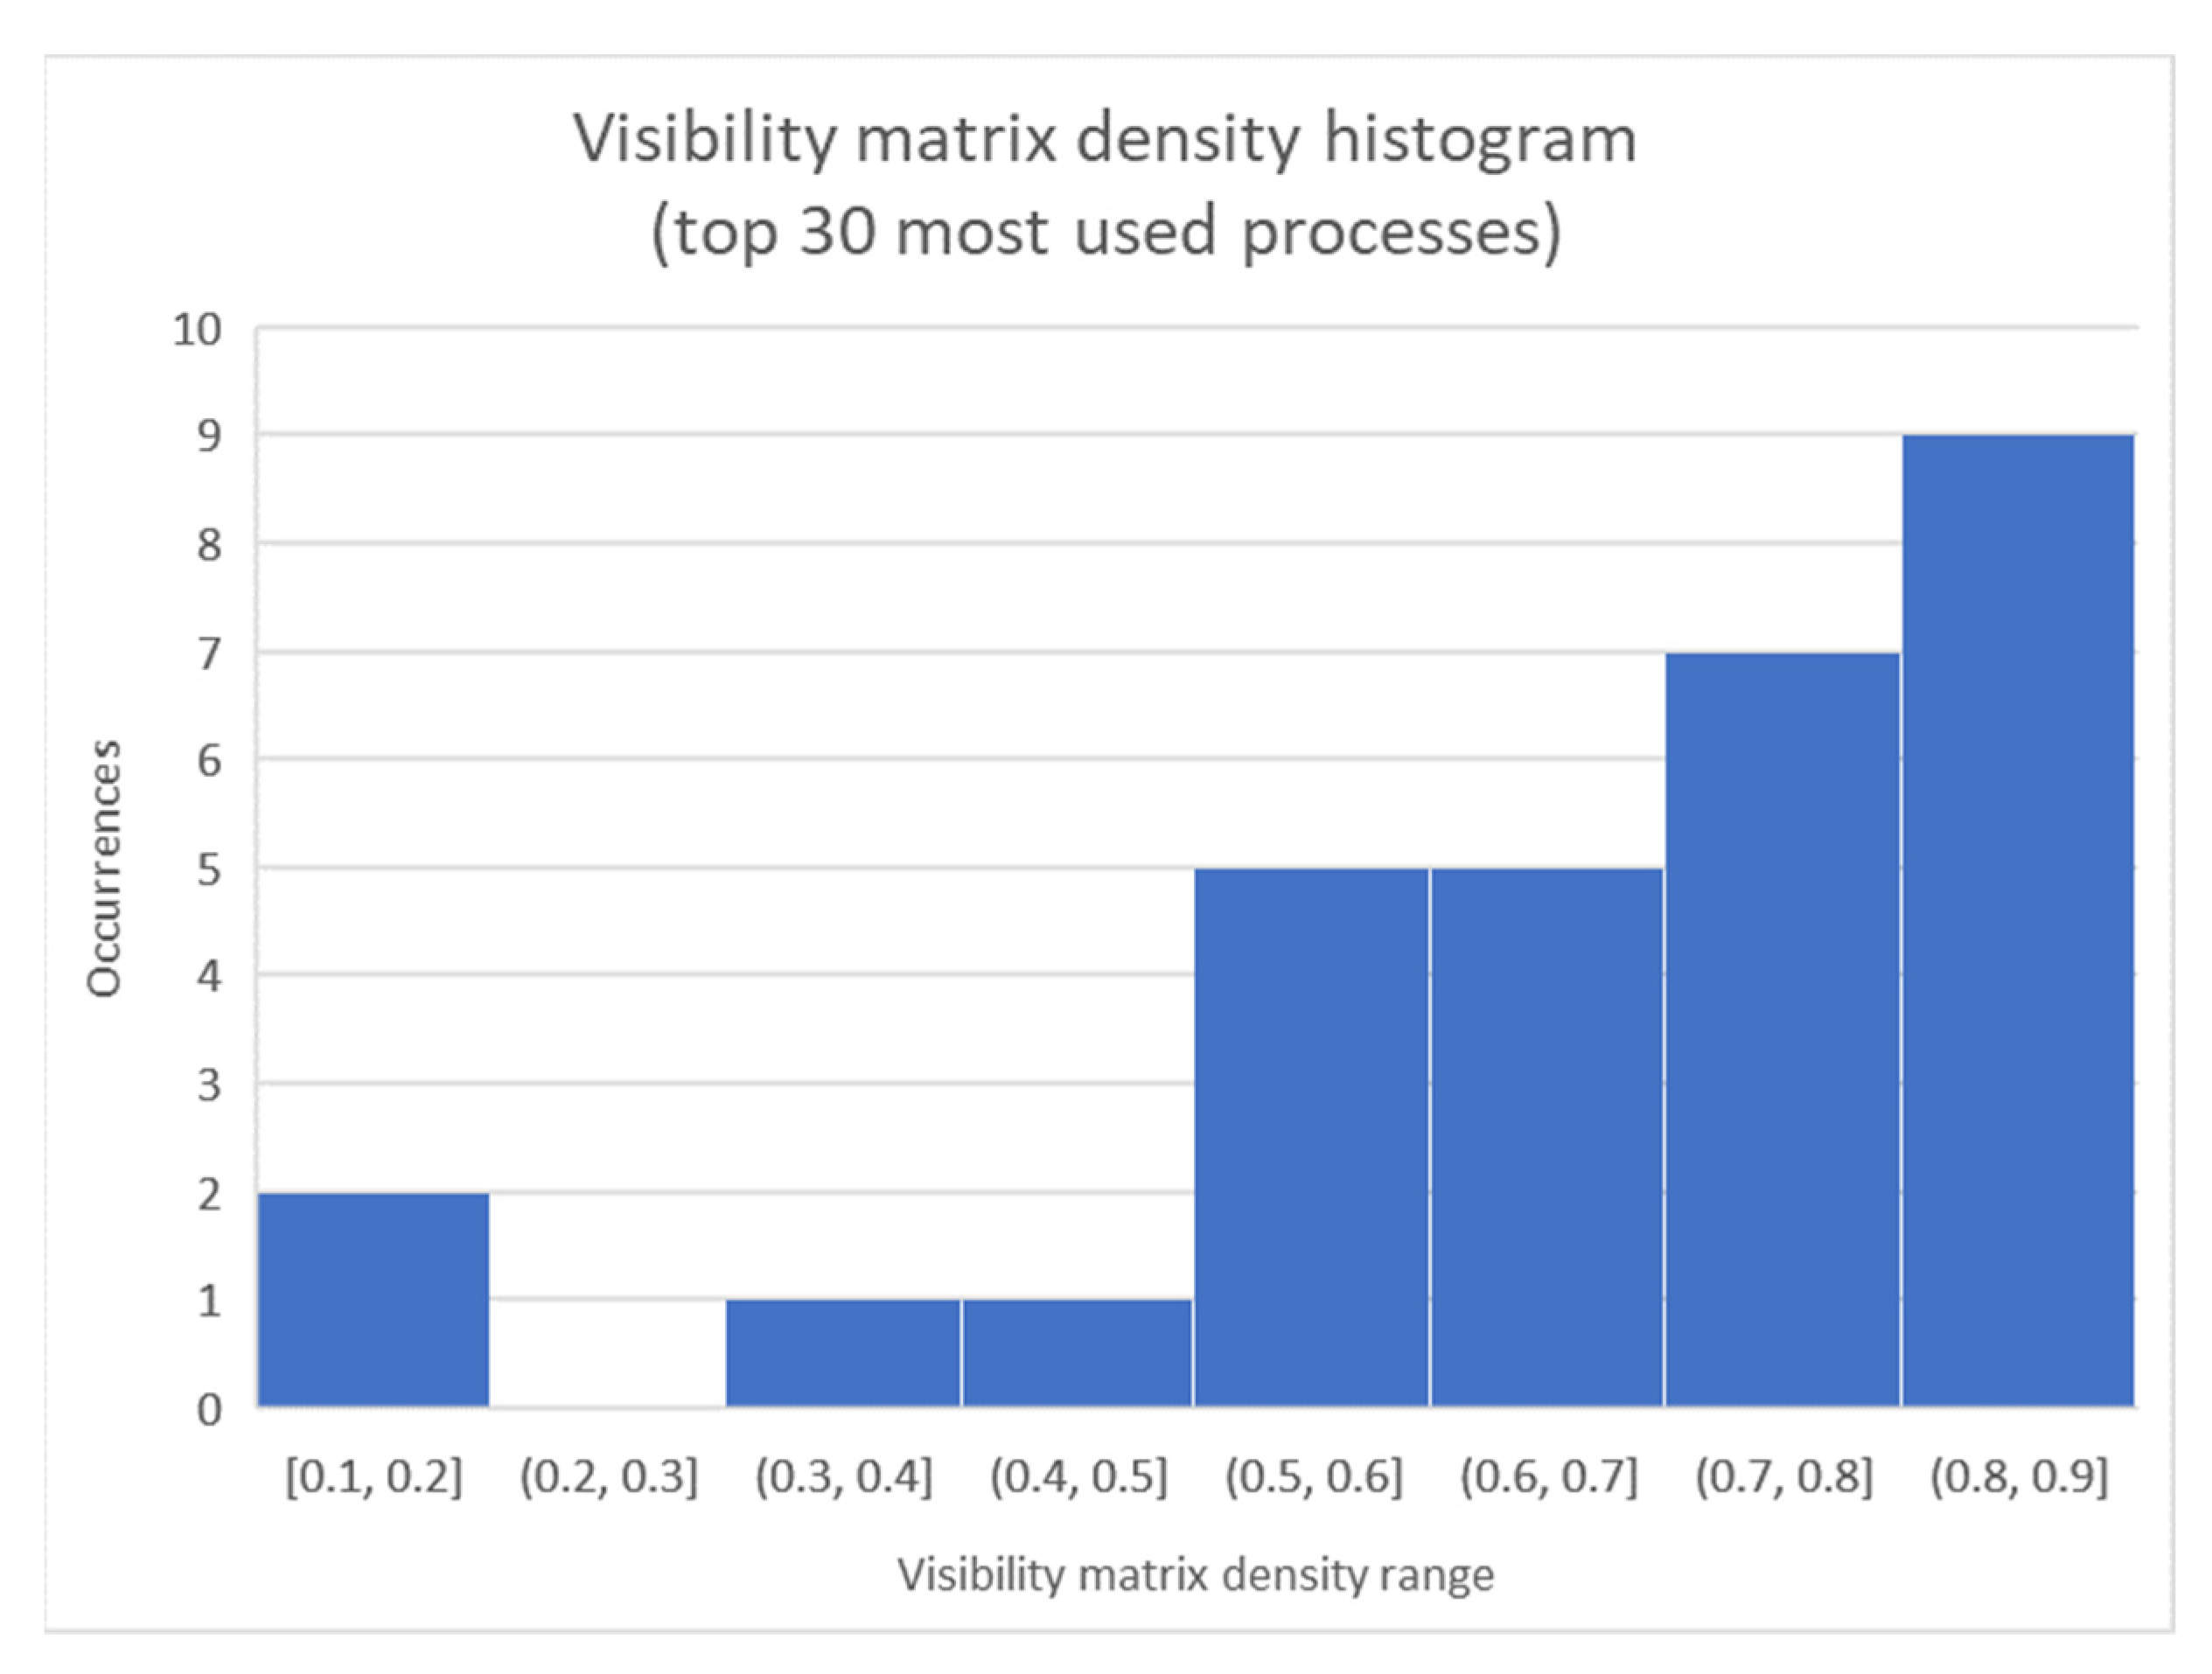
For the purposes of the research, from among nearly 100 business processes, the 30 most-utilised were selected. These processes were implemented in real trade and production enterprises as well as state administration units in 2009–2020. For each of the processes, the following were identified: the number of tasks
the number of variables (
), and the visibility matrix density (
). A histogram illustrating the distribution of
values is shown in
Figure 9.
As is easy to notice, most of the processes (26 out of 30 analysed processes) are characterised by a density .
Moreover, the
and
efficiency coefficients for 11 real developers were identified. The results are presented in
Table 4.
The subject of the analysis was the assessment of the
for each of the analysed business processes and each analysed project team (
Table 4). Then, answers were found to the question of whether it is beneficial to use
the single-form model approach in implementing a given process. For this purpose, the value of density
was determined for each of the processes and compared with the limit value
. The obtained results are presented in
Table 5 and in
Figure 10.
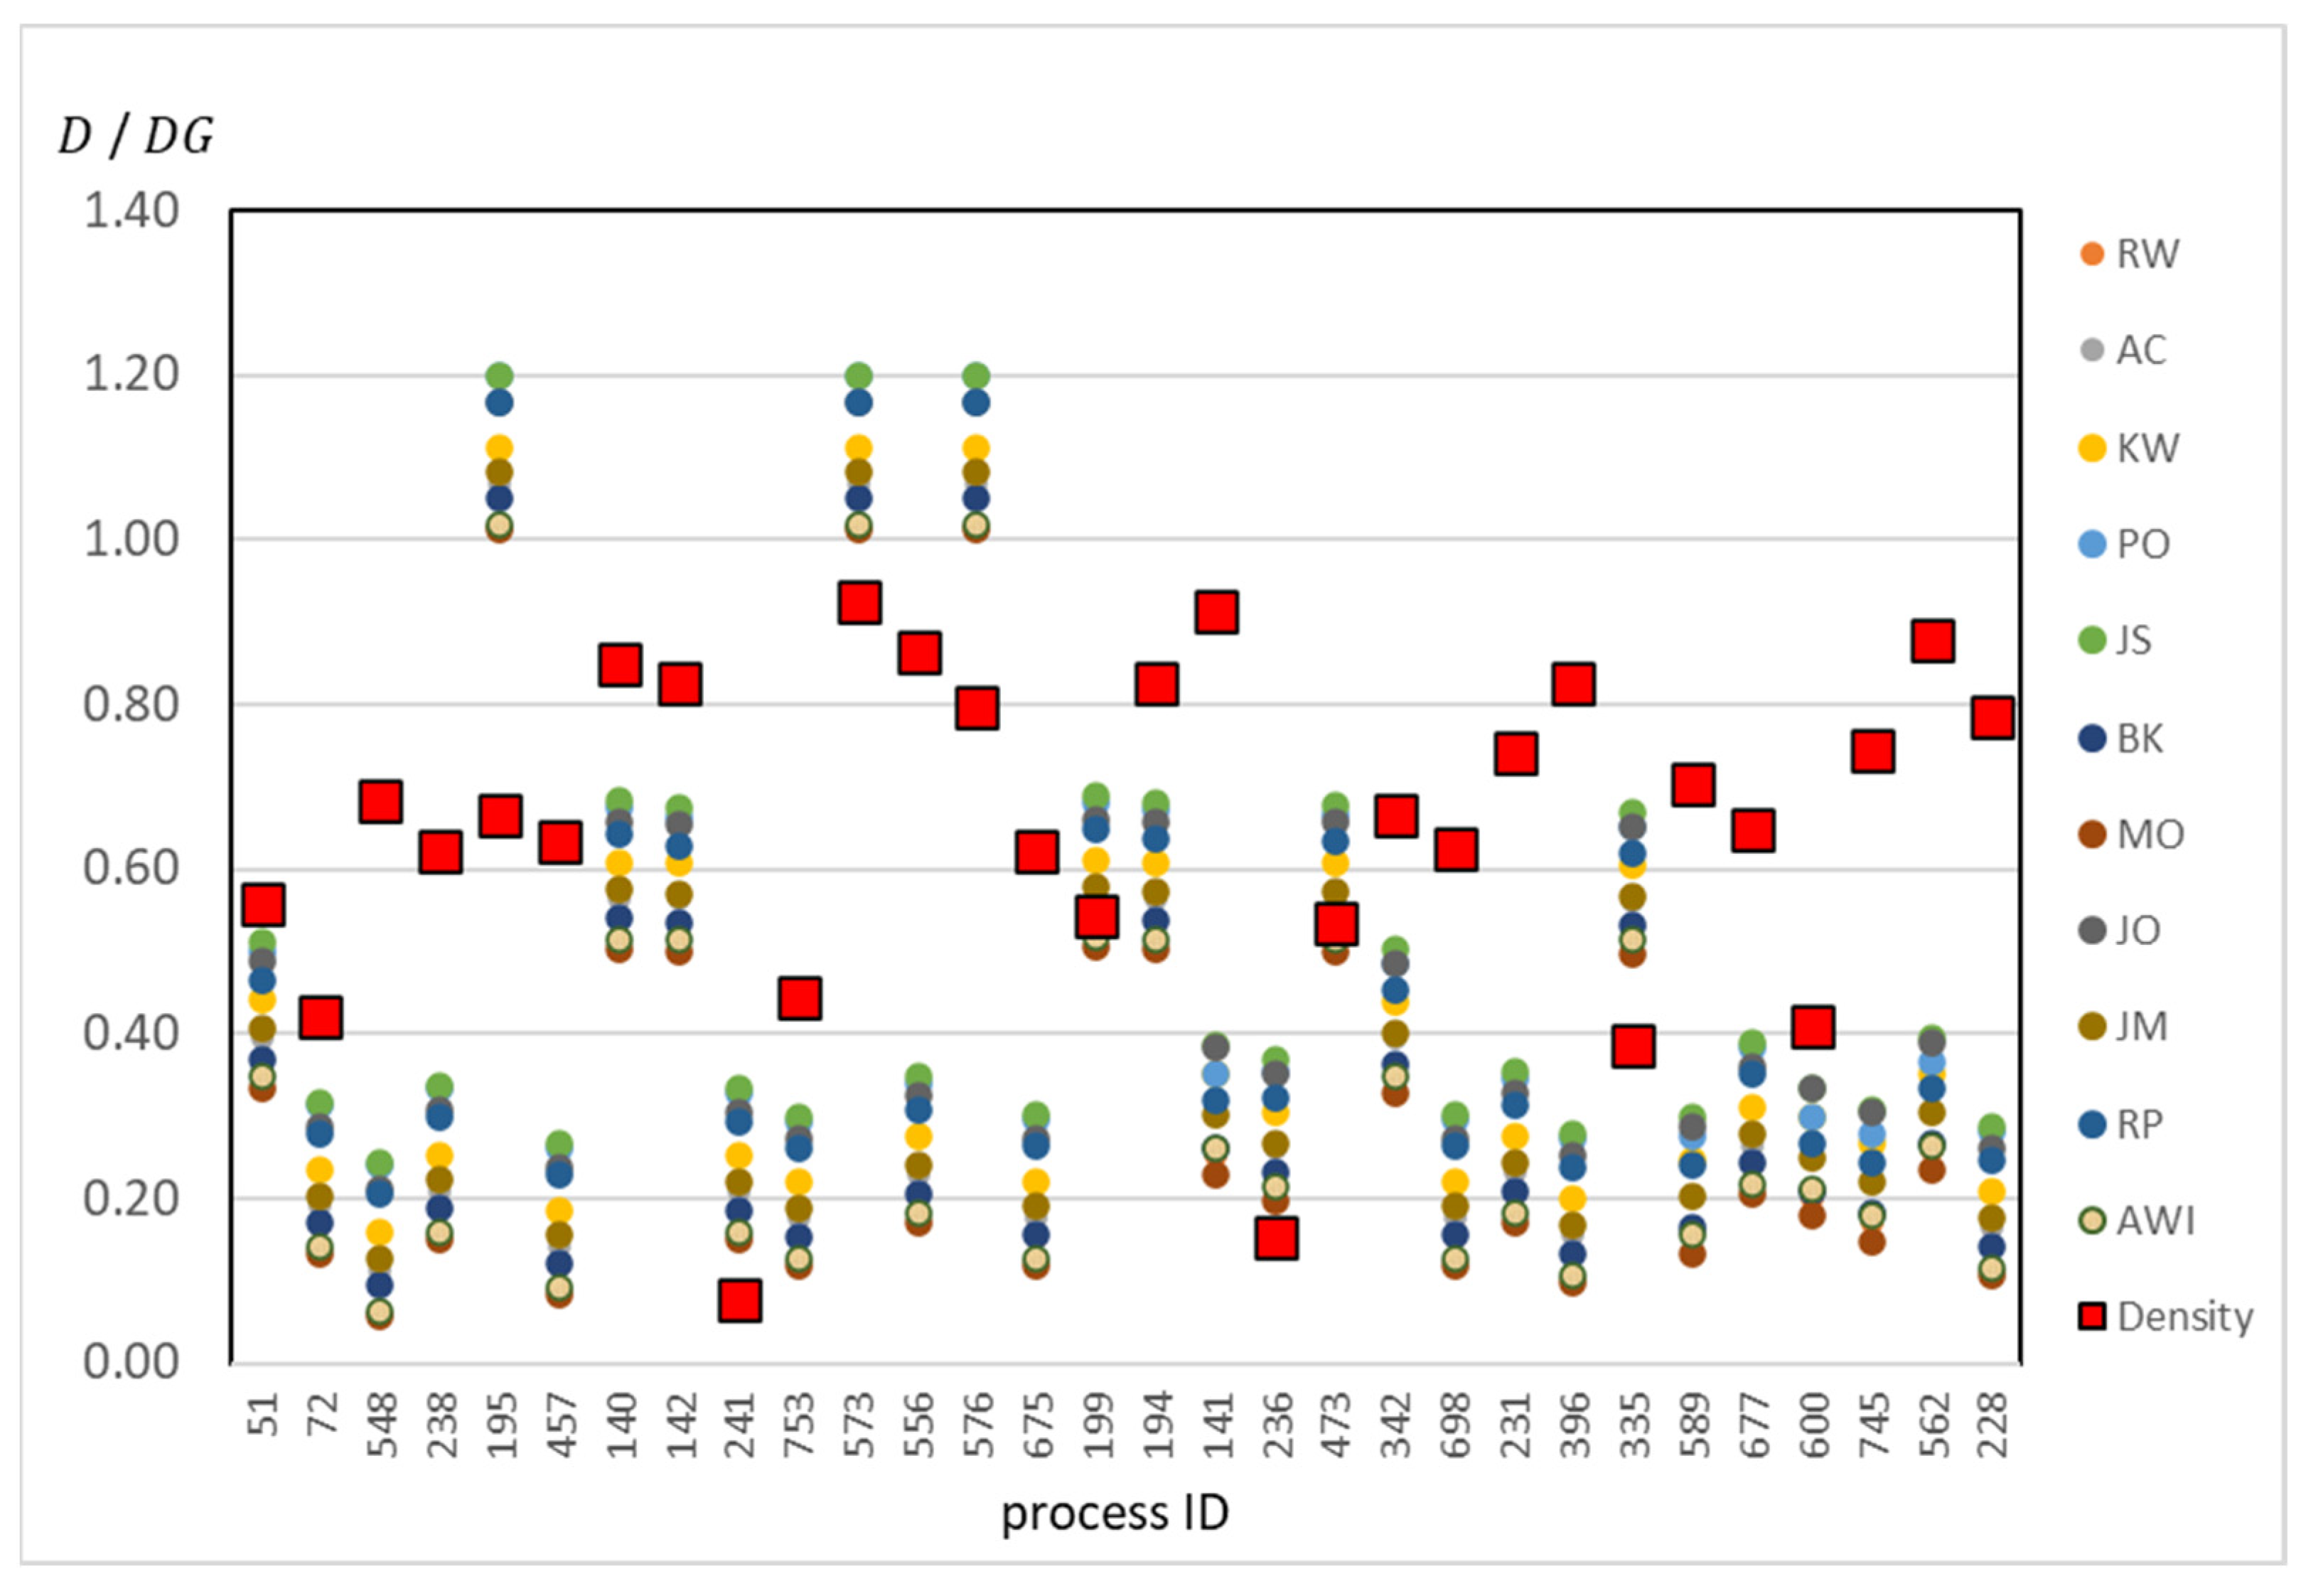
The densities (
) for the business processes under consideration are marked in
Figure 10 with the symbol ν, while the
for subsequent project teams are marked with colours as in the chart legend As is easy to notice, for most of the considered processes it is more advantageous to use the single-form model approach (i.e., the condition
is satisfied). The exceptions are:
business processes #195, #573, and #576, where the number of tasks equals one (),
business processes #241 and #236, where the density of the visibility matrix was so low that the use of the single-form model approach is unfavourable () (in these processes, tasks hardly share variables with each other), and
business processes #199 and #473, where the advantage of using the single-form model approach depends on the development team (). For example, for business process #199, the single-form model approach is recommended for 5 out of 11 developers.
The presented results confirm the conclusions found in the qualitative experiments. Most of the business processes encountered in practice (in this case, 76% of processes) consist of tasks that share most of the variables. In such situations, the value of of the is much higher than the limit value resulting from the performance indicators of real development teams (Theorem 1 is satisfied). For such business processes, the single-form model approach is recommended.
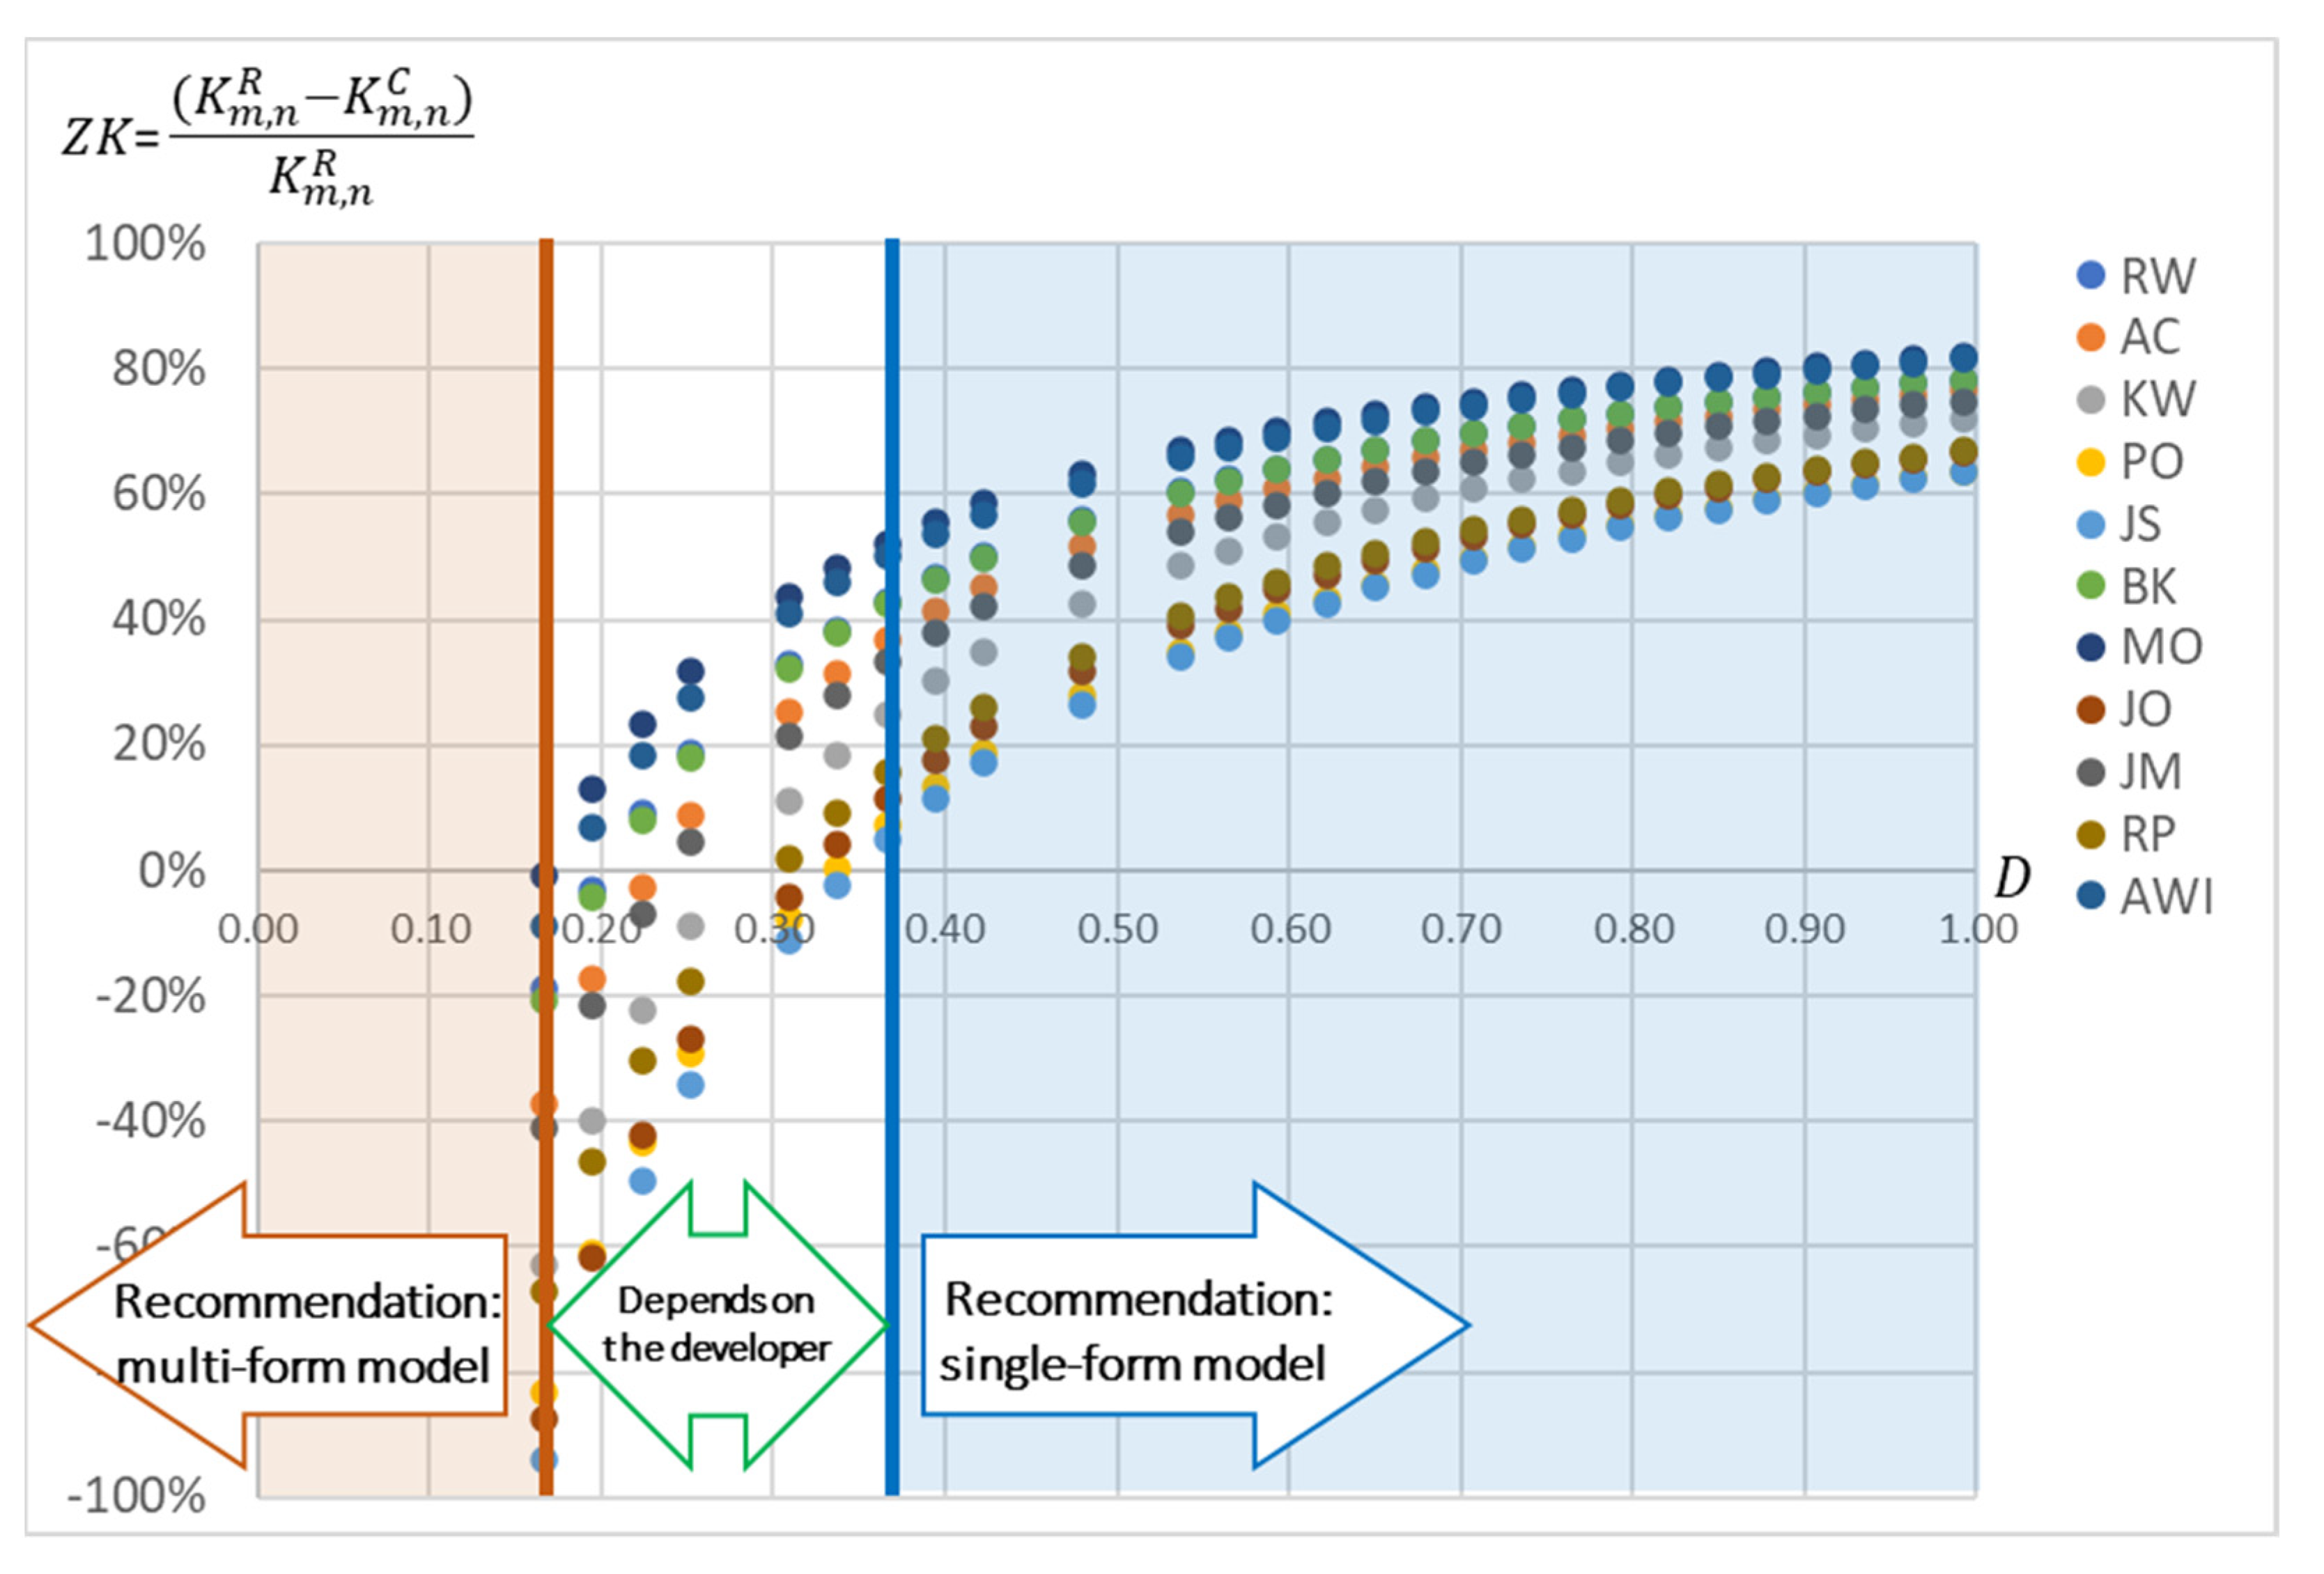
It is worth emphasising that the higher the
, the greater the benefit of using this approach. To illustrate this relationship, an additional parameter was introduced:
. It determines the relative time gain that will be achieved by using the
single-form model. In other words, the value of
corresponds to how much the implementation time of the business process will be shortened (for
) or extended (for
) as a result of the use of the single-form model approach.
Figure 11 shows the change in the value of
depending on the value of
. The calculations were carried out for a process containing
tasks and
variables (the process parameters correspond to the average of the analysed business processes in
Table 5). It was assumed that the developers from
Table 4 were used to implement the business process. As is easy to see, the value of
increases with the
of the VM. After exceeding the value of
, it is better for all developers to use the
single-form model approach. It is also worth emphasising that the lower the
, the greater the differences in the value of
for different developers. Differences between developers’ productivities, however, become blurred with high
values.
The obtained results show that the profit achieved with the use of the single-form model may be as high as 80% (
Figure 11). For a business process containing
tasks and
variables, the time gain (for the most productive employee) will be:
In the extreme case (80%), the use of the single-form model allows for the reduction of the implementation time from 50.73 [h] to 10.37 [h].
5. Conclusions
Tools for building applications based on business process models can use two approaches to build forms: (1) a separate form for each task or (2) one common parameterised form for all tasks. The conducted research answers the question of which approach yields better results from the productivity point of view, i.e., the cost and time of implementing the user interface application.
Qualitative experiments allowed us to determine which properties should characterise the business process so that it would be beneficial to apply the single-form model approach to its implementation. They also answered the question of what determines the choice of method, i.e., which factors affect the assessment. It turns out that the greatest impact on productivity in the production of electronic forms that support the tasks of business processes is due to the density of the visibility matrix () and the completion times of GUI components, i.e., the project team’s productivity (measured by the indicators meaning, respectively, the time to embed one variable field into the form (), the time to prepare a blank form (), and the time to fill one cell of the VM ()).
Quantitative experiments answered the question of which pragmatic values of the parameters are important for choosing the implementation method for real business processes and real project teams. They allowed us to determine the most common densities of visibility matrices and to determine the actual construction times of data entry forms in specific project teams.
The following conclusions should be emphasised:
The choice of the method of building forms to handle tasks in business processes depends on the density of the VM () and the productivity coefficients , .
The most sensitive parameters are and ; the least sensitive parameter is .
In practice, the significance of the conclusions from points 1 and 2 above comes down to the following rule: the use of the single-form model is more advantageous when is minimal. This is obtained, for example, when the project manager selects the production technology where setting parameters in the VM requires as little time as possible. This is an important feature of the LCDP that affects productivity.
In real IT projects, the densities of the VMs usually exceed the value of . That means that most of the process variables are reused among subsequent tasks.
In real project teams, the time of building form elements is characterised by a large variance depending on the developer. However, most of the results show significantly shorter parametrisation times for the FM and VM compared to the construction times of separate forms. For most developers, the single-form model approach results in shorter implementation times (only in 2 out of 30 cases was there a situation where the single-form model was unfavourable, and only for some developers).
Considering the real productivity of project teams and business process models, in an overwhelming number of cases, it is more beneficial to use the single-form model approach with the use of VM.
There are few cases where it is justified to use the multi-form model. These are most often exceptional situations, such as single-task processes and extremely ineffective project teams.
The results of the work presented in this article, in the field of theoretical research, introduces models that allow us to determine the workload needed to build user interfaces as part of supporting business processes on the LCDP. The effort determined in this manner can then be compared for different approaches to user interface implementation. This allows one to determine which approach is most efficient.
From a practical point of view, our work introduces the idea of using a single form to build a user interface that allows one to handle all tasks of the business process. In addition, they introduce the concept of a VM, which allows one to differentiate the appearance and scope of data presented to the end user when handling tasks.
Our research and the results achieved constitute a benchmark for possible future solutions. This is due to the fact that in the literature so far, the problems of user interface development with different approaches to the data usage modelling in processes have not been discussed. Each subsequent solution can be compared to the multi-form approach and single-form approach described in this article.
The conducted experiments have shown that under certain conditions (
Figure 11—green arrow), it is not possible to clearly define which model is always more favourable for a given project team. Therefore, the concept of developing a hybrid model was created. Future work will focus on introducing a hybrid model that will identify subsets of business process tasks for which it will be profitable to use a single form. Such a hybrid approach opens the possibility of even better optimisation of the workload necessary to build user interfaces for the entire business process.
The workload optimisation in this case is understood as the process of assessing and selecting the appropriate modeling approach (analysis process) as well as determining the parameters of the development environment (synthesis process) that guarantee its effectiveness (design time for screen forms). While research in the area of the analysis process is currently encountered in the literature [
14,
15], the synthesis of the development environment parameters comes down to the application of good practices and gained experience. The methodology of optimizing the development environment parameters (synthesis of the development environment) will enable the use of solutions dedicated directly to companies producing software. These solutions will allow the definition of the team building strategy, principles of cooperation, required performance, etc. The development of this type of methodology is the main goal of future work.

