
A Deep Learning Approach toward Energy-Effective Residential Building Floor Plan Generation


Abstract
1. Introduction
2. Materials and Methods
- Training phase (gray box): SD-GAN is divided into two sub-models. By learning from samples, Model 1 can generate FSL from BEP, while FSL-to-BFP translation is possible with Model 2. A refined SD-GAN network could be obtained after this phase.
- Generation phase (green box): after SD-GAN has been trained and qualified, the BEPs of three existing cases are fed into SD-GAN to generate the optimized BFPs.
- Simulation and evaluation phase (blue box): the energy consumption of the existing cases and the generated schemes are modeled for simulating separately by DesignBuilder, and the results are compared.
2.1. Deep Learning Network
2.1.1. Network Architecture
2.1.2. Network Training and Testing
- The processed training set is fed into SD-GAN for the training step. Model 1 takes BEP as input to output colored FSL. Model 2 takes FSL as input and produces BFP. The output will become closer to the real data as the generator and discriminator evolve simultaneously.
- The test set is used to test the capability of SD-GAN once the generator and discriminator have converged to an equilibrium state. The BEP of the test set can be input, and then the output generated results can be visually compared to the original image.
- The quantitative scoring method is used for the outcome assessment step. The generated results of Model 1 are evaluated and scored from the clarity of space allocation (CSA), the rationality of function distribution (RFD), and the clarity of color-block boundary (CCB) in turn (unacceptable: 0; bad: 1; not bad: 2; acceptable: 3; good: 4; very good: 5). The generated results of Model 2 are evaluated and scored from the wall-generated accuracy (WGA) and furniture-generated accuracy (FGA) in turn (unacceptable: 0; bad: 1; not bad: 2; acceptable: 3; good: 4; very good: 5).
2.2. Data Set Arrangement
2.2.1. Data Screening
- Entries with two or more floors were screened out to make the sample processing easier, and only those with a single floor were retained.
- Some entries were designed with variable space to improve space utilization. Entries with flexible variable space and extremely flexible functional layouts were screened out since this type of space cannot accurately define the functional zoning attributes.
2.2.2. Data Processing
- Uniform drawings: Redraw each entry’s architectural plans and unify the overall furniture style, doors, and windows of the drawings. Each functional space was characterized by specific furniture.
- Uniform annotation: The screened entries had a relatively similar functional layout, with a living room, dining area, kitchen, one or two bedrooms, study or workspace, bathrooms, and equipment rooms. According to the annotation principle (Figure 4), the FSL corresponding to the floor plan of each entry was first created. Then, the building area was filled with black to generate the BEP, as shown in Figure 5.
- Uniform labeling: Each individual image in the label has a size range of 256 × 256 pixels, and the label’s canvas size is 90 mm × 180 mm with a resolution of 72 ppi. As shown in Figure 6, this study requires two separate labels: one with FSL and BEP placed on the left and right sides and the other with BFP and FSL placed on the left and right sides.
2.2.3. Data Augmentation
2.3. Evaluation of the Approach: Case Study and Simulation
2.3.1. Case Background
2.3.2. Building Energy Consumption Simulation Based on DesignBuilder
3. Results and Implementations
3.1. Preliminary Training
3.2. Data Augmentation Testing
3.3. SD-GAN Implementation and Case Study
4. Discussion
4.1. Generative Design and Efficiency
4.2. SD-GAN Training
- With the same network architecture, Model 2 performed remarkably better than Model 1, partly because the graphical features that correspond to FSL and BFP are more consistent. The network could easily perceive the correspondence between color boundaries and partition walls. On the other hand, the furniture varies more in different rooms. This implies that the network can quickly understand the mapping relationship between color and furniture arrangement. In contrast, the BEP-to-FSL mapping relationship of the Model 1 input is very ambiguous. The network may only be able to suspect from the proportional relationship of contours, orientation, etc. Hence, the learning ability performed weakly.
- There was rarely much difference between the learning performance of the 240 and the initial 90 samples after data augmentation. However, the learning ability of the 400 samples improved dramatically. This is probably a case of the network becoming stuck in a “local optimal solution” during the learning process. More samples help it to jump out of that optimal solution and solve faster to the global optimum. This also explains why Model 1-2 performed better than Model 1 with 400 epochs after only 200 epochs, improving the solving ability and saving a lot of repetitive and invalid learning.
5. Conclusions
- Trained an integrated RBFP generation network SD-GAN with energy-effective performance based on Pix2Pix with SD competition entries as sample set.
- SD-GAN with two steps of model configuration is capable of generating reasonable spatial and functional floor plans for single-floor residential buildings.
- SD-GAN trained with embedded energy-efficiency characteristics samples and also has the capacity to generate energy-saving RBFPs.
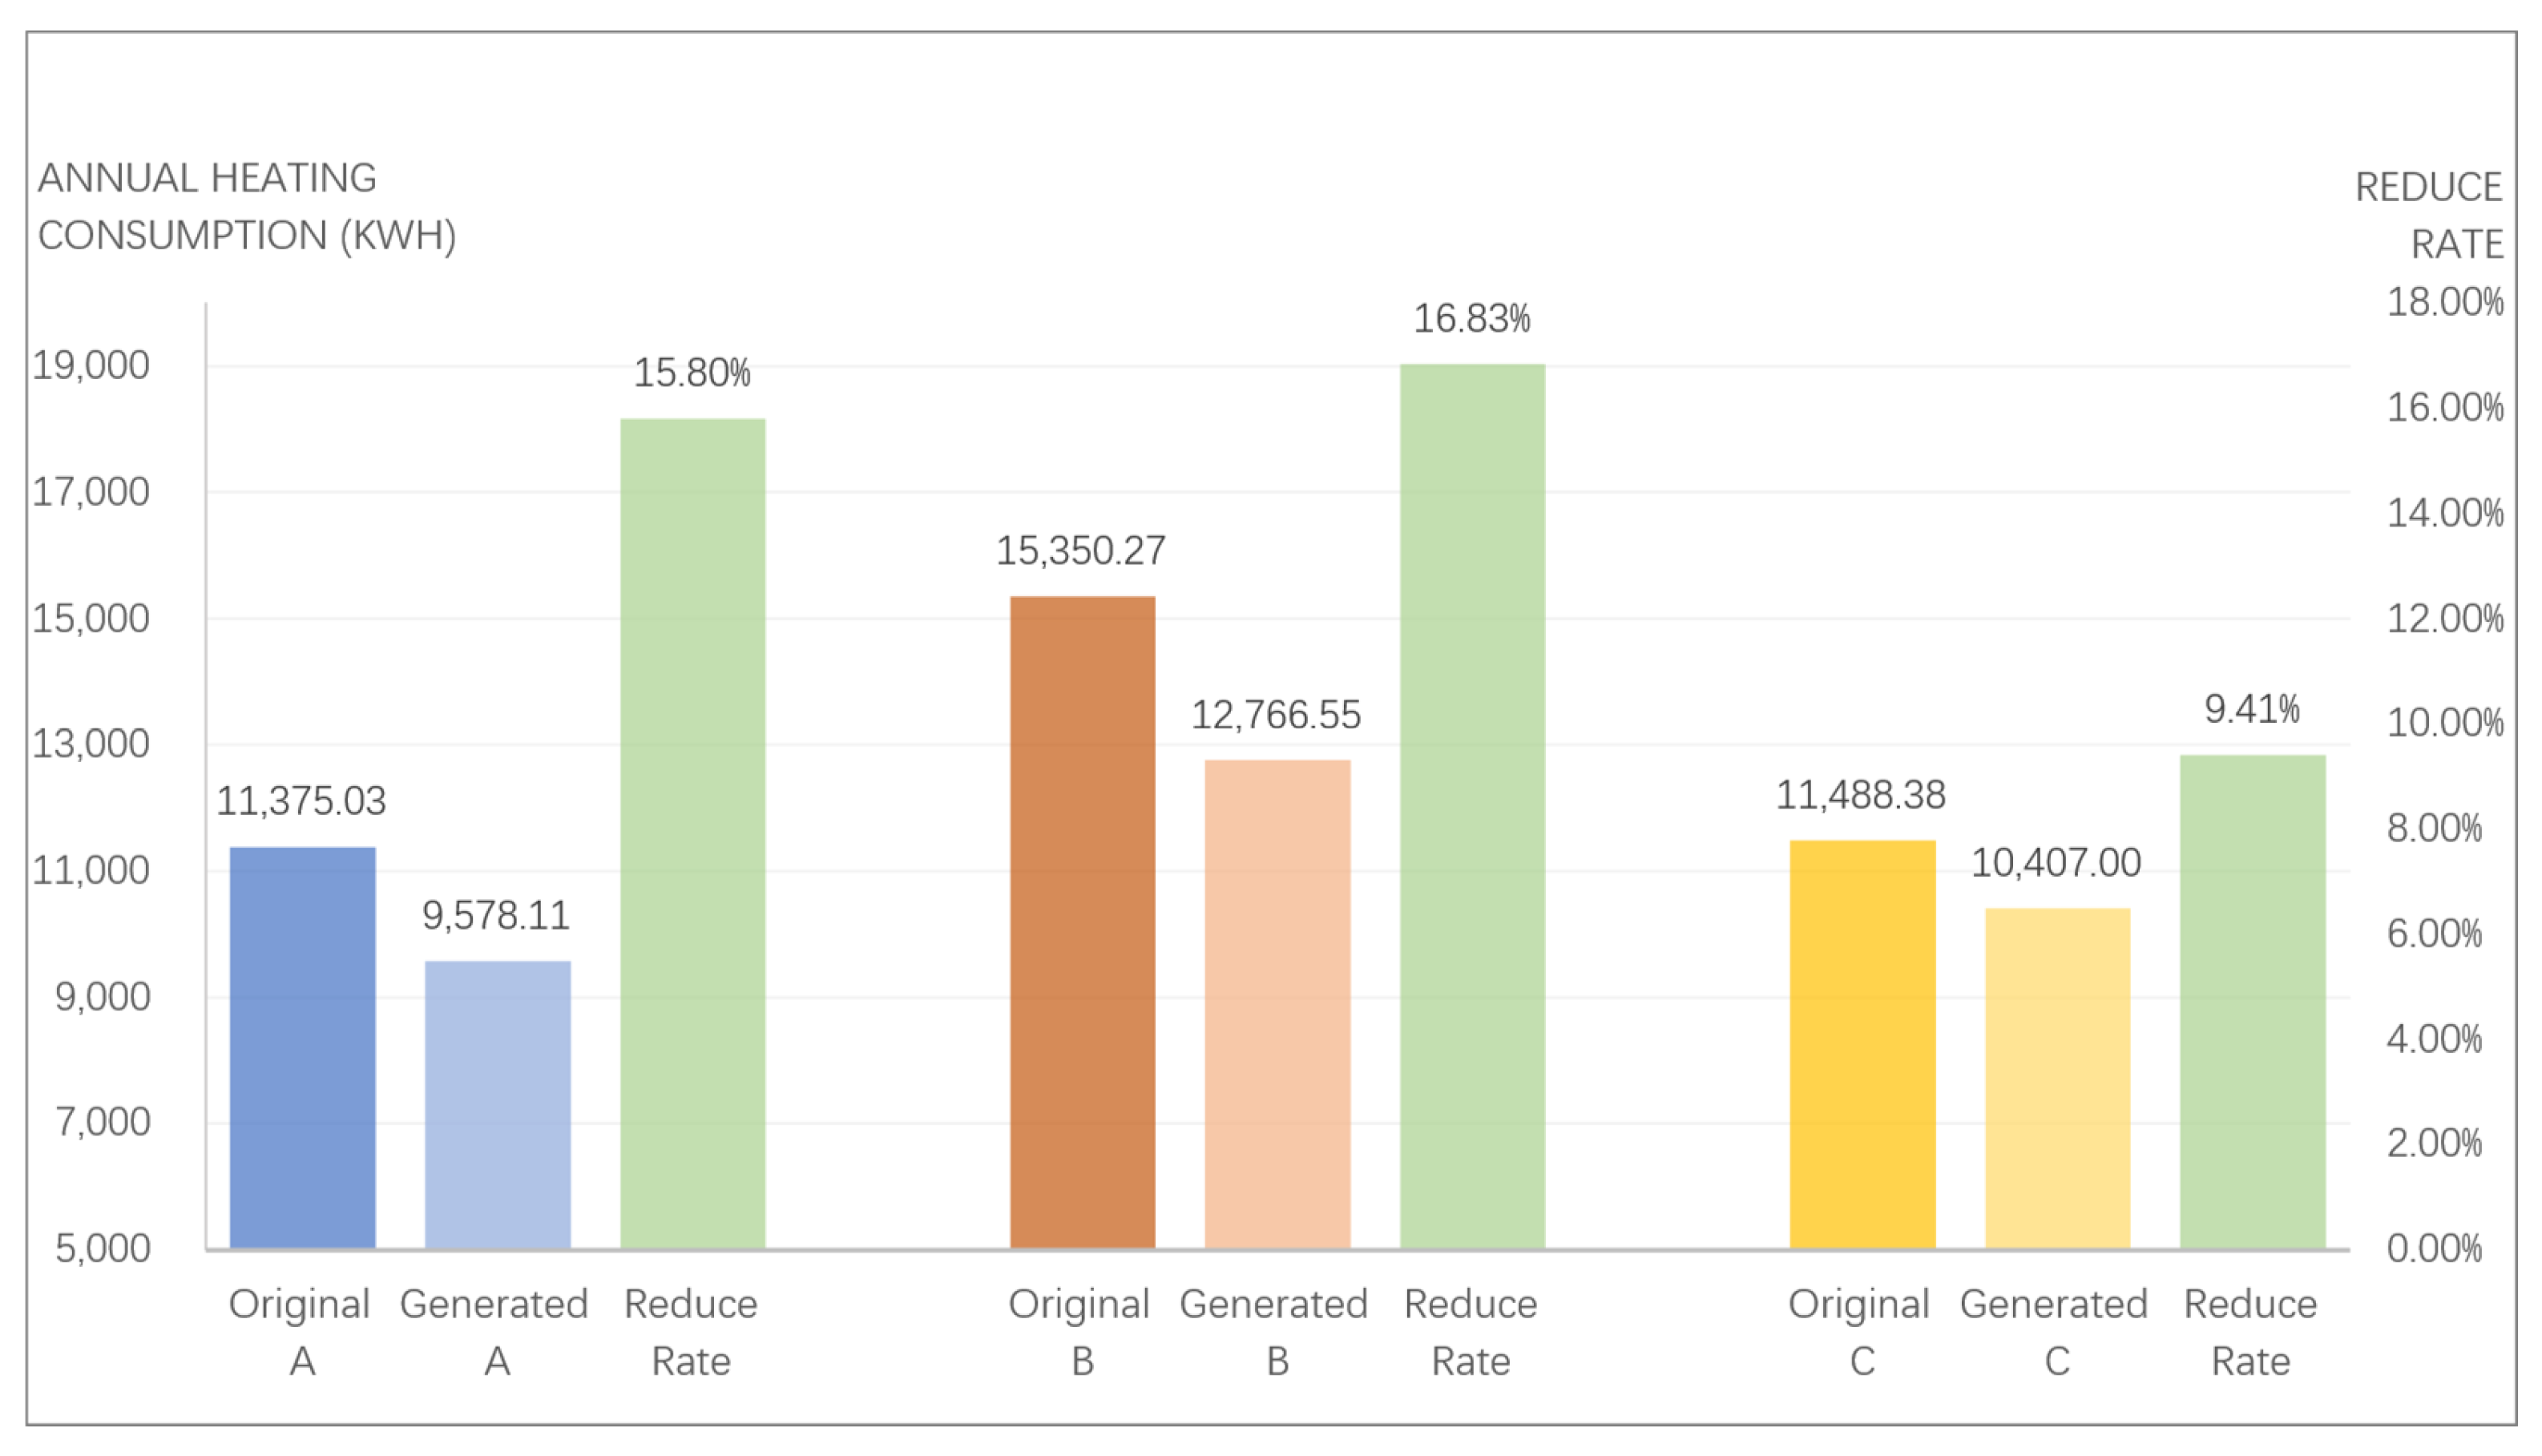
- Compared with three actual buildings by using DesignBuilder simulation, the RBFP generation network showed a positive effect in both optimizing the function arrangement and reducing energy consumption.
- Proper data augmentation method can significantly improve the network’s training results with small size sample.
- The screened entries with small shape differences may potentially limit the generative capacity of the network. The variability of the sample data should be expanded to enhance the generative possibility.
- Model training for multiple climate zones was not performed due to the limited data. The applicability under various climatic conditions will be investigated based on more samples.
- In design practice, the BEP, or building form, is an emerged result of complicated surroundings. Rather than being given, the complex external environment (road conditions, topographic features, surrounding business, urban context, etc.) may be considered in the future to generate BEP.
- The energy-saving design of a house is a complex process, including the design of various passive and active energy-saving strategies. In this study, SD-GAN has been experimentally demonstrated to learn latent SAP-solving strategies, resulting in certain passive energy-saving properties. In the future, it is necessary to build a more comprehensive model of an energy-effective generation network from the perspective of a 3D scheme, integrating both passive and active strategies.
Author Contributions
Funding
Institutional Review Board Statement
Informed Consent Statement
Data Availability Statement
Acknowledgments
Conflicts of Interest
References
- Rodrigues, E.; Gaspar, A.R.; Gomes, Á. An Evolutionary Strategy Enhanced with a Local Search Technique for the Space Allocation Problem in Architecture, Part 1: Methodology. CAD Comput. Aided Des. 2013, 45, 887–897. [Google Scholar] [CrossRef]
- Castellani, B.; Hafferty, F.W. Sociology and Complexity Science: A New Field of Inquiry; Understanding Complex Systems; Springer: Berlin/Heidelberg, Germany, 2009; ISBN 978-3540884613. [Google Scholar]
- Wu, J.; Shang, S. Managing Uncertainty in Ai-Enabled Decision Making and Achieving Sustainability. Sustainability 2020, 12, 8758. [Google Scholar] [CrossRef]
- Zhao, C.-W.; Yang, J.; Li, J. Generation of Hospital Emergency Department Layouts Based on Generative Adversarial Networks; Elsevier Ltd.: Amsterdam, The Netherlands, 2021; Volume 43, ISBN 8602134207. [Google Scholar]
- Boulila, W.; Ghandorh, H.; Khan, M.A.; Ahmed, F.; Ahmad, J. A Novel CNN-LSTM-Based Approach to Predict Urban Expansion. Ecol. Inform. 2021, 64, 101325. [Google Scholar] [CrossRef]
- Yu, D. Reprogramming Urban Block by Machine Creativity How to Use Neural Networks as Generative Tools to Design Space. In Proceedings of the 38th International Conference on Education and Research in Computer Aided Architectural Design in Europe, Berlin, Germany, 16–18 September 2020; eCAADe: Berlin, Germany, 2020; Volume 1, pp. 249–258. [Google Scholar]
- China Association of Building Energy Efficiency. China Building Energy Consumption Annual Report 2020. Build. Energy Effic. 2021, 49, 1–6. [Google Scholar]
- Whitehead, B.; Eldars, M.Z. The Planning of Single-Storey Layouts. Build. Sci. 1965, 1, 127–139. [Google Scholar] [CrossRef]
- Eastman, C.M. Automated Space Planning. Artif. Intell. 1973, 4, 41–64. [Google Scholar] [CrossRef]
- Alexander, C. The Oregon Experiment; Oxford University Press: New York, NY, USA, 1975; ISBN 978-0195018240. [Google Scholar]
- Alexander, C. A Pattern Language: Towns, Buildings, Construction; Oxford University Press: New York, NY, USA, 1977; ISBN 978-0195019193. [Google Scholar]
- Alexander, C. The Timeless Way of Building; Oxford University Press: New York, NY, USA, 1979; ISBN 978-0195024029. [Google Scholar]
- Gips, J. Shape Grammars and Their Uses; Birkhäuser: Reinach, Switzerland, 1975; ISBN 978-3764307943. [Google Scholar]
- Stiny, G. Pictorial and Formal Aspects of Shape and Shape Grammars; Birkhäuser: Reinach, Switzerland, 1975; ISBN 978-3764308032. [Google Scholar]
- Steenson, M.W. Architecture of Information: Christopher Alexander, Cedrix Price and Nicholas Negroponte & MIT’s Architecture Machine Group; Princeton University: Princeton, NJ, USA, 2014. [Google Scholar]
- Crevier, D. AI: The Tumultuous History of the Search for Artificial Intelligence, 1st ed.; Basic Books: New York, NY, USA, 1993; ISBN 978-0465029976. [Google Scholar]
- Watson, I.; Marir, F. Case-Based Reasoning: A Review. Knowl. Eng. Rev. 1994, 9, 327–354. [Google Scholar] [CrossRef]
- Kolodner, J.L. An Introduction to Case-Based Reasoning. Artif. Intell. Rev. 1992, 6, 3–34. [Google Scholar] [CrossRef]
- Dave, B.; Schmitt, G.; Faltings, B.; Smith, I. Case Based Design in Architecture. In Artificial Intelligence in Design ‘94; Springer: Dordrecht, The Netherlands, 1994; pp. 145–162. [Google Scholar] [CrossRef]
- Azizi, V.; Usman, M.; Patel, S.; Schaumann, D.; Zhou, H.; Faloutsos, P.; Kapadia, M. Floorplan Embedding with Latent Semantics and Human Behavior Annotations. In Proceedings of the 11th Annual Symposium on Simulation for Architecture and Urban Design, Virtual Event, 25–27 May 2020; Society for Computer Simulation International: San Diego, CA, USA, 2020; pp. 337–344. [Google Scholar]
- As, I.; Pal, S.; Basu, P. Artificial Intelligence in Architecture: Generating Conceptual Design via Deep Learning. Int. J. Archit. Comput. 2018, 16, 306–327. [Google Scholar] [CrossRef]
- Eisenstadt, V.; Langenhan, C.; Althoff, K.-D.; Althof, K.-D. Generation of Floor Plan Variations with Convolutional Neural Networks and Case-Based Reasoning—An Approach for Unsupervised Adaptation of Room Configurations within a Framework for Support of Early Conceptual Design. In Proceedings of the eCAADe 37/SIGraDi 23, Porto, Portugal, 11–13 September 2019; Editora Edgard Blucher, Ltda.: São Paulo, Brazil, 2019; pp. 79–84. [Google Scholar]
- Goodfellow, I.J.; Pouget-Abadie, J.; Mirza, M.; Xu, B.; Warde-Farley, D.; Ozair, S.; Courville, A.; Bengio, Y. Generative Adversarial Nets. In Proceedings of the Conference on Advances in Neural Information Processing Systems 27, Montreal, QC, Canada, 8–13 December 2014; Ghahramani, Z., Welling, M., Cortes, C., Lawrence, N., Weinberger, K.Q., Eds.; Curran Associates, Inc.: Red Hook, NY, USA, 2014; pp. 2672–2680. [Google Scholar]
- Brock, A.; Donahue, J.; Simonyan, K. Large Scale GAN Training for High Fidelity Natural Image Synthesis. In Proceedings of the 7th International Conference on Learning Representations, New Orleans, LA, USA, 6–9 May 2019. [Google Scholar] [CrossRef]
- Arjovsky, M.M.; Chintala, S.; Bottou, L. Wasserstein GAN. In Proceedings of the 34th International Conference on Machine Learning, Sydney, Australia, 6–11 August 2017; Precup, D., Teh, Y.W., Eds.; MIT Press: Cambridge, MA, USA, 2017; Volume 70, pp. 214–223. [Google Scholar]
- Zhang, H.; Xu, T.; Li, H.; Zhang, S.; Wang, X.; Huang, X.; Metaxas, D. StackGAN: Text to Photo-Realistic Image Synthesis with Stacked Generative Adversarial Networks. In Proceedings of the IEEE International Conference on Computer Vision, Venice, Italy, 25 October 2017; IEEE Computer Society: Washington, DC, USA, 2017; pp. 5907–5915. [Google Scholar]
- Zhu, J.Y.; Park, T.; Isola, P.; Efros, A.A. Unpaired Image-to-Image Translation Using Cycle-Consistent Adversarial Networks. In Proceedings of the IEEE International Conference on Computer Vision, Venice, Italy, 25 October 2017; IEEE Computer Society: Washington, DC, USA, 2017; pp. 2223–2232. [Google Scholar]
- Radford, A.; Metz, L.; Chintala, S. Unsupervised Representation Learning with Deep Convolutional Generative Adversarial Networks. In Proceedings of the 4th International Conference on Learning Representations, San Juan, Puerto Rico, 2 May 2016; ICLR: San Juan, Puerto Rico, 2016. Available online: https://iclr.cc/archive/www/doku.php%3Fid=iclr2016:cfp.html (accessed on 17 April 2022).
- Denton, E.; Chintala, S.; Szlam, A.; Fergus, R. Deep Generative Image Models Using a Laplacian Pyramid of Adversarial Networks. In Proceedings of the Conference on Advances in Neural Information Processing Systems 28, Montreal, QC, Canada, 7–12 December 2015; MIT Press: Cambridge, MA, USA, 2015; pp. 1486–1494. [Google Scholar]
- Mirza, M.; Osindero, S. Conditional Generative Adversarial Nets. arXiv 2014, 11. [Google Scholar] [CrossRef]
- Zhu, J.-Y.; Krähenbühl, P.; Shechtman, E.; Efros, A.A. Generative Visual Manipulation on the Natural Image Manifold. In Proceedings of the 14th European Conference on Computer Vision, Amsterdam, The Netherlands, 11–14 October 2016; Leibe, B., Matas, J., Sebe, N., Welling, M., Eds.; Springer International Publishing: Amsterdam, The Netherlands, 2016; pp. 597–613. [Google Scholar]
- Isola, P.; Zhu, J.Y.; Zhou, T.; Efros, A.A. Image-to-Image Translation with Conditional Adversarial Networks. In Proceedings of the 30th IEEE Conference on Computer Vision and Pattern Recognition, Honolulu, HI, USA, 21–26 July 2016; IEEE Computer Society: Washington, DC, USA, 2016; pp. 1125–1134. [Google Scholar]
- Chaillou, S. ArchiGAN: A Generative Stack for Apartment Building Design|NVIDIA Technical Blog. Available online: https://developer.nvidia.com/blog/archigan-generative-stack-apartment-building-design/ (accessed on 20 March 2022).
- Huang, W.; Zheng, H. Architectural Drawings Recognition and Generation through Machine Learning. In Proceedings of the 38th Annual Conference of the Association for Computer Aided Design in Architecture, Mexico City, Mexico, 18–20 October 2018; ACADIA: Mexico City, Mexico, 2018; pp. 156–165. [Google Scholar]
- Zheng, H.; An, K.; Wei, J.; Ren, Y. Apartment Floor Plans Generation via Generative Adversarial Networks. In Proceedings of the 25th International Conference on Computer-Aided Architectural Design Research in Asia, Bangkok, Thailand, 5–6 August 2020; CAADRIA: Hong Kong, China, 2020; Volume 2, pp. 599–608. [Google Scholar]
- Zandavali, B.A.; García, M.J. Automated Brick Pattern Generator for Robotic Assembly Using Machine Learning and Images. In Proceedings of the 37th eCAADe and 23rd SIGraDi Conference, Porto, Portugal, 11–13 September 2019; eCAADe: Porto, Portugal, 2019; pp. 217–226. [Google Scholar]
- Pan, Y.; Qian, J.; Hu, Y. A Preliminary Study on the Formation of the General Layouts on the Northern Neighborhood Community Based on GauGAN Diversity Output Generator. In Proceedings of the 2020 DigitalFUTURES, Shanghai, China, 5–6 July 2020; Springer: Berlin/Heidelberg, Germany, 2020; pp. 179–188. [Google Scholar]
- Liu, C.; Shen, J.; Ren, Y.; Zheng, H. Pipes of AI—Machine Learning Assisted 3D Modeling Design. In Proceedings of the 2020 DigitalFUTURES, Shanghai, China, 5–6 July 2020; Springer: Berlin/Heidelberg, Germany, 2020; pp. 17–26. [Google Scholar]
- Tian, R. Suggestive Site Planning with Conditional GAN and Urban GIS Data. In Proceedings of the 2020 DigitalFUTURES, Shanghai, China, 5–6 July 2020; Springer: Berlin/Heidelberg, Germany, 2020; pp. 103–113. [Google Scholar]
- Silvestre, J.; Ikeda, Y.; Guéna, F.; Silvestere, J.; Ikeda, Y.; Guena, F. Artificial Imagination of Architecture with Deep Convolutional Neural Network. In Proceedings of the 21st International Conference on Computer-Aided Architectural Design Research in Asia, Melbourne, Australia, 30 March–2 July 2016; CAADRIA: Melbourne, Australia, 2016; pp. 881–890. Available online: https://www.caadria.org/about/#publications (accessed on 17 April 2022).
- Mohammad, A.; Beorkrem, C.; Ellinger, J. Hybrid Elevations Using GAN Networks. In Proceedings of the 39th Annual Conference of the Association for Computer Aided Design in Architecture, Austin, TX, USA, 21–26 October 2019; ACADIA: Austin, TX, USA, 2019; pp. 370–379. [Google Scholar]
- Mokhtar, S.; Sojka, A.; Davila, C.C. Conditional Generative Adversarial Networks for Pedestrian Wind Flow Approximation. In Proceedings of the Symposium on Simulation for Architecture and Urban Design, Virtual Event, 25–27 May 2020; Simulation Councils Inc.: Vista, CA, USA, 2020; pp. 469–476. [Google Scholar]
- Asl, M.R.; Das, S.; Tsai, B.; Molloy, I.; Hauck, A. Energy Model Machine ( EMM ) Instant Building EnergyPrediction Using Machine Learning. In Proceedings of the 35th International Conference on Education and Research in Computer Aided Architectural Design in Europe, Rome, Italy, 20–22 September 2017; eCAADe: Rome, Italy, 2017; Volume 2, pp. 277–286. [Google Scholar]
- Pokhrel, M.K.; Anderson, T.N.; Lie, T.T. Maintaining Thermal Comfort of a Single-Sided Naturally Ventilated Model House by Intelligently Actuating Windows. In Proceedings of the 24th International Conference on Computer-Aided Architectural Design Research in Asia, Wellington, New Zealand, 15–18 April 2019; CAADRIA: Hong Kong, China, 2019; Volume 1, pp. 705–714. [Google Scholar]
- Zhang, Y.; Grignard, A.; Aubuchon, A.; Lyons, K.; Larson, K. Machine Learning for Real-Time Urban Metrics and Design Recommendations. In Proceedings of the 38th Annual Conference of the Association for Computer Aided Design in Architecture, Mexico City, Mexico, 18–20 October 2018; ACADIA: Mexico City, Mexico, 2018; pp. 196–205. [Google Scholar]
- Lee, D.; Kang, S.; Shin, J. Using Deep Learning Techniques to Forecast Environmental Consumption Level. Sustainability 2017, 9, 1894. [Google Scholar] [CrossRef]
- Son, N. Comparison of the Deep Learning Performance for Short-Term Power Load Forecasting. Sustainability 2021, 13, 12493. [Google Scholar] [CrossRef]
- Yu, Z.; Gou, Z.; Qian, F.; Fu, J.; Tao, Y. Towards an Optimized Zero Energy Solar House: A Critical Analysis of Passive and Active Design Strategies Used in Solar Decathlon Europe in Madrid. J. Clean. Prod. 2019, 236, 117646. [Google Scholar] [CrossRef]
- Belpoliti, V.; Calzolari, M.; Davoli, P.; Altan, H.; Nassif, R. Design Optimization to Enhance Passive Energy Strategies. The know howse Project for Solar Decathlon Middle East 2018. Procedia Manuf. 2020, 44, 302–309. [Google Scholar] [CrossRef]
- Ma, Z.; Ren, H.; Lin, W. A Review of Heating, Ventilation and Air Conditioning Technologies and Innovations Used in Solar-Powered Net Zero Energy Solar Decathlon Houses. J. Clean. Prod. 2019, 240, 118158. [Google Scholar] [CrossRef]
- Belpoliti, V. Comparative Analysis of Simulated and Monitored Energy Performance of a Prototype House. Lesson Learnt from the Project KNOW HOWse for Solar Decathlon Middle East 2018 in Dubai. J. Build. Eng. 2021, 41, 102740. [Google Scholar] [CrossRef]
- Voss, K.; Hendel, S.; Stark, M. Solar Decathlon Europe—A Review on the Energy Engineering of Experimental Solar Powered Houses. Energy Build. 2021, 251, 111336. [Google Scholar] [CrossRef]
- Ronneberger, O.; Fischer, P.; Brox, T. U-Net: Convolutional Networks for Biomedical Image Segmentation. In Proceedings of the International Conference on Medical Image Computing and Computer-Assisted Intervention, Munich, Germany, 5–9 October 2015; Springer International Publishing: Cham, Switzerland, 2015; Volume 9351, pp. 234–241. [Google Scholar]
- Cubuk, E.D.; Zoph, B.; Mane, D.; Vasudevan, V.; Le, Q.V. AutoAugment: Learning Augmentation Policies from Data. In Proceedings of the Conference on Computer Vision and Pattern Recognition, Long Beach, CA, USA, 15–20 June 2019; IEEE: Piscataway, NJ, USA, 2019; pp. 113–123. [Google Scholar]
- Zhang, H.; Cisse, M.; Dauphin, Y.N.; Lopez-Paz, D. Mixup: Beyond Empirical Risk Minimization. In Proceedings of the 6th International Conference on Learning Representations, Vancouver, BC, Canada, 30 April–3 May 2018; ICLR: Vancouver, BC, Canada, 2018. Available online: https://iclr.cc/archive/www/doku.php%3Fid=iclr2018:main.html (accessed on 17 April 2022).
- Geng, Q.; Viswanath, P. The Optimal Noise-Adding Mechanism in Differential Privacy. IEEE Trans. Inf. Theory 2016, 62, 925–951. [Google Scholar] [CrossRef]
- Liu, Y.; Zou, S.; Chen, H.; Wu, X.; Chen, W. Simulation Analysis and Scheme Optimization of Energy Consumption in Public Buildings. Adv. Civ. Eng. 2019, 2019, 6326138. Available online: https://www.hindawi.com/journals/ace/2019/6326138/ (accessed on 17 April 2022). [CrossRef]
- Lam, C.K.C.; Lee, H.; Yang, S.R.; Park, S. A Review on the Significance and Perspective of the Numerical Simulations of Outdoor Thermal Environment. Sustain. Cities Soc. 2021, 71, 102971. [Google Scholar] [CrossRef]
- Liu, Y.; Chen, H.; Zhang, L.; Feng, Z. Enhancing Building Energy Efficiency Using a Random Forest Model: A Hybrid Prediction Approach. Energy Rep. 2021, 7, 5003–5012. [Google Scholar] [CrossRef]
- De La Torre, S.; Yousif, C. Evaluation of Chimney Stack Effect in a New Brewery Using DesignBuilder-EnergyPlus Software. Energy Procedia 2014, 62, 230–235. [Google Scholar] [CrossRef][Green Version]


| Competition | Location | Entries | Retained |
|---|---|---|---|
| SD2007 | Washington, DC, USA | 20 | 15 |
| SD2009 | Washington, DC, USA | 21 | 14 |
| SD2011 | Washington, DC, USA | 19 | 13 |
| SD2013 | Irvine, CA, USA | 19 | 16 |
| SD2015 | Irvine, CA, USA | 15 | 11 |
| SD2017 | Irvine, CA, USA | 11 | 9 |
| SDE2010 | Madrid, Spain | 17 | 5 |
| SDE2012 | Madrid, Spain | 18 | 8 |
| SDEM2018 | Dubai, UAE | 14 | 7 |
| Total | - | 154 | 98 |
| Construction Method | Film Coefficient (W/m2K) | |
|---|---|---|
| External Wall | 370 mm clay brick + 20 mm cement | 1.54 |
| External Window | aluminum framed glazing | 6.18 |
| Roof | 100 mm concrete + 40 mm cement | 1.86 |
| No. | Model 1 | No. | Model 2 | ||||
|---|---|---|---|---|---|---|---|
| Input | Output | Ground Truth | Input | Output | Ground Truth | ||
| 07-06 |  |  |  | 07-01 |  |  |  |
| 07-09 |  |  |  | 12-03 |  |  |  |
| 09-02 |  |  |  | 13-11 |  |  |  |
| 09-14 |  |  |  | 15-08 |  |  |  |
| 09-15 |  |  |  | 09-15 |  |  |  |
| 12-04 |  |  |  | 17-06 |  |  |  |
| 12-14 |  |  |  | 12-14 |  |  |  |
| 18-01 |  |  |  | 18-01 |  |  |  |
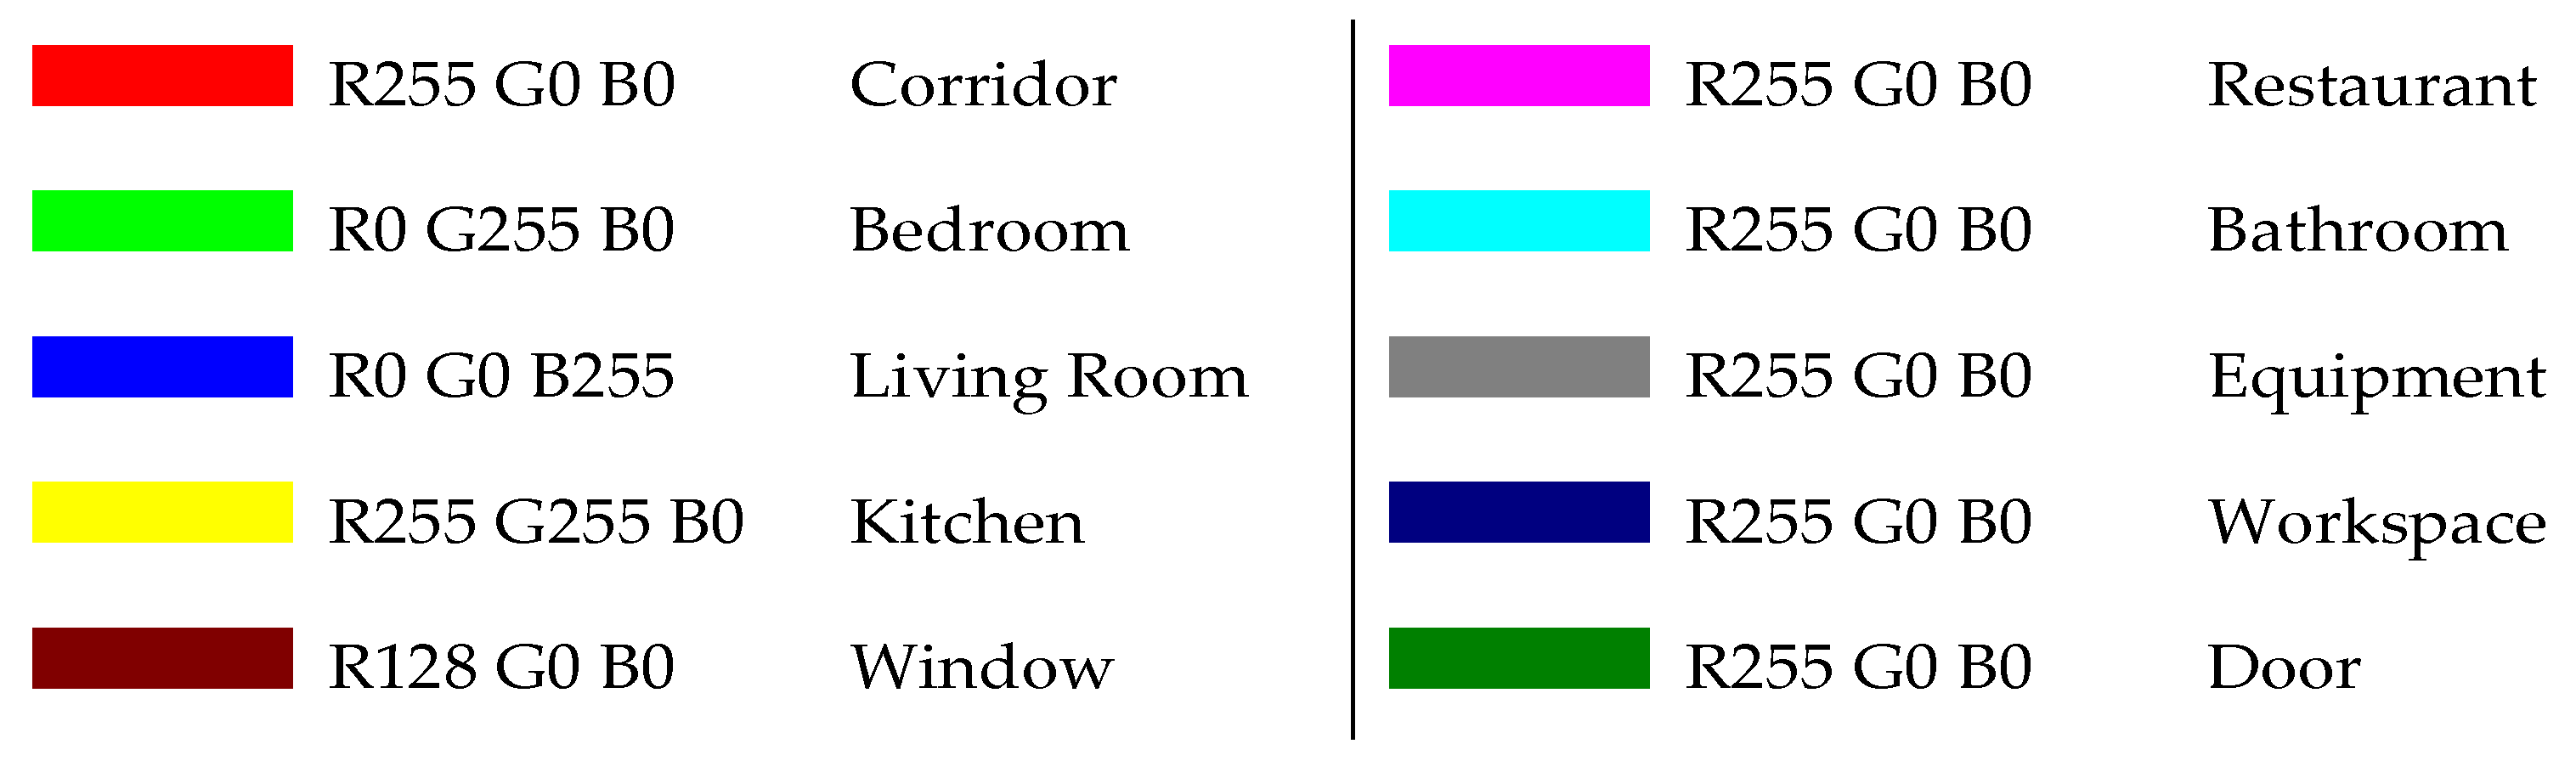
 Corridor;
  restaurant;
  bedroom;
  bathroom;
  living Room;
  equipment;
  kitchen;
  workspace;
  window;
  door.
door.| No. | Model 1 | No. | Model 2 | |||
|---|---|---|---|---|---|---|
| CSA | RFD | CCB | WGA | FGA | ||
| 07-06 | 3 | 2 | 2 | 07-01 | 5 | 4 |
| 07-09 | 4 | 3 | 3 | 12-03 | 5 | 5 |
| 09-02 | 1 | 1 | 2 | 13-11 | 5 | 4 |
| 09-14 | 4 | 3 | 3 | 15-08 | 4 | 5 |
| 09-15 | 1 | 1 | 2 | 09-15 | 5 | 4 |
| 12-04 | 1 | 1 | 1 | 17-06 | 5 | 4 |
| 12-14 | 2 | 2 | 2 | 12-14 | 5 | 4 |
| 18-01 | 2 | 2 | 3 | 18-01 | 5 | 5 |
| Average | 2.25 | 1.875 | 2.25 | Average | 4.875 | 4.375 |
| No. | Model 1 | Model 1-1 | Model 1-2 |
|---|---|---|---|
| 07-06 |  |  |  |
| 07-09 |  |  |  |
| 09-02 |  |  |  |
| 09-14 |  |  |  |
| 09-15 |  |  |  |
| 12-04 |  |  |  |
| 12-14 |  |  |  |
| 18-01 |  |  |  |
 Corridor;
  restaurant;
  bedroom;
  bathroom;
  living Room;
  equipment;
  kitchen;
  workspace;
  window;
  door.
door.| No. | Model 1-1 | Model 1-2 | ||||
|---|---|---|---|---|---|---|
| CSA | RFD | CCB | CSA | RFD | CCB | |
| 07-06 | 1 | 1 | 1 | 5 | 4 | 5 |
| 07-09 | 3 | 2 | 4 | 4 | 5 | 4 |
| 09-02 | 2 | 2 | 2 | 5 | 5 | 4 |
| 09-14 | 1 | 2 | 3 | 5 | 5 | 4 |
| 09-15 | 3 | 2 | 3 | 5 | 5 | 5 |
| 12-04 | 1 | 1 | 2 | 5 | 5 | 4 |
| 12-14 | 4 | 2 | 4 | 5 | 5 | 4 |
| 18-01 | 3 | 2 | 3 | 5 | 3 | 4 |
| Average | 2.25 | 1.75 | 2.75 | 4.875 | 4.625 | 4.25 |
| Item | Case A | Case B | Case C | |
|---|---|---|---|---|
| FSLs generated |  |  |  | |
| BFPs generated |  |  |  | |
| DesignBuilder Model |  |  |  | |
| Annual Energy Consumption (kWh) | Heating (existing) | 11,375.03 | 15,350.27 | 11,488.38 |
| Heating (generated) | 9578.11 | 12,766.55 | 10,407.00 | |
| Cooling (existing) | 2276.10 | 2701.41 | 1969.11 | |
| Cooling (generated) | 2055.39 | 2364.34 | 1968.44 | |
| Total (existing) | 16,380.14 | 20,608.09 | 15,686.90 | |
| Total (generated) | 14,188.26 | 17,982.44 | 14,515.83 | |
Publisher’s Note: MDPI stays neutral with regard to jurisdictional claims in published maps and institutional affiliations. |
© 2022 by the authors. Licensee MDPI, Basel, Switzerland. This article is an open access article distributed under the terms and conditions of the Creative Commons Attribution (CC BY) license (https://creativecommons.org/licenses/by/4.0/).
Share and Cite
Wan, D.; Zhao, X.; Lu, W.; Li, P.; Shi, X.; Fukuda, H. A Deep Learning Approach toward Energy-Effective Residential Building Floor Plan Generation. Sustainability 2022, 14, 8074. https://doi.org/10.3390/su14138074
Wan D, Zhao X, Lu W, Li P, Shi X, Fukuda H. A Deep Learning Approach toward Energy-Effective Residential Building Floor Plan Generation. Sustainability. 2022; 14(13):8074. https://doi.org/10.3390/su14138074
Chicago/Turabian StyleWan, Da, Xiaoyu Zhao, Wanmei Lu, Pengbo Li, Xinyu Shi, and Hiroatsu Fukuda. 2022. "A Deep Learning Approach toward Energy-Effective Residential Building Floor Plan Generation" Sustainability 14, no. 13: 8074. https://doi.org/10.3390/su14138074
APA StyleWan, D., Zhao, X., Lu, W., Li, P., Shi, X., & Fukuda, H. (2022). A Deep Learning Approach toward Energy-Effective Residential Building Floor Plan Generation. Sustainability, 14(13), 8074. https://doi.org/10.3390/su14138074