Article

Investigation of the Impact Resistance Behavior of Customized Hair Clipper Comb Fabricated by Fused Deposition Modeling

Department of Mechanical Engineering, National University of Sciences and Technology, Islamabad 44000, Pakistan
*
Author to whom correspondence should be addressed.
Sustainability 2022, 14(13), 8071; https://doi.org/10.3390/su14138071
Submission received: 17 May 2022 / Revised: 6 June 2022 / Accepted: 9 June 2022 / Published: 1 July 2022

Abstract

:
This study consists of the development of a hair clipper comb finite element (FE) model, impact test analysis on the FE model, fabrication of the product using commercially available materials, followed by physical impact testing of the comb. Moreover, microscopic examination of the combs was performed to analyze the quality of the product and correlate the defects with the failure mechanism. The 3D model of comb for a Philips hair clipper was developed using ONSHAPE software, followed by a design study to understand the impact resistance of the product. The design study was performed using finite element analysis (FEA) explicit dynamic module, where two hair clipper comb designs, one with a solid body and the other with a shell were subjected to drop test simulation in two orientations: leg and head drop. Two readily available 3D printable plastic materials, Acrylonitrile Butadiene Styrene (ABS) and Polylactic acid (PLA) were selected for the FEA simulation while the comb was subjected to free fall from a height of 5 ft (1.67 m). The comb was dropped in two orientations: the head drop configuration and the leg drop configuration. For all combinations, the maximum stresses generated as a result of impact were noted and experiments performed to validate the simulation results. The four models were fabricated using fused deposition modeling (FDM) technique and were manually dropped from the same height. In line with the simulated results, models prepared from PLA material failed upon the impact while ABS samples having a comparatively better impact resistance sustained the impact without failure. Finally, fracture surface morphologies of the failed PLA component and the surface of ABS in as-printed condition were analyzed using Scanning Electron Microscopy (SEM). Based on the obtained results, the shell model made of ABS material turns out to be the most suitable choice out of all the designs considered.

1. Introduction

Additive manufacturing (AM) is an engineering process utilized to develop a three-dimensional solid via layer-by-layer addition from a CAD 3D-model [1,2,3]. Additive manufacturing offers promising potential to the manufacturing sector in applications that require the use of plastics, ceramics, or metals. AM could enable mass customization of uncommon items, at the same time optimizing material consumption [4,5]. The latest developments in AM techniques for the production of small to medium components make it a very appealing option for the manufacturing sector [6]. The medical business is only one example where AM has been used to create unique products such as artificial organs, dental supplies, and prostheses [7,8,9]. The expanded utilization of AM to produce practical end-use parts has created the requirement for a better understanding of the mechanical behavior of additively manufactured parts on the part of the engineers and a corresponding improvement in scientific apparatuses [10,11,12].
The most extensively used inhouse AM technique is fused deposition modeling (FDM), in which a thermoplastic filament is extruded through a pre-heated nozzle and the material is selectively deposited onto a build platform maintained at room temperature or at an elevated temperature [13,14]. The 3D structure is constructed by successive additions of deposited layers as shown in Figure 1 [15]. Polylactic acid (PLA), Polyamide (PA), tough polylactic acid (tough PLA), polycarbonate (PC), and acrylonitrile butadiene styrene (ABS) are by far the most popular polymeric materials utilized in the fused deposition modeling (FDM) technique to build 3D objects [16,17]. PLA and ABS materials have gained popularity in FDM because of their excellent mechanical characteristics, high dependability, cheap cost, dimensional precision, and surface quality, as well as the fact that they are made from renewable resources [18,19,20].
Much of the work in FDM has been focused on the effect of printing parameters and the materials used on the mechanical behavior of the printed product. In an effort to understand the effect of raster angle and build orientation on the tensile and shear behavior of FDM products, Cantrell et al. [21] used two different materials, namely PC and ABS. It was reported that raster angle and build orientation had negligible effect on the mechanical properties of as printed ABS while the shear strength varied by about 30%. Moreover, in PC samples, raster angle induced anisotropic properties resulting in a variation of about 20%. Maurya et al. [22] investigated a unique way for reinforcing the additive structure by incorporating high strength material among matrix materials. PET-G is utilised for reinforcement, and PLA and ABS are used as matrix materials. The impact of reinforcing on the strength properties of the additively manufactured part is tested using a unidirectional tensile test. The experimental data indicate that adding PET-G reinforcing enhances the tensile strength of ABS by approximately 70% and the tensile strength of PLA material by around 8%. The FEA findings were somewhat higher than the actual results, which might be attributed to the existence of voids and air gaps between the layers of the produced specimens. Majid et al. [23] reported the study on crack propagation in ABS samples manufactured using the FDM technique with varying infill densities. The infill density was seen to have a direct relationship with the amount of voids and thus the mechanical strength. Similarly, Basurto-Vázquez et al. [24] examined the breaking strength and energy absorption (EA) capabilities of PET-G honeycomb architectures in depth. The fractured models and EA capabilities of the structure were seen to be directly affected by the process parameters in FDM and dynamic anisotropy. The printing settings used in this work had a significant impact on the tensile characteristics of the 3D-printed PET-G honeycomb architecture. Overall, optimum results offering the highest EA were achieved with a 100 percent infill density and an upright printing direction.
Several researchers have also focused on optimizing the strength-to-weight ratio of FDM products by developing optimisation algorithms for partially filled structures. Wang et al. [25] reported an automated and efficient approach for generating a skin-frame structure for a 3D model in order to reduce the amount of material needed in FDM and the quantity of struts in the framework. The algorithm based on multi -objective programming develops a frame structure, which is close to the geometry of the input model and is proven to be physically stable and printable. Lu et al. [26] tackled the difficult task of hollowing out solid objects while improving their strength-to-weight ratios. A hollowing optimization algorithm based on honeycomb cells structure was developed. To define the internal structure, the Voronoi diagram was utilized to generate honeycomb-cell like tessellations. The printability and strength of several 3D items having a lightweight core structure were assessed by applying the developed algorithm. Similarly, Feng et al. [27] investigated the development of 3D porous structures using T-spline and triply periodic minimal surface (TPMS). These structures can function as lightweight infill, porous scaffolds, energy absorbers, or microreactors. Furthermore, Medeiros e Sá et al. [28] introduced the adaptable voids algorithm, an automated method for generating a parametric adaptable infill primal and dual cellular design for AM assuming a volumetric barrier. The result might be used in a variety of applications, such as design and production, architectural, garments and safety clothing, furnishings, and biomedical applications.
From the stand alone point of usability several studies have been reported in literature on the behavior of common day use applications. For instance, Yasin et al. [29] analyzed the durability of helmet structure upon impact loading using different types of materials (ABS, PC and GFR) in FEA software. Validation of the simulated results was performed using a drop test and maximum von Mises stresses were reported to be 41 MPa, 46 MPa, and 16 MPa for ABS, PC and GFR respectively. It was further reported that the safety helmet developed using GFR provide a maximum safety factor of 9. Similarly, Gandhi et al. [30] analyzed helmet design for static and dynamic conditions. After comparing the results for the various cases, it was concluded that the lower or chin side of the helmet had undergone less strain energy and deformation. Therefore, special attention was called for in the design of the chin side of the helmet to decrease the risk of serious injuries. Yeh et al. [31] performed FEA and drop test on two models of an electronic FR-4 test board, and reported the stress distribution along the width of the test board. FEA results of test board were obtained from ANSYS using explicit dynamics module and the results were verified experimentally on drop test apparatus under JEDEC standards. The minimum stress was reported in the central region, and it was concluded that electronic components welded in the central part of the RF-4 board were less likely to fail due to sudden overload.
Considering the need to incorporate FDM in the development and assessment of daily life applications, the contribution of the present work consists in the bringing together of FEA simulation, fused deposition modeling and experimental validation of a common household component.
In this work fabrication of a hair clipper comb using the FDM technique and its structural integrity under impact loading is studied. Two of the most widely used 3D printable filaments, PLA and ABS have been selected to manufacture the hair clipper comb. In the first stage, the impact strength of the FDM hair clipper combs is assessed through numerical simulations while in the second phase the printed combs are subjected to drop tests to validate the numerical results.

2. Materials and Methods
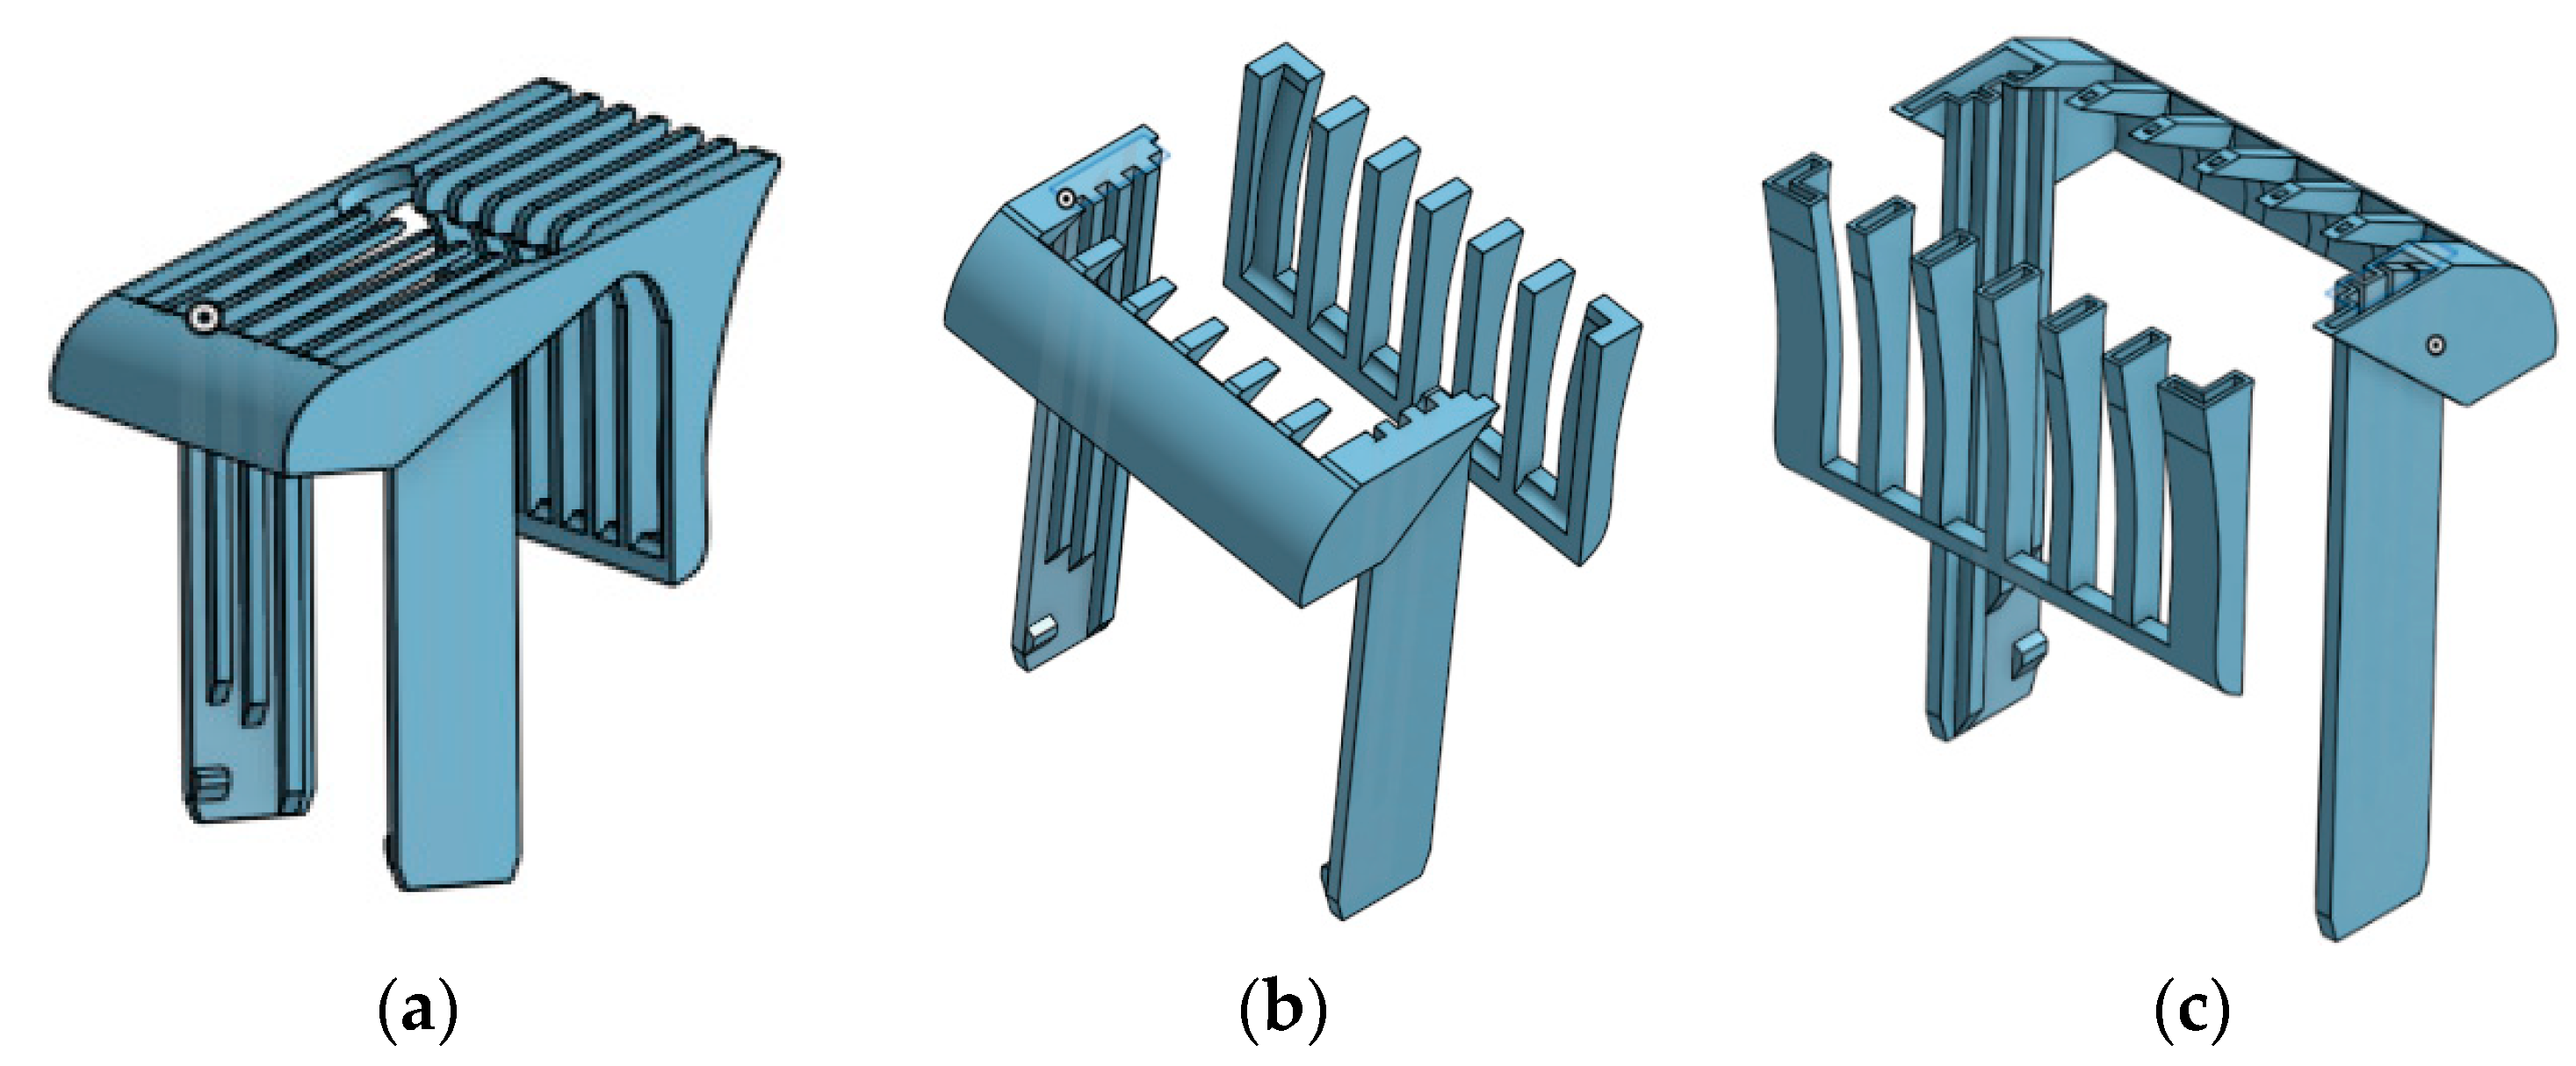
2.1. 3D Model

In this work, the strength of a hair clipper comb subjected to a drop test has been studied. More precisely, the stress behavior of the designed model was investigated by dropping it from a height of 5ft at different angles. The initial velocity was set as 0 m/s and the body was subjected to a freefall with gravitational acceleration g = 9.81   m / s 2 . The coefficient of friction value was 0.3 and the drop target was set as a fixed concrete platform. The hair clipper comb was modeled as a homogeneous and isotropic material while the negligible air resistance was not considered in the analysis. A 3D solid body model and a shell model of the product were designed by using CAD software ONSHAPE. The component was designed based on dimensions from an actual commercial product and a shell having a thickness of 1 mm was introduced in the designed model. The total volume of the solid body model is 9.37 cm 3 while that of the shell body model is 6.72 cm 3 . The solid and shell models are shown in Figure 2.

2.2. Finite Element Analysis
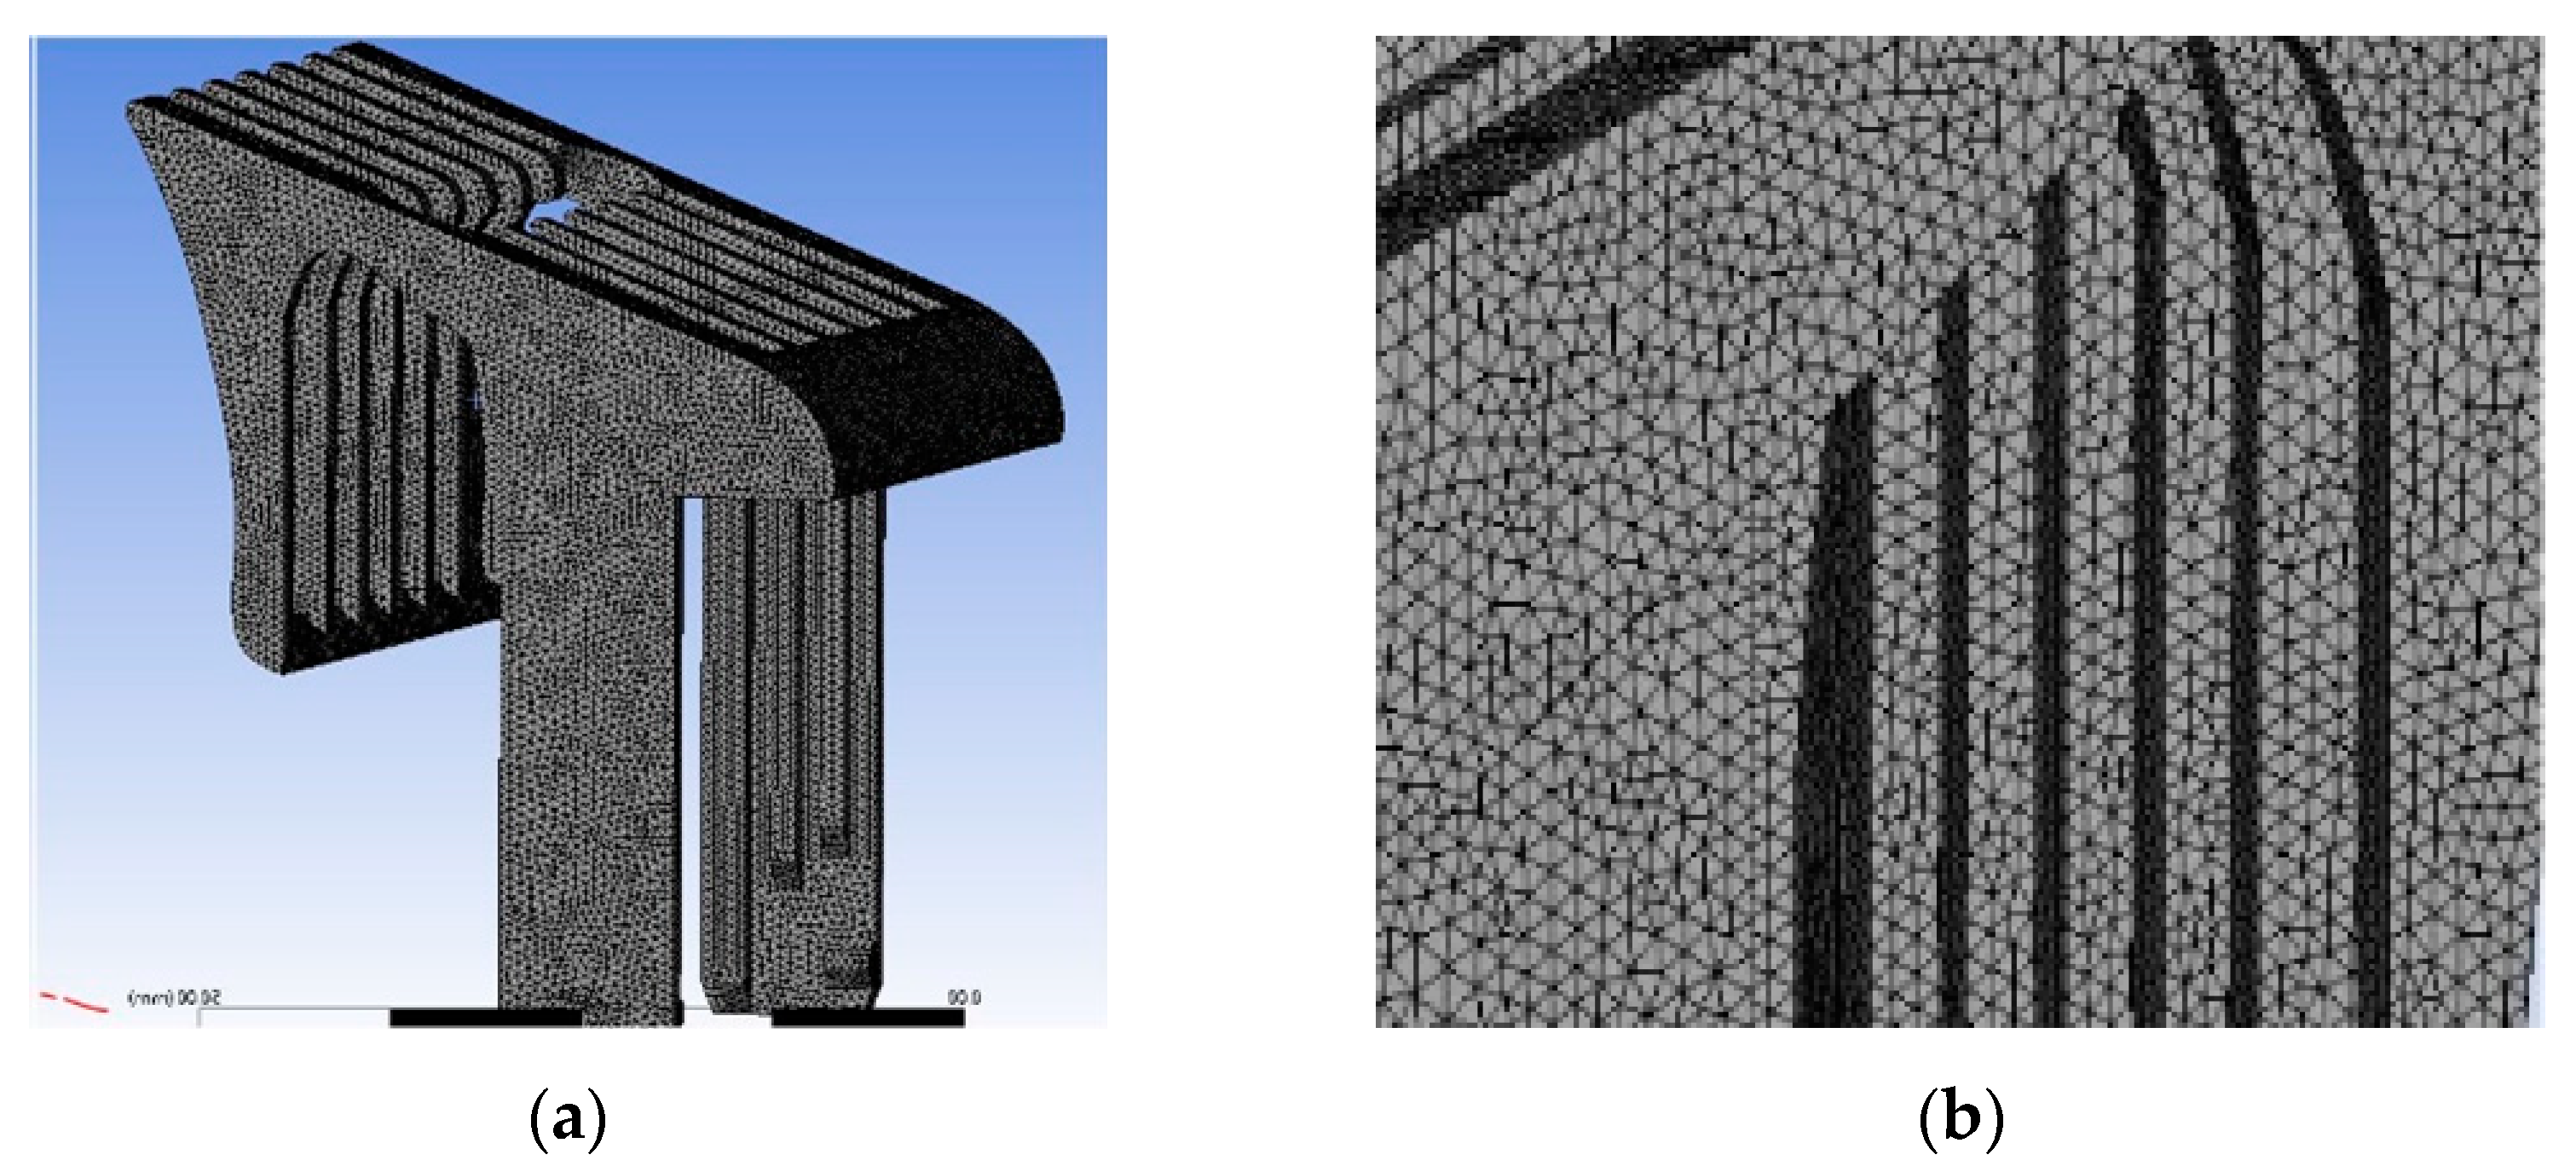
FEA simulations are extensively used for the analysis of designed components under various loading conditions to minimize experimental testing. In this work, the designed model was exported from ONSHAPE to FEA software ANSYS. The free fall motion (drop test) of a customized hair clipper comb as a non-rigid object was investigated using explicit dynamics analysis.

2.3. Meshing

Mesh generation is an important step in any FEA routine. The mesh details are given in Table 1 while Figure 3 shows the resulting elements and nodes.
Mesh convergence analysis was performed using different mesh sizes to compute the results and compare the calculated von Mises stresses. The stresses were stable from a mesh size of 0.54 mm to 0.62 mm (see Figure S1 in Supplementary Materials). The 0.62 mm mesh size was selected as the converged value. According to Mesh Metric developed by Ansys Inc. (Canonsburg, PA, USA) [32], the mesh quality factor is important in terms of reliability of the results. High skewness values or low orthogonal quality are not recommended. Skewness mesh metrics spectrum and orthogonal quality mesh metrics spectrum are summarized as Tables S1 and S2 in Supplementary Materials [33]. In this analysis, the average skewness value was calculated as 0.231 (Figure S2 in Supplementary Materials). According to Table S1, this value is excellent (0–0.25). The average orthogonal quality value was calculated as 0.767 (Figure S3 in Supplementary Materials). According to Table S2, this value is very good (0.70–0.95).

2.4. Material Selection
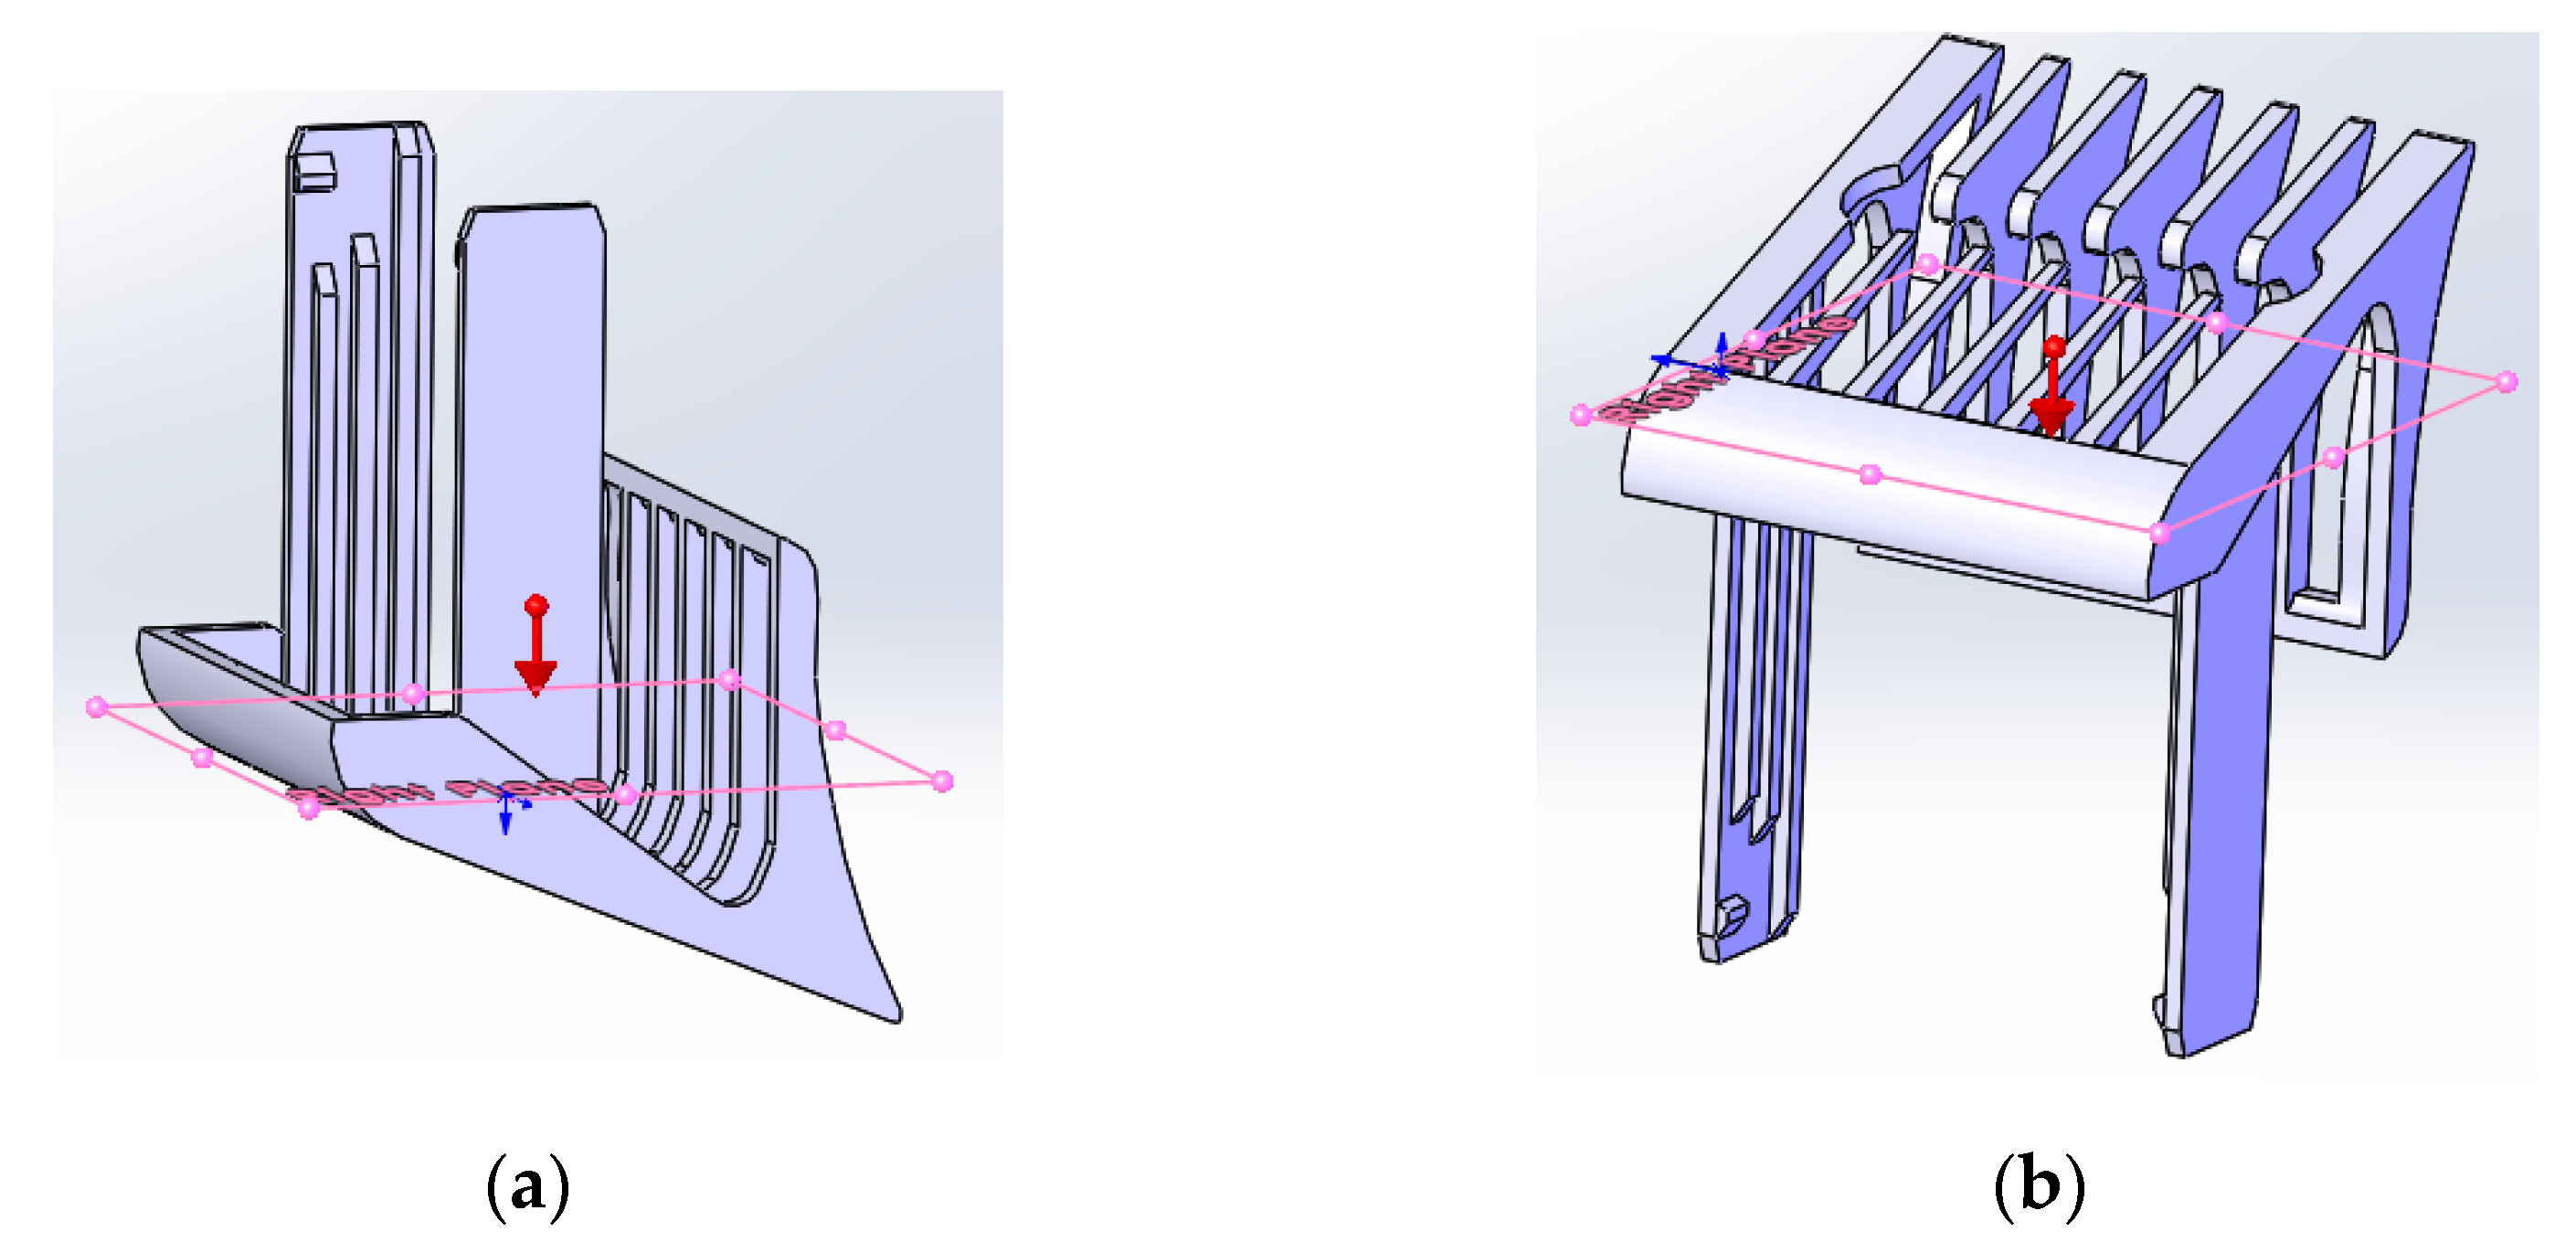
The polymeric materials used for the drop test analysis were Acrylonitrile butadiene styrene (ABS) and Polylactic acid (PLA). Material properties are selected as per ASTM D638. The relevant material properties are given in Table 2 [34,35,36].

2.5. Analysis Setup

The parameters of the drop test setup include the drop height and the orientation of drop. The model was dropped from the height of 5 ft (1.67 m) under the gravity of earth. The two drop orientations are shown in Figure 4. The velocity (in m/s) of impact with the ground is given in Equation (1).
v = 2 g h
where h is the height (m) and g is the gravitational acceleration ( m / s 2 ) .
Explicit time integration was used for the drop test analysis, which automatically calculates the response starting from the moment of impact.

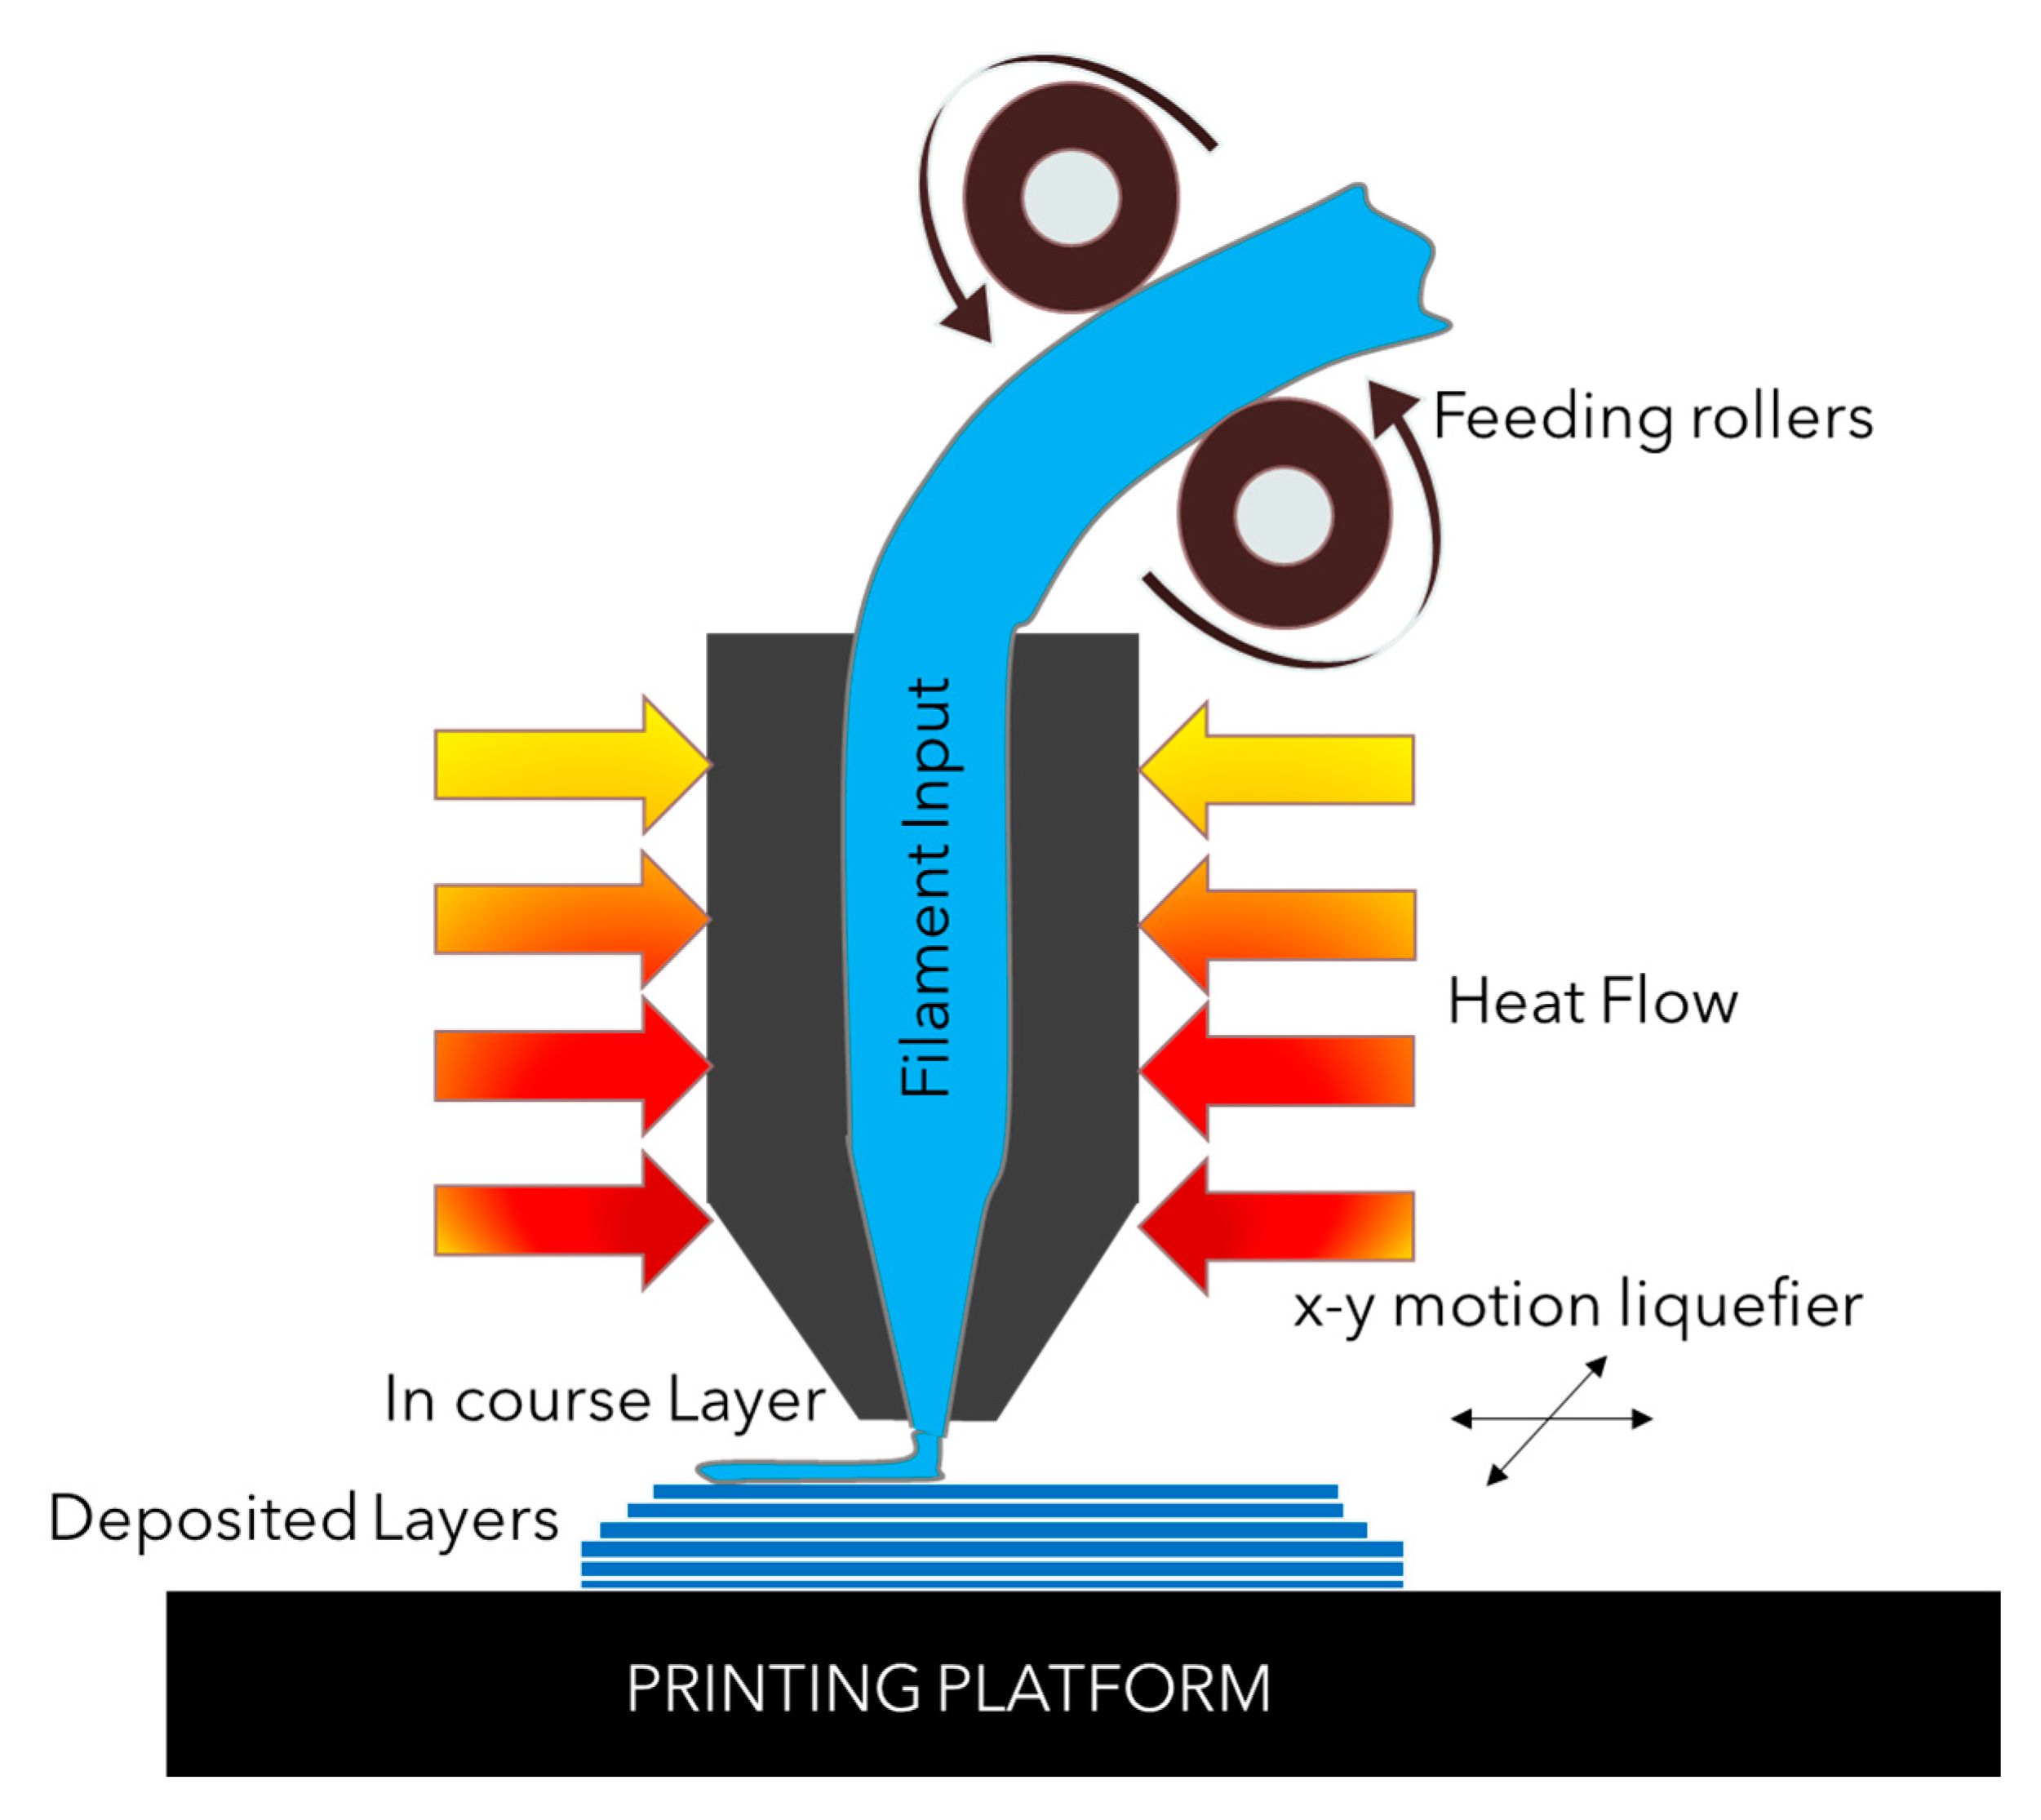
2.6. Fused Deposition Modeling

Fused Deposition Modeling (FDM) via Creality Ender-3 printer was used to fabricate the designed part. With this setup, a wide range of materials can be used to print any designed part with accuracy and customized settings. The fixed basic FDM parameters of the Creality Ender-3 printer are given in Table 3. A total of four samples (two solid samples and two shell samples for PLA and ABS) were fabricated using this setup.

2.7. Scaning Electron Microscopy

The strength of any material is inexorably linked to its microstructure. Therefore, the examination of the microstructure of the cracked or fractured surface is crucial to understand the cause of failure in the material. In this study, the fractured surfaces of the hair clipper comb after the drop test were analyzed. Furthermore, the external surfaces of additively manufactured hair clipper comb were also examined to identify any defect formed during the FDM process. A scanning electron microscope (SEM) was used at an acceleration of 5 kV in the high vacuumed mode to examine the microstructures of fractured surfaces and plain surfaces of the material. The samples were carefully prepared for SEM analysis. A thin layer of gold-palladium alloy was coated in a vacuum chamber to remove the charging effects of the surface. This thin layer is significant as it provides a homogeneous surface for the examination leading to clear SEM images [37,38].

3. Results and Discussion

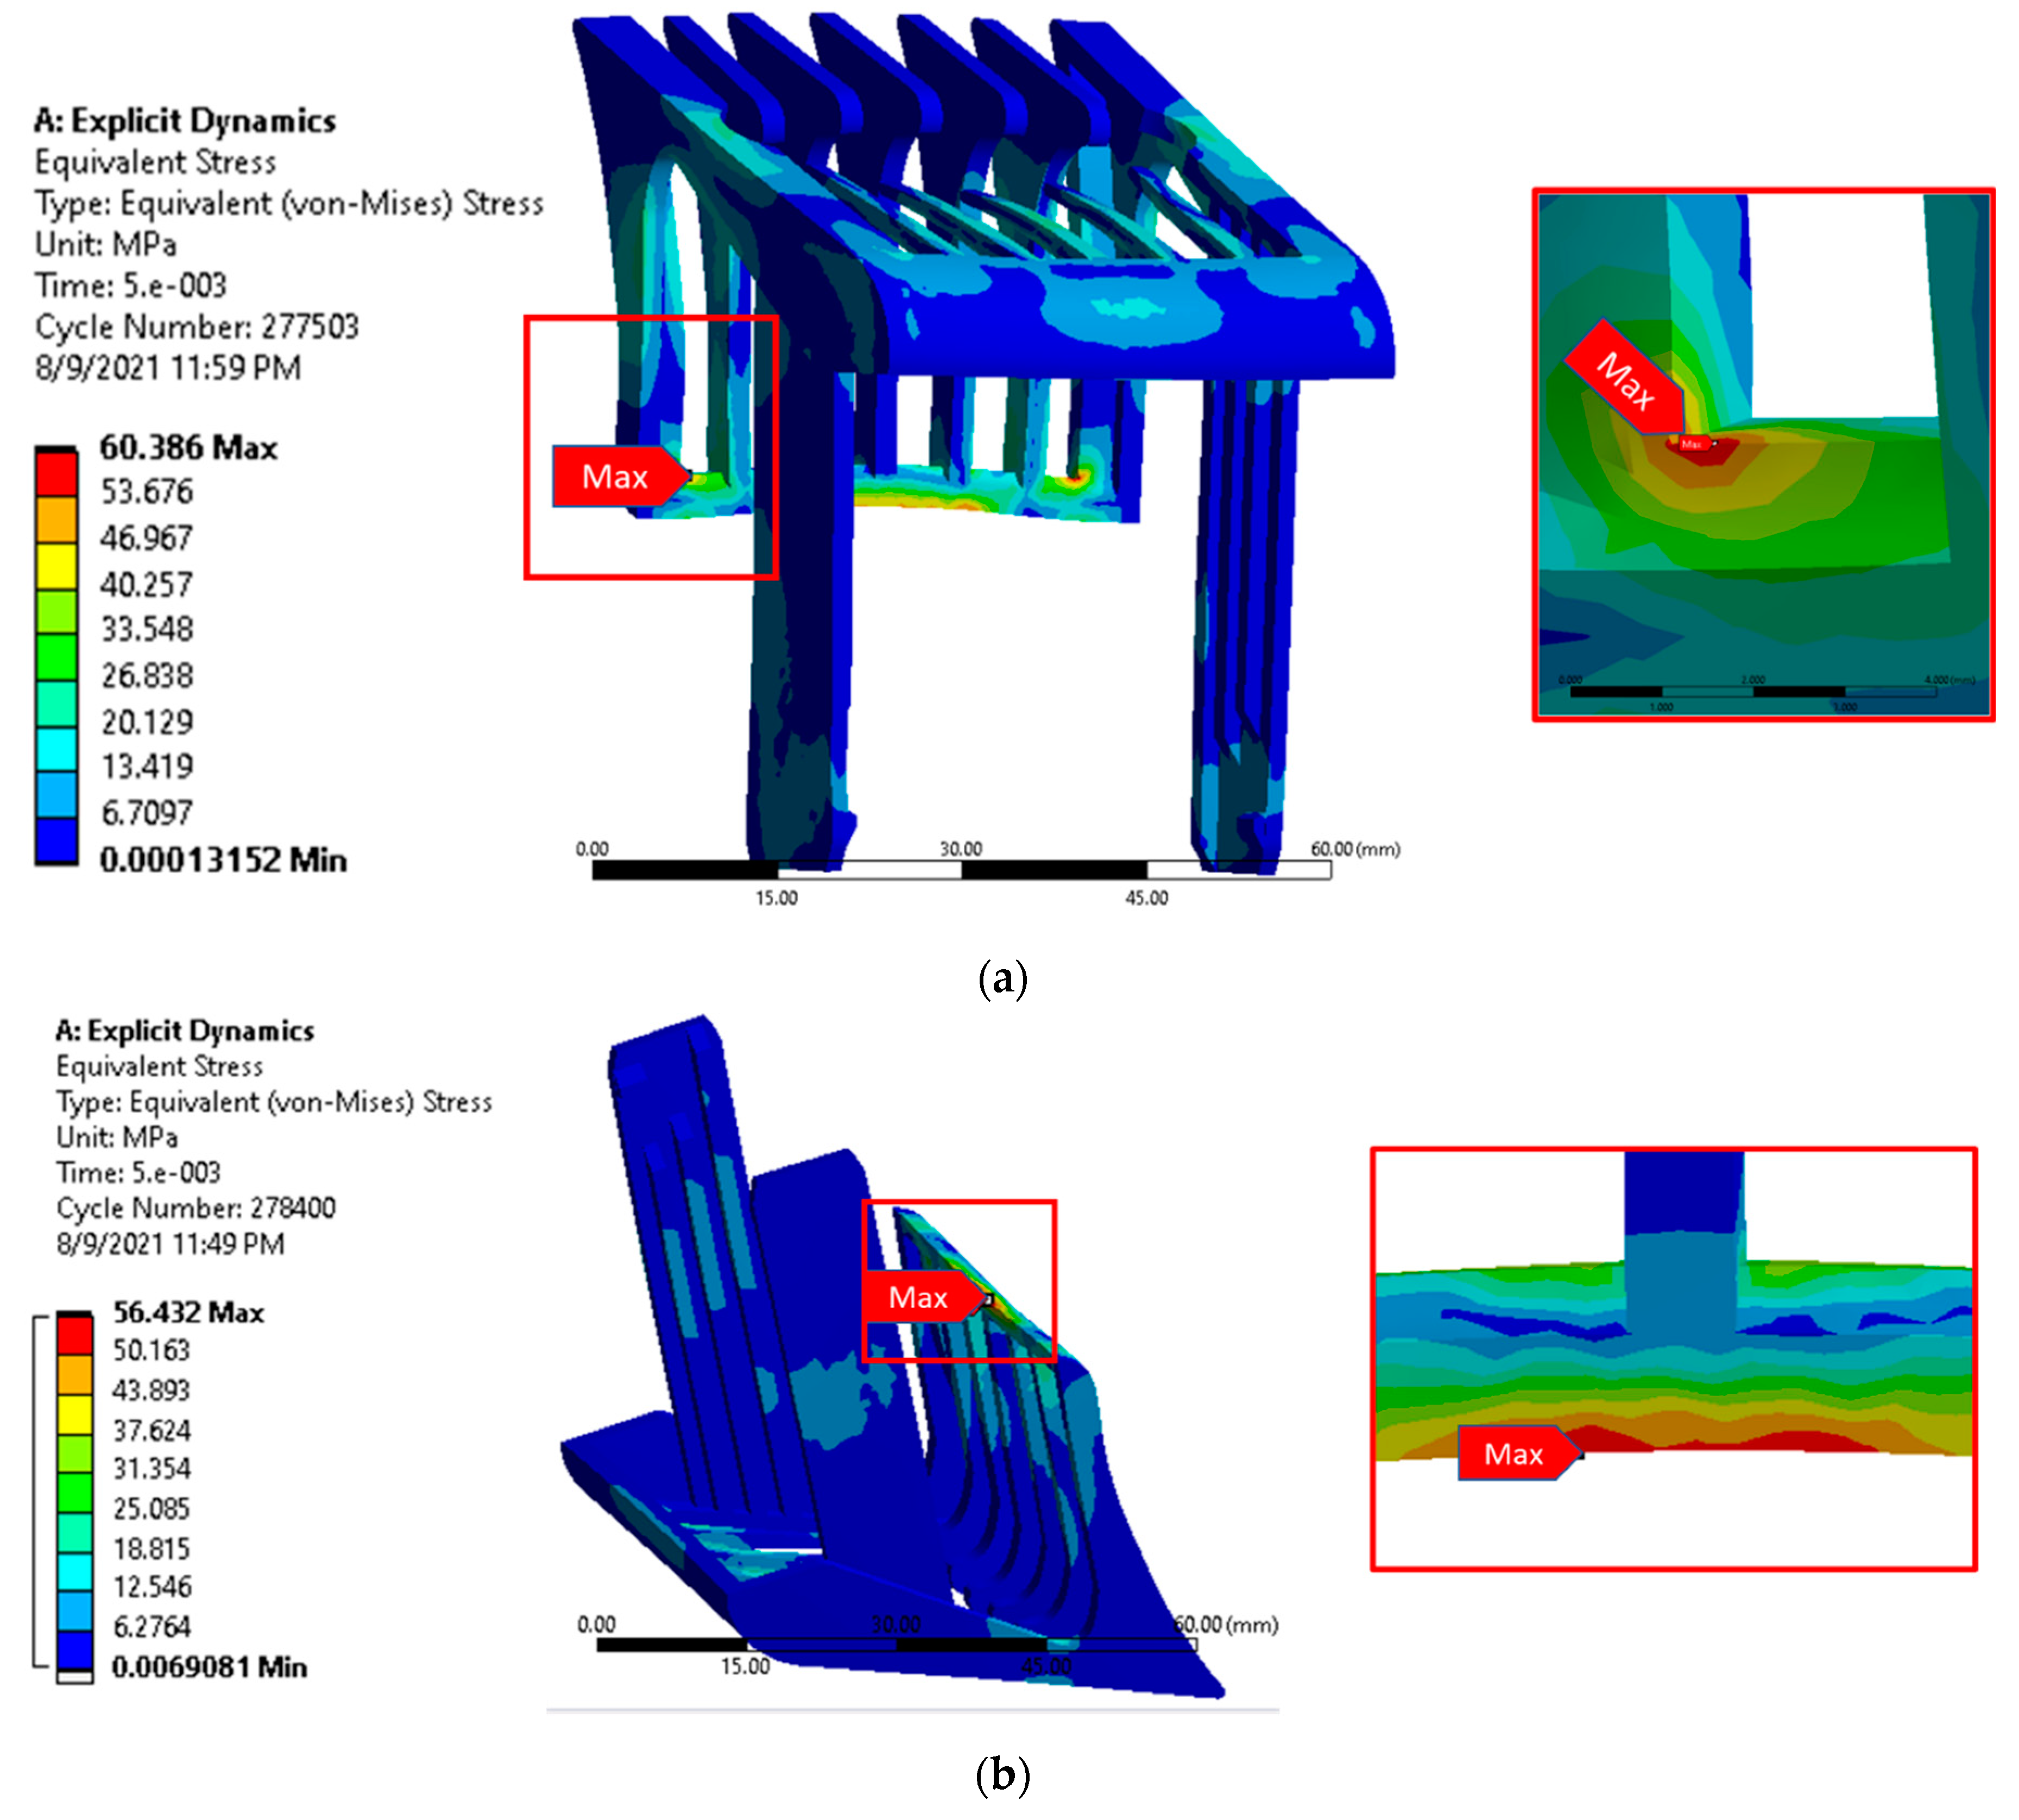
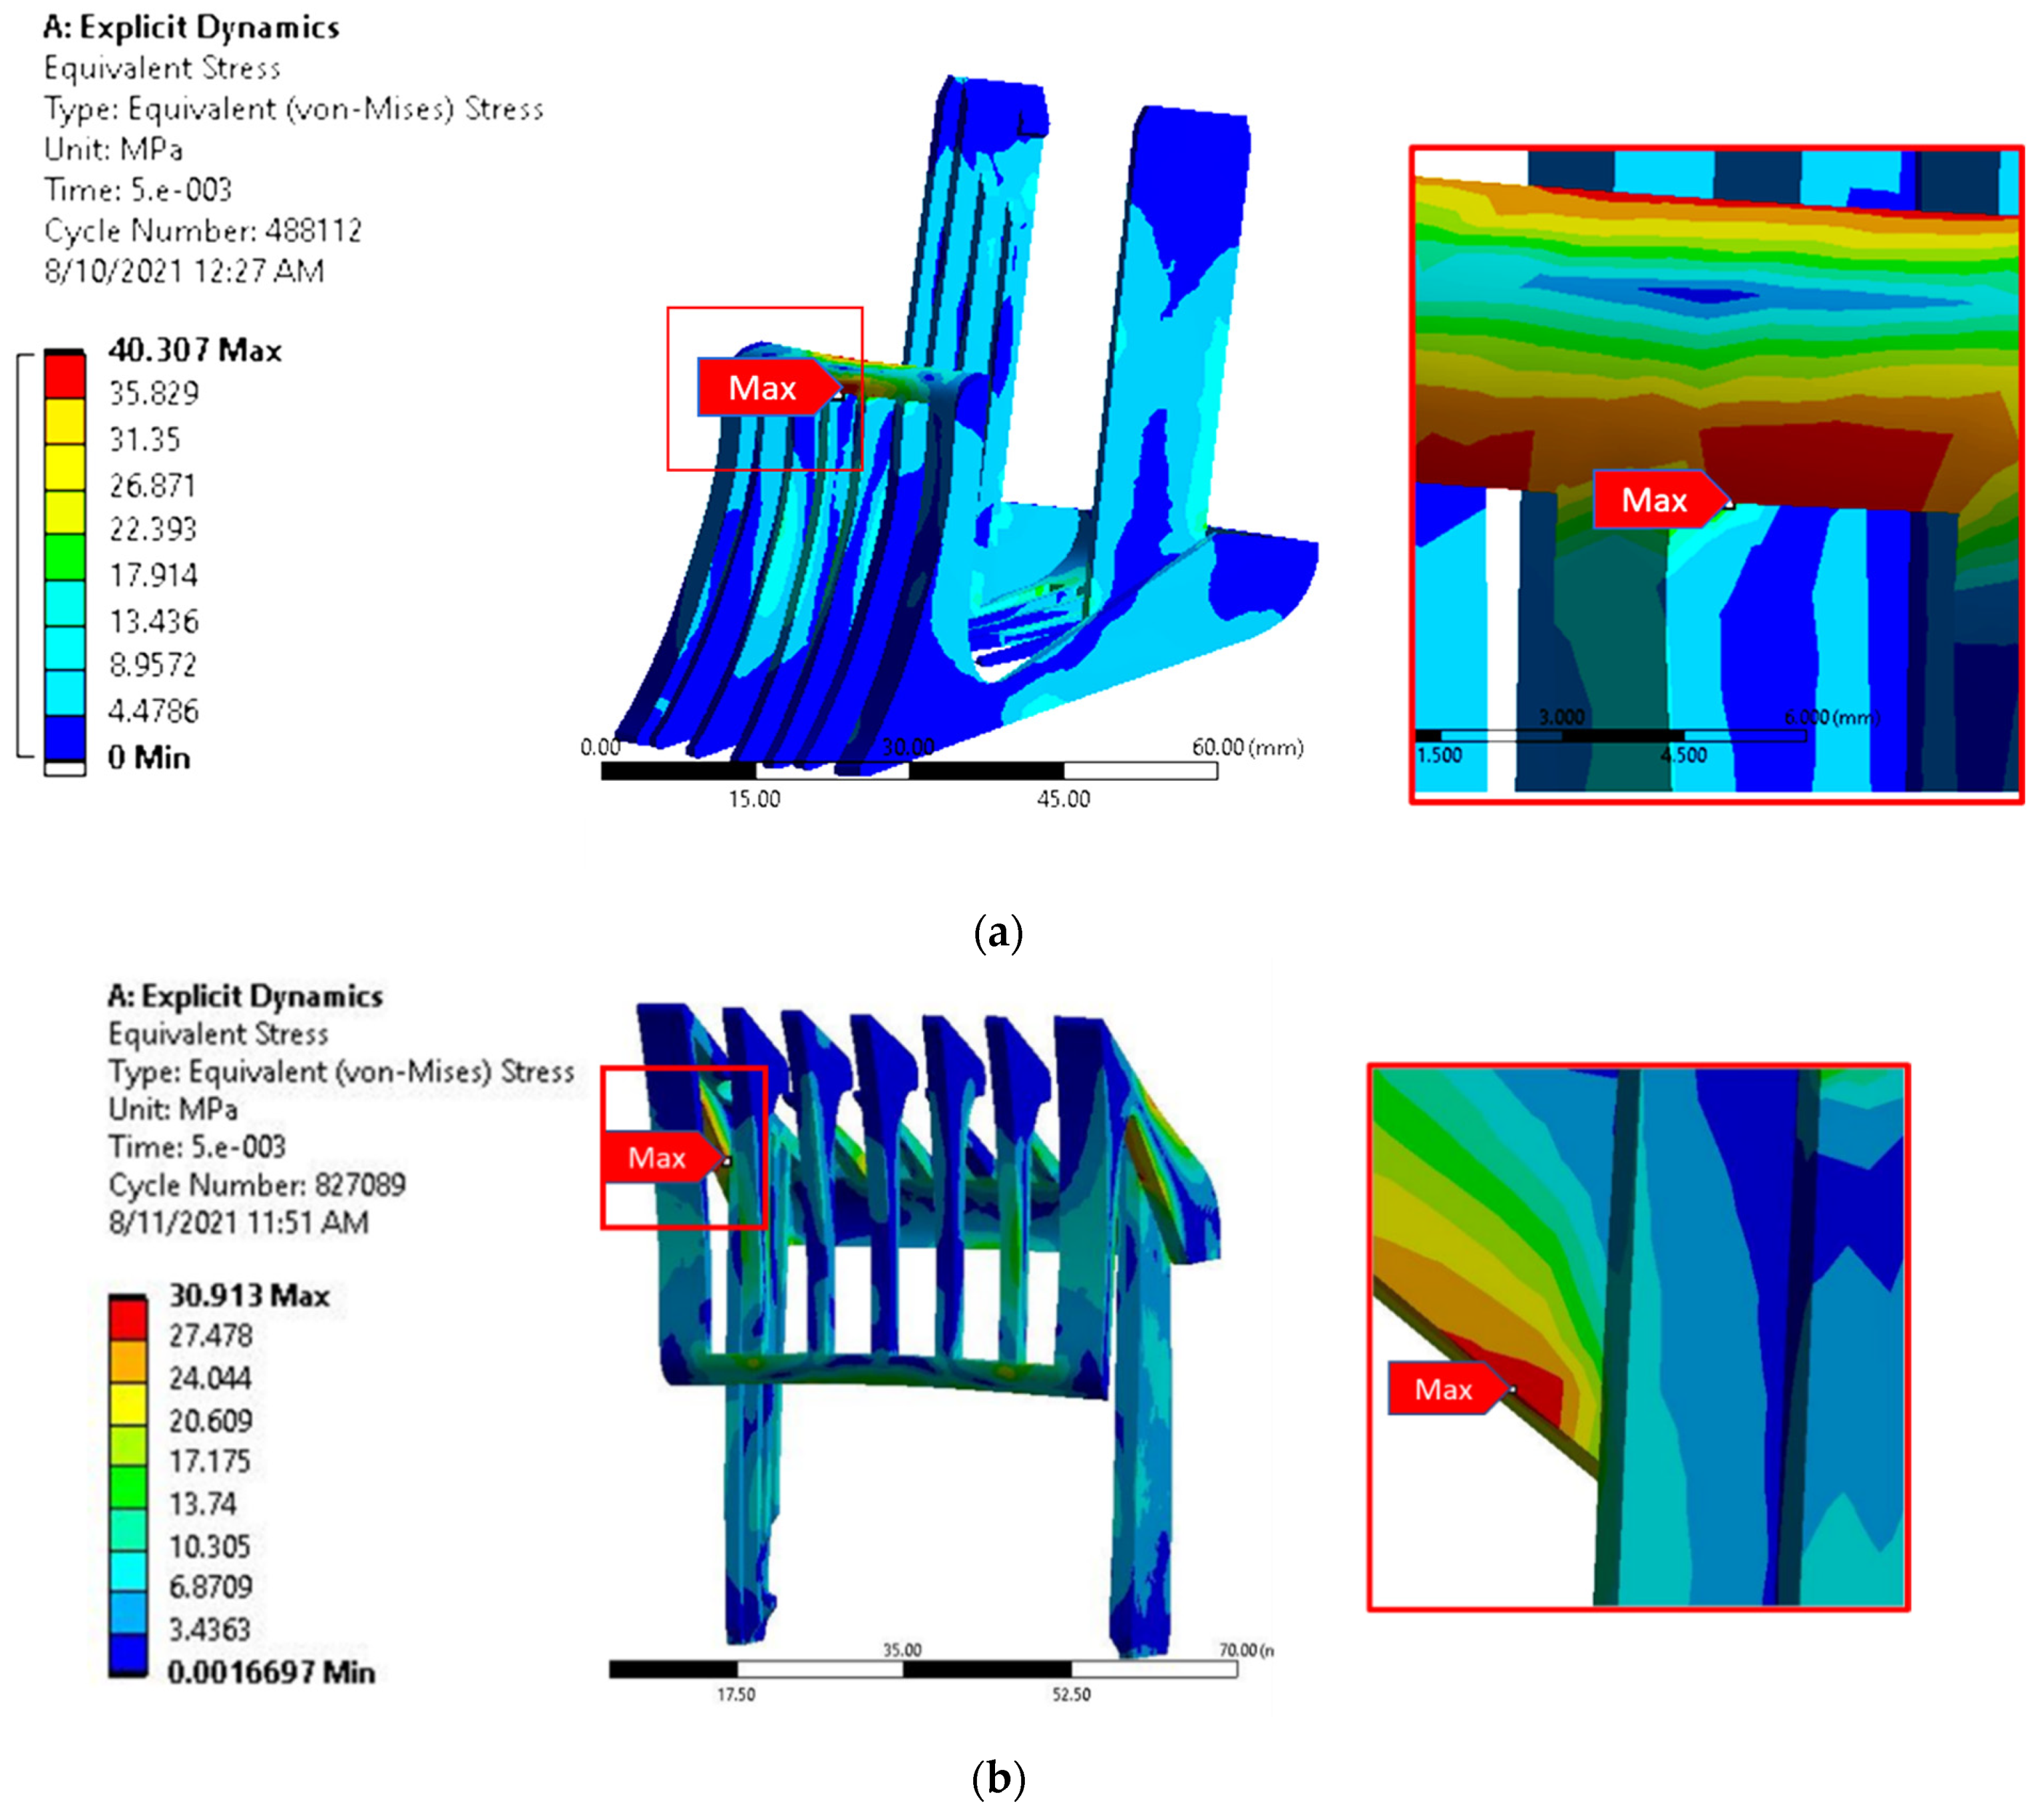
3.1. Drop Test Analysis of the PLA Model

First, the FEA of the designed hair clipper comb was performed to check the maximum strength for the two materials in head and leg impact using ANSYS. The two orientations for the drop, namely head and leg, were chosen because they correspond to the sharpest corners which are expected to give rise to potentially destructive stress concentrations. In the leg there is the additional factor of minimum material that is not supported by ribs owing to the constraint of assembly with the main body of the clipper. The additively manufactured hair clipper comb was then dropped on the floor to validate the results from FEA. Figure 5 shows stress distribution on the hair clipper comb for the PLA solid model under head and leg drop. Results show that the maximum stresses are generated along the corner and middle of fins, as shown in the magnified views. The maximum stresses were found for Figure 5a,b to be 60.4 MPa and 56.4 MPa respectively. These stress values are greater than the ultimate tensile strength (UTS) of PLA (59.1 MPa) [25].
After the solid model, a modified 1 mm shell model was created. Figure 6 shows stress distribution on the shell model under head and leg drop test on the same material. The result shows that the maximum stress concentration was at the centre and sides of the hair clipper comb as highlighted in the magnified figures. The maximum stress values were 40.3 MPa and 30.9 MPa for Figure 6a and b respectively. The maximum stress value for hollow design (shell model) in both cases is less than the UTS of PLA. The results point to the suitability of the shell model made of PLA material for the hair clipper comb.

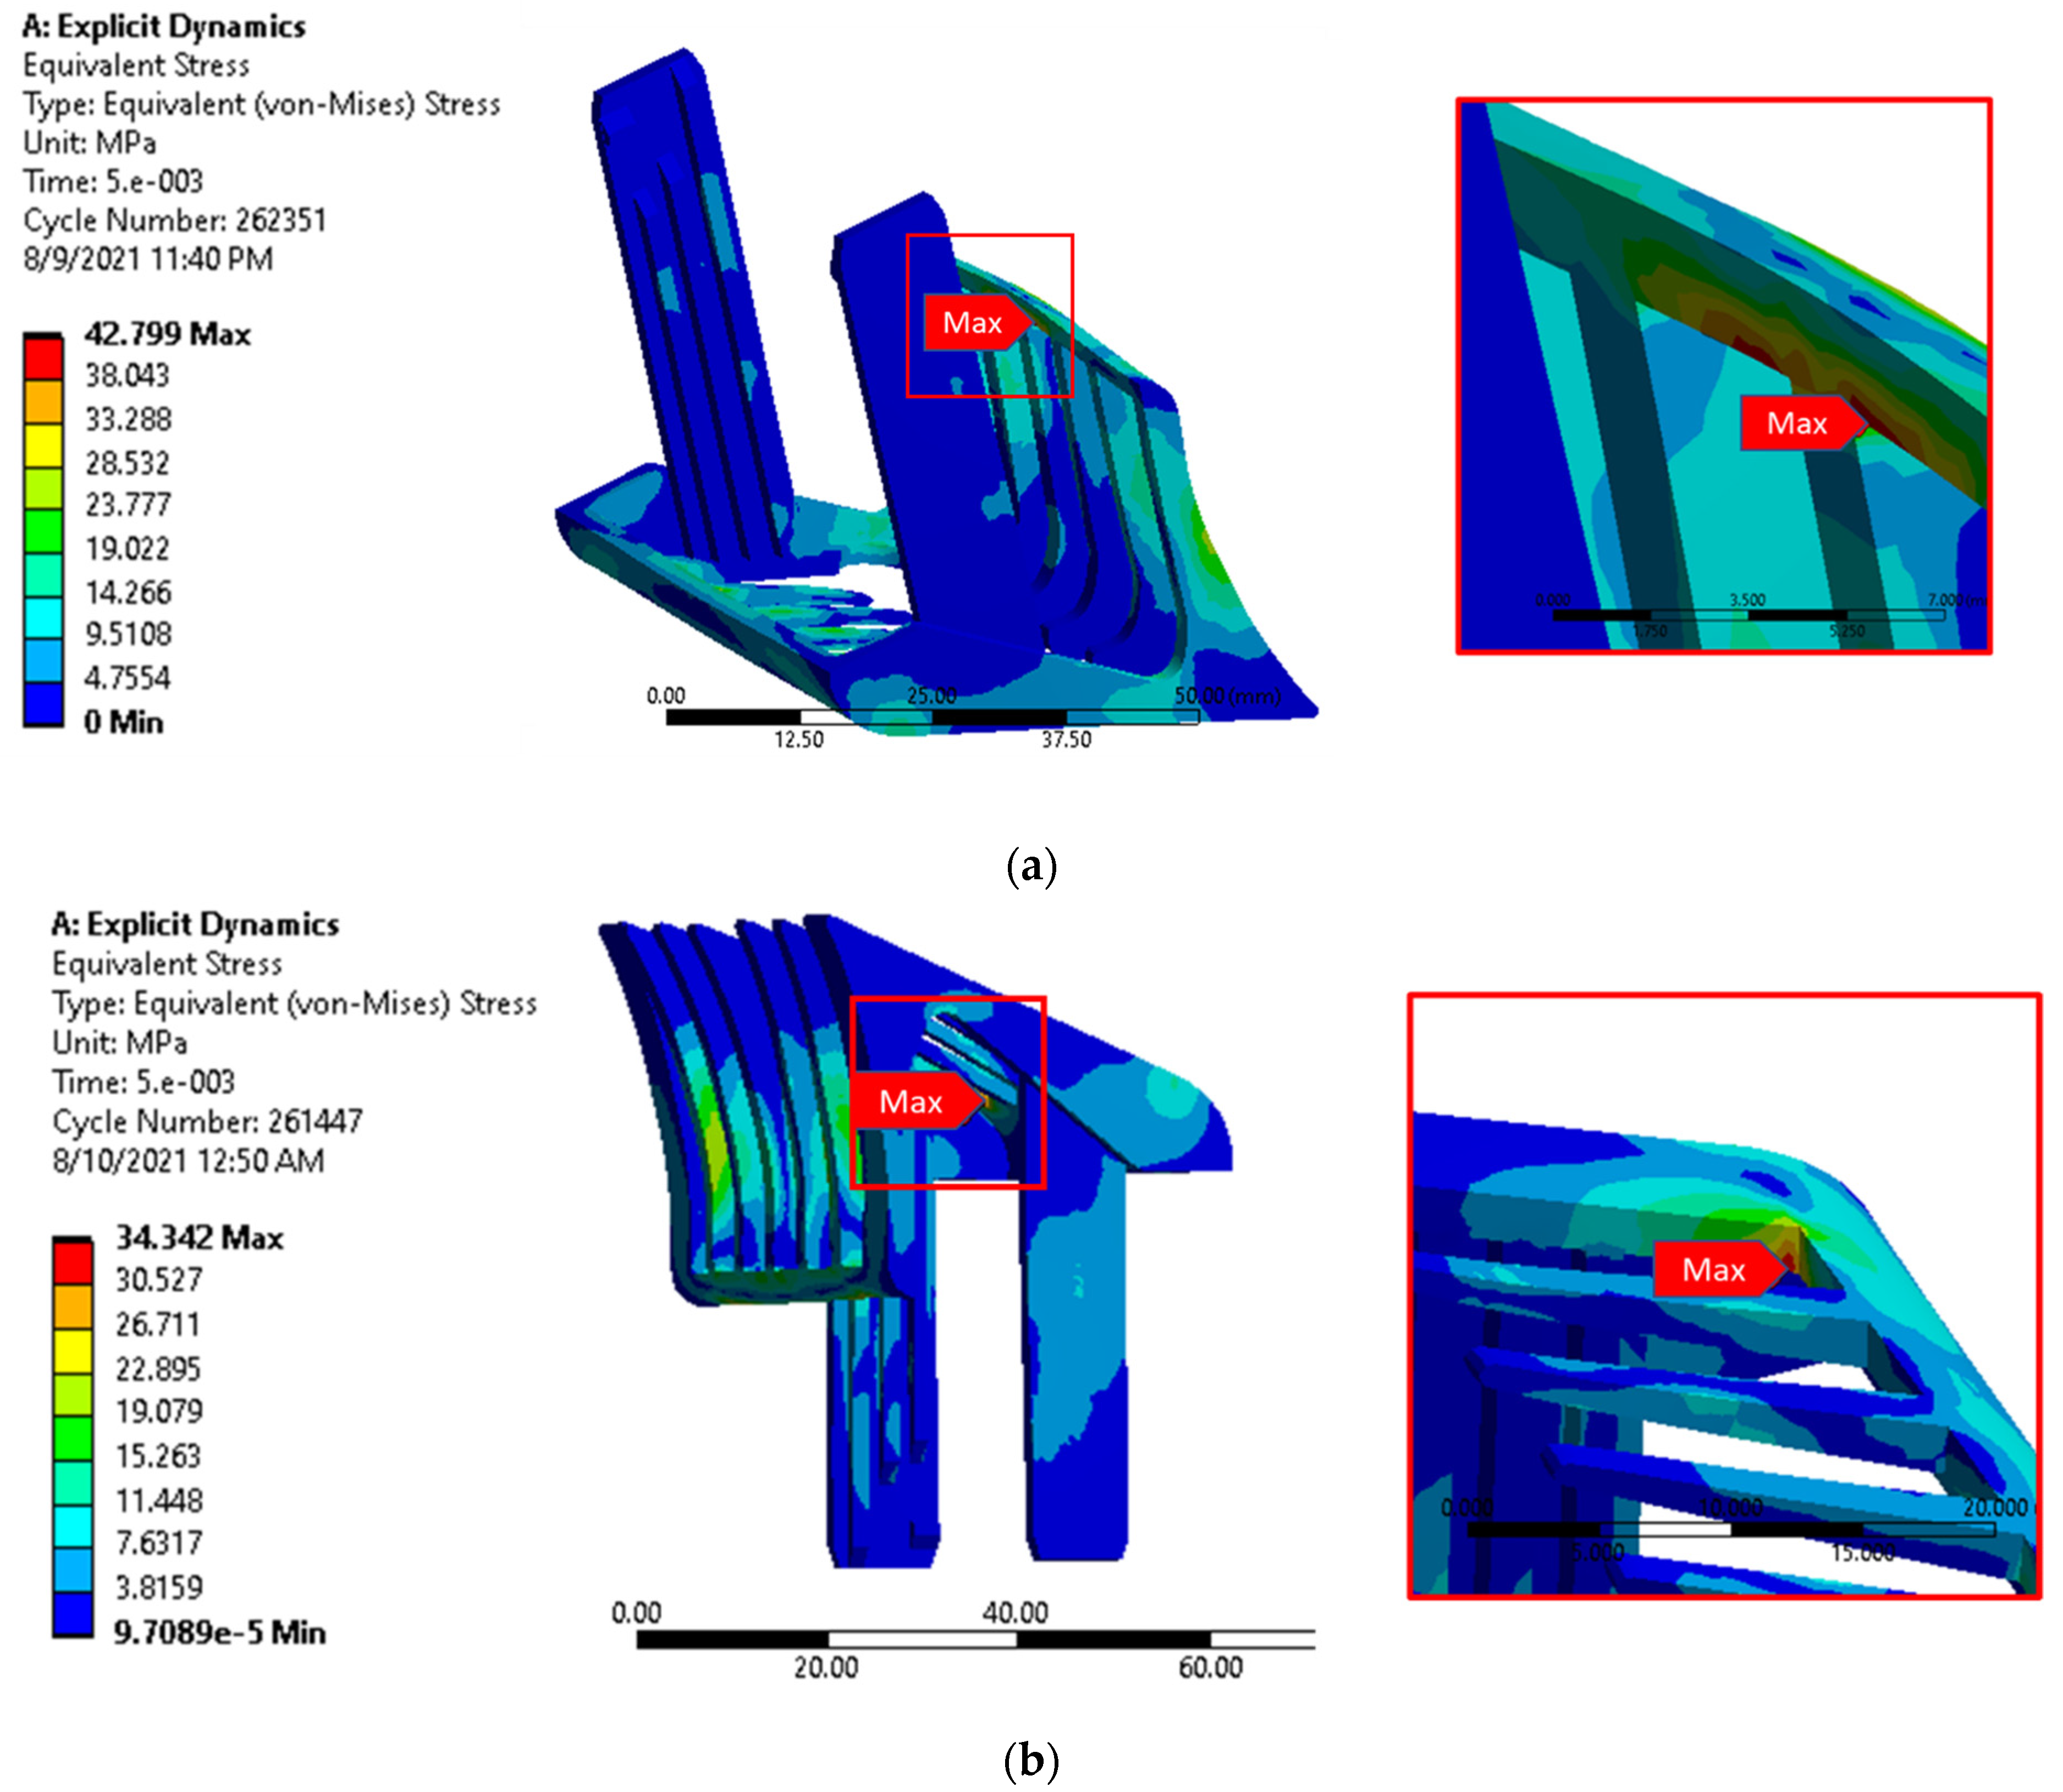
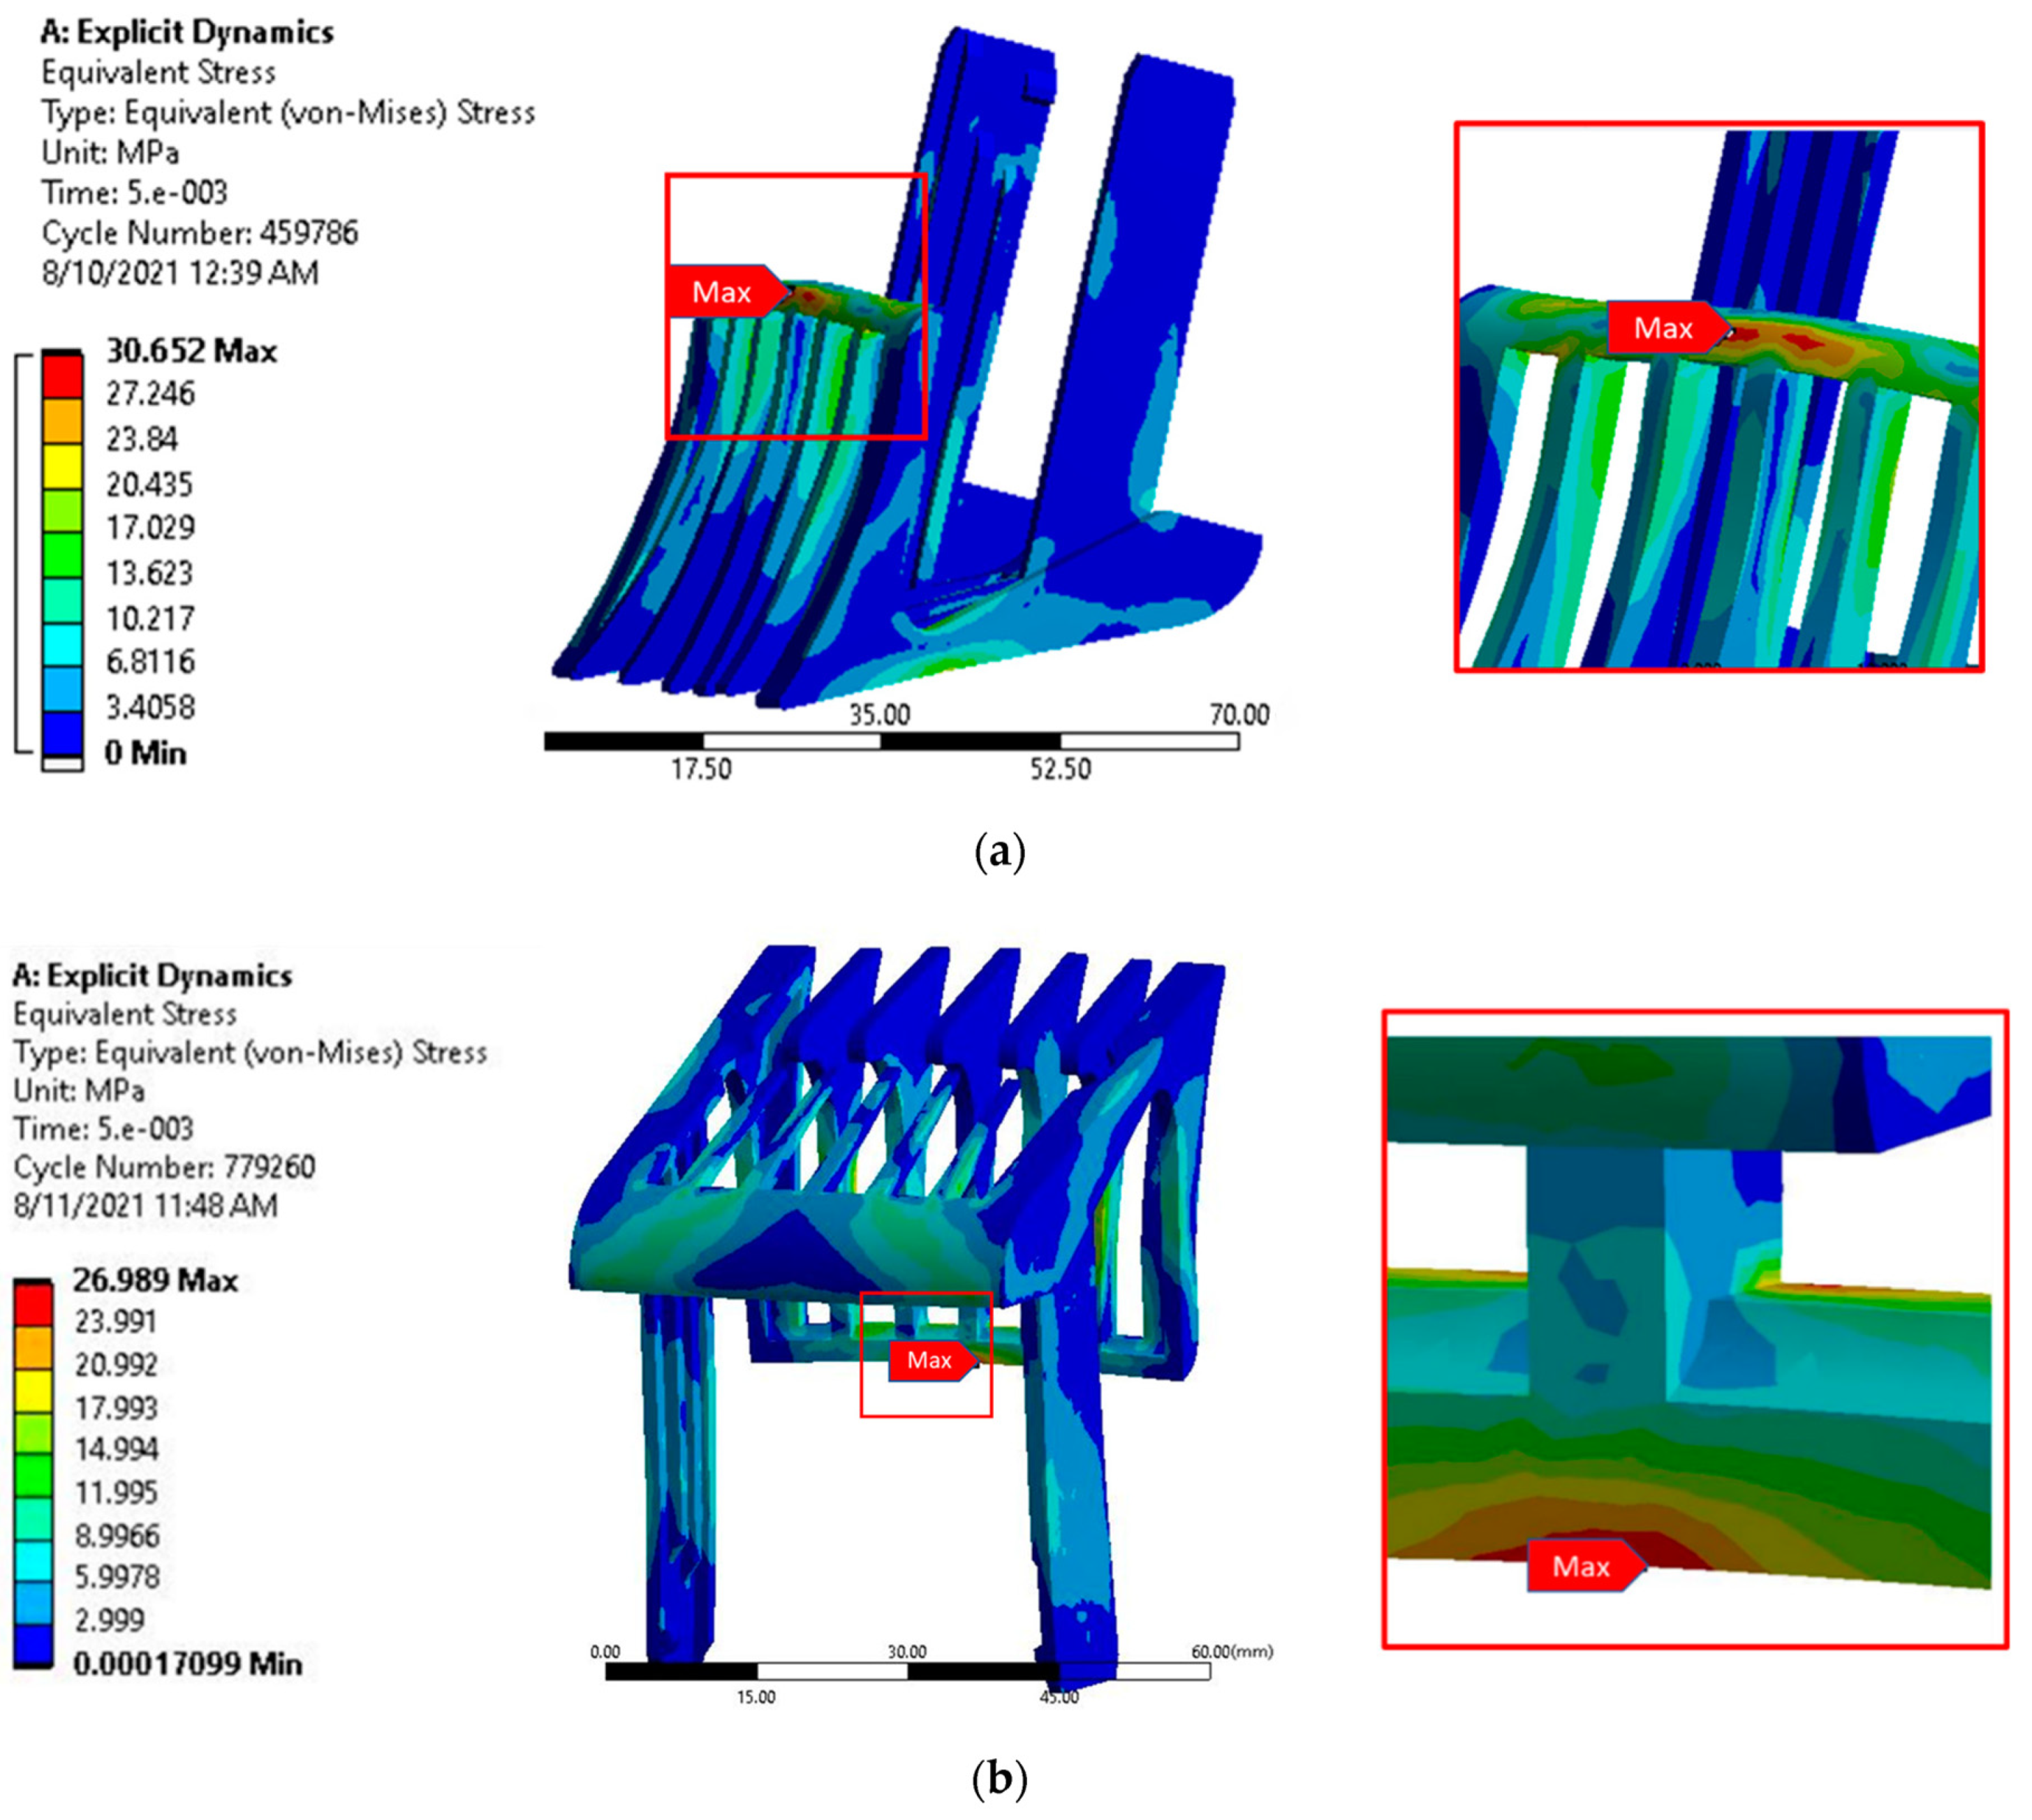
3.2. Drop Test Analysis of the ABS Model

Figure 7 shows the stress distribution resulting from the free fall drop test for the solid model made of ABS. The stresses generated on the front face and in the corner of the hair clipper comb are highlighted in Figure 7a,b, respectively. The maximum stresses are found to be 42.8 MPa and 34.3 MPa respectively. These values are less than the UTS of ABS (44.2 MPa).
Figure 8a,b show the stress distribution on the shell model with the leg and head drop tests respectively. The maximum stresses are generated on the front face, having stress values 30.6 MPa and 26.9 MPa respectively. These values are also less than the UTS of ABS. This means that ABS is suitable for impact in both solid and shell models. Table 4 summarizes the stress values from numerical analyses for all the cases.

3.3. Drop Test of PLA & ABS Fused Deposition Models

Additively manufactured solid and shell models were dropped from the height of 5 ft for validation of numerical results obtained earlier. A crack appeared in the FDM PLA solid model after the impact. The crack initiated exactly from the area where stress concentration was found to be maximum in the numerical simulation. The location of the initiation of crack is not surprising but the agreement between the experiment and the numerical simulation validates the accuracy of the numerical simulation.

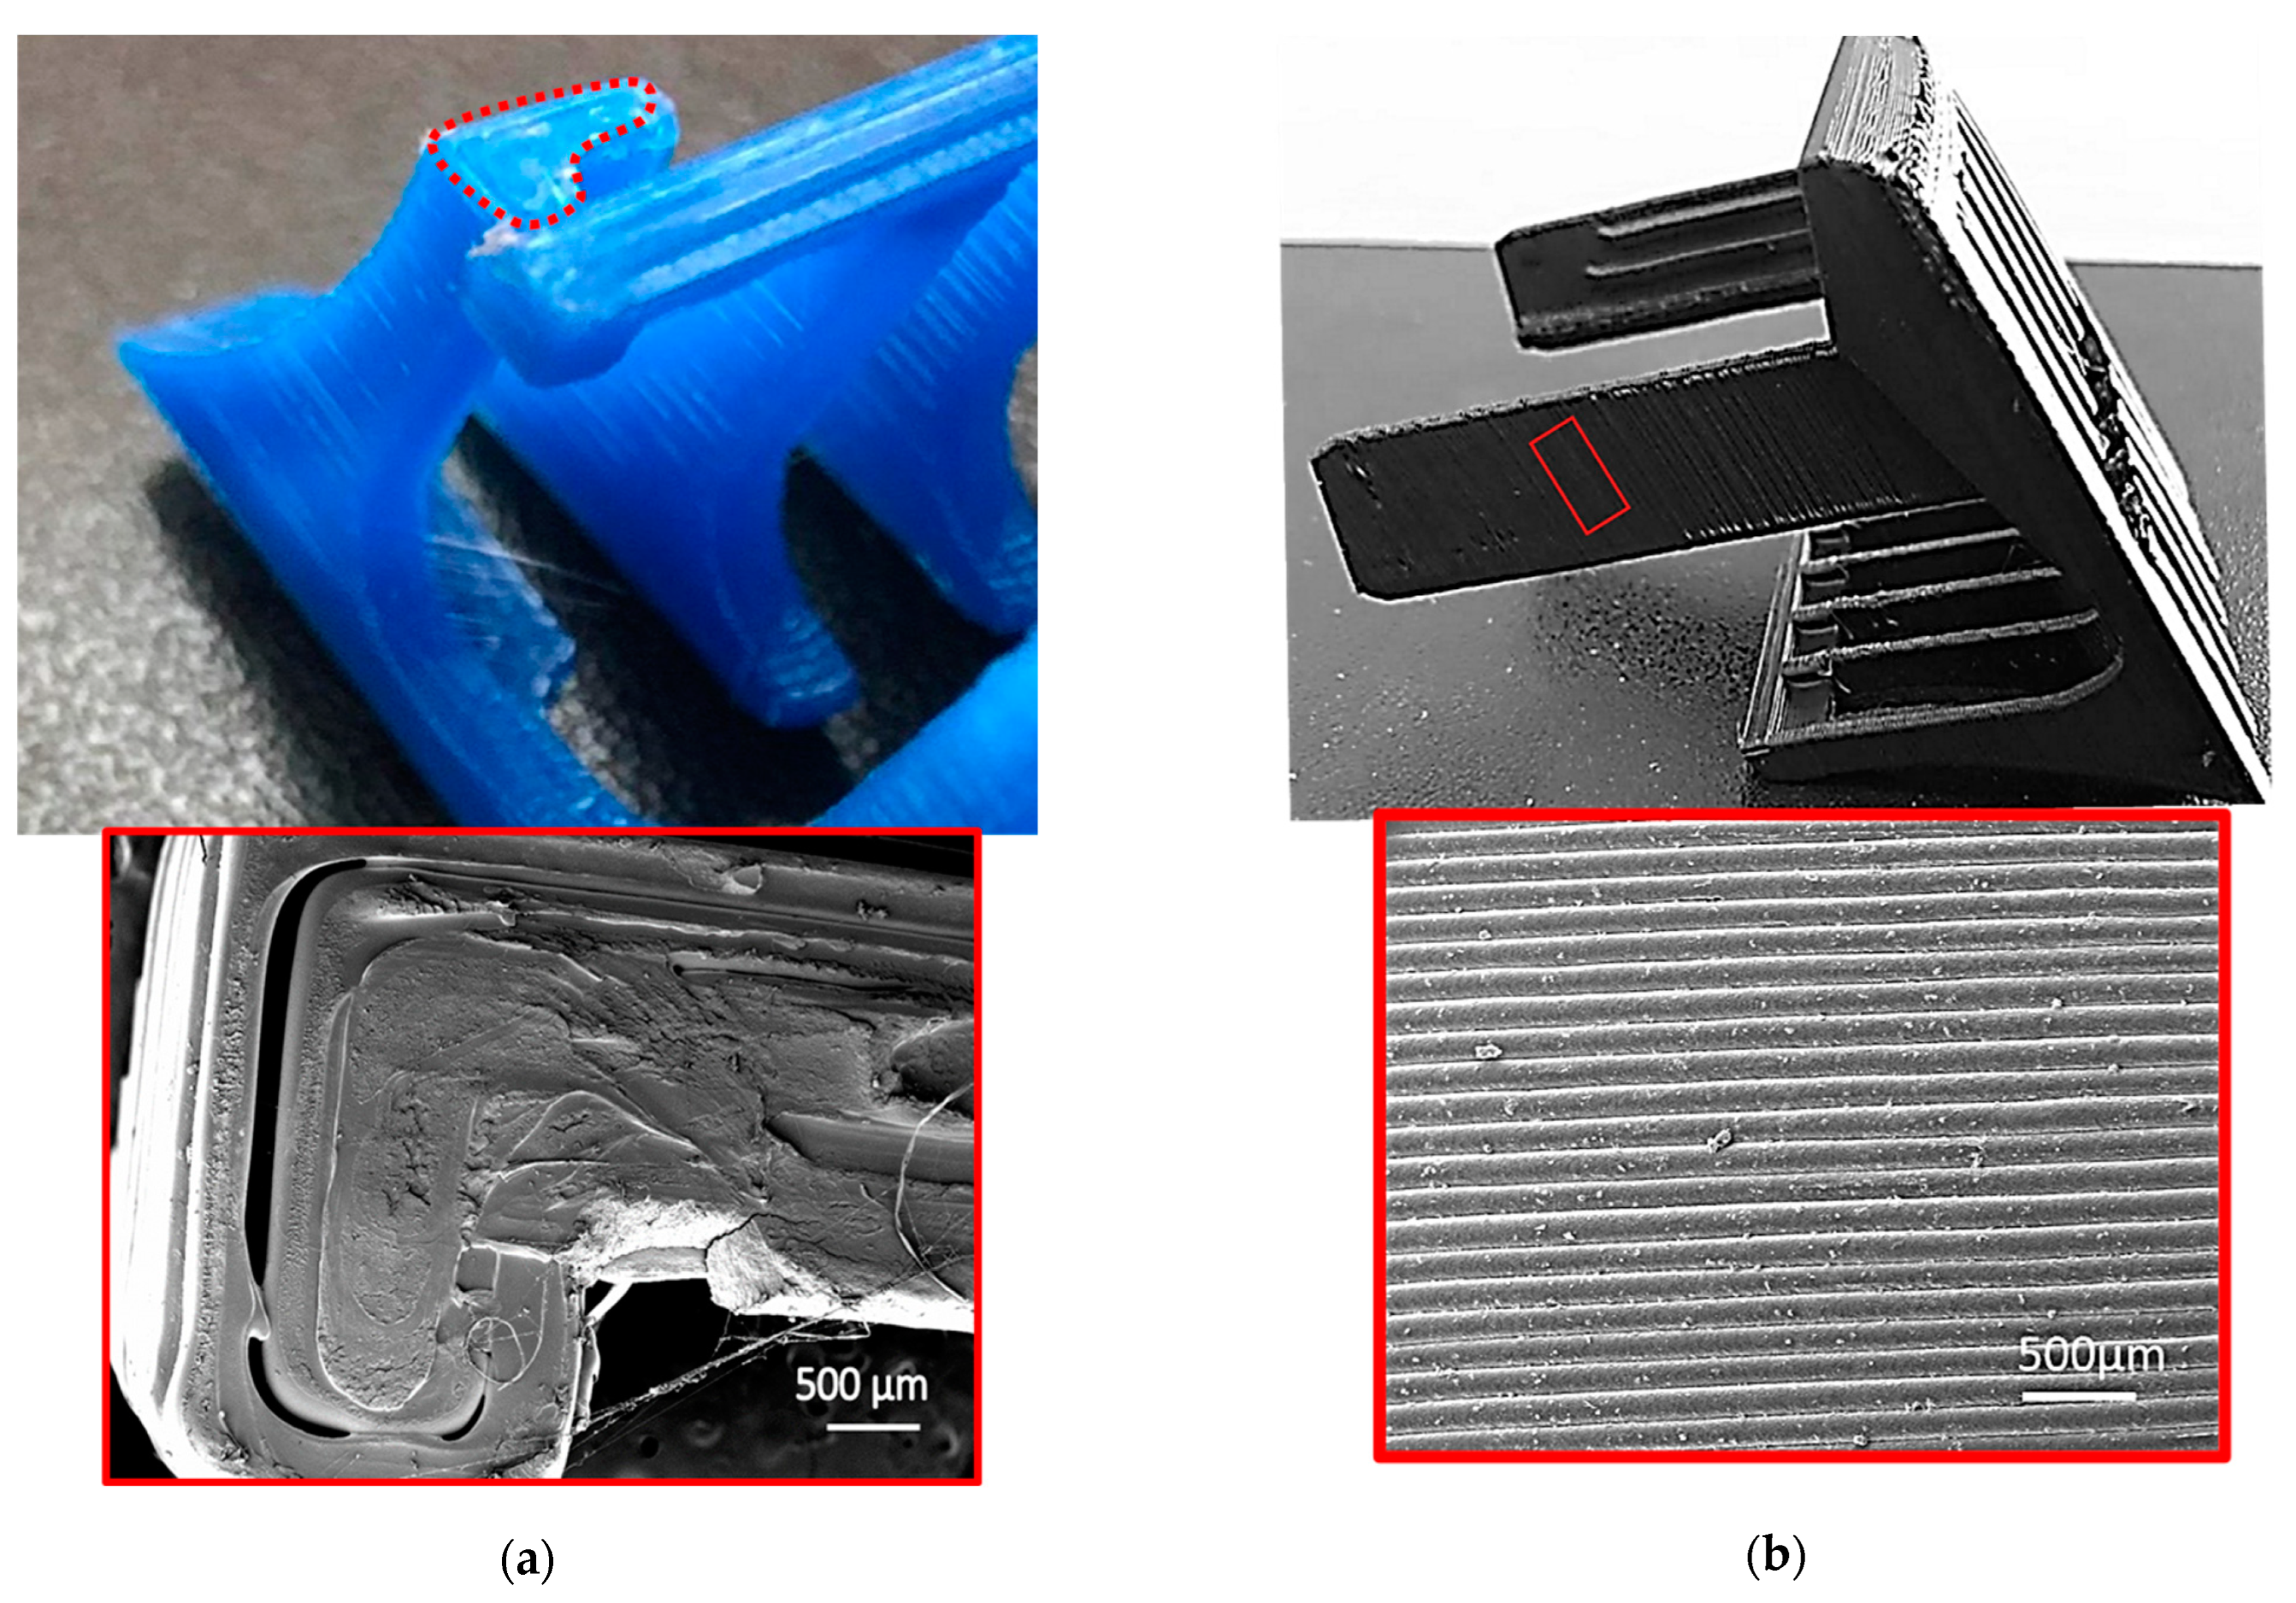
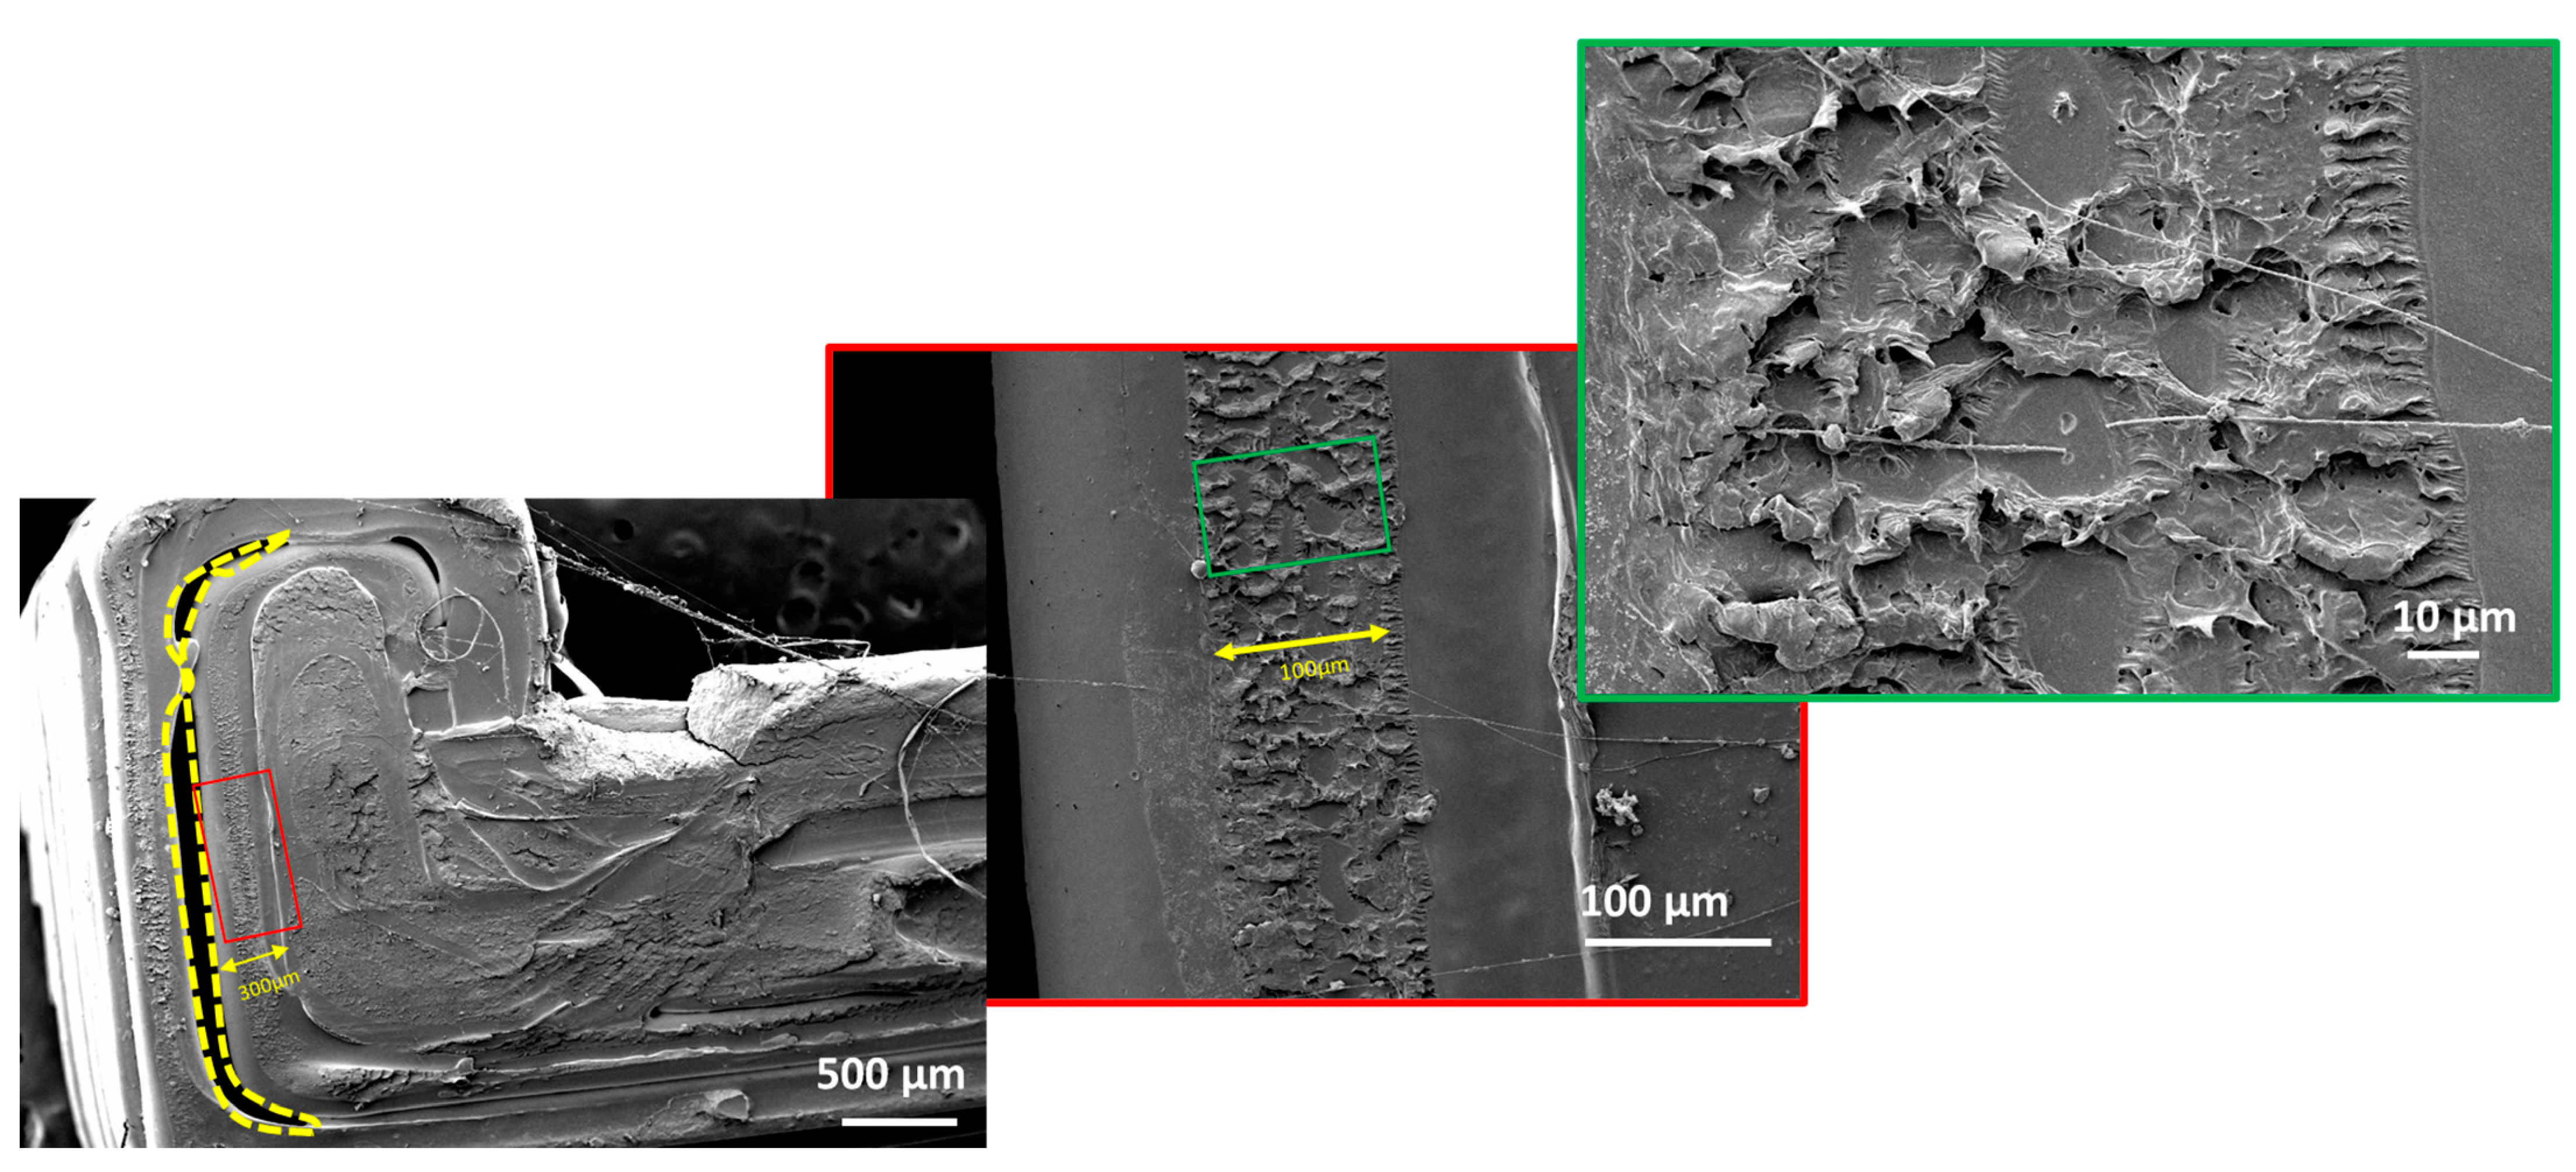
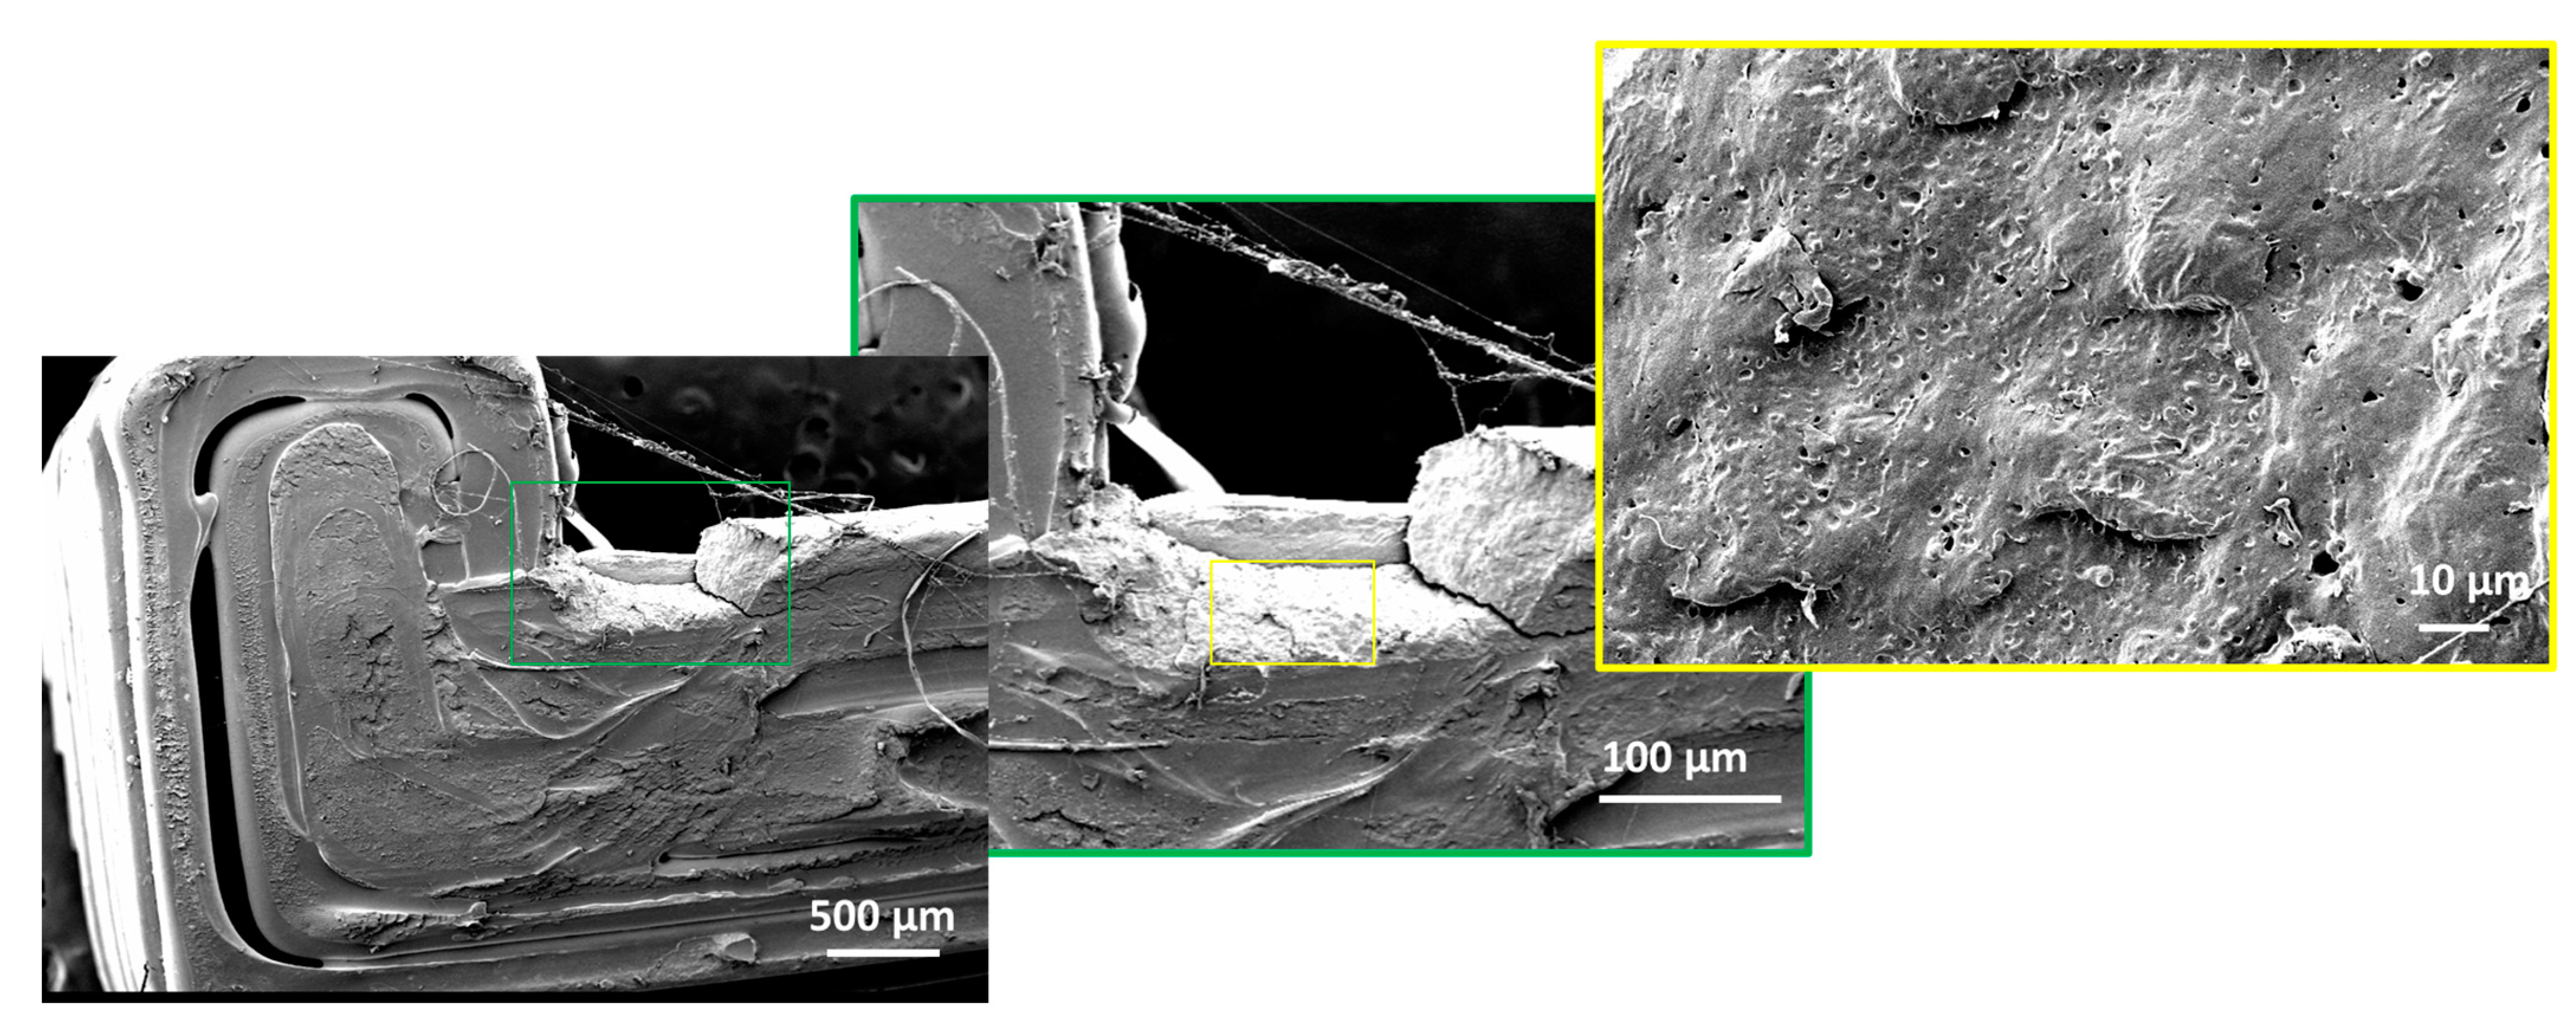
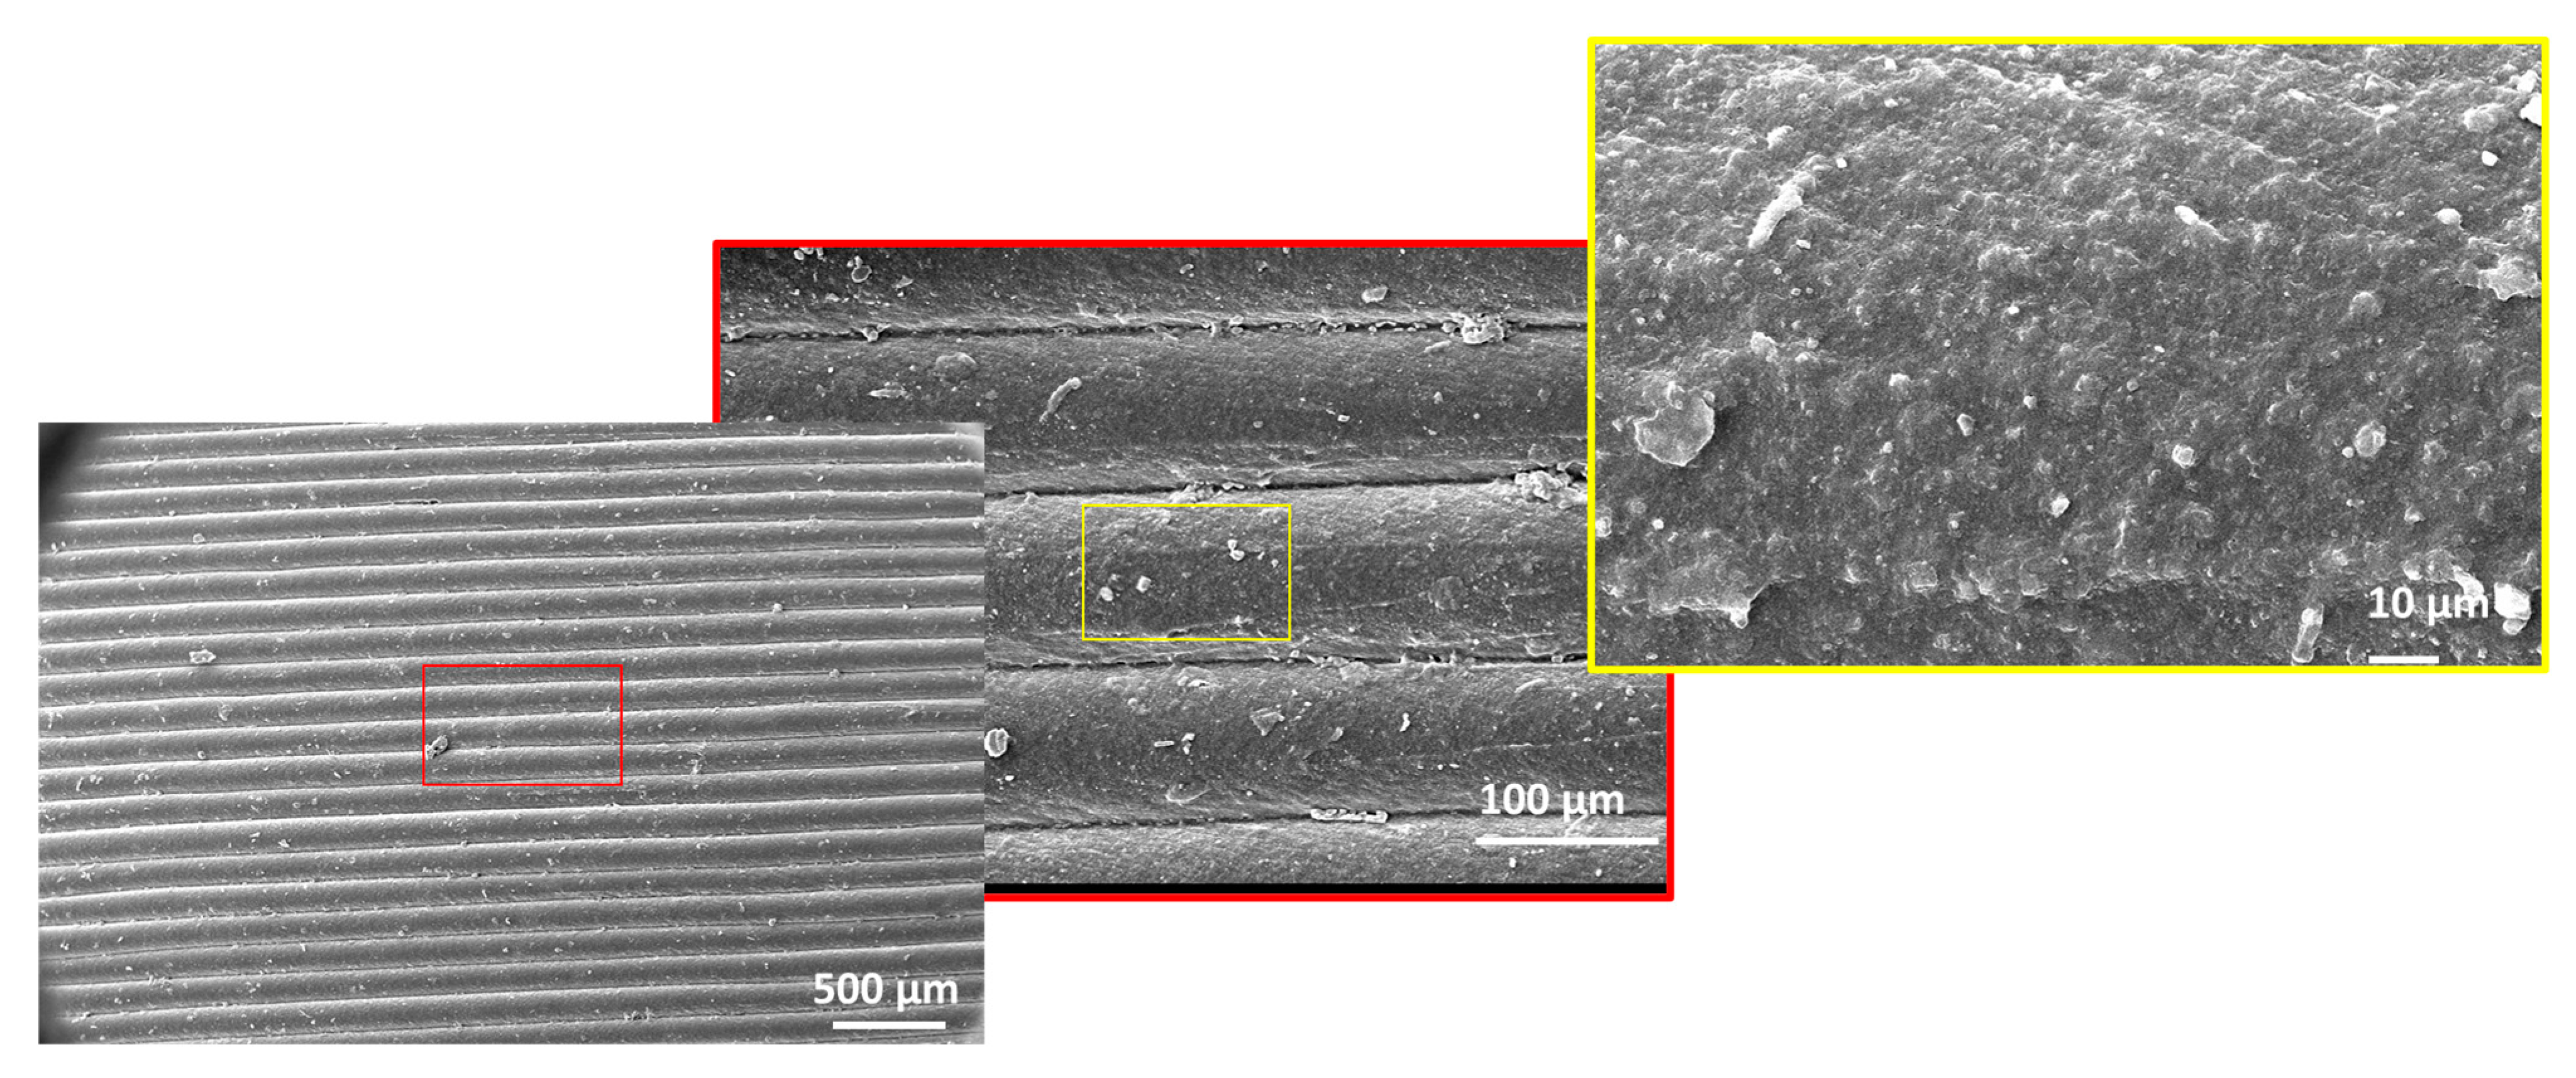
3.4. Scanning Electron Microscopy

The fracture surface morphology of the solid PLA model and ABS solid model in as-printed condition were analyzed using Scanning Electron Microscopy (SEM). SEM micrographs of fractured PLA and FDM ABS samples are shown in Figure 9a and Figure 9b respectively.

3.4.1. SEM of PLA

In Figure 10, the extruded fibre string roughly 0.3 mm matches with the diameter of the extruder nozzle. The region encompassing the surface morphology of a single fibre selected for examination at higher magnification is highlighted in the red box. The central region of the surface of a single fibre showing a relatively rough patch stretching for about 100 μm was in turn examined at a higher magnification highlighted in the green box. Obvious signs of porosity perpendicular to the direction of extrusion were visible. Non-homogenous surface finish, bulging out of the PLA filament and corresponding porosity indicate defects induced during the manufacturing of the filament.
The region outlined in yellow dots in Figure 10 clearly represents poor adhesion between the subsequently printed fibre within the same layer. The interfacial bonding between neighboring filament passes starts when the interface temperature is above the glass transition temperature, which allows easy flow of the polymer material. The heated interface allows for diffusion to take place at the point of contact between neighboring filament passes.
During additive manufacturing of polymeric materials via FDM, the semi-melted polymer is directed out of the nozzle at a temperature which is above its glass transition temperature. This filament gets deposited next to the previously deposited pass which is at a considerably lower temperature. Thereby, the interface temperature rises momentarily and then falls below the glass transition temperature, resulting in poor adhesion between neighboring filaments, which promotes the formation of voids and defects. A long internal void as seen at the exterior end of the part (outlined in yellow) is associated with the lack of temperature dependent interfacial diffusion/bonding as well as stresses associated with the sharp geometric corners prohibiting maximum interfacial contact.
The sharp corner region of stress concentration as observed in the impact test simulation, indicating internal fibre failure (highlighted in yellow) is shown in Figure 11. The inner region of a single fibre shows a through crack originating from the exterior surface (region of high stress). The fractured surface region was further examined at higher magnification to analyze the presence of any internal defects as shown in the enlarged view in the green box. There are obvious signs of uniformly spread internal porosity with a flat fracture surface indicating brittle fracture triggered by high stress and facilitated by the internal defects within the PLA filament.

3.4.2. SEM of as Printed ABS

Figure 12 shows the SEM images of as printed ABS. Visible signs of interfacial porosity suggest weak bonding between the fibre layers. SEM images clearly indicate that the interfacial bonding between neighboring filaments is weak, which was also the case with the PLA filament. The interface temperature is above the glass transition temperature here as well, which allows the filament easy flow while printing. The filament gets deposited next to the previously deposited layer whose temperature has in the meanwhile dropped, which results in poor bonding between neighboring filaments and promotes the formation of voids and defects. However, the examination of the surface of a single ABS fibre shown in Figure 12 (as shown in the magnified view in yellow) suggests that it was free from any evident signs of air bubbles/porosity, which is unlike the case of PLA. It can be fairly concluded that the impact strength of the material (44.41 MPa) as well as limited number of manufacturing defects helped the hair clipper comb to absorb the impact stress without failure.

4. Conclusions

Adjustable combs that come with commercial hair clippers keep falling to the ground and break frequently, while the hair clipper itself typically remains functional for a much longer time. This study demonstrates the potential of using fused deposition modelling of two readily available thermoplastic filaments, namely ABS and PLA, to manufacture an economic hair clipper comb. In the first phase a customizable CAD model of the hair clipper comb was subjected to a finite element drop test simulation using the explicit dynamics module in ANSYS. In case of PLA material, the maximum stress upon impact was observed to be greater than the ultimate tensile strength of the material while for ABS the maximum impact stress was well within the UTS of the material. In the next phase, to utilize their improved strength-to-weight ratio, shell based (hollow) designs were also subjected to drop test simulations. The maximum stress upon impact for the shell designs were observed to be 40.3 MPa and 30.6 MPa for PLA and ABS respectively. The simulated results suggest that shell-based hair clipper combs are likely to absorb the impact force without failure. These simulation results were validated using a drop test conducted from a height of 5 ft, the typical height at which the product is used. It was verified that the crack in failed specimens originated exactly from the area where the maximum stress was observed in the numerical simulations. Out of all the tested designs, the shell model made of ABS tuns out to be most suitable in terms of likelihood of withstanding the fall without breaking. Assessing the suitability of other 3D printable (PET-G, Nylon, Carbon fibre) materials for common applications such as the hair clipper comb suggests itself as an interesting study for the future.

Supplementary Materials

The following supporting information can be downloaded at: https://www.mdpi.com/article/10.3390/su14138071/s1, Figure S1: Mesh convergence analysis; Figure S2: Calculated average skewness value; Figure S3: Calculated average orthogonal quality value; Table S1: Skewness mesh metrics spectrum; Table S2: Orthogonal quality mesh metrics spectrum.

Author Contributions

Conceptualization, H.A.S. and B.A.A.; Data curation, U.A.; Formal analysis, B.A.A.; Investigation, U.A.; Methodology, U.A., H.A.S., B.A.A. and S.U.B.; Resources, H.A.S., B.A.A. and R.K.; Supervision, H.A.S., B.A.A., S.U.B. and R.K.; Validation, U.A.; Writing—original draft, U.A.; Writing—review & editing, H.A.S., B.A.A., S.U.B. and R.K. All authors have read and agreed to the published version of the manuscript.

Funding

This research received no external funding.

Institutional Review Board Statement

Not applicable.

Informed Consent Statement

Not applicable.

Data Availability Statement

The data presented in this study are available on request from the corresponding author.

Conflicts of Interest

The authors declare no conflict of interest.

References

  1. Goodridge, R.D.; Tuck, C.J.; Hague, R.J.M. Laser sintering of polyamides and other polymers. Prog. Mater. Sci. 2012, 57, 229–267. [Google Scholar] [CrossRef]
  2. Aboulkhair, N.T.; Simonelli, M.; Parry, L.; Ashcroft, I.; Tuck, C.; Hague, R. 3D printing of Aluminium alloys: Additive Manufacturing of Aluminium alloys using selective laser melting. Prog. Mater. Sci. 2019, 106, 100578. [Google Scholar] [CrossRef]
  3. Sing, S.L.; An, J.; Yeong, W.Y.; Wiria, F.E. Laser and electron-beam powder-bed additive manufacturing of metallic implants: A review on processes, materials and designs. J. Orthop. Res. 2016, 34, 369–385. [Google Scholar] [CrossRef]
  4. Pérez, M.; Carou, D.; Rubio, E.M.; Teti, R. Current advances in additive manufacturing. Procedia CIRP 2020, 88, 439–444. [Google Scholar] [CrossRef]
  5. Hossain, M.A.; Zhumabekova, A.; Paul, S.C.; Kim, J.R. A review of 3D printing in construction and its impact on the labor market. Sustainability 2020, 12, 8492. [Google Scholar] [CrossRef]
  6. Le Duigou, A.; Correa, D.; Ueda, M.; Matsuzaki, R.; Castro, M. A review of 3D and 4D printing of natural fibre biocomposites. Mater. Des. 2020, 194, 108911. [Google Scholar] [CrossRef]
  7. Mitchell, A.; Lafont, U.; Hołyńska, M.; Semprimoschnig, C. Additive manufacturing—A review of 4D printing and future applications. Addit. Manuf. 2018, 24, 606–626. [Google Scholar] [CrossRef]
  8. Safai, L.; Cuellar, J.S.; Smit, G.; Zadpoor, A.A. A review of the fatigue behavior of 3D printed polymers. Addit. Manuf. 2019, 28, 87–97. [Google Scholar] [CrossRef]
  9. Melchels, F.P.W.; Feijen, J.; Grijpma, D.W. A review on stereolithography and its applications in biomedical engineering. Biomaterials 2010, 31, 6121–6130. [Google Scholar] [CrossRef] [Green Version]
  10. Farbman, D.; McCoy, C. Materials testing of 3D printed ABS and PLA samples to guide mechanical design. In Proceedings of the ASME 2016 11th International Manufacturing Science and Engineering Conference, Blacksburg, VA, USA, 27 June–1 July 2016; Volume 2, pp. 1–12. [Google Scholar] [CrossRef]
  11. Chevrychkina, A.A.; Volkov, G.A.; Estifeev, A.D. An experimental investigation of the strength characteristics of ABS plastic under dynamic loads. Procedia Struct. Integr. 2017, 6, 283–285. [Google Scholar] [CrossRef]
  12. Raney, K.; Lani, E.; Kalla, D.K. Experimental characterization of the tensile strength of ABS parts manufactured by fused deposition modeling process. Mater. Today Proc. 2017, 4, 7956–7961. [Google Scholar] [CrossRef]
  13. Gao, W.; Zhang, Y.; Ramanujan, D.; Ramani, K.; Chen, Y.; Williams, C.B.; Wang, C.C.L.; Shin, Y.C.; Zhang, S.; Zavattieri, P.D. The status, challenges, and future of additive manufacturing in engineering. CAD Comput. Aided Des. 2015, 69, 65–89. [Google Scholar] [CrossRef]
  14. Thompson, M.K.; Moroni, G.; Vaneker, T.; Fadel, G.; Campbell, R.I.; Gibson, I.; Bernard, A.; Schulz, J.; Graf, P.; Ahuja, B.; et al. Design for Additive Manufacturing: Trends, opportunities, considerations, and constraints. CIRP Ann.-Manuf. Technol. 2016, 65, 737–760. [Google Scholar] [CrossRef] [Green Version]
  15. Ahn, S.H.; Montero, M.; Odell, D.; Roundy, S.; Wright, P.K. Anisotropic material properties of fused deposition modeling ABS. Rapid Prototyp. J. 2002, 8, 248–257. [Google Scholar] [CrossRef] [Green Version]
  16. Jiang, J.; Su, L.; Zhang, K.; Wu, G. Rubber-toughened PLA blends with low thermal expansion. J. Appl. Polym. Sci. 2013, 128, 3993–4000. [Google Scholar] [CrossRef]
  17. Novakova-Marcincinova, L.; Novak-Marcincin, J.; Barna, J.; Torok, J. Special materials used in FDM rapid prototyping technology application. In Proceedings of the 2012 IEEE 16th International Conference on Intelligent Engineering Systems (INES), Lisbon, Portugal, 13–15 June 2012; p. 578. [Google Scholar]
  18. Wittbrodt, B.; Pearce, J.M. The effects of PLA color on material properties of 3-D printed components. Addit. Manuf. 2015, 8, 110–116. [Google Scholar] [CrossRef] [Green Version]
  19. Wu, N.; Zhang, H. Mechanical properties and phase morphology of super-tough PLA/PBAT/EMA-GMA multicomponent blends. Mater. Lett. 2017, 192, 17–20. [Google Scholar] [CrossRef]
  20. Lanzotti, A.; Grasso, M.; Staiano, G.; Martorelli, M. The impact of process parameters on mechanical properties of parts fabricated in PLA with an open-source 3-D printer. Rapid Prototyp. J. 2015, 21, 604–617. [Google Scholar] [CrossRef] [Green Version]
  21. Cantrell, J.T.; Rohde, S.; Damiani, D.; Gurnani, R.; DiSandro, L.; Anton, J.; Young, A.; Jerez, A.; Steinbach, D.; Kroese, C.; et al. Experimental characterization of the mechanical properties of 3D-printed ABS and polycarbonate parts. Rapid Prototyp. J. 2017, 23, 811–824. [Google Scholar] [CrossRef]
  22. Maurya, N.K.; Rastogi, V.; Singh, P. Experimental and computational investigation on mechanical properties of reinforced additive manufactured component. Evergreen 2019, 6, 207–214. [Google Scholar] [CrossRef]
  23. Majid, F.; Zekeriti, N.; Rhanim, R.; Lahlou, M.; Rhanim, H.; Mrani, B. Mechanical behavior and crack propagation of ABS 3D printed specimens. Procedia Struct. Integr. 2020, 28, 1719–1726. [Google Scholar] [CrossRef]
  24. Basurto-Vázquez, O.; Sánchez-Rodríguez, E.P.; McShane, G.J.; Medina, D.I. Load distribution on pet-g 3d prints of honeycomb cellular structures under compression load. Polymers 2021, 13, 1983. [Google Scholar] [CrossRef]
  25. Wang, W.; Wang, T.Y.; Yang, Z.; Liu, L.; Tong, X.; Tong, W.; Deng, J.; Chen, F.; Liu, X. Cost-effective printing of 3D objects with skin-frame structures. ACM Trans. Graph. 2013, 32, 1–10. [Google Scholar] [CrossRef] [Green Version]
  26. Lu, L.; Chen, B.; Sharf, A.; Zhao, H.; Wei, Y.; Fan, Q.; Chen, X.; Savoye, Y.; Tu, C.; Cohen-Or, D. Build-to-last. ACM Trans. Graph. 2014, 33, 1–10. [Google Scholar] [CrossRef]
  27. Feng, J.; Fu, J.; Lin, Z.; Shang, C.; Li, B. A review of the design methods of complex topology structures for 3D printing. Vis. Comput. Ind. Biomed. Art 2018, 1, 1–16. [Google Scholar] [CrossRef]
  28. MedeiroseSá, A.; Mello, V.M.; Rodriguez Echavarria, K.; Covill, D. Adaptive voids: Primal and dual adaptive cellular structures for additive manufacturing. Vis. Comput. 2015, 31, 799–808. [Google Scholar] [CrossRef] [Green Version]
  29. Yasin, S.B.M.; Aziz, K.N.A.; Bakar, I.A.A.; Hayeemasae, N.; Asiah, S.N. Durability of helmet material under longitudinal and lateral drop impact. AIP Conf. Proc. 2018, 2031, 020035. [Google Scholar] [CrossRef]
  30. Gandhi, V.C.S.; Kumaravelan, R.; Venkatesan, M. Performance Analysis of Motor Cycle Helmet under Static and Dynamic Loading. Mech. Mech. Eng. 2014, 18, 85–96. [Google Scholar]
  31. Yeh, M.K.; Huang, T.H. Drop test and finite element analysis of test board. Procedia Eng. 2014, 79, 238–243. [Google Scholar] [CrossRef] [Green Version]
  32. Munoz, G.A. Lecture 7: Mesh Quality & Advanced Topics; ANSYS Inc.: Canonsburg, PA, USA, 2015; 14p. [Google Scholar]
  33. Gok, K.; Inal, S.; Gok, A.; Gulbandilar, E. Comparison of effects of different screw materials in the triangle fixation of femoral neck fractures. J. Mater. Sci. Mater. Med. 2017, 28, 81. [Google Scholar] [CrossRef]
  34. Farah, S.; Anderson, D.G.; Langer, R. Physical and mechanical properties of PLA, and their functions in widespread applications—A comprehensive review. Adv. Drug Deliv. Rev. 2016, 107, 367–392. [Google Scholar] [CrossRef] [Green Version]
  35. Galeja, M.; Hejna, A.; Kosmela, P.; Kulawik, A. Static and dynamic mechanical properties of 3D printed ABS as a function of raster angle. Materials 2020, 13, 297. [Google Scholar] [CrossRef] [Green Version]
  36. Matweb MatWeb, Your Source for Materials Information. MatWeb 2015, 1–2.
  37. Naveed, N. Investigating the material properties and microstructural changes of fused filament fabricated PLA and tough-PLA parts. Polymers 2021, 13, 1487. [Google Scholar] [CrossRef]
  38. Mazumder, M.; Ahmed, R.; Wajahat Ali, A.; Lee, S.J. SEM and ESEM techniques used for analysis of asphalt binder and mixture: A state of the art review. Constr. Build. Mater. 2018, 186, 313–329. [Google Scholar] [CrossRef]
Figure 1. Schematic diagram of fused deposition modeling.
Sustainability 14 08071 g001
Figure 2. 3D model of hair clipper comb: (a) Full model; (b) Cut model of solid design; (c) Cut model of shell design.
Sustainability 14 08071 g002
Figure 3. Meshing: (a) Mesh applied on full design; (b) Meshing zoom view.
Sustainability 14 08071 g003
Figure 4. Orientations for drop test analysis: (a) head drop; (b) Leg drop.
Sustainability 14 08071 g004
Figure 5. Solid body PLA simulation result: (a) Stress distribution while leg drop; (b) Stress distribution while head drop.
Sustainability 14 08071 g005
Figure 6. Shell body PLA simulation result: (a) Stress distribution while head drop; (b) Stress distribution while leg drop.
Sustainability 14 08071 g006
Figure 7. Solid body ABS simulation result: (a) Stress distribution while head drop; (b) Stress distribution while leg drop.
Sustainability 14 08071 g007
Figure 8. Shell body ABS simulation result: (a) Stress distribution while head drop; (b) Stress distribution while leg drop.
Sustainability 14 08071 g008
Figure 9. Photographs and corresponding SEM images acquired from: (a) Fractured surface of FDM PLA part; (b) As printed surface of FDM ABS part.
Sustainability 14 08071 g009
Figure 10. SEM image acquired from the fractured surface of impact tested PLA sample; red and green regions highlight highly rough and porous surface of a single PLA fiber observed under higher magnification.
Sustainability 14 08071 g010
Figure 11. SEM image acquired from the fractured surface of impact tested PLA sample; green region highlights visible signs of internal porosity in a single PLA fiber as observed under higher magnification.
Sustainability 14 08071 g011
Figure 12. SEM images acquired from the surface of as-printed ABS sample; interlayer porosity (red colour) is easily visible while high magnification region (yellow colour) represent relatively smooth surface free from porosity (unlike PLA sample).
Sustainability 14 08071 g012
Table 1. Meshing details.
ModelSolid BodyShell Body
Mesh qualityHighHigh
Element size0.62 mm0.62 mm
Total elements350,734192,986
Total nodes77,02463,122
Table 2. Material properties of the filament materials used for additive manufacturing.
MaterialPLAABS
ModelSolid BodyShell BodySolid BodyShell Body
Mass (g)11.71 g8.40 g9.74 g6.99 g
Mass density ( kg     m 3 )12501040
Tensile Strength (MPa)54.141.4
Ultimate Tensile Strength (MPa)59.244.3
Young’s Modulus (MPa) 34502390
Poisson’s ratio0.390.399
Table 3. Parameters used for FDM of hair clipper comb.
Fixed FDM Parameters
3D PrinterCreality Ender-3
Material UsedPLAABS
Bed Temperature60 °C100 °C
Nozzle Temperature210 °C240 °C
Layer Height0.2 mm0.2 mm
Infill Density100%100%
Print Speed50 mm/s50 mm/s
Slicing SoftwareCreality 3DCreality 3D
Nozzle Diameter0.4 mm0.4 mm
Table 4. Stress distribution on all design.
MaterialUTS (MPa)Maximum Stress Solid Model (MPa)Maximum Stress Shell Model (MPa)
Head DropLeg DropHead DropLeg Drop
PLA59.256.460.440.330.9
ABS44.342.834.330.626.9
Publisher’s Note: MDPI stays neutral with regard to jurisdictional claims in published maps and institutional affiliations.

