Abstract
This research is a reflection on new challenges in the economy called Industry 4.0, which has brought about revolutionary changes in many areas of life, including education. To fully use the potential of smart products, services and business opportunities that are expected to be widely used in all sectors in the near future, education systems need to be revised to produce the skilled labour force required by this dynamic process. The ability of companies and institutions with a strong IT and technology infrastructure to reflect advanced digital technologies in innovation and production processes requires specific skills, described as 21st-century skills. Education 4.0 should be a response to these challenges with changed learning and teaching paradigms. In this context, we have organised an extensive survey on the relationship between the economy and higher education in Bosnia and Herzegovina. We have created a web questionnaire that contains desirable characteristics of new employees and a set of questions, the analysis of which was used to determine an actual connection between the economy and higher education. After the factor analysis of the questionnaire, we obtained four desirable characteristics of new employees and the assessment of employers on their representation in each individual. We also concluded that the current impact of the economy on the processes of adopting new curricula is very low. We got the impression that higher education and economic development run in parallel, often without any points of contact.
1. Introduction
1.1. Background
One of the key reasons for managing the educational process is the demands of an increasingly selective labour market. The most important goal of each country’s education system is to enable each individual to develop, through the education system, a set of knowledge, skills and competencies for learning, personal development, fulfilment and continuous progress through life. From the socio-economic perspective, the most important task of the education system is the need to help the individual become adequately included in the labour market, easier employment and prevention of social exclusion. Meeting these objectives concerns not only those directly involved in the education system, but it is especially important for employers as users of educational outcomes. Higher education institutions have a pivotal role in contributing to sustainability transformations through their research, education, operations and outreach activities [1].
Viewed from the perspective of the employer as the most significant issue of education, we can define the mismatch of the education system with the needs of the labour market and the inadequacy of the system to respond to challenges that will undoubtedly arise in the future. At present, there is an obvious gap between employers’ expectations and the abilities students tend to acquire during higher education [2]. The mismatch between labour supply and demand is mainly reflected in the fact that there is a demand for labour of a particular profile in the labour market, but the education system does not produce enough such profiles, largely due to students’ lack of interest in education (e.g., technical professions). On the other hand, there is often a supply of particular occupations in the labour market, but there is not enough demand for the labour force of these profiles. In other words, young people are educated for professions that are oversupplied in the labour market and there are almost no people interested in those demanded in the labour market the most.
Of course, one should be careful in assessments when defining education needs and enrolment policies just because there are no unemployed people in particular professions. Given that the world of labour is changing daily, the needs for particular professions are subject to change, so the current data of a country on the unemployment rate in particular professions should be objectively considered and assessed. For example, law graduates and graduate economists are the most numerous in the unemployment register, but they also get hired the fastest. The future labour market prefers mobile labour, or flexibility in choosing a job and focusing on areas that need particular professions and occupations. However, we cannot disregard the need for a better connection between the labour market and the education system, which will become imperative in the time ahead. Therefore, it is justified to try to prepare societies for lifelong learning and the daily acquisition of new knowledge and skills in the chosen profession.
In this regard, a study was launched to determine desirable competencies of employees with higher education to improve and harmonise the curriculum at universities possibly.
1.2. Economy, Knowledge, Competencies
Developing countries, but also post-conflict countries such as Bosnia and Herzegovina, are trying to join economically developed countries while dealing with issues of reconstruction, development and improvement of the education system, which is an extremely complex and difficult process. We believed it was important that research exists that can, with better promotion, encourage responsible parties at universities to deal with questions regarding the impact of the environment on functioning and creating different policies. Here, firstly, we consider the openness of universities to various influences. Universities, but also the economy in countries that have a tendency to make a qualitative leap and join those of more developed countries need to achieve higher networking on a local level beforehand. Policies and strategies base economic growth on the knowledge economy, often without sufficient understanding and critical and theoretical thinking. In this paper, we have tried to use the term knowledge economies in the way presented in the further analysis so that the research results can be interpreted in a general context. Of course, the most developed countries in the world have gone a step further in integrating the Industry 4.0 and Education 4.0 paradigms. The COVID-19 pandemic seems to have accelerated some processes in Education 4.0.
A knowledge-based economy is defined as one in which knowledge (codified and tacit) is created, acquired, transmitted and more efficiently used by enterprises, organisations, individuals and communities for greater economic and social development [3].
The knowledge economy primarily serves private property. The knowledge society also includes public property. Our schools need to prepare young people for both roles [4].
Hargreaves also points out that the term ‘knowledge society’ is a misnomer and argues that a more appropriate term is a ‘learning society’ [4]. As far as schools are concerned, the curriculum in knowledge societies includes content and processes that involve schools and teachers in professional creativity and knowledge creation [5].
Given the international agreement that improved education and adequate funding for research and development in basic and applied sciences are key factors for a successful transition to the knowledge economy [6], it is clear that education must be a key part of solving economic difficulties that the country is now facing.
Mokyr [7] suggests that education should be integrated by both inoculation and emancipation to serve individual intellectual development as well as social advancement. Shapiro [8] emphasises the need for higher education institutions to serve a public purpose that transcends narrow individual interests and to make social changes to reflect the nature of society that its members want. More recently, in a philosophical sense, Barnett [9] has called for a broader conceptual landscape in higher education where “the task of an adequate philosophy of higher education is not only to understand the university or even defend it, but to change it”.
Higher education and research are the engines of development in the new global economy. Higher education is a form of investment in human capital development and has a real contribution to the economic growth of countries. Currently, higher education contributes to the transformation of countries into knowledge economies. It contributes to the creation of educated workers and those capable of dealing with the knowledge economy. Higher education contributes to the socialisation of individuals, helps in the modernisation and transformation of societies and, perhaps more importantly, through teaching and scientific research, creates, absorbs and spreads knowledge [10]. Vilkė et al. [11] have shown that investing in knowledge creation plays an important role in achieving long-term economic growth.
1.3. What Characteristics Does the Economy Require from Employees with a University Degree?
To succeed in the job market, individuals need a combination of knowledge and skills. The success of the economy as a whole requires that the skills of individual workers contribute to good overall skills. These skills can be classified in different ways, but the basic definition of this paper will be the one provided by the OECD Skills Strategy, i.e., skills are “a set of knowledge, attributes and capacities that enable individuals to successfully and consistently perform an activity or task, which can be upgraded and expanded through learning” [12]. The report focuses on three broad sets of skills that are important for good labour market performance, including:
- -
- Good technical, professional knowledge and skills specific to particular disciplines reflect a solid theoretical and practical understanding of the subject. At the level of higher education, this subject is typically codified by academic disciplines. Skills are not developed just to meet the needs of the labour market and some disciplines develop technical skills that do not have an obvious match in the labour market. However, many technical and professional qualifications send signals to employers that an individual may have the skills, interests and inclinations needed to engage in very specific types of work and provide a level of a specific set of technical and professional skills that are essential requirements for many jobs [13]. Employers often use these qualifications as the first predictor of assessing individuals for jobs [14]. At the level of the entire labour market, an adequate supply and combination of these skills is an important prerequisite for good economic growth.
- -
- Good generic cognitive and information processing skills include understanding, interpreting, analysing and communicating complex information, as well as the ability to apply this information in everyday life situations [15]. These are general skills that people use in all types of work and that support effective participation in the community.
- -
- Intellectual abilities and personality traits.
Moreover, two national studies conducted by the American Society for Training and Development ASTD [16] and one by the Secretary’s Commission on Achieving Necessary Skills [17] are introductory papers identifying commonly used employment skills or starting points for other international, national, national, regional and local studies.
Coopers and Lybrand [18] and Moreley [19] define ‘employability skills’ in terms of four key areas: (1) Traditional intellectual skills, e.g., critical evaluation, logical argument; (2) Key communication skills, IT, etc.; (3) Personal attributes of motivation, self-confidence; (4) Knowledge of organisations and how they work.
2. Materials and Methods
In the following part of the paper, the research methodology is presented. The research sample is described first, followed by the research instrument and procedure. After that, the results of the research with discussion are presented.
The subject of research in this paper is determining the relationships between higher education and the economy in the Republic of Srpska (Bosnia and Herzegovina). The aforementioned relationship was determined by measuring businessmen’s attitudes towards employed personnel with higher education after the introduction of the Bologna Process. We began with the hypothesis that businessmen in the Republic of Srpska value the characteristics of employees in the same way as in more developed countries.
2.1. Research Sample
The research sample consisted of 488 persons with university degrees employed in 175 economic operators. These people were employed after the reform of higher education in accordance with the Bologna and Lisbon documents. The selected sample has a stratum structure reflecting the representation of individual profiles of employees. During the sampling process, we paid attention to the representation of all regions according to the total number of companies and the specifics of the economy in these regions.
All the economic operators perform their activities in the territory of the Republic of Srpska (Bosnia and Herzegovina). Table 1 shows the sample structure according to individual activities and the number of companies and respondents who participated in the research.

Table 1.
Sample structure.
Table 2 shows the distribution in the structure of the research sample according to the obtained diploma of higher education.
Table 2.
Information on respondents.
2.2. Instrument
Although, in scientific literature and practice, there are high-quality questionnaires to examine the relationship of the economy to the higher education system, their direct application in its original form was not possible in the circumstances of higher education and the economy in Bosnia and Herzegovina, for the following reasons:
- -
- Lack of a single economic territory in Bosnia and Herzegovina.
- -
- Different competencies over the higher education system and different plans and programmes.
- -
- Diversity of the founders of higher education institutions, which leaves room for inconsistencies in objectives, method of financing and the impact on them.
- -
- Lack of educational needs studies in the Republic of Srpska (Bosnia and Herzegovina).
These reasons have given rise to the need to create a new instrument that would primarily determine factors that are the essence of the successful functioning of newly employed persons with higher education and then the real relationship of the economy to the higher education system.
Examination of relevant literature [20], based on an earlier [21], formed an instrument containing: company data, data on the respondent and forty questions on the Likert-type scale we assumed to represent the most important personal and work characteristics of the respondents and six questions of the “YES” or “NO” type, with which we sought to determine the relationship between the economy and higher education.
The development of the instrument and the metric characteristics of the questionnaire used are presented in detail in the Results section.
2.3. Procedure
Given the complexity of the research problem and our intention to optimise the research, we divided the research process into three stages: analysis of the problem and defining variables that will be an integral part of the instrument; development of the research instrument; drafting of web questionnaires and collecting data.
The development of the research instrument included two stages: initial research and correction of manifest variables that could be an integral part of the instrument and final design of the research instrument with the calculation of metric values. To develop a better research questionnaire, in the initial survey, in a sample of thirty companies, we offered a possible list of employee characteristics that are necessary for the successful business operations in their companies. Other authors also suggest this procedure [22,23,24]. In addition, we left a blank space so that features that are not an integral part of the answers already offered can be entered.
When compiling the list of characteristics, we were guided by the OECD recommendations OECD [25,26]. We sent a copy of the initial questionnaire to the Chamber of Commerce of Republic of Srpska with the intention of receiving comments or suggestions for improving the instrument. The remarks of this institution mainly referred to the request to simplify some formulations to make them more easily understood by economic operators. The remarks were accepted.
After receiving the answers, we compiled a final list of manifest variables that entered the research instrument. The questionnaire contains forty questions defined on the Likert scale: 5—Completely agree, 4—Mostly agree, 3—Partially agree, 2—Mostly disagree and 1—Disagree.
The questionnaire also contains five questions of the “yes” or “no” type with space for explanation. These questions are used for a qualitative analysis of the relationship between the economy and higher education.
In stage two, we began creating a web questionnaire to simplify the data collection process. This method is much faster, less expensive and simpler [27].
2.4. Software Tool Description
The software is developed in php, mysql and html. Css rules have been created to align the fields. The php script takes the data from the html form via the POST method and enters it into the database. The database is made with the fields “int” for numbers and varchar (512) for texts. We believe that 512 characters are enough for each description and entries longer than that will be shortened to the first 512 letters of the entry. This limit of 512 can be increased as needed. Software tool front page is shown in Figure 1 and Figure 2. Display of survey results entry is shown in Figure 3.
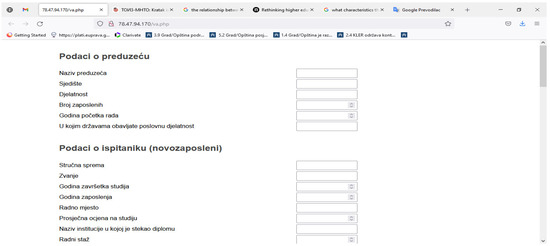
Figure 1.
Software tool front page, part one.
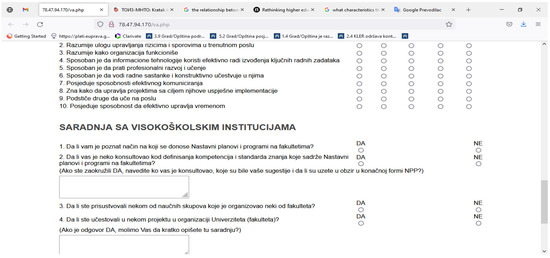
Figure 2.
Software tool front page, part two.
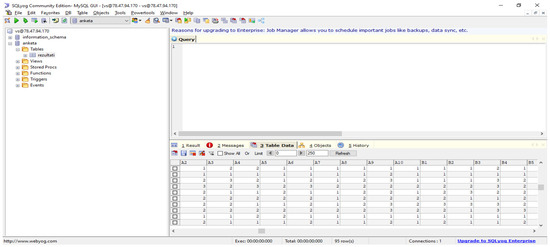
Figure 3.
Display of survey results entry.
2.5. Use
The required data are entered into the text fields, such as numbers (years, average evaluation) and marked in such a way that the browser should disable the entry of text in them. Employee assessment questions have buttons that are activated by clicking to select an answer (in the range from 5—Completely agree to 1—Disagree…)—the mechanism is such that no more than one answer to one question can be selected. After filling in the questionnaire, by clicking the button “Send” at the bottom of the page, the completed survey is sent and recorded in the database and the user has displayed a message about the successful entry of the survey or an error message if it occurs.
All data are stored in the database and used according to the needs and query system. The database, application logic, graphical interface and website access system can be changed very easily.
We have provided the possibility of easily changing the entire system according to changes in society and user requirements [24].
2.6. Data Collection
In cooperation with the Chamber of Commerce of the Republic of Srpska, we have collected the e-mail addresses of companies from the territory of the Republic of Srpska. After that, we sent them a link to a questionnaire website that they could access and fill out the instrument. We received inquiries several times for instructions on how to complete the instrument and some questions on the content of individual questions. We were able to answer all the questions in a short period of time and speed up the process of receiving data. We checked the database with the received data every day and prepared it for data processing. After the end of the planned time, we had 494 completed questionnaires. The analysis showed that all activities represented in the economic sector are covered and that the database can be used for representative conclusions after processing the results.
2.7. Data Analysis
Data analysis was performed using IBM SPSS Statistics Version 23. The Cronbach’s alpha coefficient was calculated to determine internal consistency. The Principal Component Analysis method was used to determine the validity, followed by Varimax rotation with Kaiser normalisation. The number of factors was determined based on the results of the Cattell scree test, using the Guttman–Kaiser criterion and calculating the intracorrelation value.
3. Results
The reliability of the questionnaire was confirmed by Cronbach’s alpha coefficient, which was 0.911 for the whole scale, representing a high internal consistency. Item analysis (analysis of items that make up the instrument of the measurement scale) is shown in Table 3.
Table 3.
Internal consistency of items in the instrument with a measurement scale.
Values of the alpha reliability coefficient for individual items on the measurement scale range between 0.881 and 0.925, which indicates high internal consistency.
Validity Analysis
To examine the adequacy of data, the Kaiser–Meyer–Olkin measure was applied to all variables together. The Kaiser–Meyer–Olkin measure ranges from 0 to 1, where values lower than 0.5 indicate the inadequacy of the correlation matrix for factor analysis, i.e., the value of 0.6 is recommended as the minimum acceptable for good factor analysis. Bartlett’s test is used to test the null hypothesis that there is no significant correlation between the original variables. The data are shown in the Table 4.
Table 4.
KMO and Bartlett’s Test.
Since the Kaiser–Meyer–Olkin measure is 0.897, it can be concluded that the data of variables used are suitable for conducting factor analysis.
The screen plot diagram (Figure 4), based on Cattell’s diagram, shows an interruption between factors four and five, which confirms the separation of four factors because their eigenvalues are separated from the eigenvalues of the remaining factors. Cattell recommends keeping all factors above the curve of that diagram, as they contribute the most to explaining the variance in the dataset. More specifically, the fracture of the diagram at the junction of factors four and five is noticeable, which implies the conclusion that the first four factors explain a much higher variance percentage than the remaining factors. Table 5 shows eigenvalues of the factors after Varimax rotation.
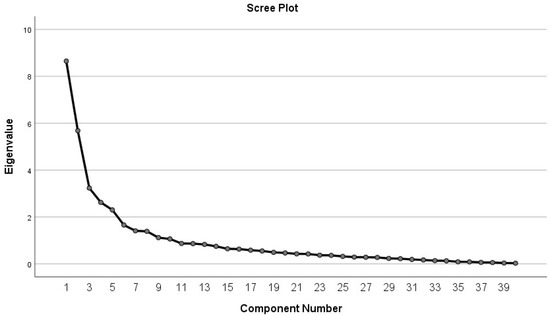
Figure 4.
Own value/eigenvalue for the number of components.
Table 5.
Total Variance Explained.
Factor analysis of the main components was applied in the research. The basis for its implementation was an unreduced correlation matrix. By applying the factor analysis of the main components, after the transformation of variables into orthogonal axes has been performed, the factors are extracted on the basis of their eigenvalues. Table 6 shows the matrix of factor structure for 40 variables after the analysis of main components and the rotation of factors.
Table 6.
Rotated Component Matrix.
Four extracted factors after rotation have critical values greater than 1 and these four factors explain 65.34% of the variance. Similar to the proposals [18,20,25,28], we isolated four factors: personal traits, ability to communicate and understand interpersonal relationships, intellectual abilities and technical and organisational capacities. It is noticeable that the percentage of total variance for the relevant factors is greater than 0.60, or 60%, which is the lower allowable limit in social research. The greater the variance, the greater the simplicity of factors.
Manifest variables were almost ideally grouped around some latent factors [29] that we were able to name: personal traits of respondents, ability to communicate and understand interpersonal relationships, intellectual abilities and technical and organisational capacities [18,19]. Three manifest variables within each factor of personal traits and factor of ability to communicate and understand interpersonal relationships, and one within each factor of intellectual abilities and technical and organisational capacities, had a lower value than the given criterion, which gives us the task to correct the questionnaire. This is evidently a complex structure of questions that the respondents found difficult to distinguish.
This way, we confirmed the validity of the instrument, as well as correspondence of the opinion of the economic sector in Herzegovina (Republic of Srpska) with opinions of economic sectors in the world in terms of desirable characteristics of new employees.
A descriptive analysis determined the satisfaction of employers by individual characteristics of new employees. The data are shown in Table 7.
Table 7.
Employer satisfaction by individual characteristics of new employees.
Employers are most satisfied with employees in the engineering profession and least satisfied with law and economics. It is obvious that students from technical faculties acquire competencies that are applicable in real-time.
For comparison, we present the findings from the Australian “‘Employer Satisfaction Survey” for 2021 [28]. This survey lists ten assessed areas: natural and physical sciences, technical sciences, information technology, architecture and civil engineering, agriculture and environmental protection, management and economics, healthcare education, arts, social sciences and culture. New employees were assessed in six characteristics: fundamental skills, ability to adapt, cooperation and communication, technical and information skills, employability and overall satisfaction.
Of all occupations, the best average grade was given to employees in technical sciences (90.4%) and the lowest to agriculture and environmental protection. The assessment is carried out every year.
In further analysis, we determined the relationship between the economy and higher education institutions. Out of the total number of respondents, 63% said they knew how curricula were adopted, but only 19% said they were consulted when adopting the document. The consulted companies mainly participated in joint projects with individual faculties and therefore had the opportunity to give their opinions on changes in curricula to acquire the desired competencies.
Here are some responses:
- “We have never been consulted about a possible change in the curricula, although we have clearly expressed a request through the Chamber of Commerce regarding certain competencies necessary for the production process”.
- “As part of joint projects with the faculties, we expressed our views on changing the objectives of education, but we did not receive responses about accepting our views”.
Representatives of 43% of the surveyed companies attended scientific conferences, many of whom provided funds for their organisation. The companies in the field of technical and economic sciences are at the forefront here.
Most faculties find ways to participate in a project. These are most often projects funded by competent ministries or financial institutions from abroad (Erasmus, etc.). In this type of project, the most common partners are companies from the region where the faculty is located. Here is one of the answers of the representatives of the economy regarding the participation in projects of the faculties:
- “We have twice participated in a joint project with the Faculty of Economics, and both projects were related to providing internship training for students.”
- “The faculty provided us with training for employees”.
- “The faculty provided us with training and protective equipment for experimental agricultural fields”.
Out of the total number of surveyed companies, 28% participated in joint projects with faculties.
Most of the companies that had student trainees positively evaluated their commitment, interests, desire to learn, but there is a lack of competencies in the field of knowledge application and a sufficient level of self-initiative.
Here is an example from one company: ”Student trainees carefully observe the process and do nothing, but when you give them a specific task, they gladly participate in solving it”. These indicators clearly show that there is no systematic approach to the communication between higher education and the economic sector. Students most often prepare for work in the economy; therefore, it would be of particular importance that their competencies meet the requirements for specific jobs but also qualifications for lifelong learning. Strategic documents adopted by individual levels of government prescribe the obligatory nature of this relationship, but there is no operationalisation.
4. Discussion
This research is part of a continuous process that began in 2008. We had the opportunity to see the transformation of two key sectors that affect the reconstruction and prosperity of a country in the circumstances of post-conflict time, as it was in Bosnia and Herzegovina, namely higher education and economic development. During this period, we were twice supported by the Ministry of Scientific and Technological Development, Higher Education and Information Society Republic of Srpska. In the research process, we had two goals: to develop a theoretical understanding of the connection between higher education and economic development and attempt to design tools for a successful assessment of newly hired graduates by employers to determine their satisfaction with the competencies students acquire at universities and a possible impact on curriculum change. We analysed several key documents, i.e., Development Strategies for education in the Republic of Srpska for the period during 2008–2021; Strategies for the development of individual industries in the Republic of Srpska and economic policies. We received indicators via analysis that pointed to basic weaknesses in the operationalisation of individual stated documents, on the basis of which we built a hypothesis about the insufficient influence of the economy on the education system, even though they were prescribed by documents. In our research, we were directed by positive experiences of developed countries (Australia, Ireland and Korea). These countries have a very well-developed system for monitoring the impact of education systems on the economy. Evaluation of the satisfaction of the economic sector with the quality of education was performed annually. The results are publicly disclosed. Since Bosnia and Herzegovina is a developing country, in the text, we also analysed data from several developing countries (Cyprus, Botswana, Kenya, Ghana and the Republic of South Africa). Analysing the university management system, we noticed that there are no tools to collect data from the economic sector on the quality of work of newly-employed students and because of that, we decided to make an online questionnaire for this purpose. We also hoped that the questionnaire would be accepted because it is an integral part of the project financed by the competent ministry.
In the first step, we designed a questionnaire with fifty-five questions, which we shortened to forty questions after the initial survey. The questionnaire also includes six open-ended questions that helped us to qualitatively assess the relationship between the economy and higher education.
After the factor analysis, we had four factors that represent the characteristics of new employees: personal traits, ability to communicate and understand interpersonal relationships, intellectual abilities and technical and organisational capacities. The analysis showed that employers evaluated the qualities of newly employed engineering professions the best and the newly employed economic and legal professions the poorest.
We also obtained results that show a weak impact of the economy on the education system in higher education institutions, from the impact on curriculum creation to cooperation in the field of knowledge exchange and participation in joint projects.
5. Conclusions
These research results speak in favour of the need for greater involvement of economic operators in the process of creating education programmes, as well as the inclusion of guest lectures by experts from practice. This way, the actual education profiles necessary for economic development can be defined. The research results will be presented to the education and economic public to initiate the necessary dialogue between these two key factors of social and economic development. Future research will be based on improving the software solution and the necessary correction of the web questionnaire in accordance with changes in the structure of education based on the postulates of Education 4.0.
The above requires that the existing information system at the university would be upgraded so that representatives of the economy can fill in some of the questionnaires on offer to affect the system of decision-making (profiling new staff, curriculum changes, manner of cooperation, etc.) with their proposals.
As for the next step, we intend to make the results of the research available to the public and ensure that the survey is preferably taken every year with the possibility of improving the instruments and software solutions.
Author Contributions
Conceptualisation, V.S. and S.M.; data curation, V.S. and A.P.; formal analysis, V.S.; methodology, V.S. and S.M.; project administration, V.S. and S.M.; validation, V.S. and S.M.; visualization, V.S. and A.P.; writing—original draft, V.S. and S.M. All authors have read and agreed to the published version of the manuscript.
Funding
This research was funded by the Ministry of Scientific and Technological Development, Higher Education and Information Society, Project “Redesigning the software solution of the web questionnaire and examination of economic attitudes according to students ‘competences’” (19.032/961-32/19).
Institutional Review Board Statement
Not applicable.
Informed Consent Statement
Not applicable.
Data Availability Statement
Not applicable.
Conflicts of Interest
The authors declare no conflict of interest.
References
- Sidiropoulos, E. The Influence of Higher Education on Student Learning and Agency for Sustainability Transition. Sustainability 2022, 14, 3098. [Google Scholar] [CrossRef]
- Chen, Y.; Gan, N. Sustainable Development of Employability of University Students Based on Participation in the Internship Promotion Programme of Zhejiang Province. Sustainability 2021, 13, 13454. [Google Scholar] [CrossRef]
- Dahlman, C.J.; Andersson, T. Korea and the Knowledge-based Economy: Making the Transition; The World Bank: Washington, DC, USA, 2000. [Google Scholar]
- Hargreaves, A. Teaching in the Knowledge Society: Education in the Age of Insecurity; Teachers College Press: New York, NY, USA, 2003. [Google Scholar]
- Looneya, A.; Klenowski, V. Curriculum and assessment for the knowledge society: Interrogating experiences in the Republic of Ireland and Queensland, Australia. Curric. J. 2008, 19, 177–192. [Google Scholar] [CrossRef]
- Musyck, B.; Hadjimanolis, A. Towards a knowledge-based economy: Does the Cyprus R&D capability meet the challenge? Sci. Public Policy 2005, 32, 65–77. [Google Scholar]
- Mokyr, J. The Gifts of Athena: Historical Origins of the Knowledge Economy; Princeton University Press: Princeton, NJ, USA, 2002. [Google Scholar]
- Shapiro, S.P. Agency theory. Annu. Rev. Sociol. 2005, 31, 263–284. [Google Scholar] [CrossRef]
- Barnett, M. Social constructivism. In The Globalization of World Politics: An Introduction to International Relations; Baylis, J., Smith, S., Owens, P., Eds.; Oxford University Press: Oxford, UK, 2017; pp. 145–158. [Google Scholar]
- Pillay, P. Higher Education and Economic Development: A Literature Review; Centre for Higher Education Transformation: Cape Town, South Africa, 2010. [Google Scholar]
- Vilkė, R.; Vidickienė, D.; Gedminaitė-Raudonė, Ž.; Simonaitytė, V.; Ribašauskienė, E. Rural Economic Developments and Social Movements: A New Paradigm; Palgrave Macmillan: Cham, Switzerland, 2021. [Google Scholar]
- OECD. Better Skills, Better Jobs, Better Lives: A Strategic Approach to Skills Policies; OECD Publishing: Paris, France, 2012. [Google Scholar] [CrossRef]
- OECD. Skills beyond School: Synthesis Report; OECD Reviews of Vocational Education and Training; OECD Publishing: Paris, France, 2014. [Google Scholar] [CrossRef]
- Montti, G. The causes and consequences of field-of-study mismatch. In OECD Social, Employment and Migration Working Papers; OECD Publishing: Paris, France, 2015; p. 167. [Google Scholar]
- OECD. Skills for Social Progress: The Power of Social and Emotional Skills; OECD Skills Studies; OECD Publishing: Paris, France, 2015. [Google Scholar] [CrossRef]
- Carnevale, A.P.; Gainer, L.J.; Meltzer, A.S. Workplace Basics: The Essential Skills Employers Want; Jossey-Bass Inc.: San Francisco, CA, USA, 1990. [Google Scholar]
- U.S. Department of Labor. What Work Requires of Schools: A SCANS Report for America Scans; U.S. Department of Labor: Washington, DC, USA, 1991.
- Coopers, M.; Lybrand, D. Skills Development in Higher Education; Report for CVCP/DfEE/HEQE, November; Committee of Vice-Chancellors and Principals of the Universities of the UK (CVCP): London, UK, 1998.
- Morley, L. Producing New Workers: Quality, Equality and Employability in Higher Education. Qual. High. Educ. 2001, 7, 131–138. [Google Scholar] [CrossRef]
- Fitzpatrick Associates. Irish National Employer Survey. 2019. Available online: https://hea.ie/assets/uploads/2019/01/21-01-19-J8961-Irish-National-Employer-Survey-Final-Report.pdf (accessed on 20 March 2022).
- Simeunović, V.; Milic, S. Software Solution of Web Questionnaires for the Analysis of the Economy in Relation to the Competence of Students. Asian J. Educ. Train. 2018, 4, 1–8. [Google Scholar] [CrossRef][Green Version]
- Gaddis, S.E. How to Design Online Surveys. Train. Dev. 1998, 52, 67–72. [Google Scholar]
- Burgess, T.F. A General Introduction to the Design of Questionnaires for Survey Research. University of Leeds, Information System Services. 2001. Available online: http://www.websm.org/uploadi/editor/File/Burgess_2001_A%20general_introduction.pdf (accessed on 20 March 2022).
- Dillman, D.A.; Tortora, R.D.; Conradt, J.; Bowker, D. Influence of Plain vs. Fancy Design on Response Rates for Web Surveys. Presented at the Joint Statistical Meetings, Dallas, TX, USA, 9–13 August 1998. [Google Scholar]
- OECD. OECD Skills Outlook 2017: Skills and Global Value Chains; OECD Publishing: Paris, France, 2017. [Google Scholar] [CrossRef]
- OECD. OECD Skills Strategy 2019: Skills to Shape a Better Future; OECD Publishing: Paris, France, 2019. [Google Scholar] [CrossRef]
- Couper, M.P. Web Surveys: A Review of Issues and Approaches Get access Arrow. Public Opin. Q. 2000, 64, 464–494. [Google Scholar] [CrossRef] [PubMed]
- The Quality Indicators for Learning and Teaching (QILT) Survey Program; Australian Government Department of Education, Skills and Employment: Melbourne, Australia, 2021.
- Brown, T.A. Confirmatory Factor Analysis for Applied Research; The Guilford Press: New York, NY, USA, 2006. [Google Scholar]


Publisher’s Note: MDPI stays neutral with regard to jurisdictional claims in published maps and institutional affiliations. |
© 2022 by the authors. Licensee MDPI, Basel, Switzerland. This article is an open access article distributed under the terms and conditions of the Creative Commons Attribution (CC BY) license (https://creativecommons.org/licenses/by/4.0/).