Analysis of Micro Value Flows in the Value Chain of Eco-Innovation in Agricultural Products
Abstract
:1. Introduction
2. Related Work
2.1. The Meaning and Application of GERT
2.2. Research on Green Innovation and Innovation Ecosystems
3. Related Conceptual and Methodological Foundations
3.1. Green Innovation
3.2. Green Innovation Value Chain for Agricultural Products
3.3. GERT Diagrammatic Review Method
4. Method of Value Flow GERT Network Model Construction
4.1. Value Flows GERT Network Model Key Influencing Factors
4.2. Value Transfer Function Construction for the GERT Network Model of Value Flows
4.3. Determination of Equivalent Transfer Probabilities of Value Flows and the Establishment of Equivalent Moment Mother Functions
4.3.1. Equivalent Transmission Probability of Value Flows
4.3.2. Value Flow Equivalence Moment Function
4.3.3. Solution to Main Factors
- Parameter Solution Procedure
- Based on the practical problems and basic characteristics related to the agricultural green innovation value chain, the GERT network model of the value flow of the agricultural green innovation value chain is constructed by structurally describing it, analysing the relationship between each innovation subject in it and the composition of each parameter of the value flow.
- Use the W function to combine the basic value parameters of each value flow activity in the value flow GERT network of the agricultural green innovation value chain obtained, and construct the value flow transfer relationship function of the value flow GERT network model of the agricultural green innovation value chain.
- Determine the value flow equivalence transfer function and equivalence transfer probability of the value flow GERT network model of the agricultural green innovation value chain, which can use the topological equation formula of the signal flow diagram (Mason diagram).
- According to the definition of the W function, the equivalence moment matrix of the GERT network model of the value flow of the agricultural green innovation value chain is determined.
- Using the equivalent moment matrix, derive the basic value parameters of each value flow activity in the GERT network model of the value flow of the agricultural green innovation value chain, and calculate the analytical solutions of the basic value parameters of each value flow activity.
- 2.
- Value added value flows and their variance solving
- 3.
- Value flow value added factor
5. Experient of Green Innovation Input Optimization Program for Agricultural Product Value Chain
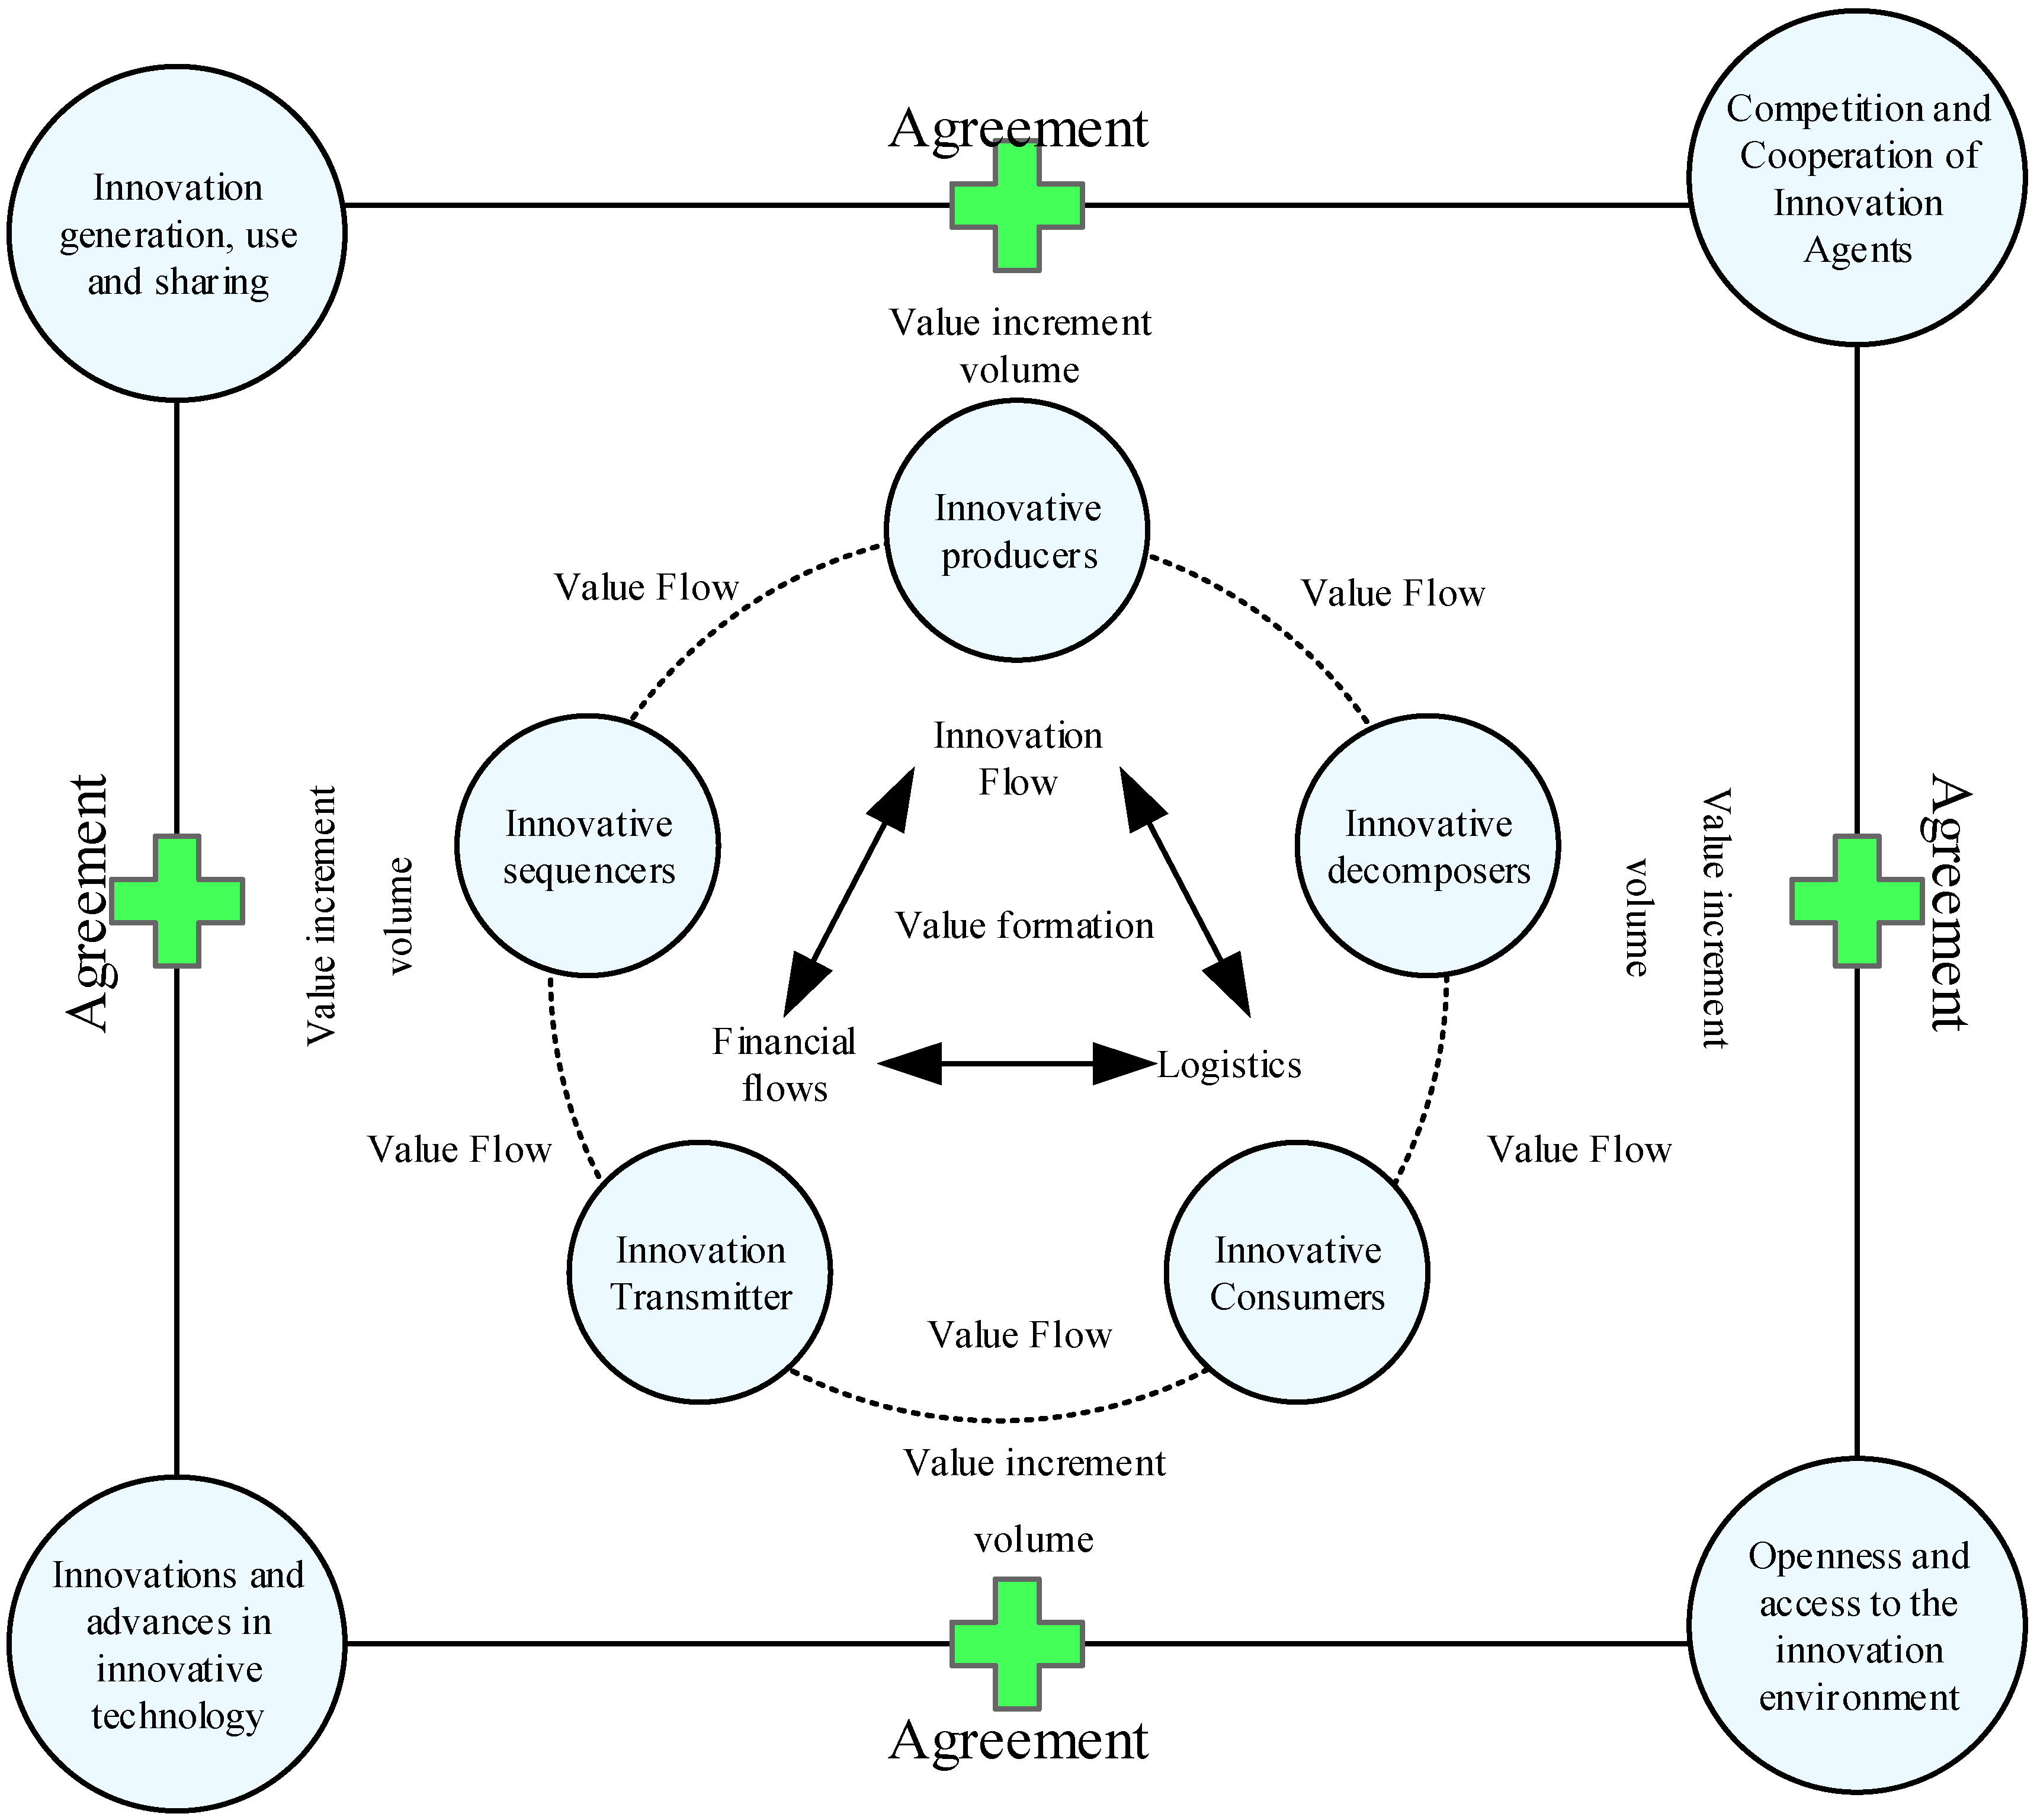
5.1. GERT Network Synergistic Organization Mechanism for Green Innovation Value Chain Value Flows
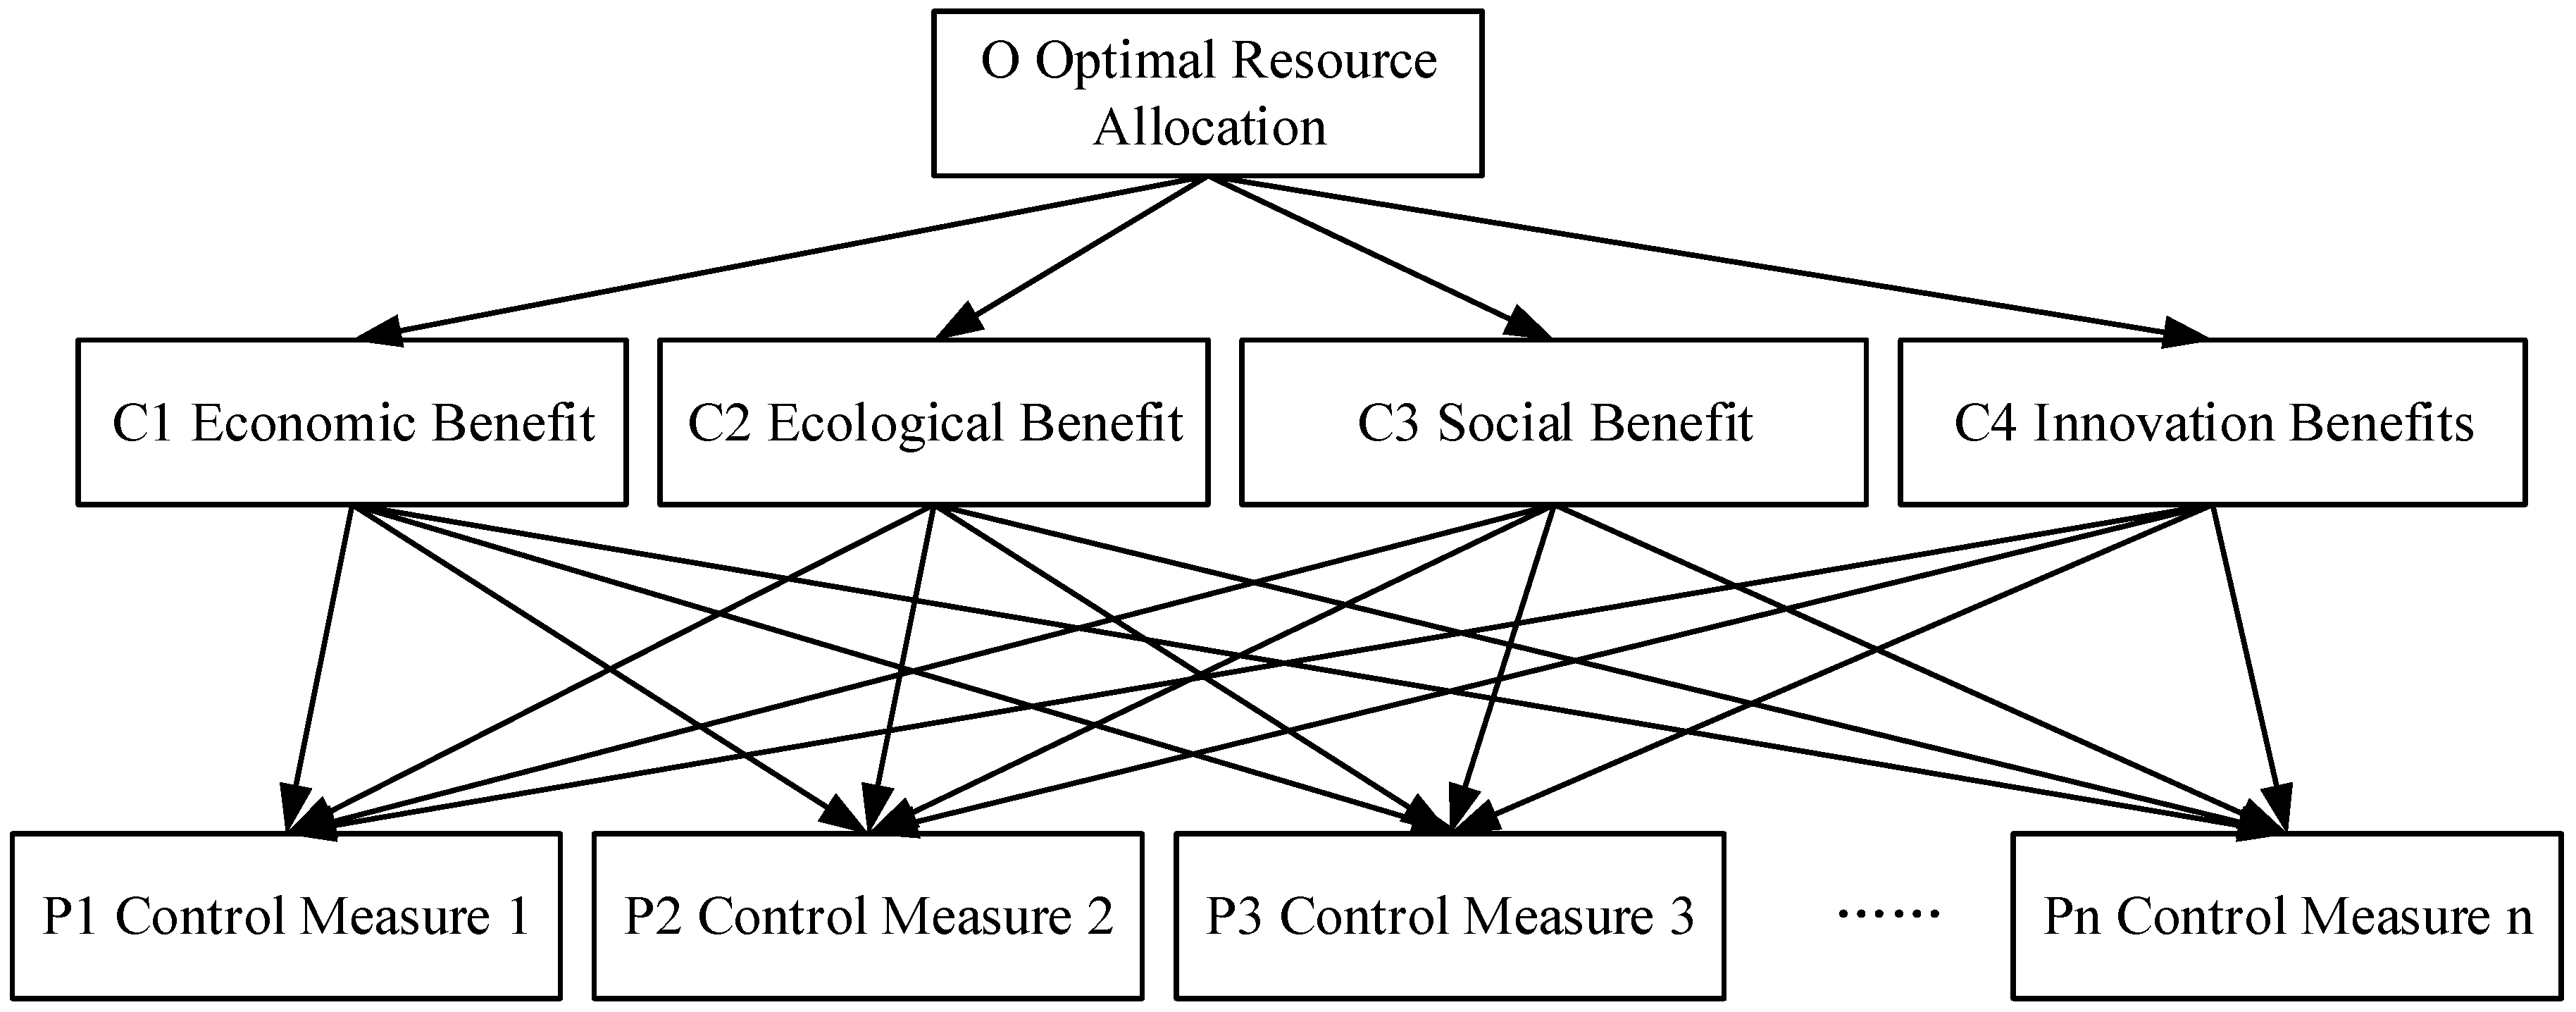
5.2. Multi-Objective Planning Model Construction for Value Management of Green Innovation Value Chain of Agricultural Products
5.3. Agricultural Value Chain Green Innovation Input Optimization Implementation Plan
5.3.1. Configuration Goals
- Maximize the four goals of economic value, ecological value, innovation value and social value
- Maximize the integrated value of green innovation for agricultural products.
5.3.2. Configuration Method
6. Analysis of Green Innovation Input Optimization Scheme for Agricultural Product Value Chain
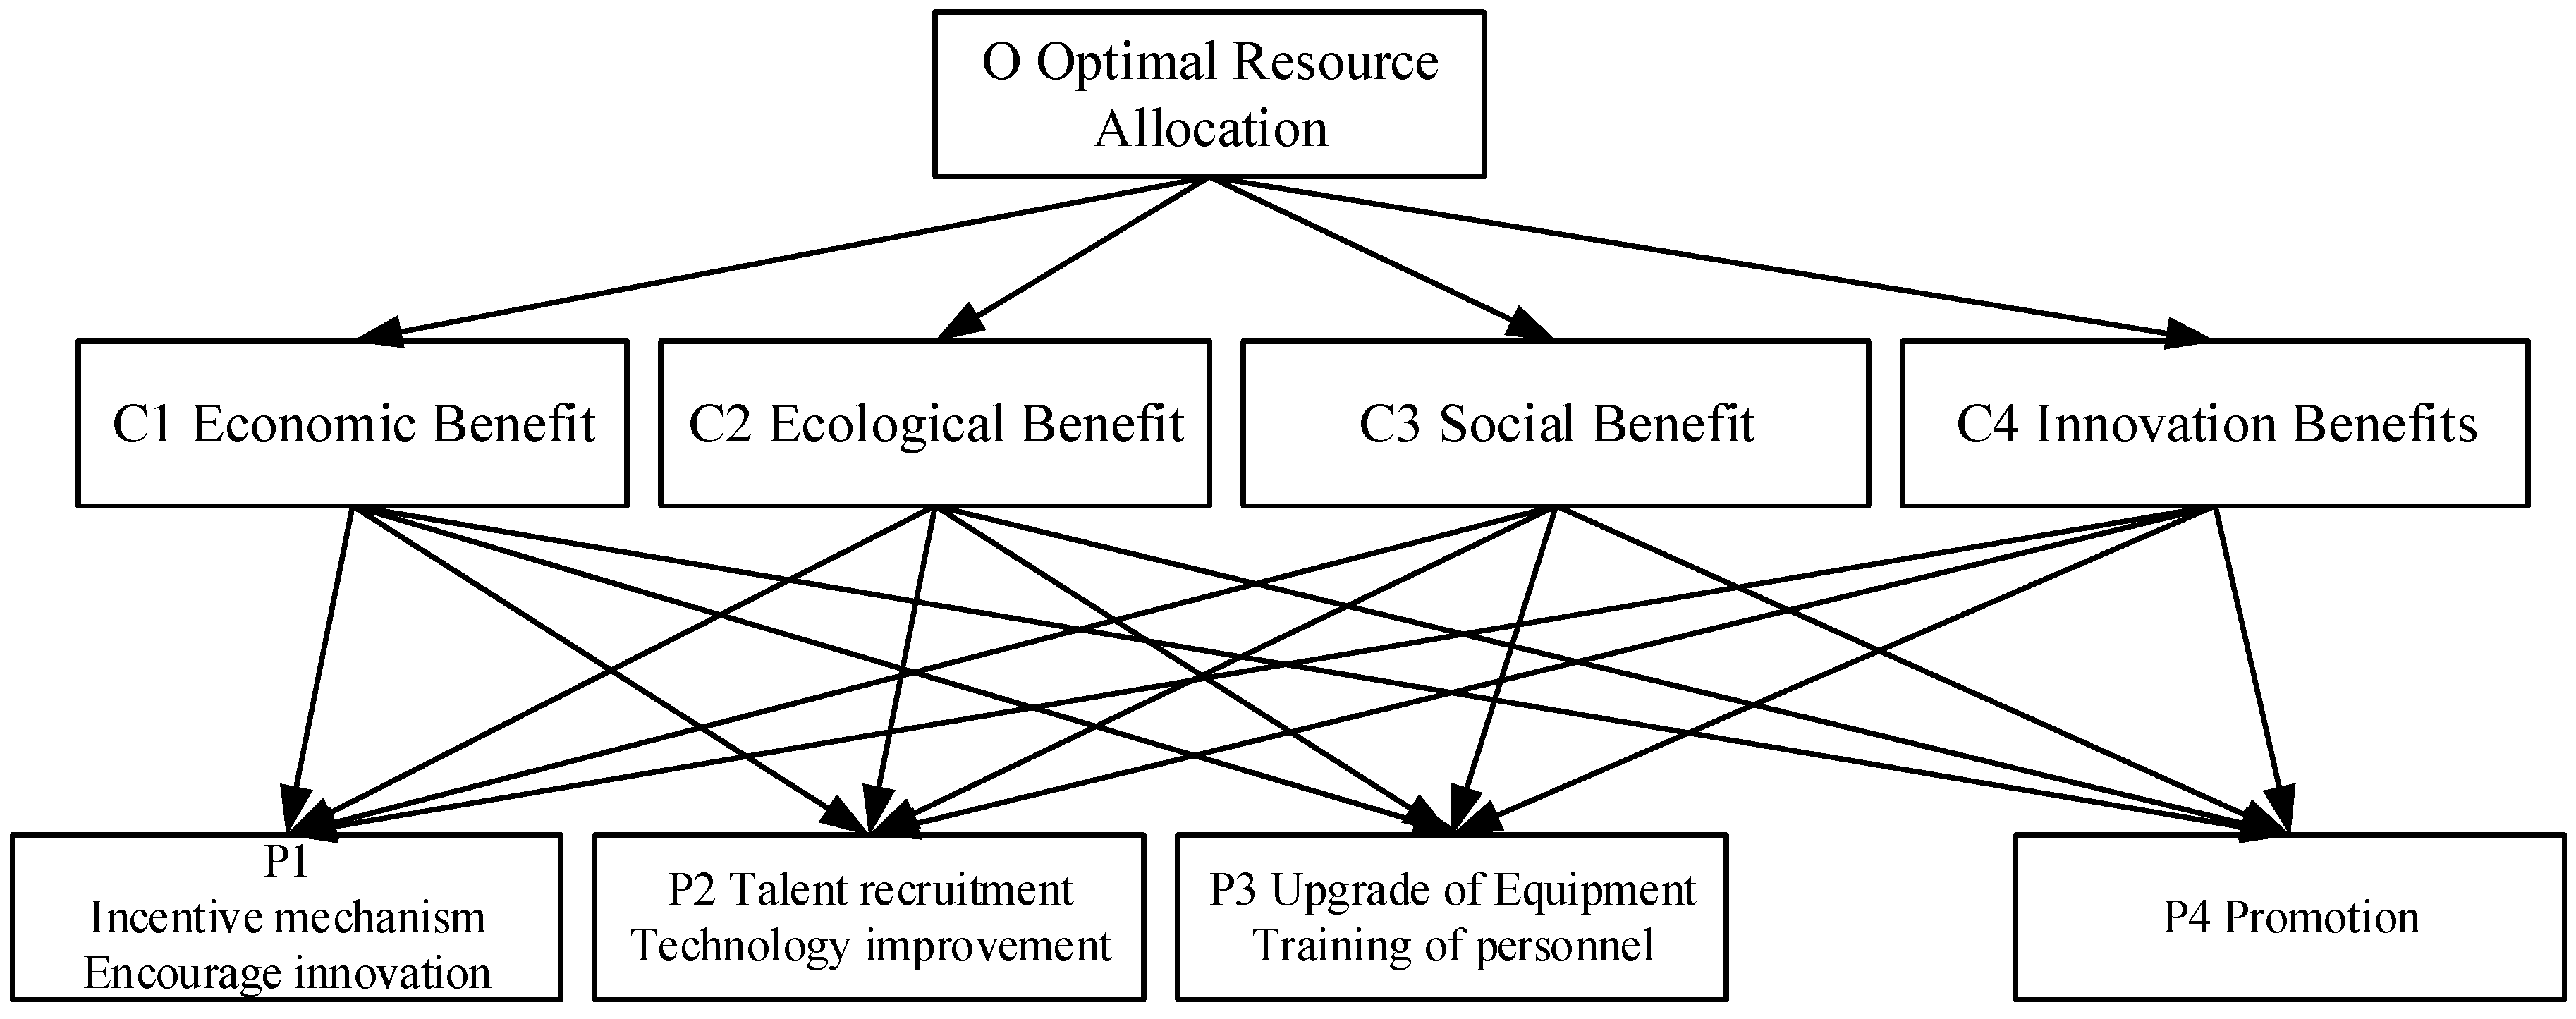
6.1. Evaluation Model Establishment
6.2. Effectiveness of the Implementation of Green Innovation Input Optimization Program for Agricultural Products
7. Conclusions
Author Contributions
Funding
Informed Consent Statement
Data Availability Statement
Conflicts of Interest
References
- Yi-song, Z.; Dong, L.; Feng, Z. Study on a GERT based method for hi-tech product development project planning. In Proceedings of the 2009 16th International Conference on Industrial Engineering and Engineering Management, Beijing, China, 21–23 October 2009; pp. 1022–1026. [Google Scholar]
- Xu, Z.; Jia, Z.J. Assessment of technical risk for weapon system development project based on GERT simulation including multi-branch feedback. Comput. Integr. Manuf. Syst. 2010, 16, 636–642. [Google Scholar]
- Li, C.; Tang, Y.; Li, C. A GERT-based analytical method for remanufacturing process routing. In Proceedings of the 2011 IEEE International Conference on Automation Science and Engineering, Trieste, Italy, 24–27 August 2011; pp. 462–467. [Google Scholar]
- Wang, C.N.; Yang, G.K.; Hung, K.C.; Chang, K.H.; Chu, P. Evaluating the manufacturing capability of a lithographic area by using a novel vague GERT. Expert Syst. Appl. 2011, 38, 923–932. [Google Scholar] [CrossRef]
- Li, C. An analytical method for cost analysis in multi-stage supply chains: A stochastic network model approach. Appl. Math. Model. 2014, 38, 2819–2836. [Google Scholar] [CrossRef]
- Tao, L.; Wu, D.; Liu, S.; Lambert, J.H. Schedule risk analysis for new-product development: The GERT method extended by a characteristic function. Reliab. Eng. Syst. Saf. 2017, 167, 464–473. [Google Scholar] [CrossRef]
- Porter, M.E.; Van der Linde, C. Green and Competitive. Harv. Bus. Rev. 1995, 73, 120–134. [Google Scholar]
- Arundel, A.; Kemp, R.; Parto, S. Indicators for environmental innovation: What and how to measure. In International Handbook on Environmental Technology Management; Edward Elgar Publishing: Northampton, MA, USA, 2007; pp. 324–339. [Google Scholar]
- Oduro, S.; Maccario, G.; Nisco, A.D. Green innovation: A multidomain systematic review. Eur. J. Innov. Manag. 2021; ahead-of-print. [Google Scholar]
- Dong, B.; Jin, L. A preliminary study on the progress of green innovation in China. Sci. Technol. Manag. Res. 2005, 25, 62–64. [Google Scholar]
- Li, X. A review of green innovation-related research and prospects. Res. Dev. Manag. 2015, 27, 1–11. [Google Scholar]
- Moore, F. Predators and Prey: A New Ecology of Competition. Harv. Bus. Rev. 1993, 71, 75–86. [Google Scholar] [PubMed]
- Mercan, B.; Goktas, D. Components of Innovation Ecosystems: A Cross Country Study. Int. Res. J. Financ. Econ. 2011, 76, 102–112. [Google Scholar]
- Klotz, F. Navigating the Leadership Challenges of Innovation Ecosystems. MIT Sloan Manag. Rev. 2016, 58–59. Available online: https://sloanreview.mit.edu/article/navigating-the-leadership-challenges-of-innovation-ecosystems/ (accessed on 13 June 2022).
- Adner, R.; Kapoor, R. Innovation ecosystems and the pace of substitution: Re-exmining technology Scurves. Strateg. Manag. J. 2016, 37, 625–648. [Google Scholar] [CrossRef] [Green Version]
- Gomes, L.A.; Facin, A.F.F.; Salerno, M.S. Managing uncertainty propagation in innovation ecosystems. Technol. Forecast. Soc. Chang. 2021, 171, 120945. [Google Scholar] [CrossRef]
- Breslin, D.; Kask, J.; Schlaile, M.; Abatecola, G. Developing a coevolutionary account of innovation ecosystems. Ind. Mark. Manag. 2021, 98, 59–68. [Google Scholar] [CrossRef]
- Bernauer, T.; Engel, S.; Kammerer, D.; Nogareda, J.S. Explaining Green Innovation: Ten Years after Porter’s Win-Win Proposition: How to Study the Effects of Regulation on Corporate Environmental Innovation? Politische Vierteljahresschr. 2007, 39, 323–341. [Google Scholar]
- Charter, C. Sustainable Innovation: Key Conclusions from Sustainable Innovation. Conferences 2006 Organized by The Centre for Sustainable Development; University College for the Creative Arts: Farnham, UK, 2007. [Google Scholar]
- Bo, S.; Kexin, B. Open innovation mode of green innovation system for manufacturing industry. Mob. Inf. Syst. 2021, 2021, 9948683. [Google Scholar] [CrossRef]
- Elmaghraby, S.E. An algebra for the analysis of generalized activity networks. Manag. Sci. 1964, 10, 494–514. [Google Scholar] [CrossRef]
- Pritsker, A.A.B. GERT: Graphical Evaluation and Review Technique; Rand Corporation: Santa Monica, CA, USA, 1966. [Google Scholar]


| Events | Probability | Related Parameters | ||
|---|---|---|---|---|
| (1, 1) | 0.1 | 0.28 | 0.48 | 0.28 |
| (1, 2) | 0.9 | 0.31 | 0.40 | 0.25 |
| (2, 3) | 1 | 0.16 | 0.55 | 0.31 |
| (3, 3) | 0.2 | 0.18 | 0.53 | 0.33 |
| (3, 4) | 0.8 | 0.57 | 0.38 | 0.35 |
| (4, 1) | 0.1 | 0.44 | 0.46 | 0.34 |
| (4, 5) | 0.45 | 0.35 | 0.42 | 0.32 |
| (4, 6) | 0.45 | 0.39 | 0.39 | 0.34 |
| (5, 7) | 1 | 0.32 | 0.44 | 0.38 |
| (6, 7) | 1 | 0.37 | 0.40 | 0.33 |
| (7, 7) | 0.3 | 0.35 | 0.38 | 0.36 |
| (7, 8) | 0.7 | 0.72 | 0.57 | 0.67 |
| (8, 8) | 0.2 | 0.48 | 0.41 | 0.49 |
| (8, 9) | 0.8 | 0.52 | 0.44 | 0.52 |
| (9, 9) | 0.3 | 0.38 | 0.46 | 0.35 |
| (9, 10) | 0.7 | 0.31 | 0.39 | 0.45 |
| Events | Probability | Events | Probability |
|---|---|---|---|
| (1, 1) | 0.1 | (5, 7) | 1 |
| (1, 2) | 0.9 | (6, 7) | 1 |
| (2, 3) | 1 | (7, 7) | 0.23 |
| (3, 3) | 0.2 | (7, 8) | 0.77 |
| (3, 4) | 0.8 | (8, 8) | 0.12 |
| (4, 1) | 0.495 | (8, 9) | 0.88 |
| (4, 5) | 0.495 | (9, 9) | 0.23 |
| (4, 6) | 0.01 | (9, 10) | 0.77 |
| Events | Probability | Events | Probability |
|---|---|---|---|
| (1, 1) | 0.1 | (5, 7) | 1 |
| (1, 2) | 0.9 | (6, 7) | 1 |
| (2, 3) | 1 | (7, 7) | 0.265 |
| (3, 3) | 0.2 | (7, 8) | 0.735 |
| (3, 4) | 0.8 | (8, 8) | 0.16 |
| (4, 1) | 0.473 | (8, 9) | 0.84 |
| (4, 5) | 0.473 | (9, 9) | 0.16 |
| (4, 6) | 0.054 | (9, 10) | 0.84 |
| Events | Probability | Events | Probability |
|---|---|---|---|
| (1, 1) | 0.1 | (5, 7) | 1 |
| (1, 2) | 0.9 | (6, 7) | 1 |
| (2, 3) | 1 | (7, 7) | 0.23 |
| (3, 3) | 0.2 | (7, 8) | 0.77 |
| (3, 4) | 0.8 | (8, 8) | 0.104 |
| (4, 1) | 0.492 | (8, 9) | 0.896 |
| (4, 5) | 0.492 | (9, 9) | 0.233 |
| (4, 6) | 0.016 | (9, 10) | 0.767 |
| Comprehensive income |
Publisher’s Note: MDPI stays neutral with regard to jurisdictional claims in published maps and institutional affiliations. |
© 2022 by the authors. Licensee MDPI, Basel, Switzerland. This article is an open access article distributed under the terms and conditions of the Creative Commons Attribution (CC BY) license (https://creativecommons.org/licenses/by/4.0/).
Share and Cite
Wang, Y.; Wang, Y.; Fan, P. Analysis of Micro Value Flows in the Value Chain of Eco-Innovation in Agricultural Products. Sustainability 2022, 14, 7971. https://doi.org/10.3390/su14137971
Wang Y, Wang Y, Fan P. Analysis of Micro Value Flows in the Value Chain of Eco-Innovation in Agricultural Products. Sustainability. 2022; 14(13):7971. https://doi.org/10.3390/su14137971
Chicago/Turabian StyleWang, Yang, Yifeng Wang, and Peng Fan. 2022. "Analysis of Micro Value Flows in the Value Chain of Eco-Innovation in Agricultural Products" Sustainability 14, no. 13: 7971. https://doi.org/10.3390/su14137971
APA StyleWang, Y., Wang, Y., & Fan, P. (2022). Analysis of Micro Value Flows in the Value Chain of Eco-Innovation in Agricultural Products. Sustainability, 14(13), 7971. https://doi.org/10.3390/su14137971


