Abstract
Climate-induced pressures spur on the need for urban green infrastructure (UGI) planning. This approach offers a possible way to improve ecosystem functionality and human well-being in adversely affected urban regions, wherein UGI is perceived as a green and nature-based climate change mitigation/adaptation strategy. In Pakistan, the Khyber Pakhtunkhwa (KP) province lacks such urban landscape and greening policies (ULGP) or legislative frameworks for transitioning to green action plans (GAP), to alleviate the risk of multi-climatic hazards. Thus, this study aims to investigate a sustainable UGI-indicator-based framework model, based on the due inclusion of the concerned stakeholders. The relative importance index (RII) and inter-quartile range (IQR) techniques are employed for field data analysis. The findings proclaim excellent reliability (α > 0.7) and internal consistency, wherein sustainable UGI indicators are grouped based on their importance. The results portray the ecological and economic sustainability dimensions as being important (RII = 0.835 and RII = 0.807, respectively), socio-cultural dimensions as being moderately important (RII = 0.795), and a set of UGS elements (RII ≥ 0.77) as vital for bolstering individual UGI indicators. The main UGS elements emerging in each category can be grouped as follows: ecological category—“reducing rainwater runoff” (RII = 0.94); socio-cultural category—“enhancement of mental and physical health” (RII = 0.90); and eco category—“minimizing the risk of flood disasters” (RII = 0.96). The simulation results demonstrate the need for an inclusive perspective when building the urban green space (UGS) infrastructure (and standards) that will be most suitable for ensuring climate-resilient urban regions. This study contributes to putting the scientific research knowledge of the natural green-landscape-based (NBLB) approach into practice. The study calls for the establishment of an effective, pragmatic relationship between the urban landscape and greening policies, alongside a constructive relationship with the native inhabitants to ensure eco-friendly and resilient settlements.
1. Introduction and Background
The urban green space (UGS) infrastructure is currently garnering more attention in recognition of its significance for cities, whether developed, developing, or upcoming. Sustained urbanization remains necessary for sustainable development, wherein green urban planning is perceived as an effective strategy against anticipated climate change/environmental challenges [1,2,3,4,5,6]. Experts anticipate that the variability of anthropogenic forces will further influence climate change [7,8], as they have already transformed the urban outlook by greying the natural landscape. Accordingly, the pressure on green spaces is increasing due to unprecedented urban growth. There are already many climatic challenges evolving (e.g., flooding, drought, the urban heat island effect, etc.) [9,10]. Furthermore, the current situation is leading to ecological imbalances, disruptions to greenspace structures and ecosystem functions (ESF), and the loss of biodiversity and degraded health/well-being at all spatial levels. Consequently, urban green infrastructure (UGI) planning is emerging as a new pathway to ameliorating the disturbed socio-ecological systems through innovative green nature-based solutions [11,12,13]. UGI is defined as “a network composed of open spaces, waterways, gardens, forests, green corridors, trees on streets, and open spaces, bringing many social, economic and ecological benefits” [14]. An alternative version of UGI exists as “an interconnected network of natural areas and other open spaces that conserves natural ecosystem values and functions, sustains clean air and water, and provides a wide array of benefits to people and wildlife” [15]. UGI, a novel planning terminology, is a re-articulation of the present UGS planning idea [16,17], widely recognized as a green approach in sustainable climate-risk management (SCRM) that enhances (urban) ecosystem health [18]. Moreover, UGI and SCRM together have the potential to fight climate uncertainties more cost-effectively than the traditional grey infrastructure [19,20]. However, UGI’s strength as a climate change mitigator is seldom perceived in developing countries, where it is instead associated with beautification—a non-essential urban amenity. Its actual potential to influence urban climate resilience against ever-rising environmental hazards is still less frequently considered [20,21,22,23].
Therefore, to address the underlying causes and destructive effects of climate change (CC), there is an immediate need to understand and link UGI and climate resilience concepts to land-use planning [24,25,26,27]. This will help to develop a sustainable UGI-indicator-based model, based on stakeholders’ (i.e., policymakers, practitioners, academicians) and the local community’s input under participatory planning (PP). Here, PP remains effective in promoting community stewardship to stimulate nature-based green (NBG) initiatives in land-use planning [28,29,30,31,32,33], to build a resilient city-state. At this juncture, a successful green transition is pivotal for executing a participatory planning approach [29,34], as such initiatives are necessary to stimulate UGS infrastructure, to better address ecological, socio-cultural, and economic issues regarding land use [35]. This also enhances cities’ ecological resilience and the associated benefits for its dwellers against urban environmental hazards [20,36].
1.1. Problem Statement and Intended Intervention
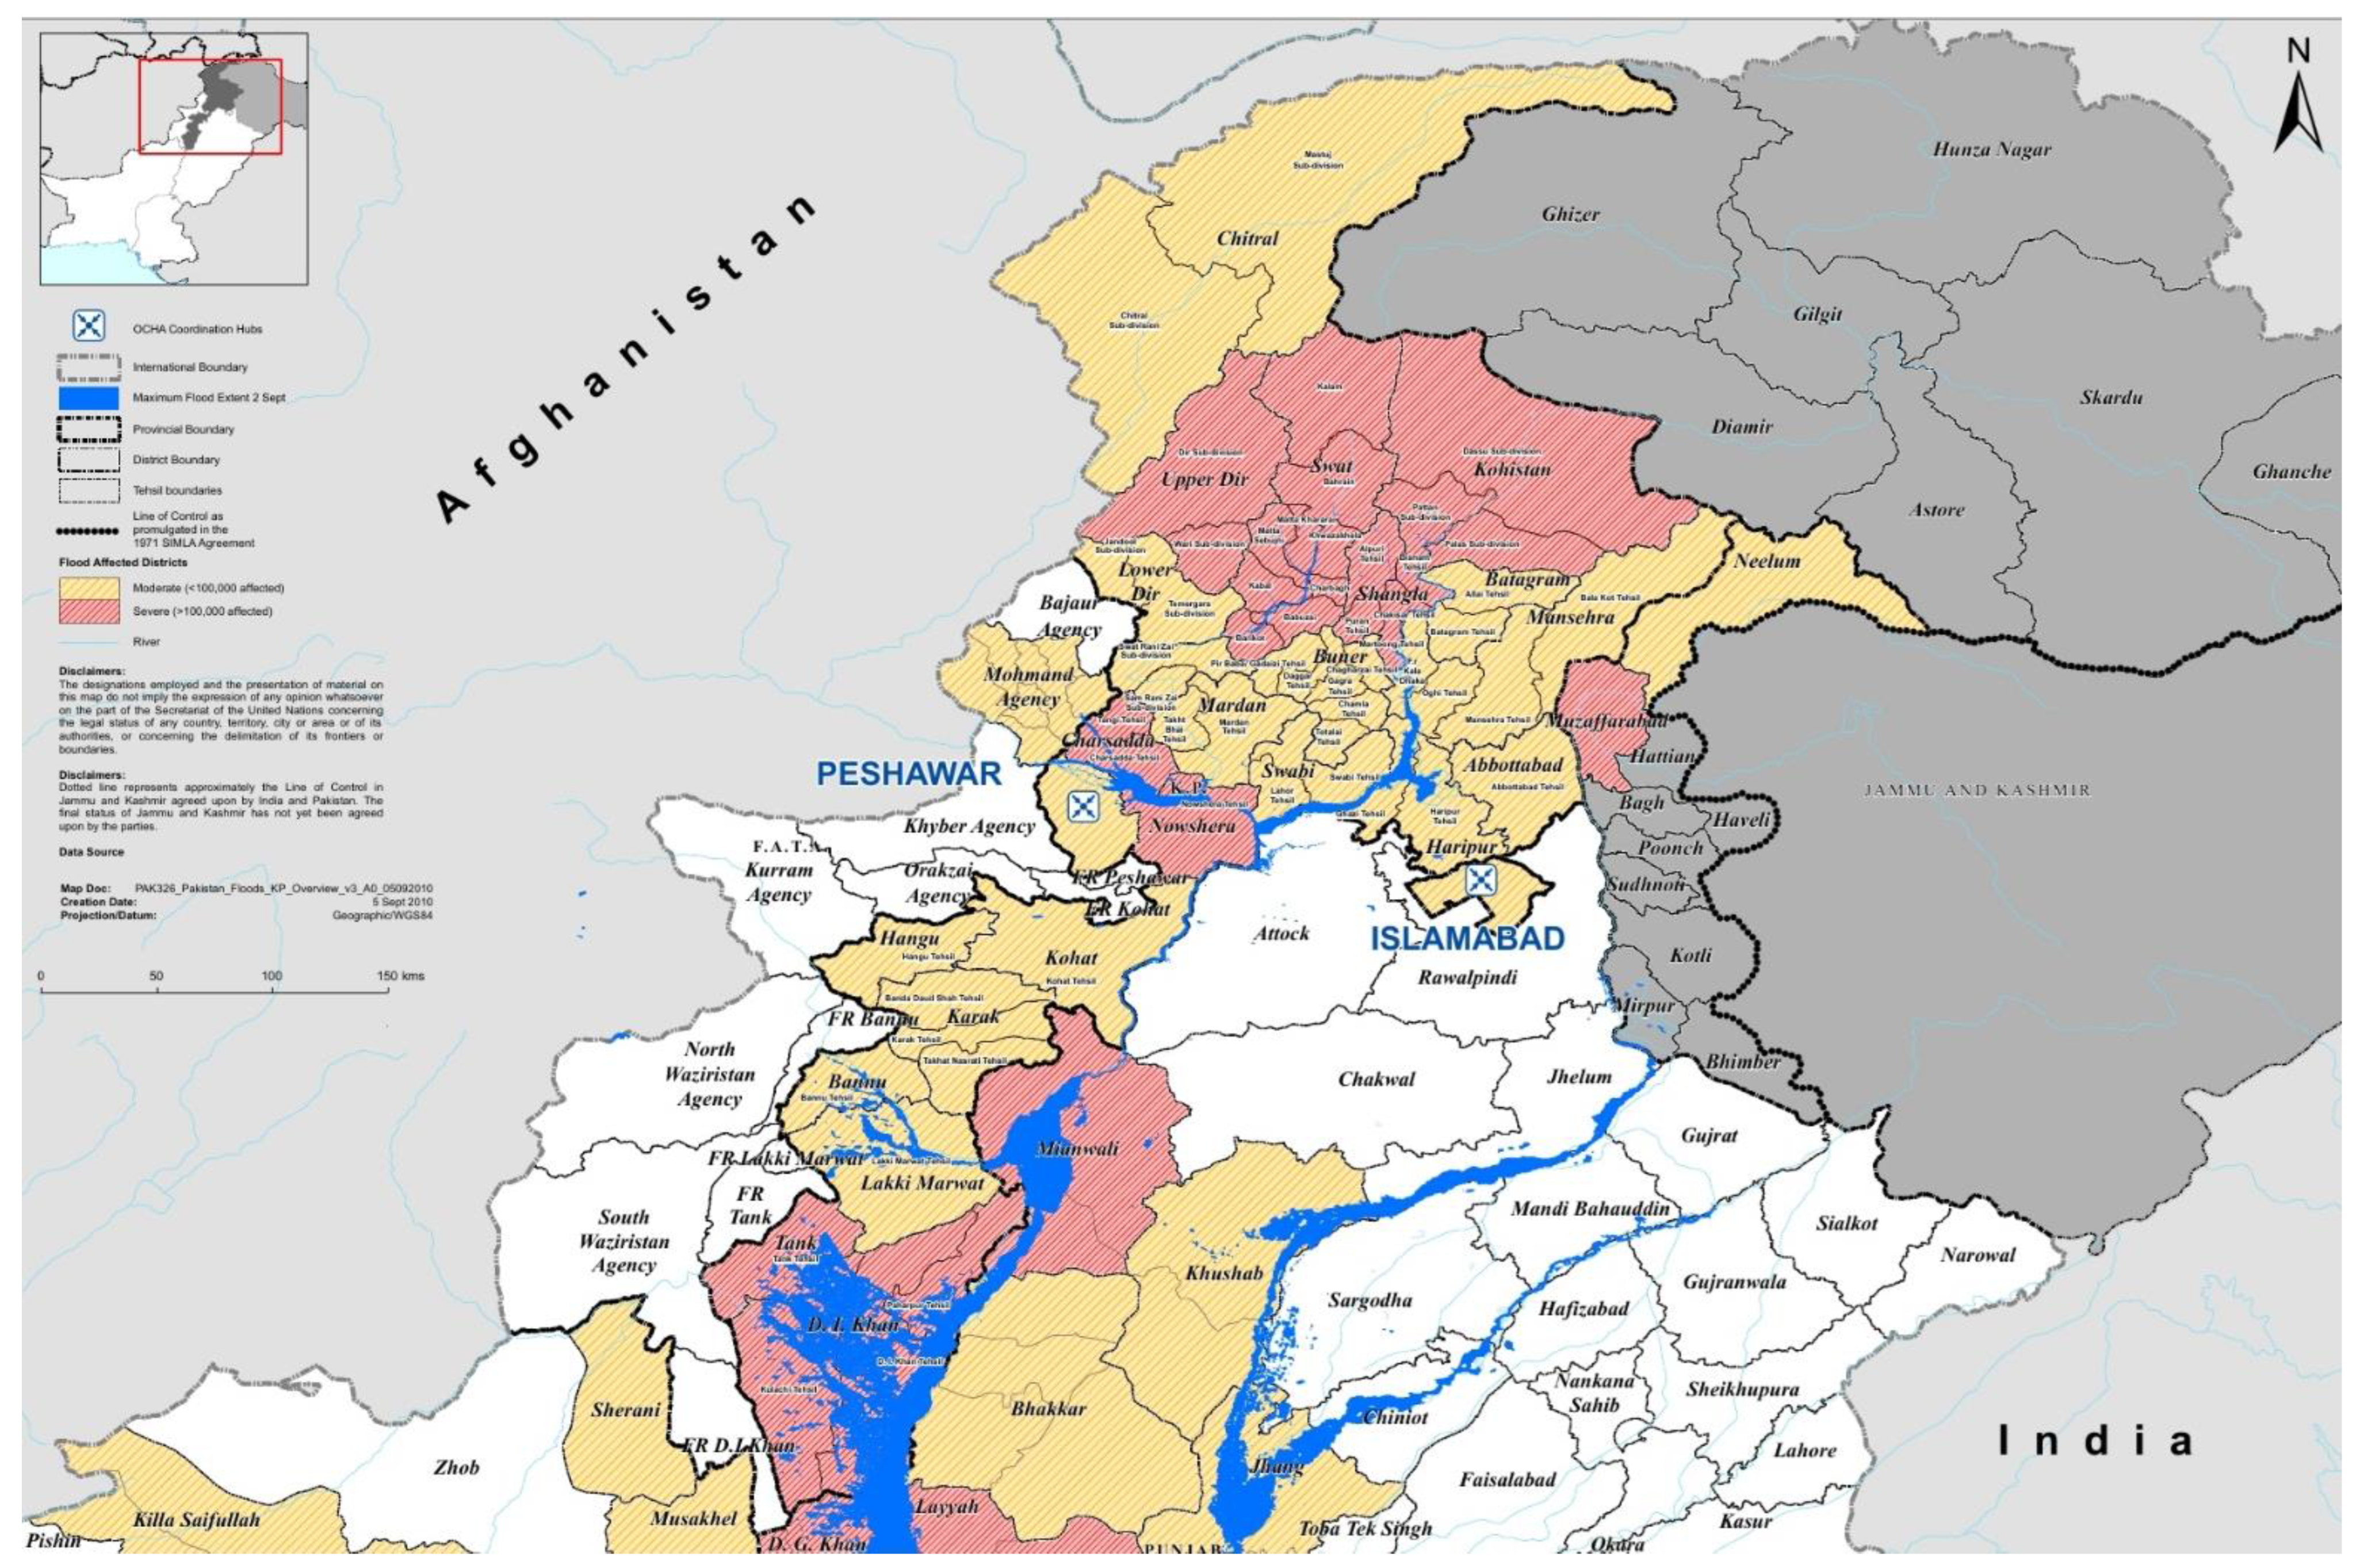
Pakistan still lacks green policies and strategies for resilient land-use planning. There is room to place UGI at the center of SCRM to fight the ever-rising climate hazards [20,37,38]. This need for innovative UGI planning is linked to Pakistan’s vast territory and multiplicity of dwellings (220 million inhabitants), where a significant portion of the population (39.22%) resides in urban areas [39]; this figure will have risen to 50% by the year 2030 [40,41], putting urban regions and inhabitants at risk of climatic catastrophes [42]. The growing number of natural catastrophes, especially constant flooding [37,43], has made Pakistan the eighth most vulnerable country in terms of natural calamities [44,45]. At the regional level in Pakistan, the Khyber Pakhtunkhwa (KP) province stands out as the region most hard-hit by a series of calamities, accounting for massive economic and human losses [20,36,46,47]. The damage is mainly linked to KP’s topography and physical location [20,43] (Figure 1), which often results in natural catastrophes of varying magnitudes. These emerging issues are directly linked to inefficient land-use planning and backward policies that lack UGI and SCRM factors [20,23,36]. The lack of such innovative planning has led to a decline in green spaces in KP’s cities: Peshawar, Mardan, and Charsadda. The loss of urban green spaces (UGS) is linked to a weak planning process, implementation issues, a lack of scientific knowledge and awareness, and the non-existence of a participatory planning (PP) approach, which is transforming green spaces within the built infrastructure [20,21,24,48,49,50]. Although efforts are underway to adapt to spatial technologies for developing land-use maps of major urban regions, such interventions would require time, resources, and infrastructure to develop an efficient data collection mechanism in the non-collaborative environment prevalent in Pakistan [20,38,51,52]. The country and the provinces must work to catch up with the CC policies of the developed nations (e.g., the Netherlands, Germany, and the UK), which already have UGI and SCRM policies in place to plan and design climate-resilient urban regions [4,11,12,13,53].
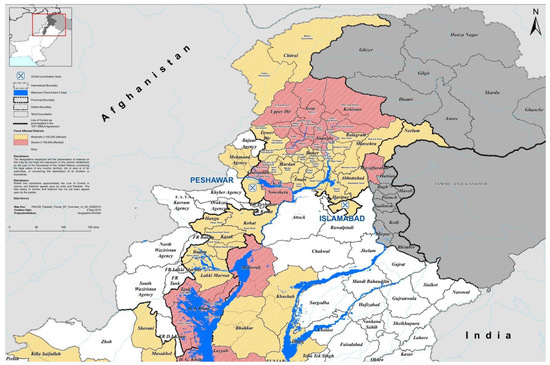
Figure 1.
Khyber-Pakhtunkhwa (KP): Flood-affected urban centers. Source: [54]).
Pakistan in general, and KP cities in particular, require immediate intervention to build a holistic PP approach for UGI and SCRM as such an approach carries the potential to improve the urban system/functions against the problems of a changing climate [15,35,55,56]. Such a UGI framework approach will encompass core sustainable UGI indicators, being interlinked with a diverse vital taxonomy of UGS elements, as jointly determined by all stakeholders in the native spatial environment. It will be helpful in defining the necessary pragmatic and proactive landscape and greening policies and strategies for planning resilient cities in KP. It would be naive to claim that the real drivers of climatic disasters are only linked to weak laws and their enforcement, a lack of clear legislative planning framework, and a reactive planning approach [57], yet in actuality, they are also linked to the inefficient implementation of such laws/policies that result in a decline in the number of natural green spaces [21,22]. This lack of both policies and their implementation has been systematically leading to the degradation and depletion of the natural green barriers, thereby endangering the urban ecology, human health, and well-being [58,59,60], and enabling destruction as a result of multi-climatic disasters on a rising scale [20,36,45,46], accentuating KP’s vulnerability to natural catastrophes [47] and the negative impacts of calamities in catchment areas.
Thus, it is clear that PP is most needed for UGI in terms of efficient management or SCRM, in order to foster coordination among three tiered groups: decision-makers, experts, and the local community. These steps are mandatory to ensure efficient land-use planning, embedding input from all the concerned stakeholders so that a sustainable UGI framework can be developed (Appendix A). Such a model will then identify the potential taxonomy of UGS elements regarding the respective sustainable UGI indicators. These will be used relative to local contextual factors and the heterogeneity/socio-demographics of the stakeholders. This intervention would lead to the development of a rich body of multi-functional UGI indicator-based framework models, grounded upon “triple-bottom-line” sustainability, and adapted to the local context. This will then strengthen the climate-resilient strategies, green spaces, ecosystem functions, and human well-being.
Aim and Research Questions
The aim of this research study is to build a sustainable UGI indicator-based framework/model for identifying UGS elements, to enhance an area’s resilience against climate hazards. This model is to be built using an inclusive approach, by engaging experts and the local community.
The research questions of this study are:
- RQ1. What are the main UGI indicators under MSEP?
- RQ2. What are the key UGS elements that can improve UGI resilience under SCRM?
- RQ3. What is the sustainable UGI indicator-based model needed to build a climate-resilient city?
2. Research Methodology
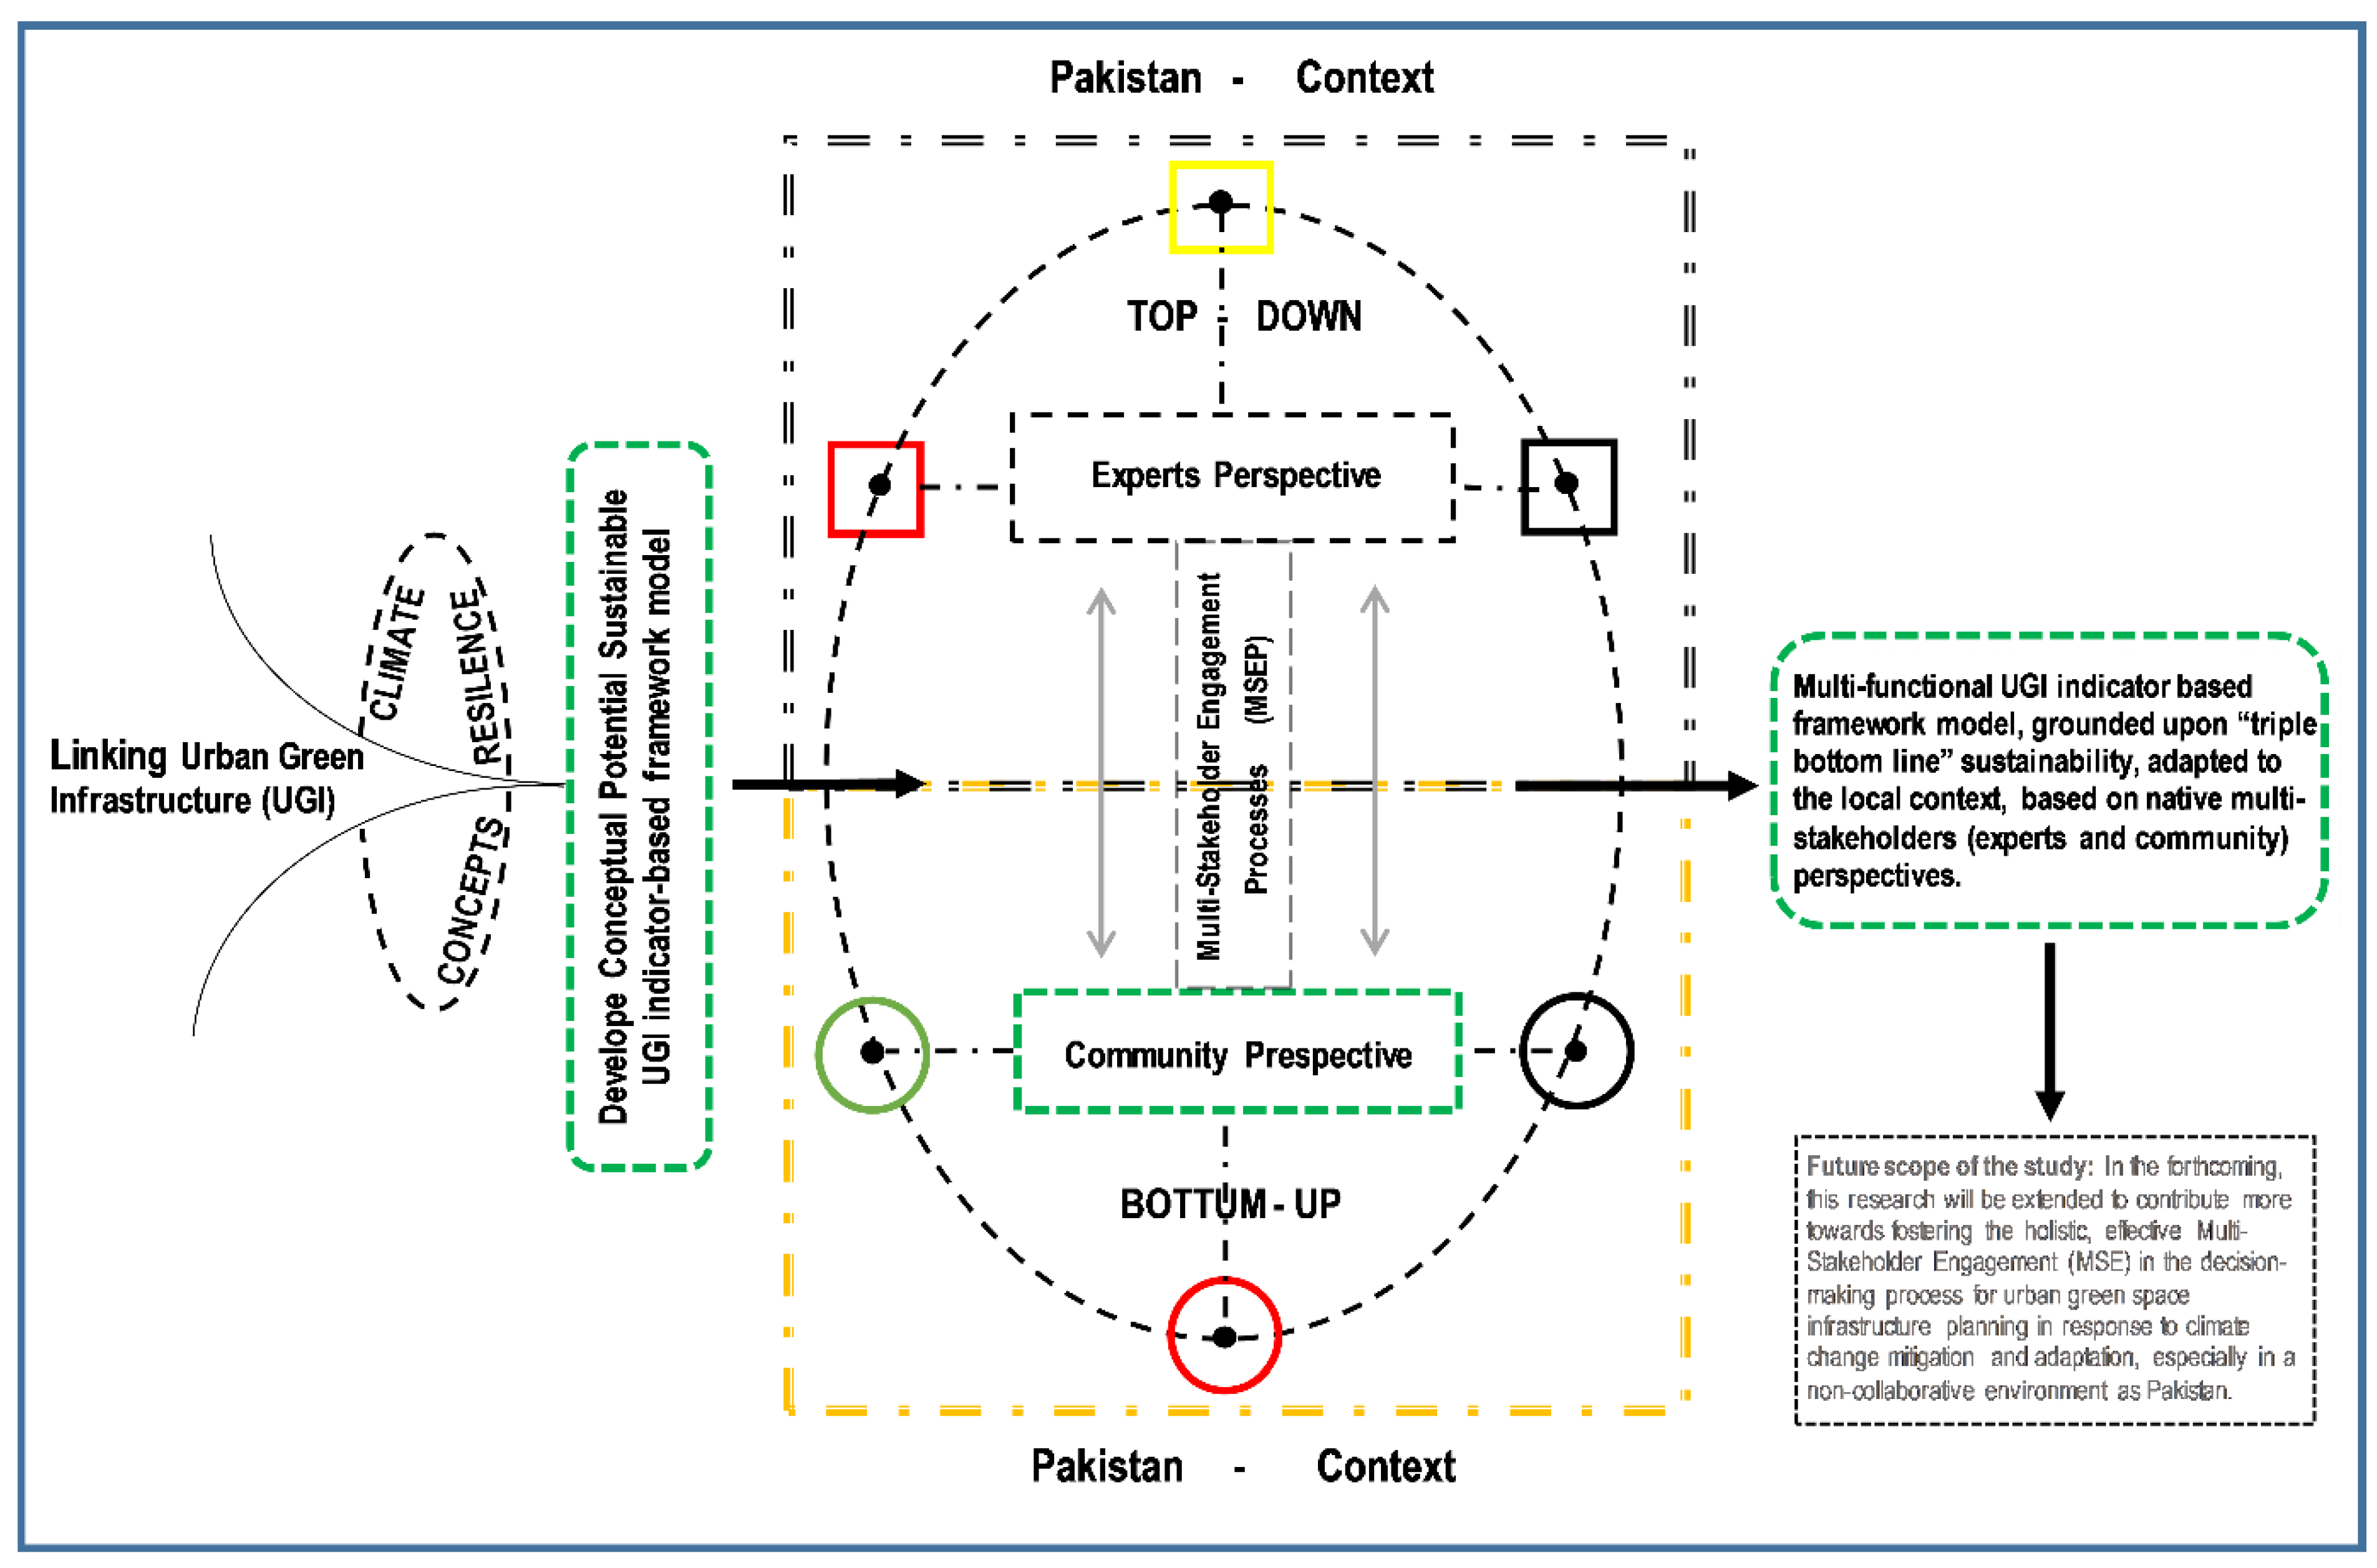
To achieve the aim of this research study (i.e., building a sustainable UGI indicator-based framework/model by identifying UGS elements), this study has consulted the local stakeholders (experts and community) in KP (Appendix A: Table A1). This cross-examination of the concerned stakeholders is positioned as part of empirical research that facilitates a holistic/in-depth investigation (Figure 2), not only to validate the findings (within the real-life context) but also to establish a rational standpoint between the stakeholders to design a sustainable UGI indicator-based framework/model. It is intended as an aid to designing innovative green avenues for climate change adaptation.
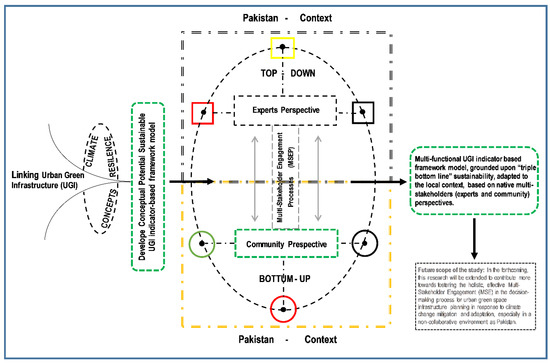
Figure 2.
Conceptual framework. Source: Authors’ own.
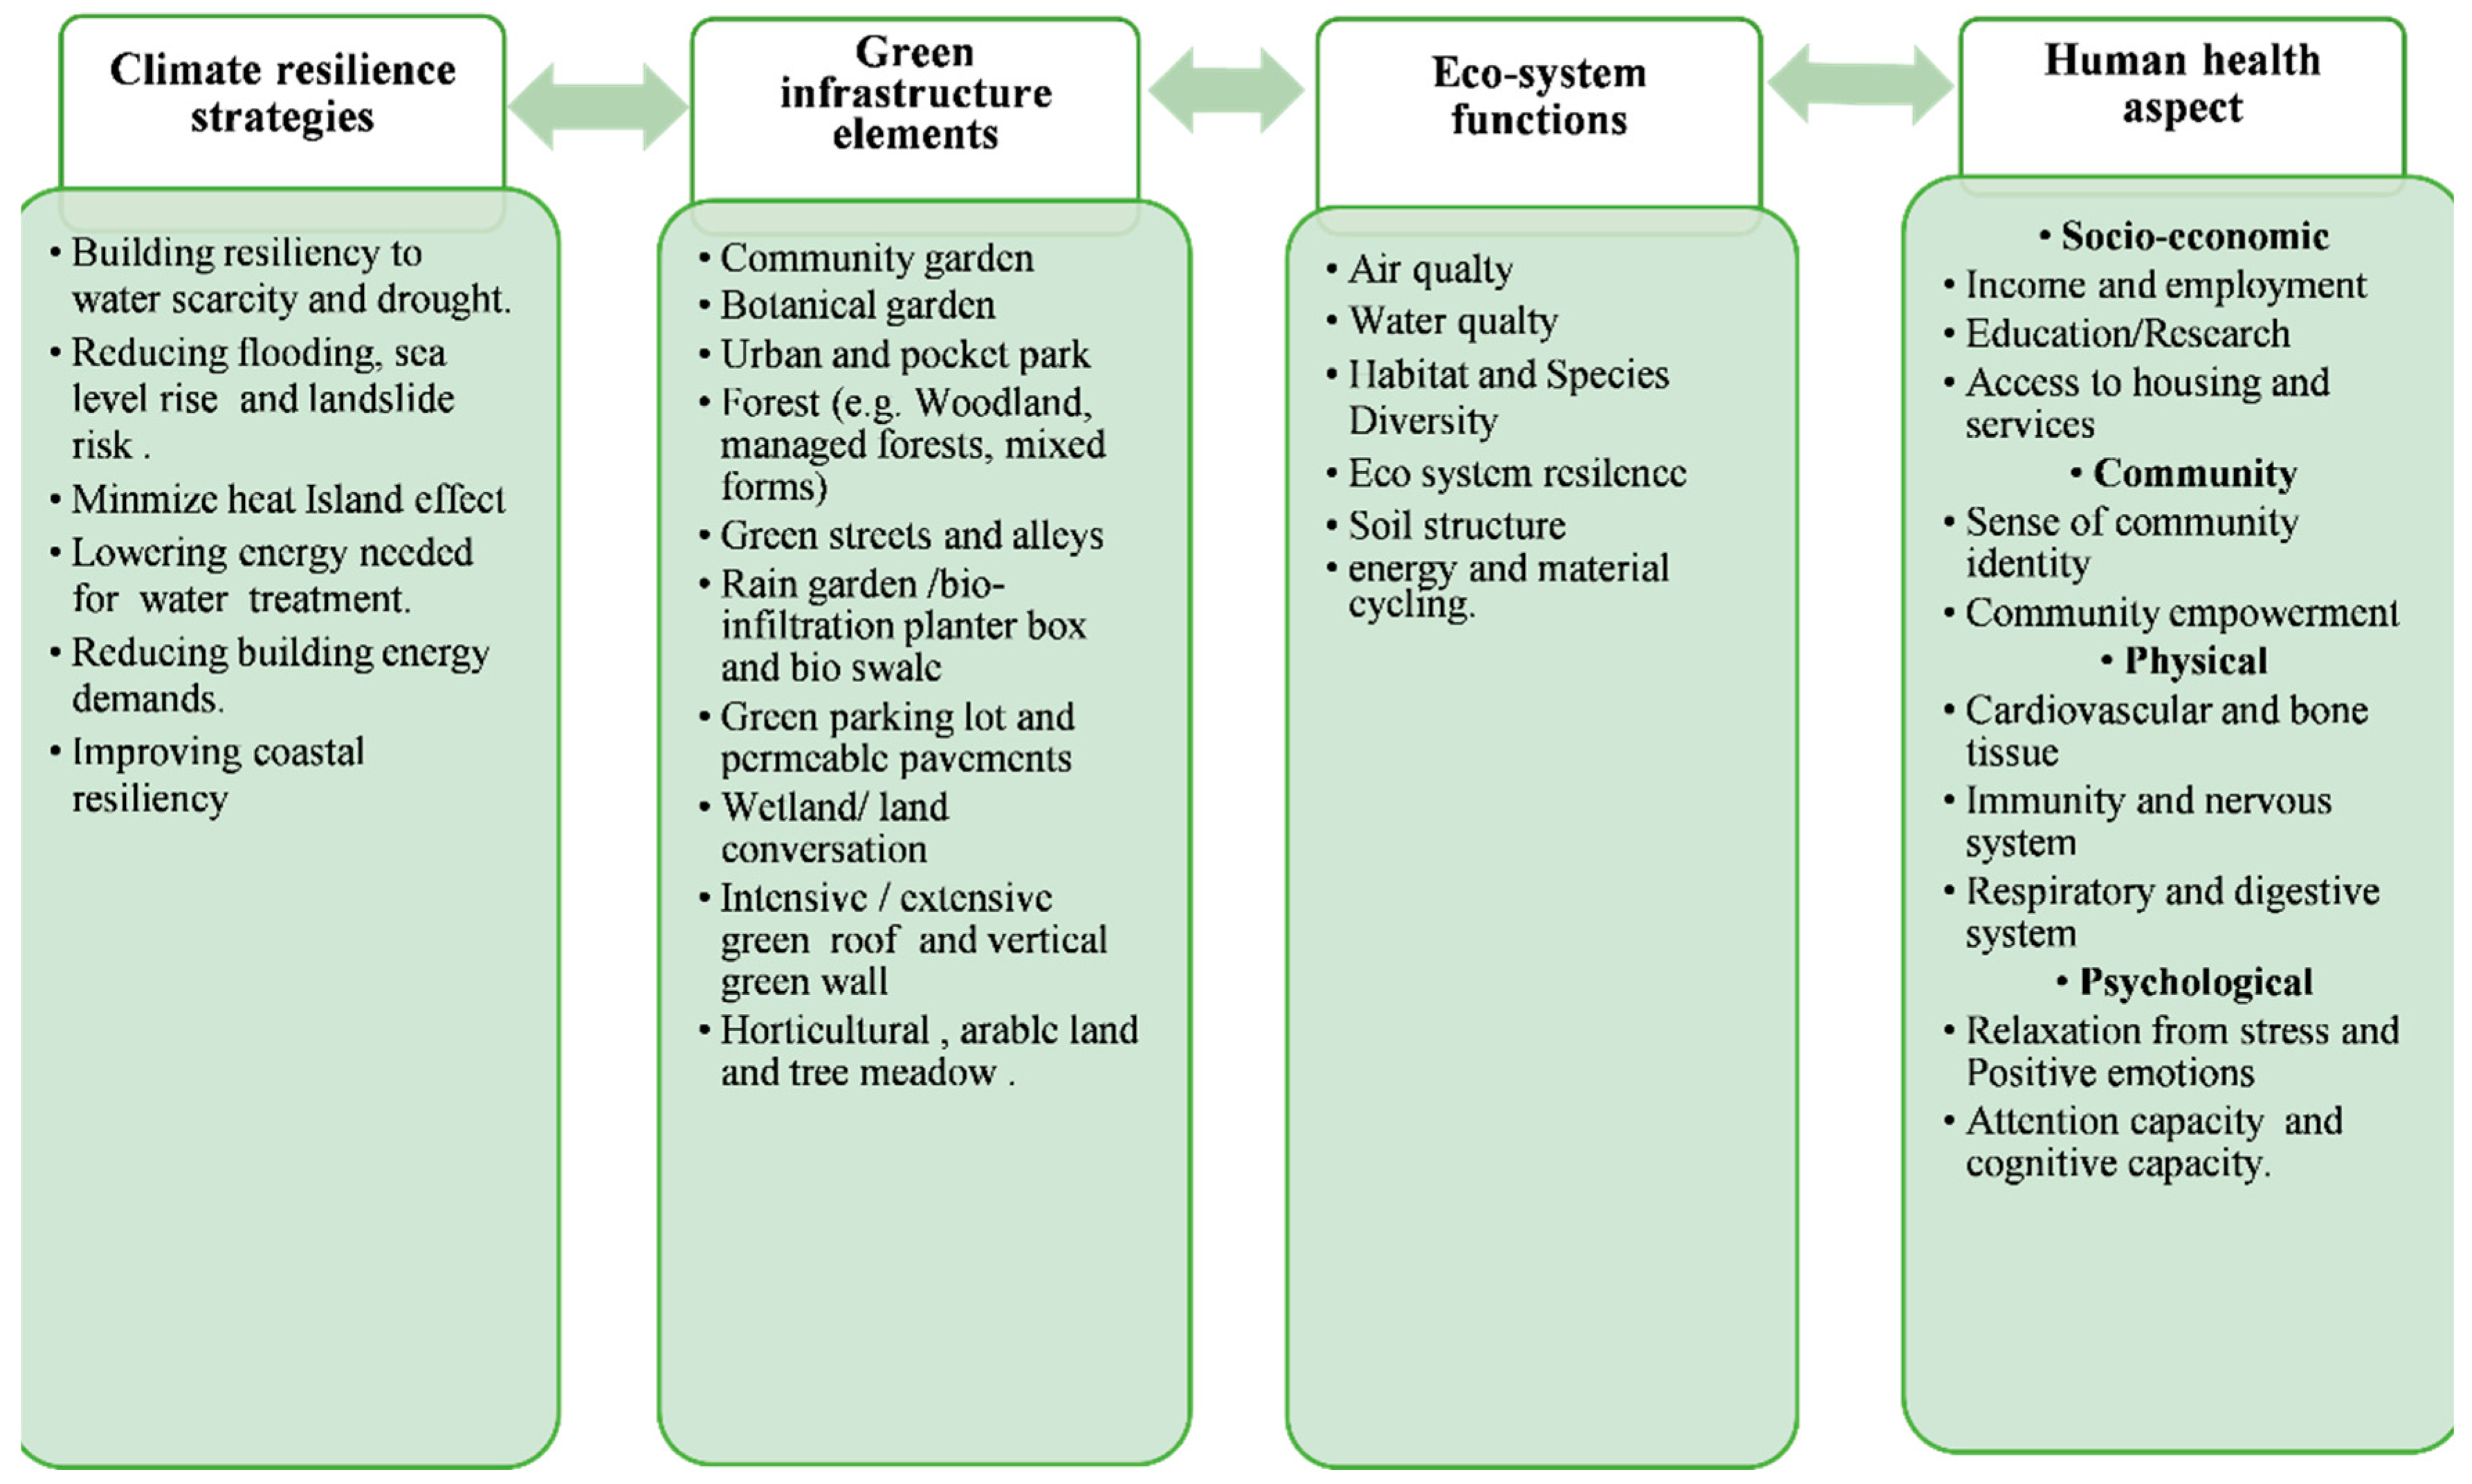
2.1. Probing the Potential UGI Indicator-Based Framework Model
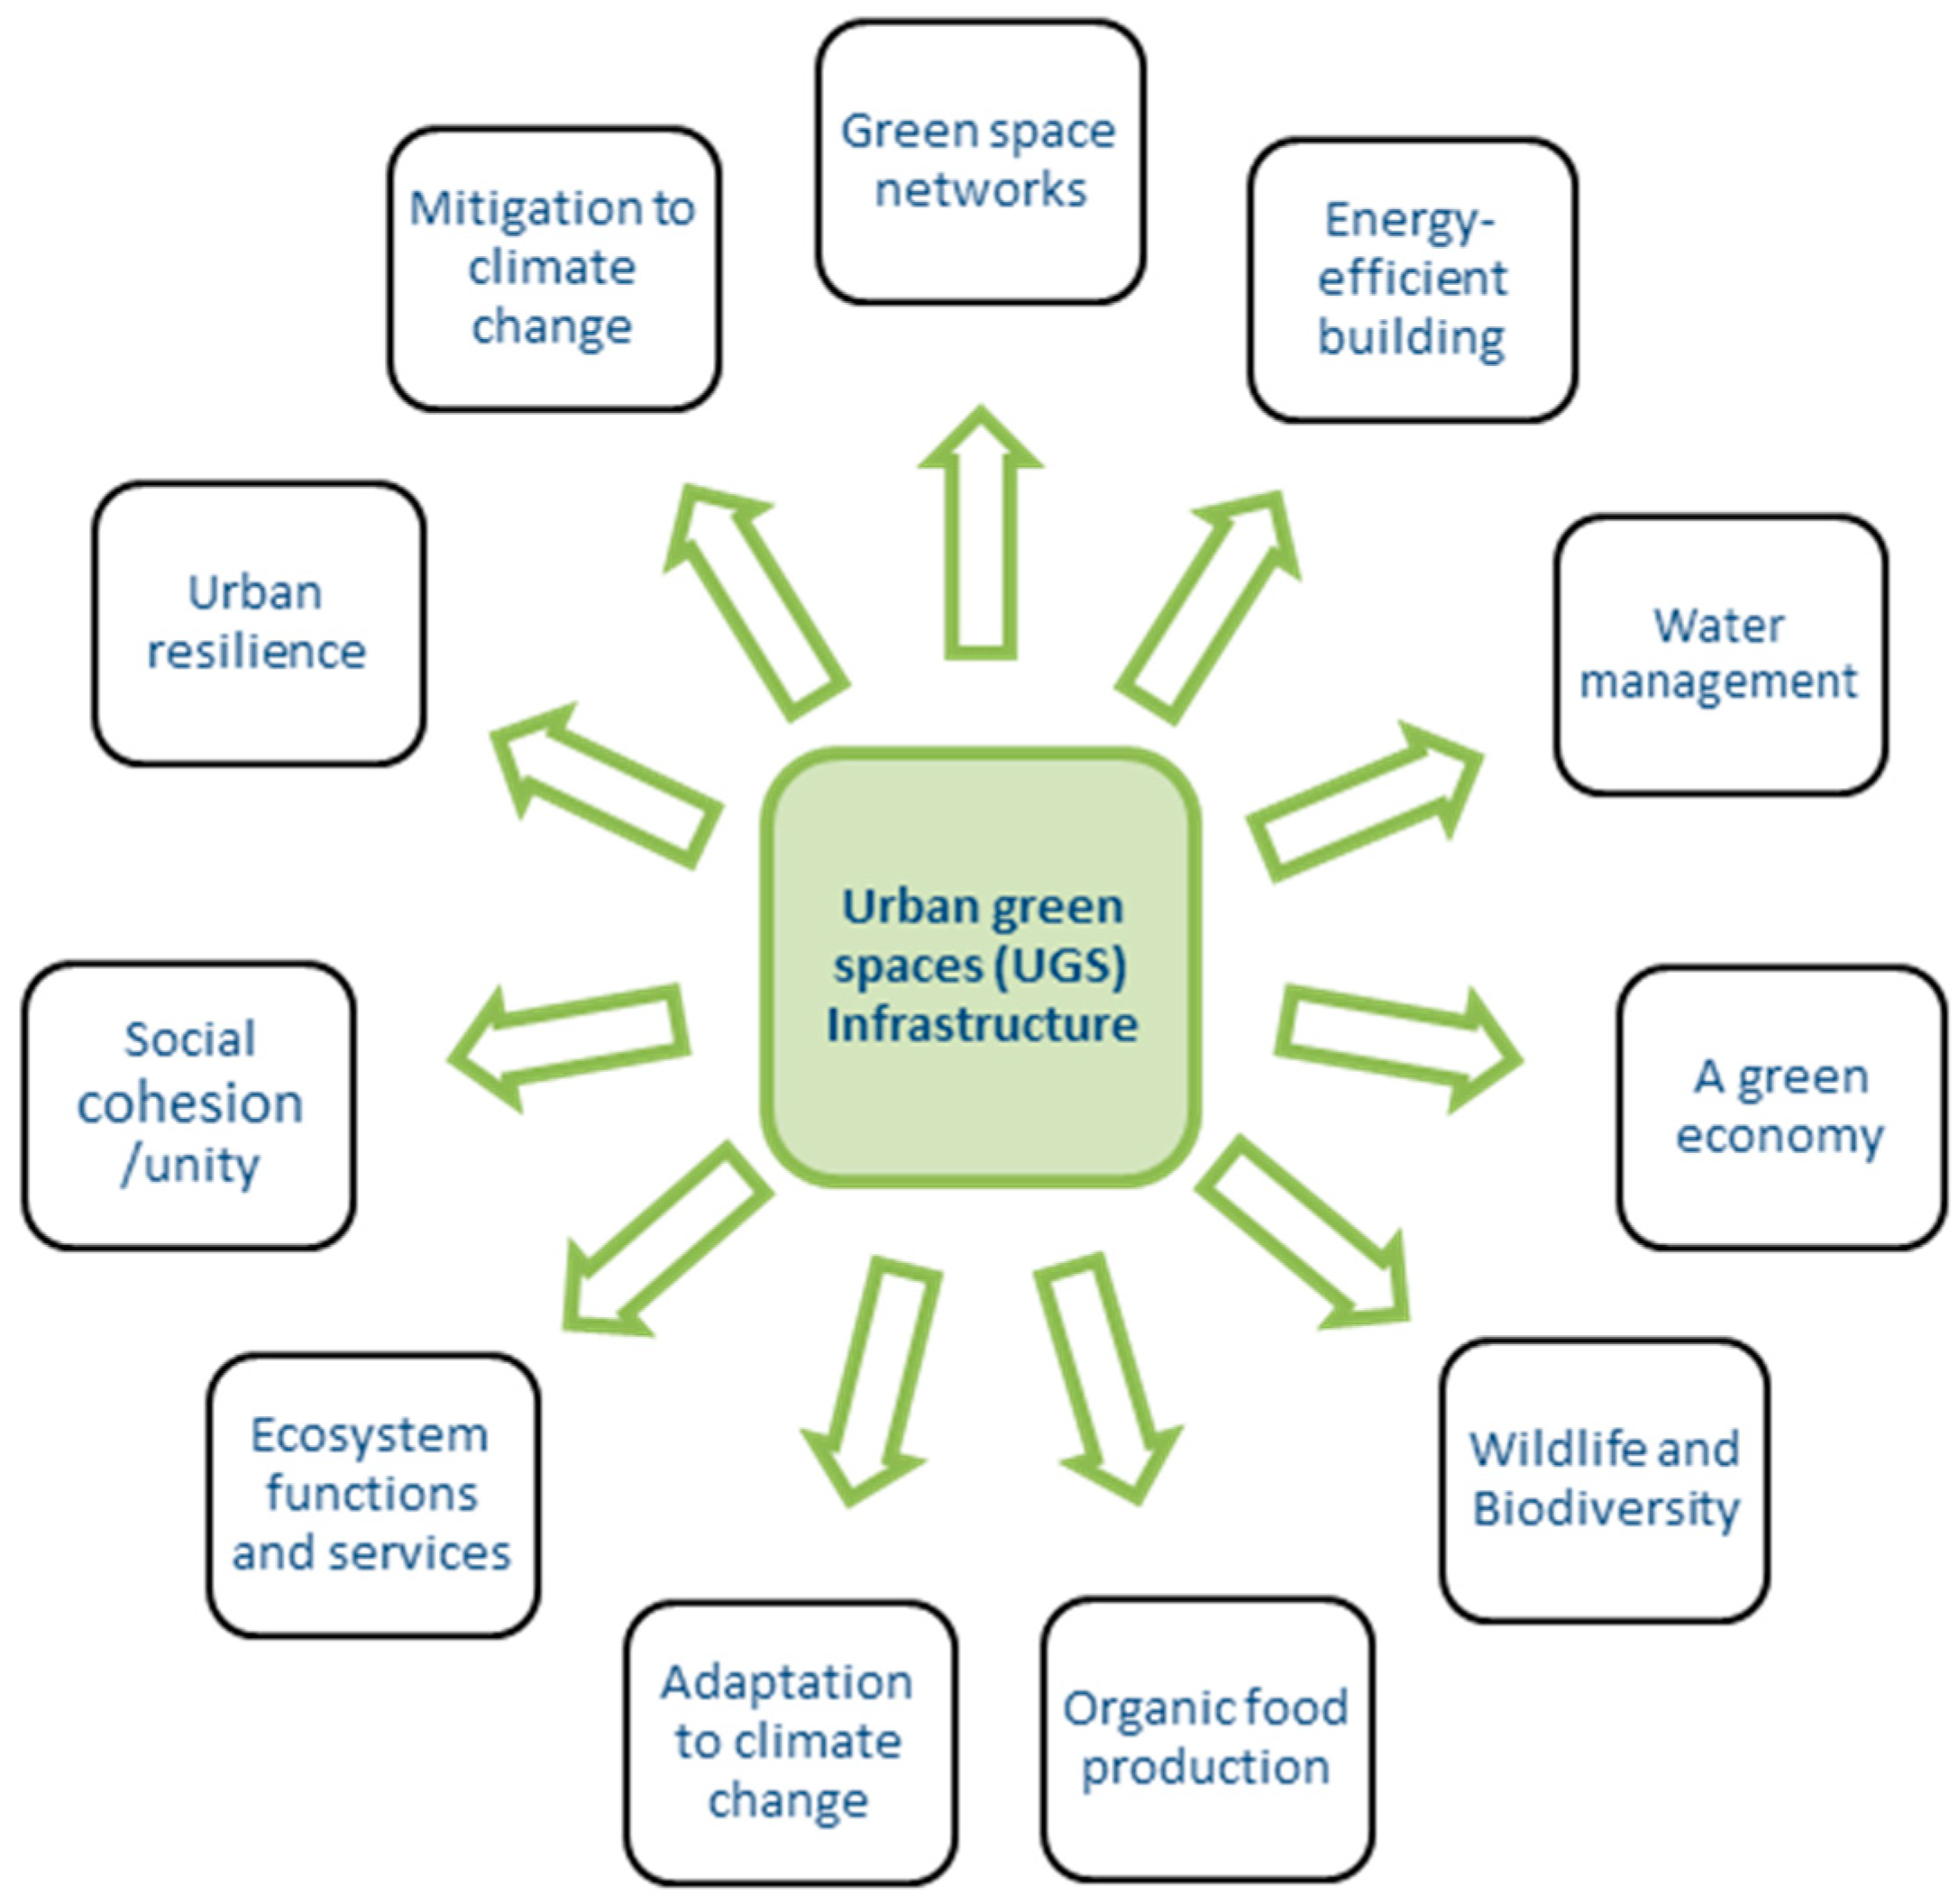
The UGI model evolves around blending two paths: (a) creating a conceptual base on which to build the framework, which is extended to bond-building anthropogenic activities and UGI for resilient cities; (b) building climate resilience strategies that are based on ecosystem functions, human well-being, and UGI elements (for details, see Appendix B: Figure A1 and Figure A2). Thus, the presented framework/model, as well as the resilience strategies, tackle or integrate different conceptual themes (i.e., green-space networks, energy management, water management, the green economy, wildlife and biodiversity, organic food, mitigation and adaptation, ecosystems, social cohesion, and resilience) that originated from the semi-structured discussions conducted through a field survey (Figure A3). These innovative themes project the potential role of the UGS infrastructure in addressing sustainable climate-risk management (SCRM). The consolidated integration of all three dimensions—ecological, socio-cultural, and economic dimensions—further leads to identifying UGI indicators (e.g., stormwater management, lessening noise pollution, improving air quality, etc.) for green urban planning. The proposed UGI indicators were mainly quantitative and were set based on expert and community responses (Figure 2). The relative index (RI) analysis technique was employed to investigate the insightful viewpoints offered by the local stakeholders (i.e., community and experts) to build a potential UGI framework, with the aim of reducing urban vulnerability.
2.2. Multi-Stakeholder Engagement Processes (MSEP)
Multi-stakeholder engagement processes (MSEP) remain effective as a participative planning approach to engaging the stakeholders. The stakeholders in this study are (a) the local community, for which an empirical survey was conducted (MARD: Mardan District, PESH: Peshawar District, CHAR: Charsadda District in the KP Province), and (b) experts to whom the field survey was extended (respondents from the GOV: Government, ACAD: Academicians, PRACT: Practitioners, and INGO: International Non-State/Government Actors/Org). Thus, MSEP here provided a holistic pathway to ensure the effective participation of the local/native stakeholders in the decision-making process: the experts as policymakers; practitioners; academicians, and the local community. MSEP is deployed in this research to develop a sustainable UGI indicator-based framework, which has its worth and, yet, is less explored in designing policies and frameworks for land-use planning and implementation [20,38,61,62]. However, MSEP remains effective for designing and implementing nature-based green infrastructure (NBGI) initiatives.
Hence, an MSEP-based pairwise examination is utilized here to identify and conceptualize the similarities across experts and the community perspective on UGI indicators that further lead to the taxonomy of UGS elements, dependent upon the socio-cultural and ecological context of the region. Additionally, MSEP deployment has verified and validated a set of core sustainable UGI indicators and UGS elements. This led to developing a richly multi-functional, inclusive, sustainable UGI indicator-based framework/model that can be deployed in the local built environment. Such a model allows the local inhabitants to interact with the development of innovative multi-functional urban green spaces, thereby alleviating the high risk of catastrophes (e.g., urban flooding, droughts, urban heat island (UHI) effects, etc.). All in all, MSEP has helped to develop a model that is eco-friendly and climate-resilient.
2.3. Survey Design and Sampling Technique
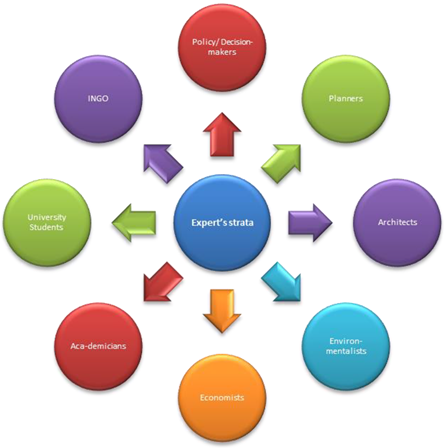
This research deployed two survey techniques to operationalize an in-depth empirical examination. The first was an expert-based perception survey that was extended to 212 respondents, of whom 172 were included in the final results. The rest of the questionnaires were excluded since the mandatory questions were not answered. The demographic information of the expert-based perception survey demonstrated that 45.9% were female and no participant was from the third-gender category, which choice was offered here since the government of Pakistan recognizes the identification of “trans” as a third gender [63,64,65] (CI 95%, ±5% MoE). The questionnaires were assessed by the authors and put forward for analysis, as per Cochran (1977). A purposive sampling technique was used to sort the specific participants into nine distinct experts’ strata (Table 1).

Table 1.
Demographic information of the nine distinct experts’ strata/group participants.
The second primary data collection method was based on community-based empirical studies from the study districts of Peshawar, Mardan, and Charsadda. The study adopted two-point scale criteria to identify the municipality (Tehsil) and the sub-municipality (Union Council (UC)) in the selected study areas. Furthermore, the snowball technique was deployed to designate specific houses serving as a reference point, marking every fourth house/HH from the reference point. This was performed as no official lists of the residential houses within UCs exist. For data collection purposes, a structured questionnaire was deployed that was designed in several sections designated as A–C. Section A is aimed at verifying the participant’s profile, knowledge, and experience. The category of “trans” as a third gender was included as it is officially recognized by the government of Pakistan. Section B encompassed four questions, explained in Appendix E, that verified and validated the local experts’ and community’s perspectives on the proposed possibilities and definitions of the UGI, climate change, climate change adaptation, and urban resilience. Section C is classified into three subsections (ecological, socio-cultural, and economic); each section includes multiple questions with the aim of rating and identifying the level of importance of each specific sustainable UGI indicator and its interrelationship with multiple green elements. Potential UGI indicators and elements were developed by the authors in preceding research studies [38]. This process resulted in our selecting the most vital green elements that enhanced the quality and standard of a particular UGI indicator and would create urban regions that are resilient against natural hazards such as flooding [20]. Figure A4 in Appendix D shows the prior pre-test/pilot survey, wherein the suitability and inclusivity of the questionnaires were checked. Community-based questionnaires targeted 192 HHs (CI 95%, ±5% MoE) (Appendix F: Table A2), with respondents coming from diverse socioeconomic backgrounds (Table 2).
Table 2.
Demographic information of the community participants.
2.4. Data Analysis and Scoring
The Statistical Package for the Social Sciences (SPSS version 26) and Microsoft Excel software were employed to process the data gathered from experts and the community. A questions-based coding algorithm was utilized for parts B and C, which helped to segregate experts and community responses easily and to understand an inclusive multi-stakeholder perspective, according to the native built environment. A five-point Likert scale was deployed in part B and a nine-point Likert scale in part C4, ranging from “extremely unimportant” to “extremely important”. Positive and negative scales were employed to determine the variance in the significance levels among the specified UGI indicators and green-space elements (Table 3) as not all the green elements enhanced the health of the respective UGI indicators. Then, relative importance index (RII) and interquartile range (IQR) tests were applied to calculate the relative significance of each sustainable UGI indicator, as well as the UGS elements, as recommended previously [66,67,68,69]. This method is recognized as being the best for ordinal-scale surveys [70,71,72,73].
Table 3.
Equation (1) can be used to calculate the RII value for enhancing the noise quality indicator.
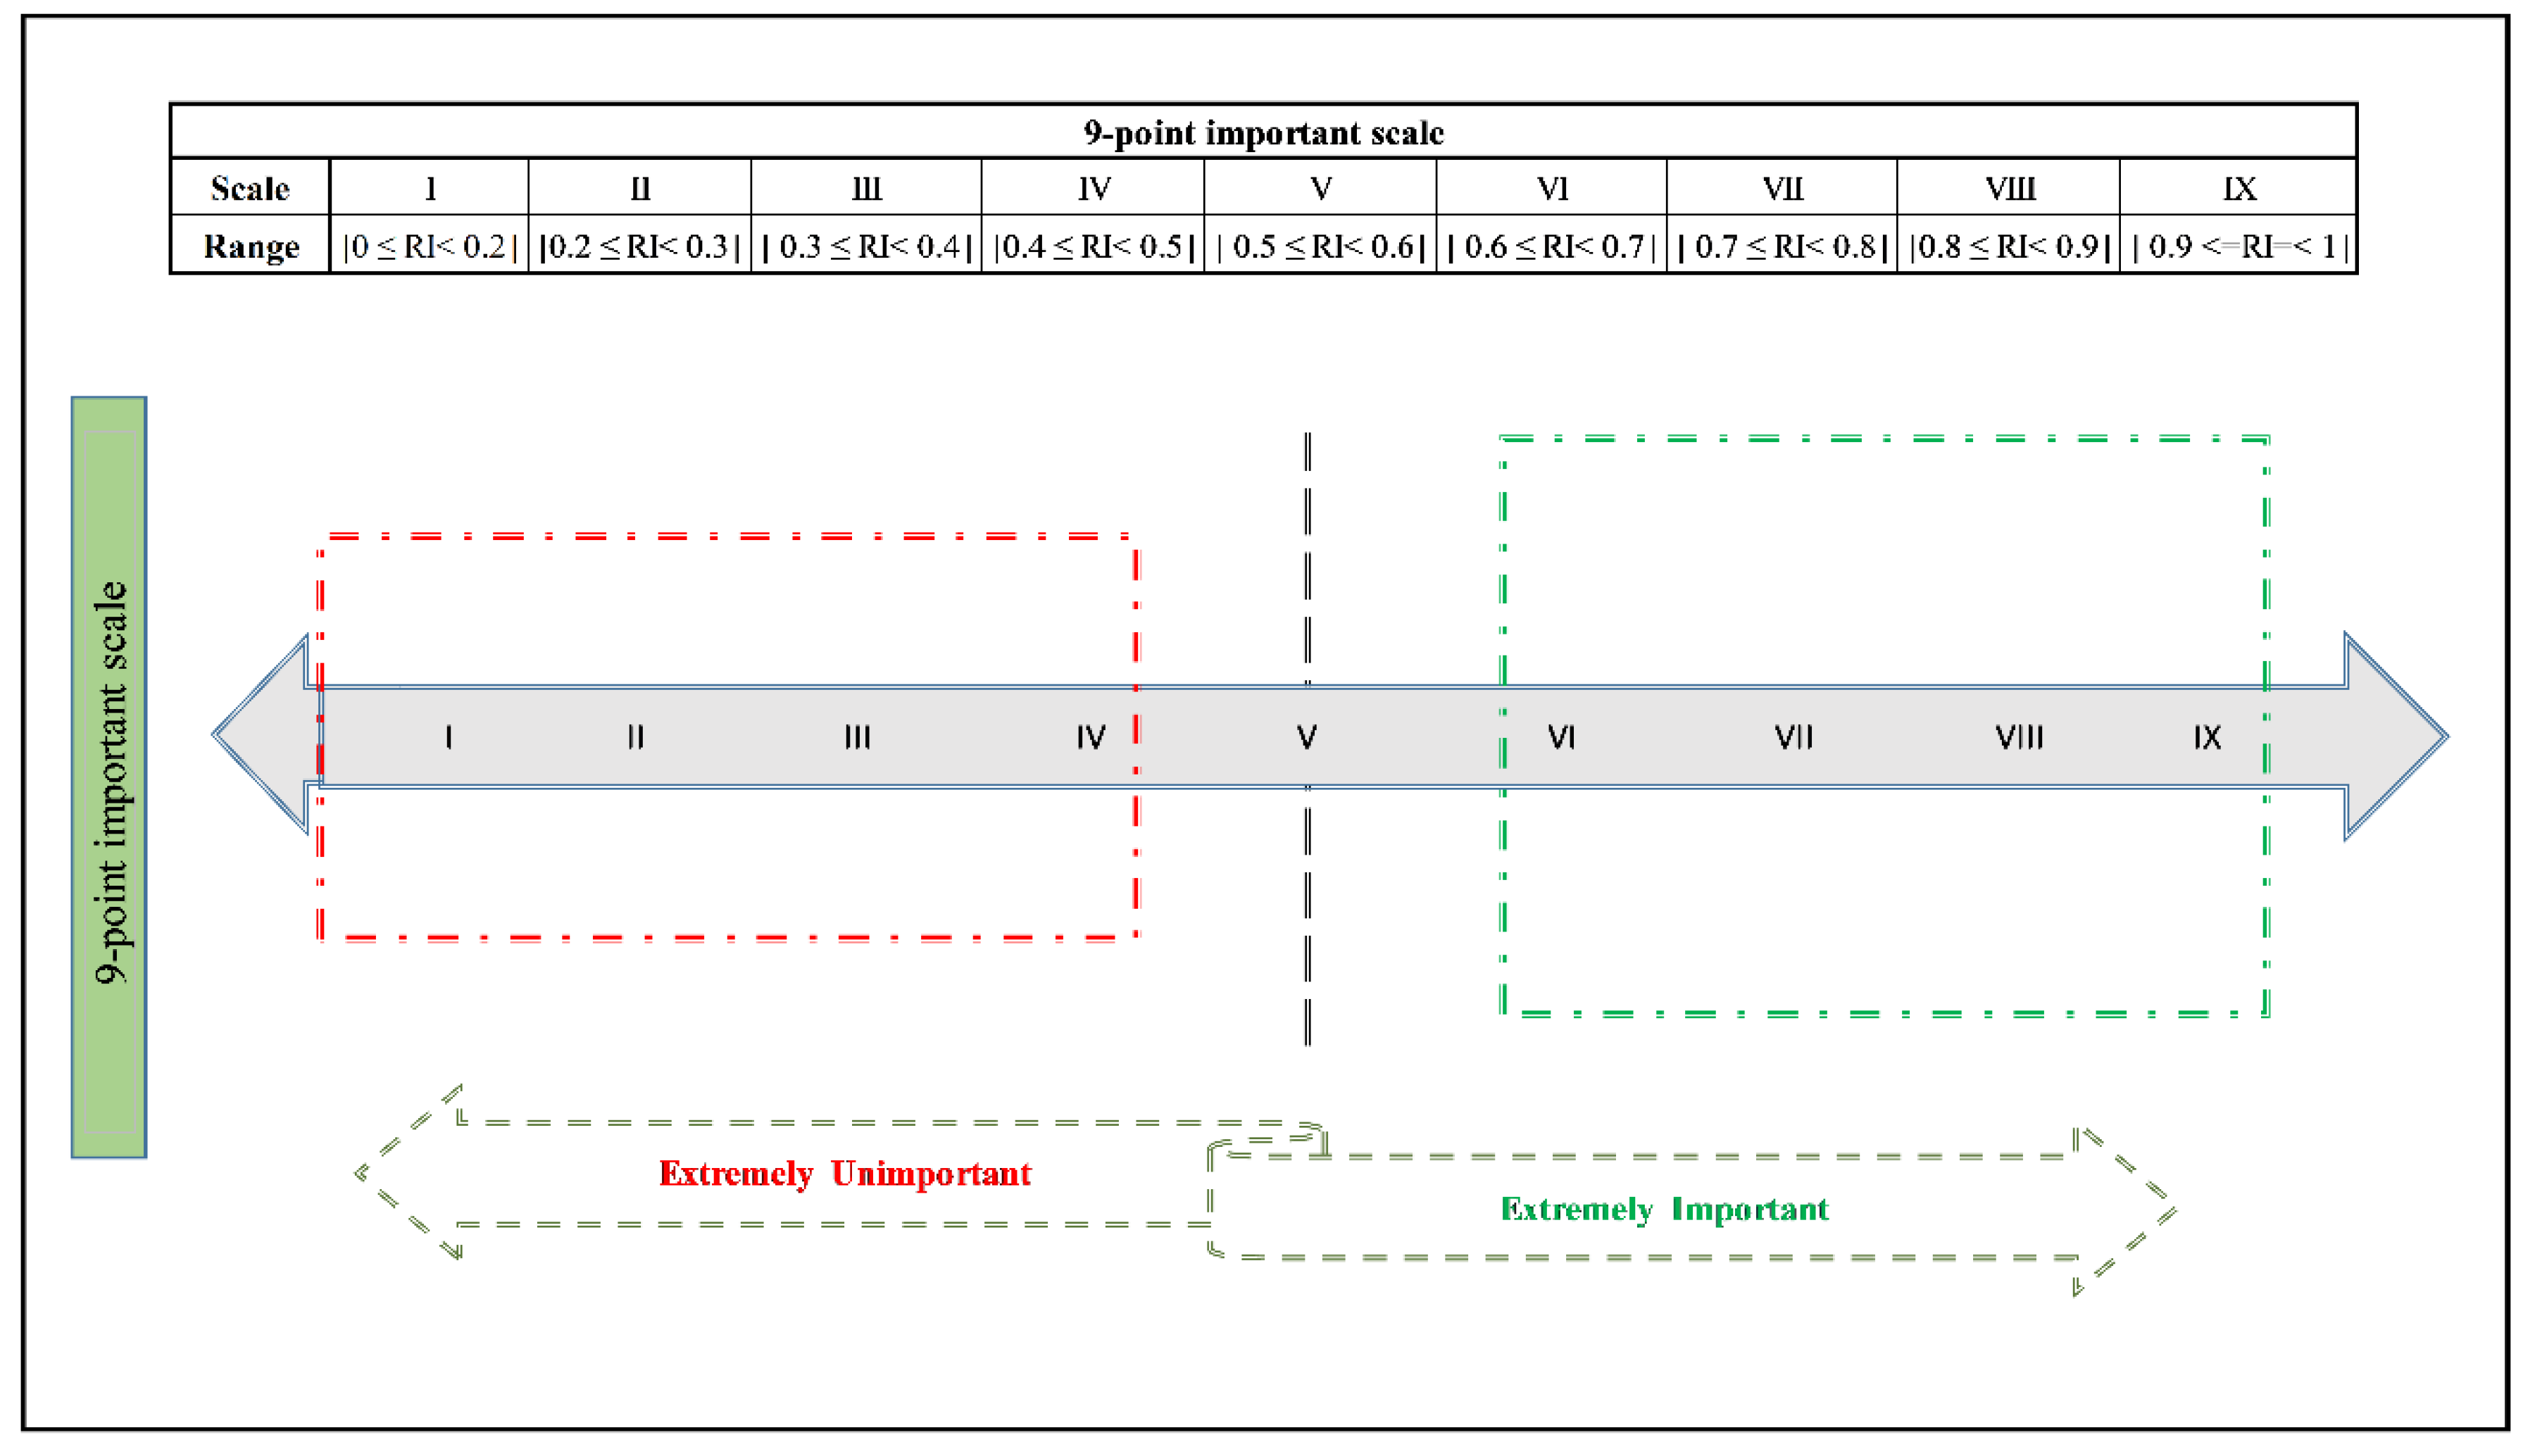
Based on a relative index (community + expert), the significance of the respective UGI indicator was determined. To ensure a usable quantity of UGI indicators and a full set of the vital UGS elements, four strategies were deployed: (i) an average RII data set was derived from both top-down (planning experts) and bottom-up (community) sources to obtain specific RII values for each UGI indicator; (ii) based on the inclusive RII values of the respective UGI indicators, an average RII value was calculated for each dimension of sustainability (Table 4); (iii) the RII values were translated into the 9-point importance scale criterion (Figure 3), as suggested by [69,71,74]; and (iv) adding four more fundamental levels to obtain variance in the importance levels among the specified UGI indicators. These techniques helped to identify the significance level of each sustainability dimension.
Table 4.
The UGI indicators’ relative importance (RII) value: integrating bottom-up (community) and top-down (expert) perspectives.
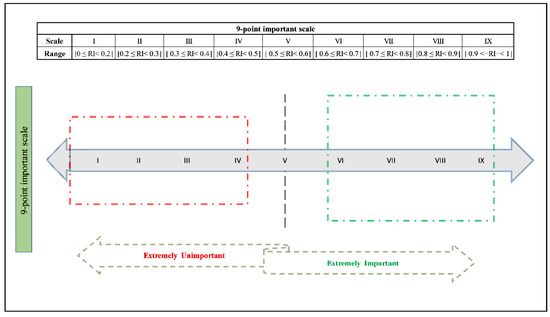
Figure 3.
Criteria of the 9-point scale. Key: I—extremely unimportant; II—moderately unimportant; III—slightly unimportant; IV—unimportant; V—Low; VI—slightly important; VII—moderately important; VIII—important; IX—extremely important. Source: Authors’ elaboration.
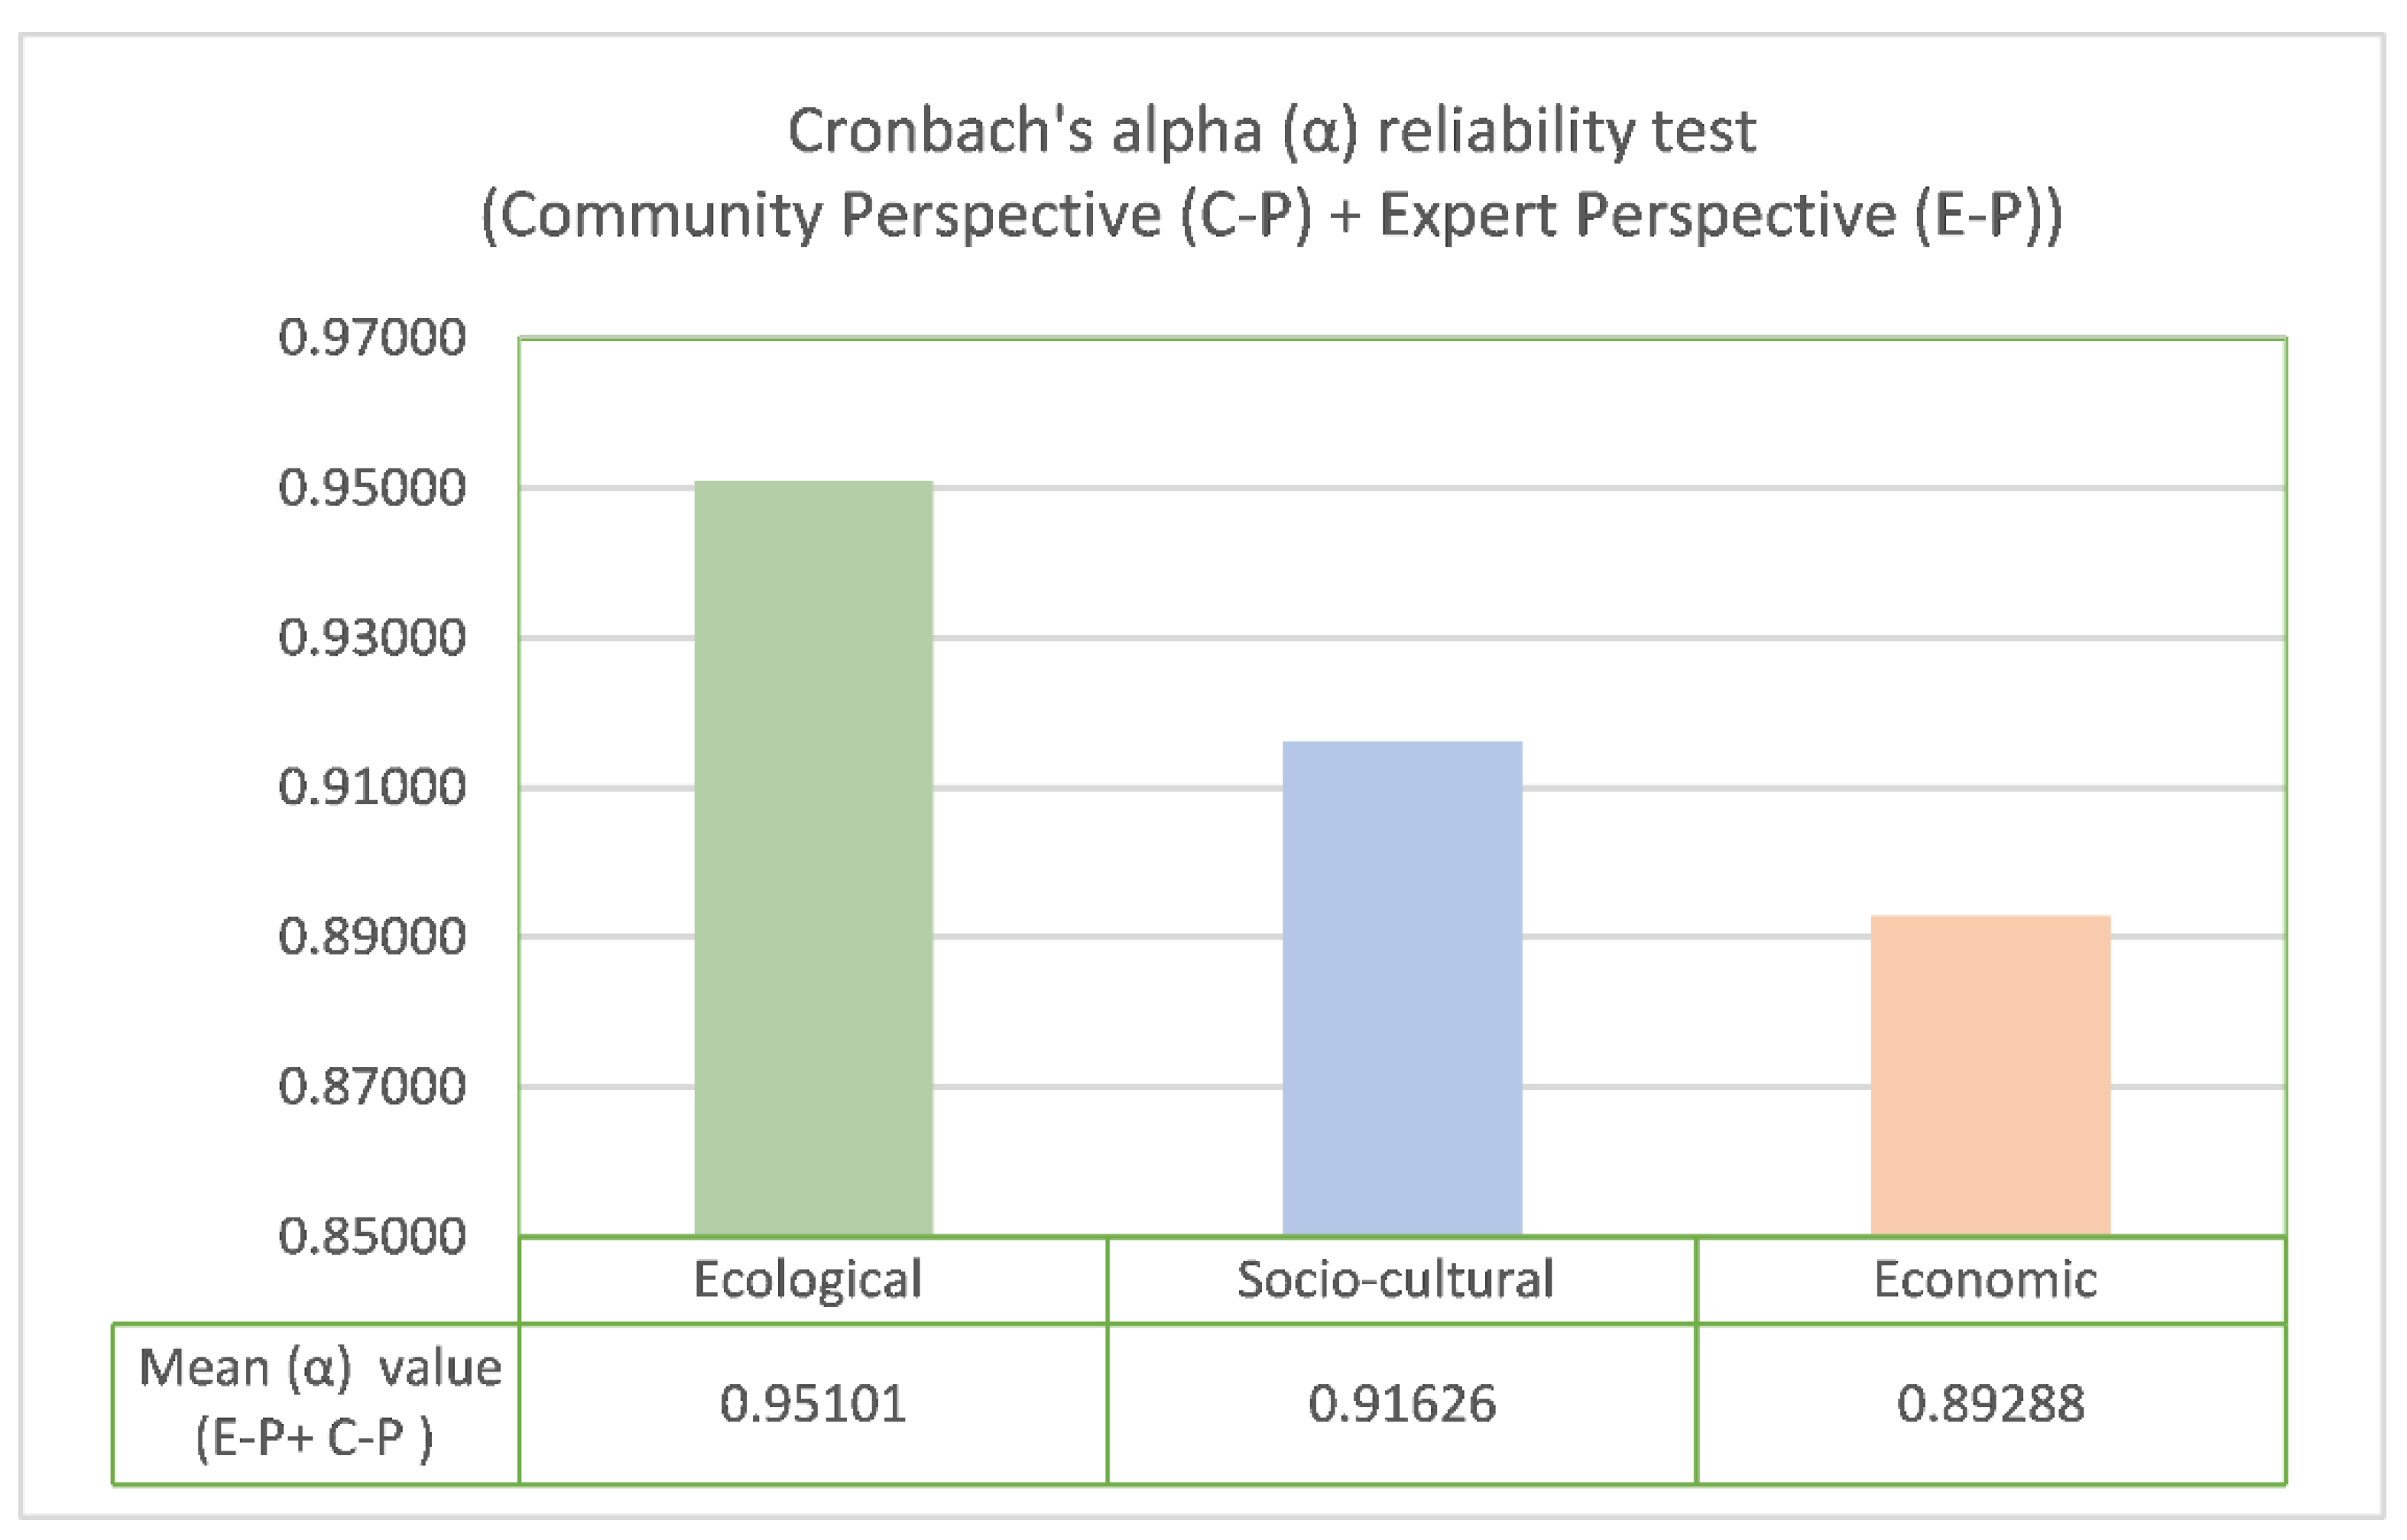
The IQR was applied to identify the cut-off points (Table 5a,b), as suggested previously [19,67,68,69,70,73]. The IQR helped to determine the difference between the median of the lower (Q3) and the upper (Q1) half of the data. Lastly, Cronbach’s alpha (α) reliability test confirmed the reliability of the data sets (α = 0.7); hence, they are acceptable for grounding the study findings (Figure 4).
Table 5.
(a). RII results of the UGS elements with regard to UGI indicators, rated by experts and community members. (b). Vital taxonomy of the UGS elements for the respective UGI indicators.
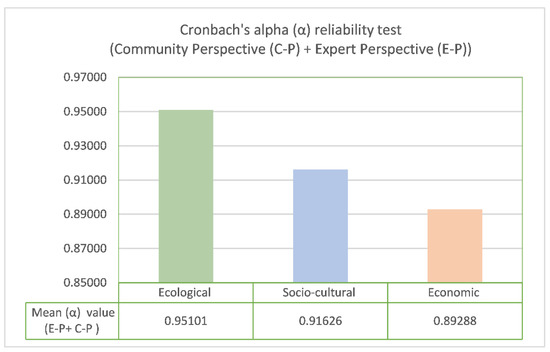
Figure 4.
Cronbach’s alpha reliability test. Source: Authors’ calculations, using survey data.
3. Results
3.1. Experts’ and Community Perspectives on Multiple Cross-Cutting Themes
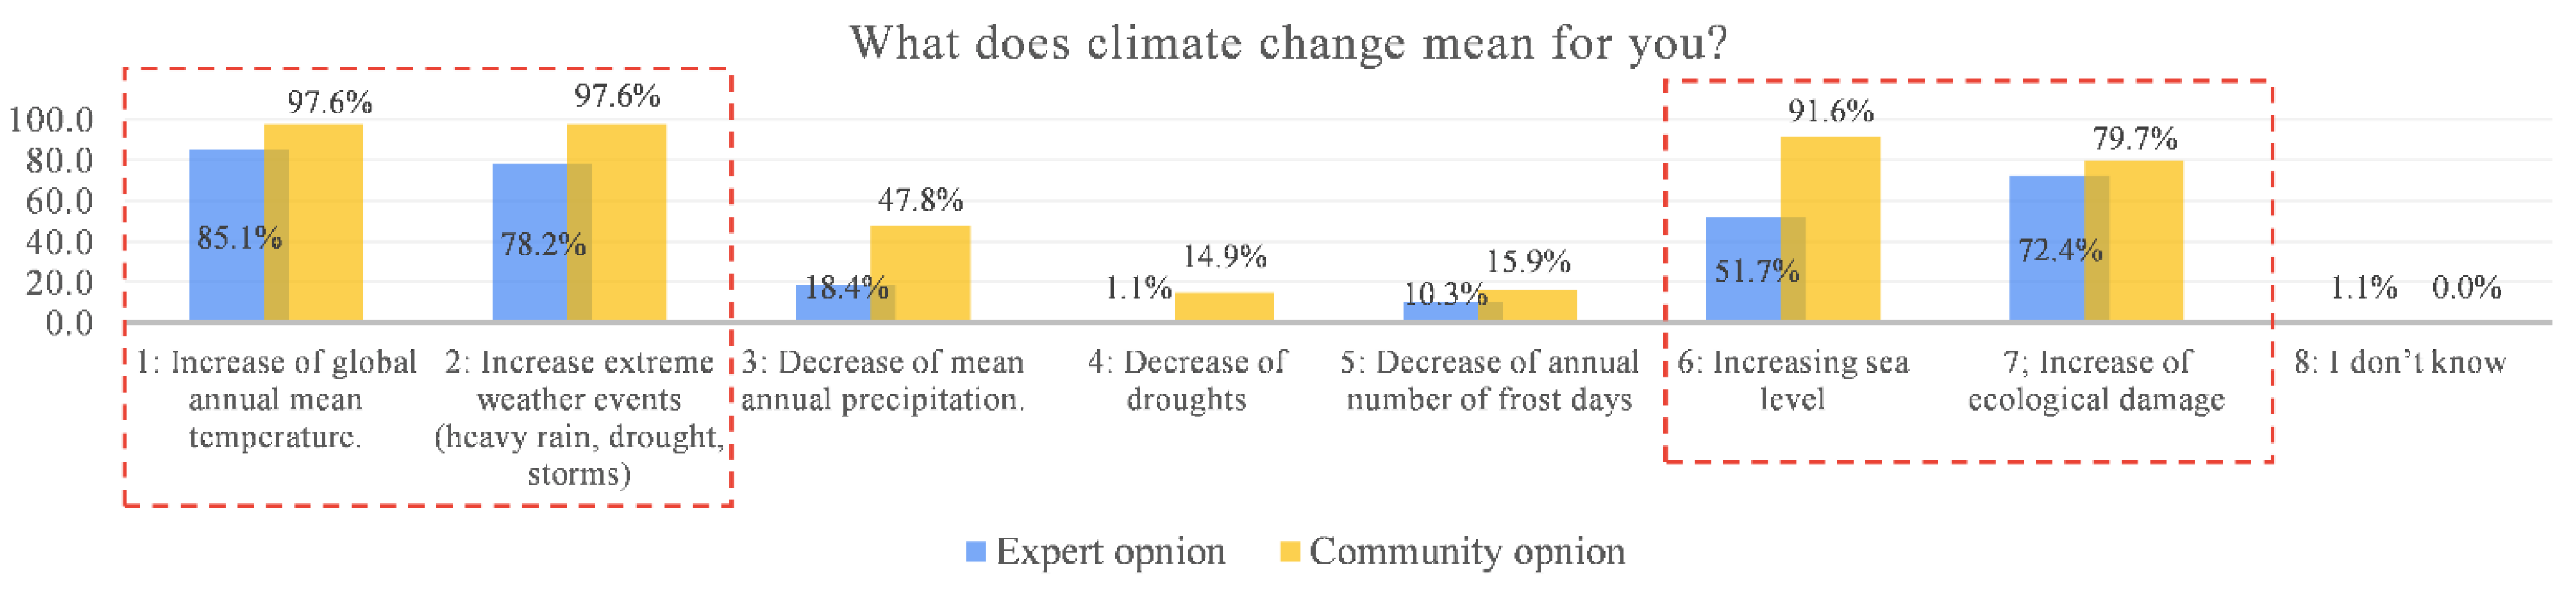
This section clarifies the knowledge, beliefs, attitudes, and preferences of the planning experts and community of the study area regarding their understanding of the definitions of climate change (CC), adaptations to CC, urban resilience, and UGI concepts in response to the questions posed (Appendix E). The results highlight that the planning experts agree that options one, two, and seven are more effective than options three and five, compared to the community’s preferences, with options one, two, six, and seven receiving a higher satisfaction approval vote (SAV) than options four and five (Figure 5). This shows the importance levels assigned by the experts and the community (and not the differences). The importance levels overlapped in most cases as both groups of stakeholders highlighted the importance of similar indicators. Hence, the overall outcome represents analogous options, such as option one, “increased global annual mean temperature”, option two, “increased extreme weather events”, and option seven, “increase in ecological damage”, scoring > 75% Vote of Confidence (VoC). However, option six, “an increasing sea level”, was not equally valued by both the groups (51.7% VoC by experts and 92.0% VoC by the community), yet a higher VoC regards it as an important variable. All these four possibilities can be perceived as a threshold level by which to define the notion of climate change in a native spatial environment.
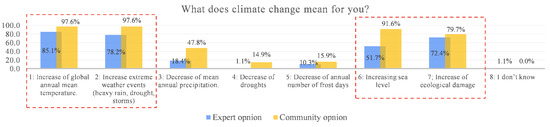
Figure 5.
Understandings of climate change (CC). Source: Authors’ calculations, using survey data.
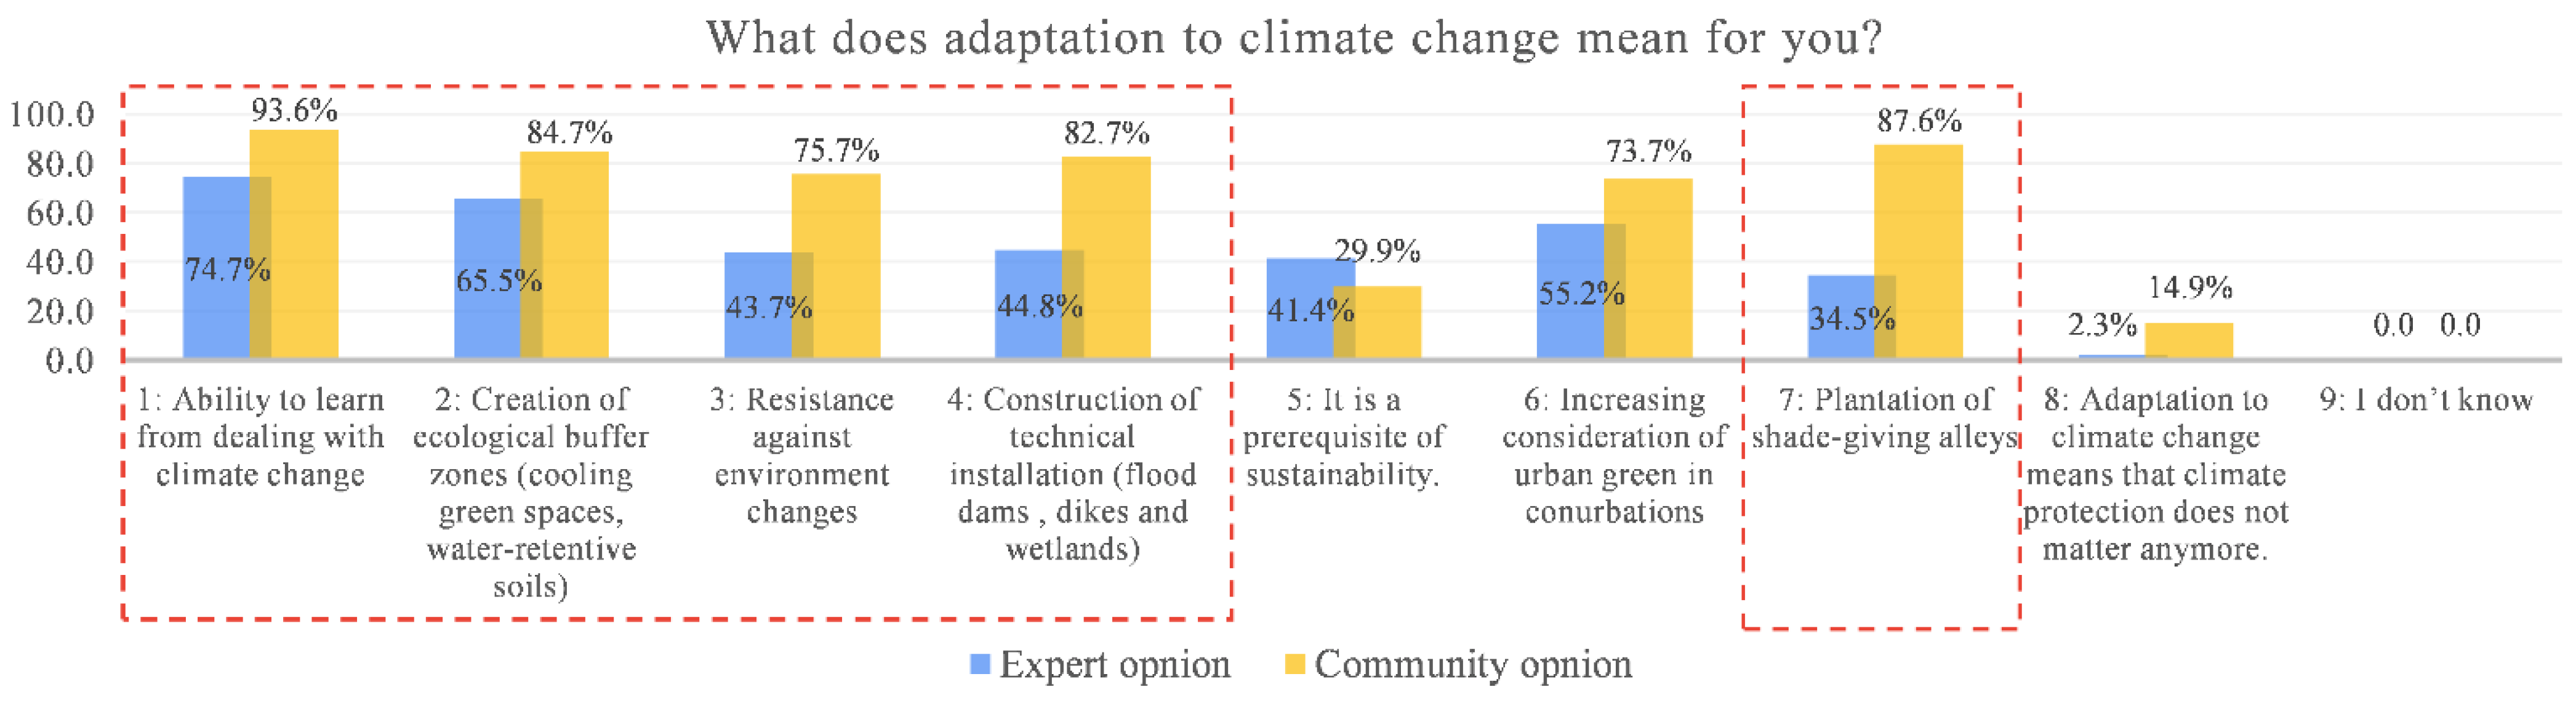
Similarly, the subsequent results examine climate change adaptation. The experts considered options one and two more effective, earning 74.7% and 65.5% VoC, respectively, whereas the local community endorsed options one, two, three, four, and seven as extremely important, giving a score of >75% SAV (Figure 6). Hence, to operationalize the “adaptation to climate change “concept in the local urban context, all these five variables remain vital to enhancing the adaptive capacity and building resilience against ever-rising environmental hazards, i.e., urban flooding, drought, etc., across urban regions. These five overlapping variables stress the need to promote an eco-friendly and climate-resilient environment.
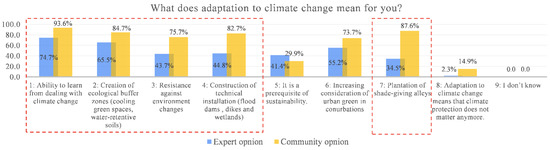
Figure 6.
Understanding adaptations to climate change (CC). Source: Authors’ calculations, using the survey data.
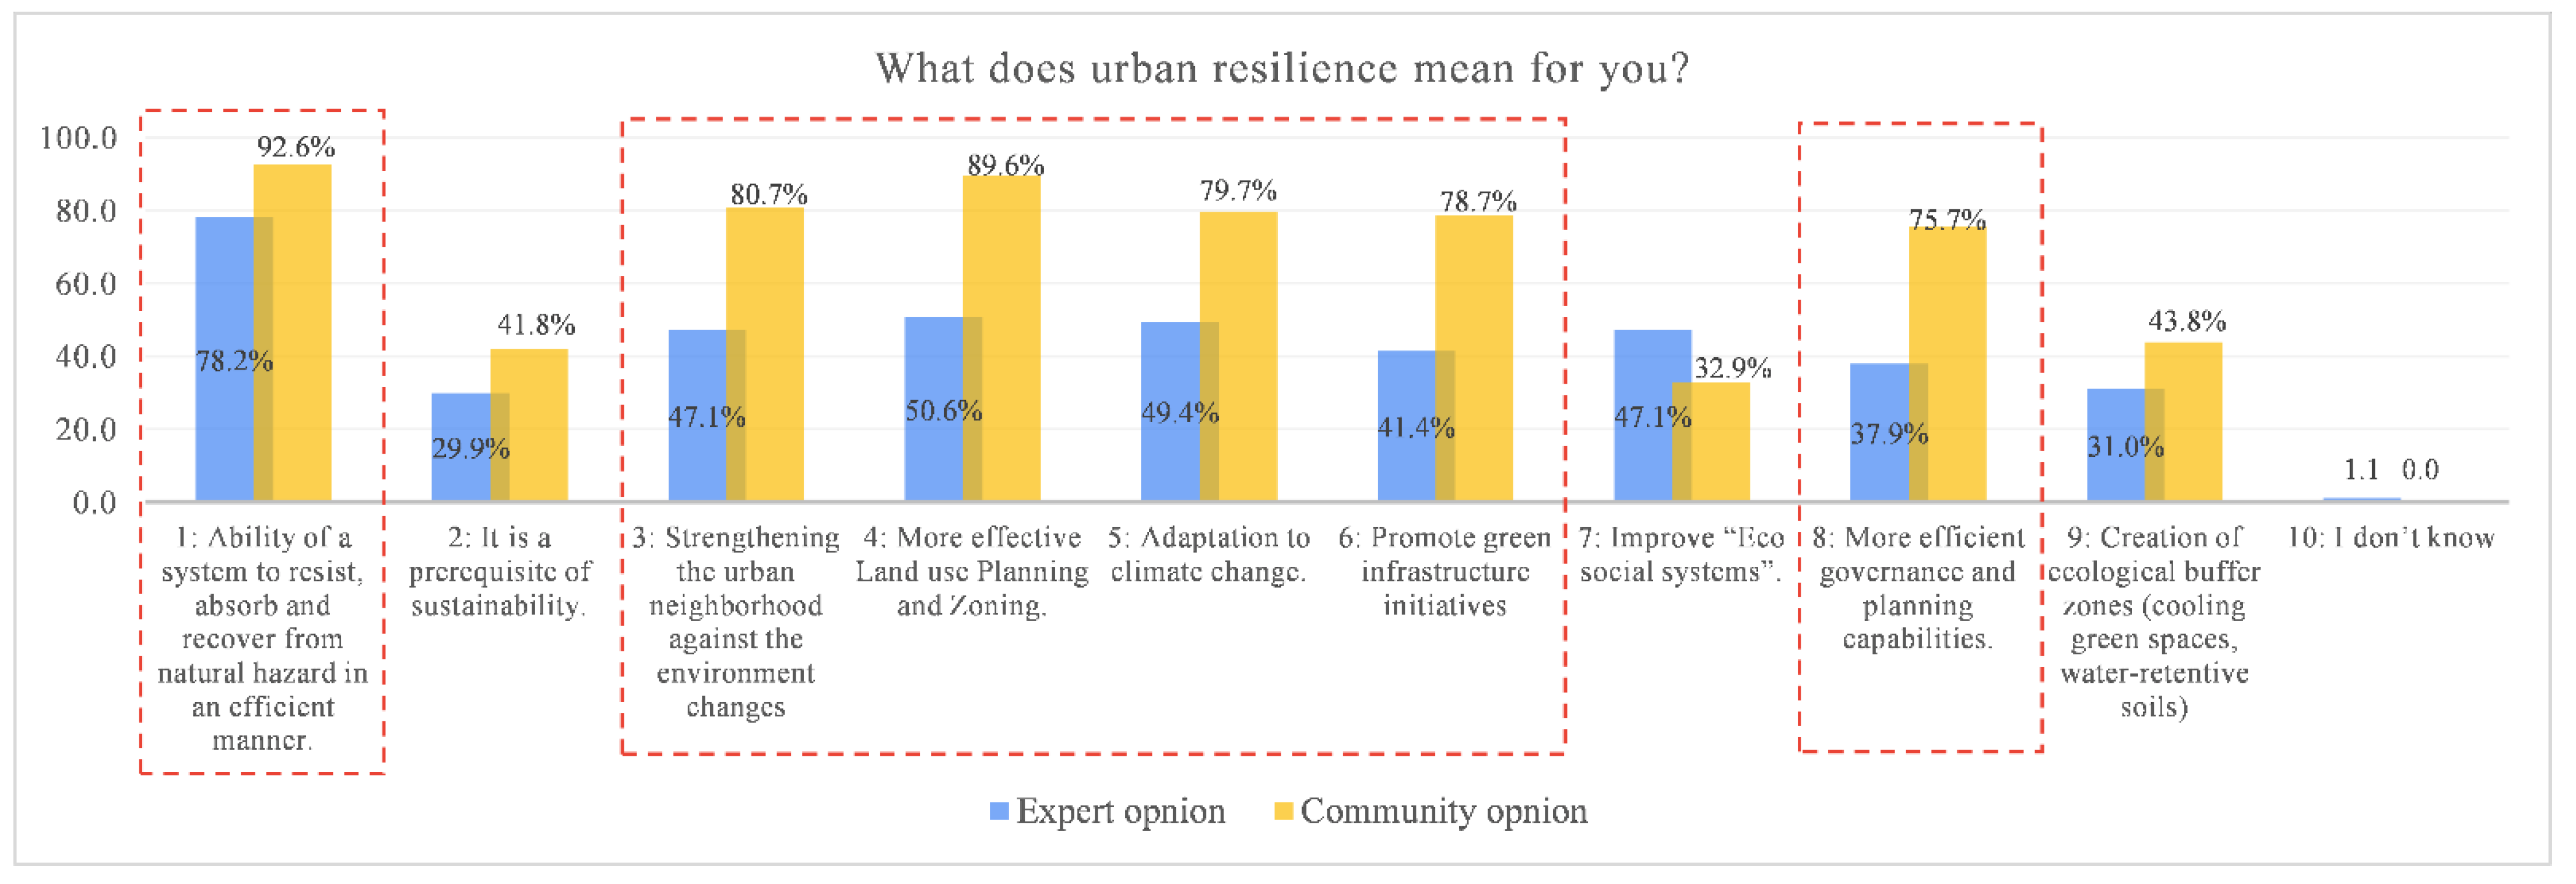
Further analysis elucidates the essence of urban resilience, which is established by understanding the local knowledge, characteristics, and attitudes regarding the potential possibilities. The community acknowledged that the main (¾) potential variables are one, three, four, five, six and eight (with high positive scores), while the experts endorsed option one (Figure 7). The trend shows that adaptation to CC depends mainly upon one’s ability to learn while dealing with climate change issues—adaptation to CC remains a subjective concept, yet it remains a necessity to encourage nature-based green infrastructure (NBGI) solutions by bolstering local mitigation/adaptation efforts.

Figure 7.
Defining urban resilience. Source: Authors’ calculations, using the survey data.
Further results provide an understanding of UG and show that three-quarters (75.9%) of the experts acknowledged option two to be a high-priority attribute, whereas other options (e.g., one, three, and fourteen) received >50% VoC. On the other hand, the local community also recognized option two as a highly significant attribute (80.7% SAV). The community also endorsed options three, eight, one, four, seven, nine, twelve, and thirteen, with a confidence level between 60% and 75% (Figure 8). Hence, the planning experts highlighted all the possible potential variables that impact more accurately, so these need to be incorporated when bridging the planning gaps. This will then assist government institutions in building NGBI approaches for sustainable human settlements in KP and beyond. Furthermore, to foster a holistic PP approach, all nine potential possibilities are given below (as endorsed by both planning experts and the community), arranged by level of importance, and can be viewed as a yardstick to define UGI, each according to the native spatial context, i.e.:
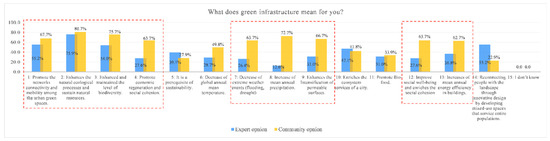
Figure 8.
Defining the urban green infrastructure (UGI). Source: Authors’ calculations, using the survey data.
Option 2: Enhancing the natural ecological processes and sustainability of resources.
Option 3: Enhancing and maintaining the level of biodiversity.
Option 8: Increases in annual mean precipitation.
Option 1: Promoting network connectivity and mobility among the urban green spaces.
Option 9: Enhancing the intensification of permeable surfaces.
Option 7: Decreases in extreme weather events (flooding, drought).
Option 12: Improving social well-being and enriching social cohesion.
Option 4: Promoting economic regeneration and social cohesion.
Option 13: Increases in the mean annual energy efficiency of buildings.
To summarize, the above results support: (a) the use of PP to endorse multiple optimal possibilities; (b) understandings of the notion of cross-cutting themes (e.g., CC, adaptation, urban resilience, and UGI) from the multi-stakeholder perspective; and c) acknowledging and encouraging community stewardship in the planning/decision-making process for NBGI initiatives. These steps can help to effectively tackle socio-environmental problems as a result of climate change. Such efforts can contribute to developing a richly multi-functional UGI indicator-based framework, grounded upon the “triple bottom line” of sustainability. Such a model can be adapted to the native spatial environment. This further contributes to strengthening the intricate reciprocity found among CC, UGI, UGS, and human health and well-being. This all contributes to climate-resilient and green-growth urban development.
3.2. RII and UGI Indicators for UGS Elements
The cumulative and empirical study findings are further clustered into three main groups. The first level focuses on the significance level of the twenty-two (primary and secondary) potential sustainable UGI indicators. The second level determines the importance level of each sustainability dimension (by summing up the average RII value of the sustainable indicators). The third and final level determines the vital taxonomy of UGS elements for enhancing the health of the respective UGI indicators, set against the constantly rising environmental threats to the urban interface of the KP region.
3.2.1. RII of Sustainable UGI Indicators (Experts and Community)
The first phase of this empirical study analyzes the collective responses of the experts and the community regarding the respective and potential UGI indicators (Table 4), which determines their significance and importance in the local environment. It then stimulates a holistic and effective MSPP approach to determining the importance of the UGI indicators. The results showed that nine UGI indicators were declared to be most important (M-Imp. (RII: 0.713–0.798)). Eleven indicators were declared important (Imp. level (RII: 0.802–0.890)) and only two indicators belonged to the extremely important (E-Imp.) category (Table 4). This demonstrates the level of satisfaction regarding the UGI indicators in terms of enhancing an eco-friendly environment in the studied area. These results also show that the native stakeholders rated the sustainability factor across ecological and economic dimensions as being most important, and the socio-cultural dimension as moderately important. Thus, this human–nature relationship highlights the value of using NBGI solutions to strengthen the natural environment so that its inhabitants can fight against climatic hazards.
3.2.2. RII of UGS Elements with UGI Indicators (Experts and Community)
Here, the perspectives of the experts and the community were integrated to understand the relationship between UGS elements and UGI indicators in the native built context. This identifies the vital taxonomy of UGS elements for each UGI indicator (Table 5b), which plays a key role in strengthening the quality of potential UGI indicators. The results illustrate that most UGS elements were weighted above their mid-point (Table 5a). The average RII was 0.37 to 0.94, showing that, at times of disaster, not all the green elements positively enhanced the efficacy of the UGI indicators. This is linked to the local spatial, contextual, and socio-demographic factors that differ from area to area. However, to reach a rational standpoint, the vital taxonomy of UGS elements was determined for each sustainable indicator (Table 5b). This reinforces the functional linkage and health of the respective UGI indicator. Moreover, it strengthens the potential resilience of sustainable indicators, enhances our scientific knowledge, and builds the capacity of government institutions to shape successful NBGI solutions. These solutions then help to alleviate the negative impact of environmental hazards and promote an eco-friendly environment in the region.
3.2.3. Vital Taxonomy of UGS Elements
These results present the vital taxonomy of the UGS elements and their functional interlinkage with specific UGI indicators (Table 5b). The IQR value varied between 0.57 and 0.83 (with avg./cut-off point = 0.77), which helped to identify the set of core taxonomy UGS elements (as marked in blue in Table 5a). Thus, top-down vs. bottom-up stakeholders’ perspectives emphasize that every individual UGS element has a distinctive quality and does not significantly improve the resilience of a specific UGI indicator, set against the anticipated environmental challenges in the native built context. Therefore, the effectiveness of green space structural attributes, in reality, depends on the eco-cultural and socio-environmental context of any region for which the PP approach, based on the integration of experts (i.e., policymakers, practitioners, and academicians) and the community, remains imperative. This deployment of the PP approach is necessary to understand the relationship between the respective UGS elements and the sustainable UGI indicators, leading to the development of a rich, multi-functional/inclusive/sustainable UGI indicator-based (framework) model, structured according to the local built environment. Such a composite indicator-based framework/model not only provides an opportunity to endorse and encourage the holistic representativeness of the MSPP approach in land-use planning but also contributes to the decision-making process for NBGI initiatives. Therefore, MSPP is recognized as the best tool for promoting community involvement to ensure green spaces. Green spaces and UGI will help to reduce urban vulnerability against the rising climatic hazards and will encourage reciprocity among CC, UGS, ESF, human health, and human well-being factors in urban settlements.
4. Discussion
This research is an effort toward acknowledging the native top-down (planning experts) and bottom-up (community) participatory approach—a pioneering step in developing a sustainable UGI indicator-based framework model regarding the issue of global climate change, thereby embedding it in the local context. Such a model connects local inhabitants and their perspectives with multi-functional urban green spaces. Studies into human behavior help to explain the NBGI techniques that naturally alleviate the high risk of environmental hazards [75,76] and promote urban sustainability [2]. This research inevitably opens new domains by which to incorporate indigenous/local knowledge to design an innovative, natural green landscape-based approach for climate change adaptation and mitigation. It can be used to identify, develop, and test the interlinkage between sustainable UGI indicators and green space (GS) elements. These elements can, then, be related to the native built contexts in areas such as the Peshawar, Mardan, and Charsadda districts of the province of KP, Pakistan.
This research study has deployed the multi-stakeholder engagement processes (MSEP) approach to engaging the stakeholders concerned (both experts and the community), which is otherwise less focused at the national level in Pakistan [36,61,77], than in the rest of the world [11,13]. The issue of low engagement in Pakistan has been linked to the community’s limited knowledge and awareness of climate change, as well as a lack of participatory approaches for NBGI initiatives [23,30,31,32,33]. This ongoing scenario has seen the deterioration of urban settlements, urban resilience, and urban functions in the face of the constantly rising climatic changes. These obstacles are also found to obstruct the successful transition of GAP. Therefore, developing such NBGI strategies (under SCRM) remains vital in KP areas that are not only highly unfortified against daunting climatic challenges [32,45,46] but also remain vulnerable due to their geographical location. Hence, pragmatic and proactive urban greening policies (UGP) and strategies for resilient land-use planning [4,6,37] are required in a situation where the expansion of urban functions continues to escalate [78,79].
As seen in the results of this study, this upcoming discussion also corresponds to the major findings of this research. The study enhances the scientific literature on the NBGI topic on building a safe, green, resilient urban region fortified against climate change in the province of KP. Hence, to keep momentum, the following discussion is organized as per the study’s three research questions.
In the first research question (“What are the main UGI indicators under MSEP?”), the study strove to explore and advance insight into the views of both the native planning experts (i.e., policymakers, practitioners, and academicians) and the community regarding the potential role of UGI. Furthermore, the green nature-based infrastructure proved to be a vital element in SCRM strategies and resilient land-use planning when tackling socio-environmental problems. The empirical study demonstrated here led to our identifying the significance of each respective and potential sustainable UGI indicator, in terms of their applicability and scale when building an eco-friendly urban environment in a developing country in general, and in KP in particular (Table 4). The results show that nine UGI indicators were declared as M-Imp, while the other eleven achieved an Imp level. In contrast, only two indicators belonged to the E-Imp category under MSPP. Furthermore, this study found that under the holistic MSPP approach, the ecological and economic dimensions of sustainability accrued a higher acceptance level than the socio-cultural dimensions. This demonstrates the importance level of each UGI indicator and sustainable dimension among the native multi-stakeholders in the built environment.
Moreover, the second research question (“What are the key UGS elements that can improve UGI resilience under SCRM?”) strives to develop a vital taxonomy of UGS elements for sustainable UGI indicators, to mitigate climate change challenges in native urban settings. Therefore, every UGS element was empirically examined against the individual UGI indicator, in order to establish a strong agreement among the MSEP regarding SCRM. The results illustrate a broad pattern of variation in the definitive list of selected vital green elements (Table 5b)—the most essential and foremost outcome of the examination. This confirms that every individual UGS element has a distinctive quality and does not significantly improve the resilience of a specific UGI indicator in the face of anticipated environmental challenges. Likewise, the global studies affirm that the effectiveness of the UGS element depends on the spatial contextual factors (eco-cultural and socio-environmental) of any region where they are examined [5,19,80]. However, to reach a rational standpoint, the vital taxonomy was determined of the key UGS elements (Table 5b) that perform a pivotal role in strengthening the resilience of respective UGI indicators in addressing SCRM.
In the third and final research question (“What is the sustainable UGI indicator-based model to build a climate-resilient city?”), this study revealed that under MSPP, the coexistence of UGI indicators with key UGS elements can lead to the development of an inclusive UGI indicator-based framework—the main target of this study. Such a UGI framework model can build an eco-regional paradigm that can ensure green-resilient cities in KP and beyond. Additionally, this type of model can strengthen the intricate reciprocity among climate resilience strategies, GS, ESF, and human health/well-being. This, in turn, will enable the local community to develop proactive and pragmatic ULGPs for land use. This will inevitably open up a new domain of study, to gradually delve more deeply into innovative MSPP approaches when planning NGLB techniques for climate change adaptation. Such green adaptations can bring a balance between anthropocentric and environmentally friendly activities at the urban interface of any area.
5. Conclusions and Policy Implications
The research study posits that the urban green infrastructure poses a potential natural solution to building an eco-friendly and green climate-resilient city-state. Its aims are to reconnect inhabitants with nature, enhancing their knowledge of the multi-functional green infrastructure to build a new sustainable cultural paradigm that in turn supports green urban growth in the KP province of Pakistan. The projection of this green and resilient urban development is achieved by integrating a two-way sustainable development path that is top-down and bottom-up—presenting a more participatory and innovative approach. It has been established that local context influences the values and beliefs of both the native inhabitants and the planning experts. Additionally, a nature-based green infrastructure (NBGI), once it builds on the local realities, holds greater influence in addressing the attitudes and preferences of those same local stakeholders, both experts and members of the community. Hence, such a holistic participatory approach remains effective and pragmatic in building a taxonomy of UGS elements. It is unique, as it develops a relationship with the respective sustainable UGI indicators in the local built environment, wherein the development of an inclusive and sustainable UGI indicator-based framework/model embeds the local context. It has the potential to meet the standards and requirements of a green climate-resilient city-state under ULGP, in KP and beyond. It can further be established that a local, context-based model potentially modifies the sustainable UGI indicators for building the model, and comprehensively connects that model with multiple green elements to reshape urban land-use planning, ensuring a resilient city-state.
The establishment of a safe, eco-friendly, and resilient city-state halts damage to the country’s natural green barriers, the depletion of UGS, and the greying of the natural landscape, which lead to catastrophes of various scales and impacts. Thus, UGS planning stands as a nature-based climate adaptation strategy that improves the multifunctionality and connectivity of green space networks. This stirs up and fosters ecosystem resilience, encourages biodiversity conversations, and ensures inhabitants’ health as well as their well-being as they perceive it. Empowering the public via sustainable and resilient urban development plans supports the government in its efficient implementation of green action reform (GAR) programs, which also promote community cohesion in terms of UGS. This study bridges the planning gaps among the native multi-stakeholders by introducing a triple bottom line for sustainability. The debate is about developing proactive and pragmatic long-term urban greening policies (UGP) and strategies, to remodel and restructure land-use planning for sustainable human settlements. All in all, a sustainable UGI indicator-based framework/model can foster the NBGI approach, which is required to facilitate long-term sustainable climate-risk management (SCRM) in KP, Pakistan, and other regions.
This study presents a policy implication that can be drawn from this empirical investigation: there is a dire need to bolster MSPP in the urban landscape and urban greening (ULUG) policymaking and strategy implementation for resilient land-use planning. The MSPP is an effective tool that encourages and promotes a sense of community stewardship in the planning/decision-making process for NBGI initiatives, to build an eco-friendly and climate-resilient urban environment in environmentally challenged urban regions. Such an approach contributes to increasing scientific research knowledge and awareness among all the native stakeholders (three-tier groups, comprising decision-makers, experts, and the local community), moving toward a better understanding of GI planning and presenting a sustainable, cost-efficient, and innovative green nature-based climate adaptation/mitigation strategy for sponge and/or green cities.
Author Contributions
Conceptualization, M.R.; data curation: M.R.; methodology, M.R, D.G. and U.K.; software, M.R.; formal analysis, M.R.; validation.; M.R., D.G. and U.K.; writing—original draft preparation, M.R.; writing—review and editing, M.R., D.G. and U.K.; supervision, D.G. and U.K. All authors have read and agreed to the published version of the manuscript.
Funding
This research was funded by the Deutscher Akademischer Austauschdienst (DAAD), Government of Germany, grant number 57381412. TU-Dortmund University, Germany, funded the article processing charges (APCs).
Institutional Review Board Statement
This research study was conducted according to the guidelines of the Declaration of Helsinki. Ethical review and approval at any stage were waived for this study, due to the reason that no sensitive/personal information (e.g., names, contact details, codes, etc.) were sought/gathered during data collection or at any stage of this research. This research study and the questions asked were limited to context-based questions, to generate knowledge about the role of Urban Green Infrastructure (UGI) in planning for climate-resilient cities. The responses were generalized to draw meaningful context-based results.
Informed Consent Statement
Informed verbal consent was obtained in advance from all subjects involved in the study.
Data Availability Statement
This study contains all the data generated or analyzed during the study.
Acknowledgments
The author expresses his deep gratitude to the Deutscher Akademischer Austauschdienst (DAAD), Government of Germany, for the financial support under the Ph.D. research grant, Ref: funding programme/-ID: Forschungsstipendien—Promotionen in Deutschland, 2018/19 (57381412) for doctoral studies in Germany. Other than DAAD, the authors are grateful to TU-Dortmund University for paying APC, which helped in the speedy publication of the research findings. Moreover, I would like to thank the experts/policymakers of planning institutions in Pakistan for their valuable information and assistance in executing the planning experts’ survey. I am also indebted to my brother Muneeb Khan, who offered valuable support in the community data collection during these challenging times of COVID-19. To conclude, I would like to extend my gratitude to Fawad Akthar, Zeeshan Khan, and Imran Khan, for their time and cooperation during the household field survey in the Peshawar, Mardan, and Charsadda districts, KP province.
Conflicts of Interest
The authors have no conflict of interest to declare.
Appendix A. Potential Urban Green Infrastructure (UGI) Indicator-Based Framework
Table A1.
Proposed UGI indicators, inter-linked with multiple GI elements and technologies.
Table A1.
Proposed UGI indicators, inter-linked with multiple GI elements and technologies.
| This Section Encompassed Questions with the Aim of Identifying UGI Indicators, Interlinked with Multiple GI Elements and Technologies for Resilient Land-Use Planning. Indicators Are Classified According to the “Triple Bottom Line” of Sustainability, Which Highlights the Importance of the Natural and Manmade Environment in Land-Use Planning. | ||||||||||||
|---|---|---|---|---|---|---|---|---|---|---|---|---|
| Categories | Green Infrastructure Indicators | Reference | Green Infrastructure Elements and Technologies. | |||||||||
| Please Rate Your Opinion between 1 and 10 on the Likert Scale. 1. Highly Insignificant, 2. Slightly Insignificant, 3. Moderately Insignificant. 4. Insignificant, 5. Neutral, 6. Not Sure, 7. Slightly Significant, 8. Moderately Significant, 9. Significant, 10. Highly Significant | ||||||||||||
| GI 1 | GI 2 | GI 3 | GI 4 | GI 5 | GI 6 | GI 7 | GI 8 | GI 9 | GI 10 | |||
| Ecological | 1. Optimizing storm-water management | |||||||||||
| Increasing pervious surfaces. | Green infrastructure is suitable for handling rainfall. (Buishand, 2007), [81] Increased rainwater retention and flooding. (Wise et al., 2010, [82] | |||||||||||
| Minimizing, retaining and organically purifying rainwater runoff. | ||||||||||||
| 2. Reducing the urban heat island effect | ||||||||||||
| Increasing the percentage of green surfaces. | Lowering the mean radiant temperature via trees and other plants. (Jacobs et al., 2015), [83] | |||||||||||
| Applying evaporative materials on roof, walls and ground surfaces. | ||||||||||||
| 3. Air quality improvement (e.g., pollutant removal, altering wind flow) | ||||||||||||
| Implementing green impermeable screens in a street canyon and planting a higher concentration of green trees. | (Nowak et al., 2006 and Yang et al., 2008), [84,85] Green screens reduce air pollution in urban environments. (Pugh et al., 2012; Wise et al., 2010), [82,86] | |||||||||||
| 4. Noise quality improvement | ||||||||||||
| Applying a green sound barrier for limited and higher noise reductions (i.e., for limiting noise, thick hedges with a small piece of grassland can be provided and for higher noise, broadleaved deciduous trees and a thick border of bamboo can be provided). | Dense vegetation structures reduce noise intensity. (Samara and Tsitsoni, 2011), [87] Limited noise reduction. (Van Renterghem et al., 2014) [88] | |||||||||||
| 5. Reduced carbon emissions (e.g., avoiding greenhouse gas emission through cooling) | ||||||||||||
| Planting a higher concentration of trees for shade and using evaporating material for hard landscaping. | Urban green spaces lower emissions. (Weilenmann et al., 2005) [89] | |||||||||||
| 6. Improve energy efficiency in buildings | ||||||||||||
| Optimize green energy0saving techniques. | Green roofs improve building energy consumption. (Mentens, 2006; Akbari and Taha, 1992), [90,91] | |||||||||||
| 7. Enhanced soil quality and erosion. | ||||||||||||
| Intensification of permeable surfaces and optimization of soil stability. | (McKinney, 2006), [92] | |||||||||||
| 8. Enhance and protect urban biodiversity | ||||||||||||
| Promote the connectivity and mobility between urban green spaces. | Biodiversity is the baseline component in GI planning. (Weber et al., 2006), [93] Promoting conservation. (Adam,1994), [94] | |||||||||||
| Socio-cultural | 1. Food production (e.g., urban agriculture, kitchen gardens, and community gardens) | Gardening offers relief from work stress. (Hartig et al.,2014), [95] Introducing urban food forestry. (Clark and Nicholas, 2013), [96] | ||||||||||
| 2. Improving social well-being. | ||||||||||||
| Optimizing the opportunities for recreation and social interaction and enhancing the attractiveness of the city. | Green spaces should be close to residences and enhance city attractiveness. (Giles-Corti et al., 2005), [97] Taking ownership of green spaces. (Weldon et al., 2007), [98] | |||||||||||
| Enhanced attractiveness of the city (diverse landscape features). | ||||||||||||
| 3. Improving physical and mental well-being (i.e., visual and physical access to green spaces have a positive relationship with stress reduction and anxiety). | Green exercise is more psychologically beneficial. (Pretty et al., 2005, Bratman et al., 2015), [99,100] Neighborhoods living with a higher density of trees (Kardan et al., 2017), [101] | |||||||||||
| 4. The provision of outdoor sites for education and research. | (McDonnell et al.,2008), [102] | |||||||||||
| 5. Improving accessibility and connectivity to encourage cycling and walking opportunities. | People walk 20% more in green spaces. (De Vries et al., 2010), [103] | |||||||||||
| Economic indicators | 1. Amplified property values. | (Shoup and Ewing 2010), [104] | ||||||||||
| 2. Savings in healthcare cost. | (Shoup and Ewing 2010), [104] | |||||||||||
| 3. Reduced energy consumption (e.g., cooling and heating demands). | (Weilenmann et al., 2005) (Mentens, 2006, Akbari and Taha, 1992), [89,90,91] | |||||||||||
| 4. Reduced risk of flood damage. | (Gordon-Walker et al., 2007; Wise et al., 2010). [82,105] | |||||||||||
| 5. Reducing private car use by increased walking and cycling (e.g., shifting travel mode). | (McPherson and Muchnick, 2005; De Vries et al., 2010), [103,106] | |||||||||||
| 6. Value of air pollutant removal/ avoidance. | (Pugh et al., 2012; Wise et al., 2010), [82,86] | |||||||||||
Keys: (GI 1: Community Garden; GI 2 = Botanical Garden; GI 3 = Urban and pocket park; GI 4 = Forest; GI 5 = Green streets and alleys; GI 6 = Rain Garden/bio-infiltration, planter box and bioswale; GI 7 = Green parking lot and permeable pavements; G8 = Wetland/land conversation; GI 9 = Intensive/extensive green roof and vertical green wall; GI 10 = Horticultural areas, arable land, and tree meadows). Source. Authors’ own elaboration [38].
Appendix B. Development of Conceptual Base Frameworks
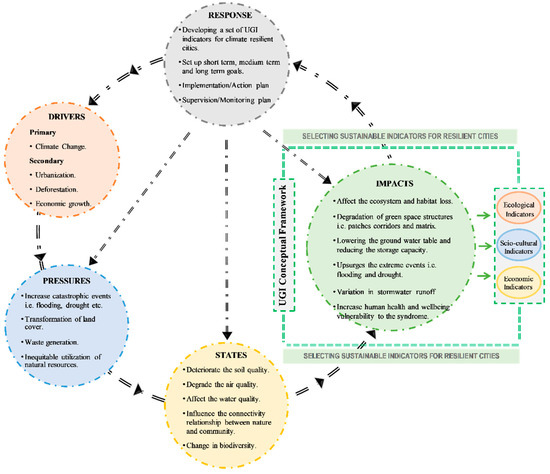
Figure A1.
Relationship among the anthropogenic activities and UGI for resilient cities. Source: Authors’ own elaboration [38].
Figure A1.
Relationship among the anthropogenic activities and UGI for resilient cities. Source: Authors’ own elaboration [38].
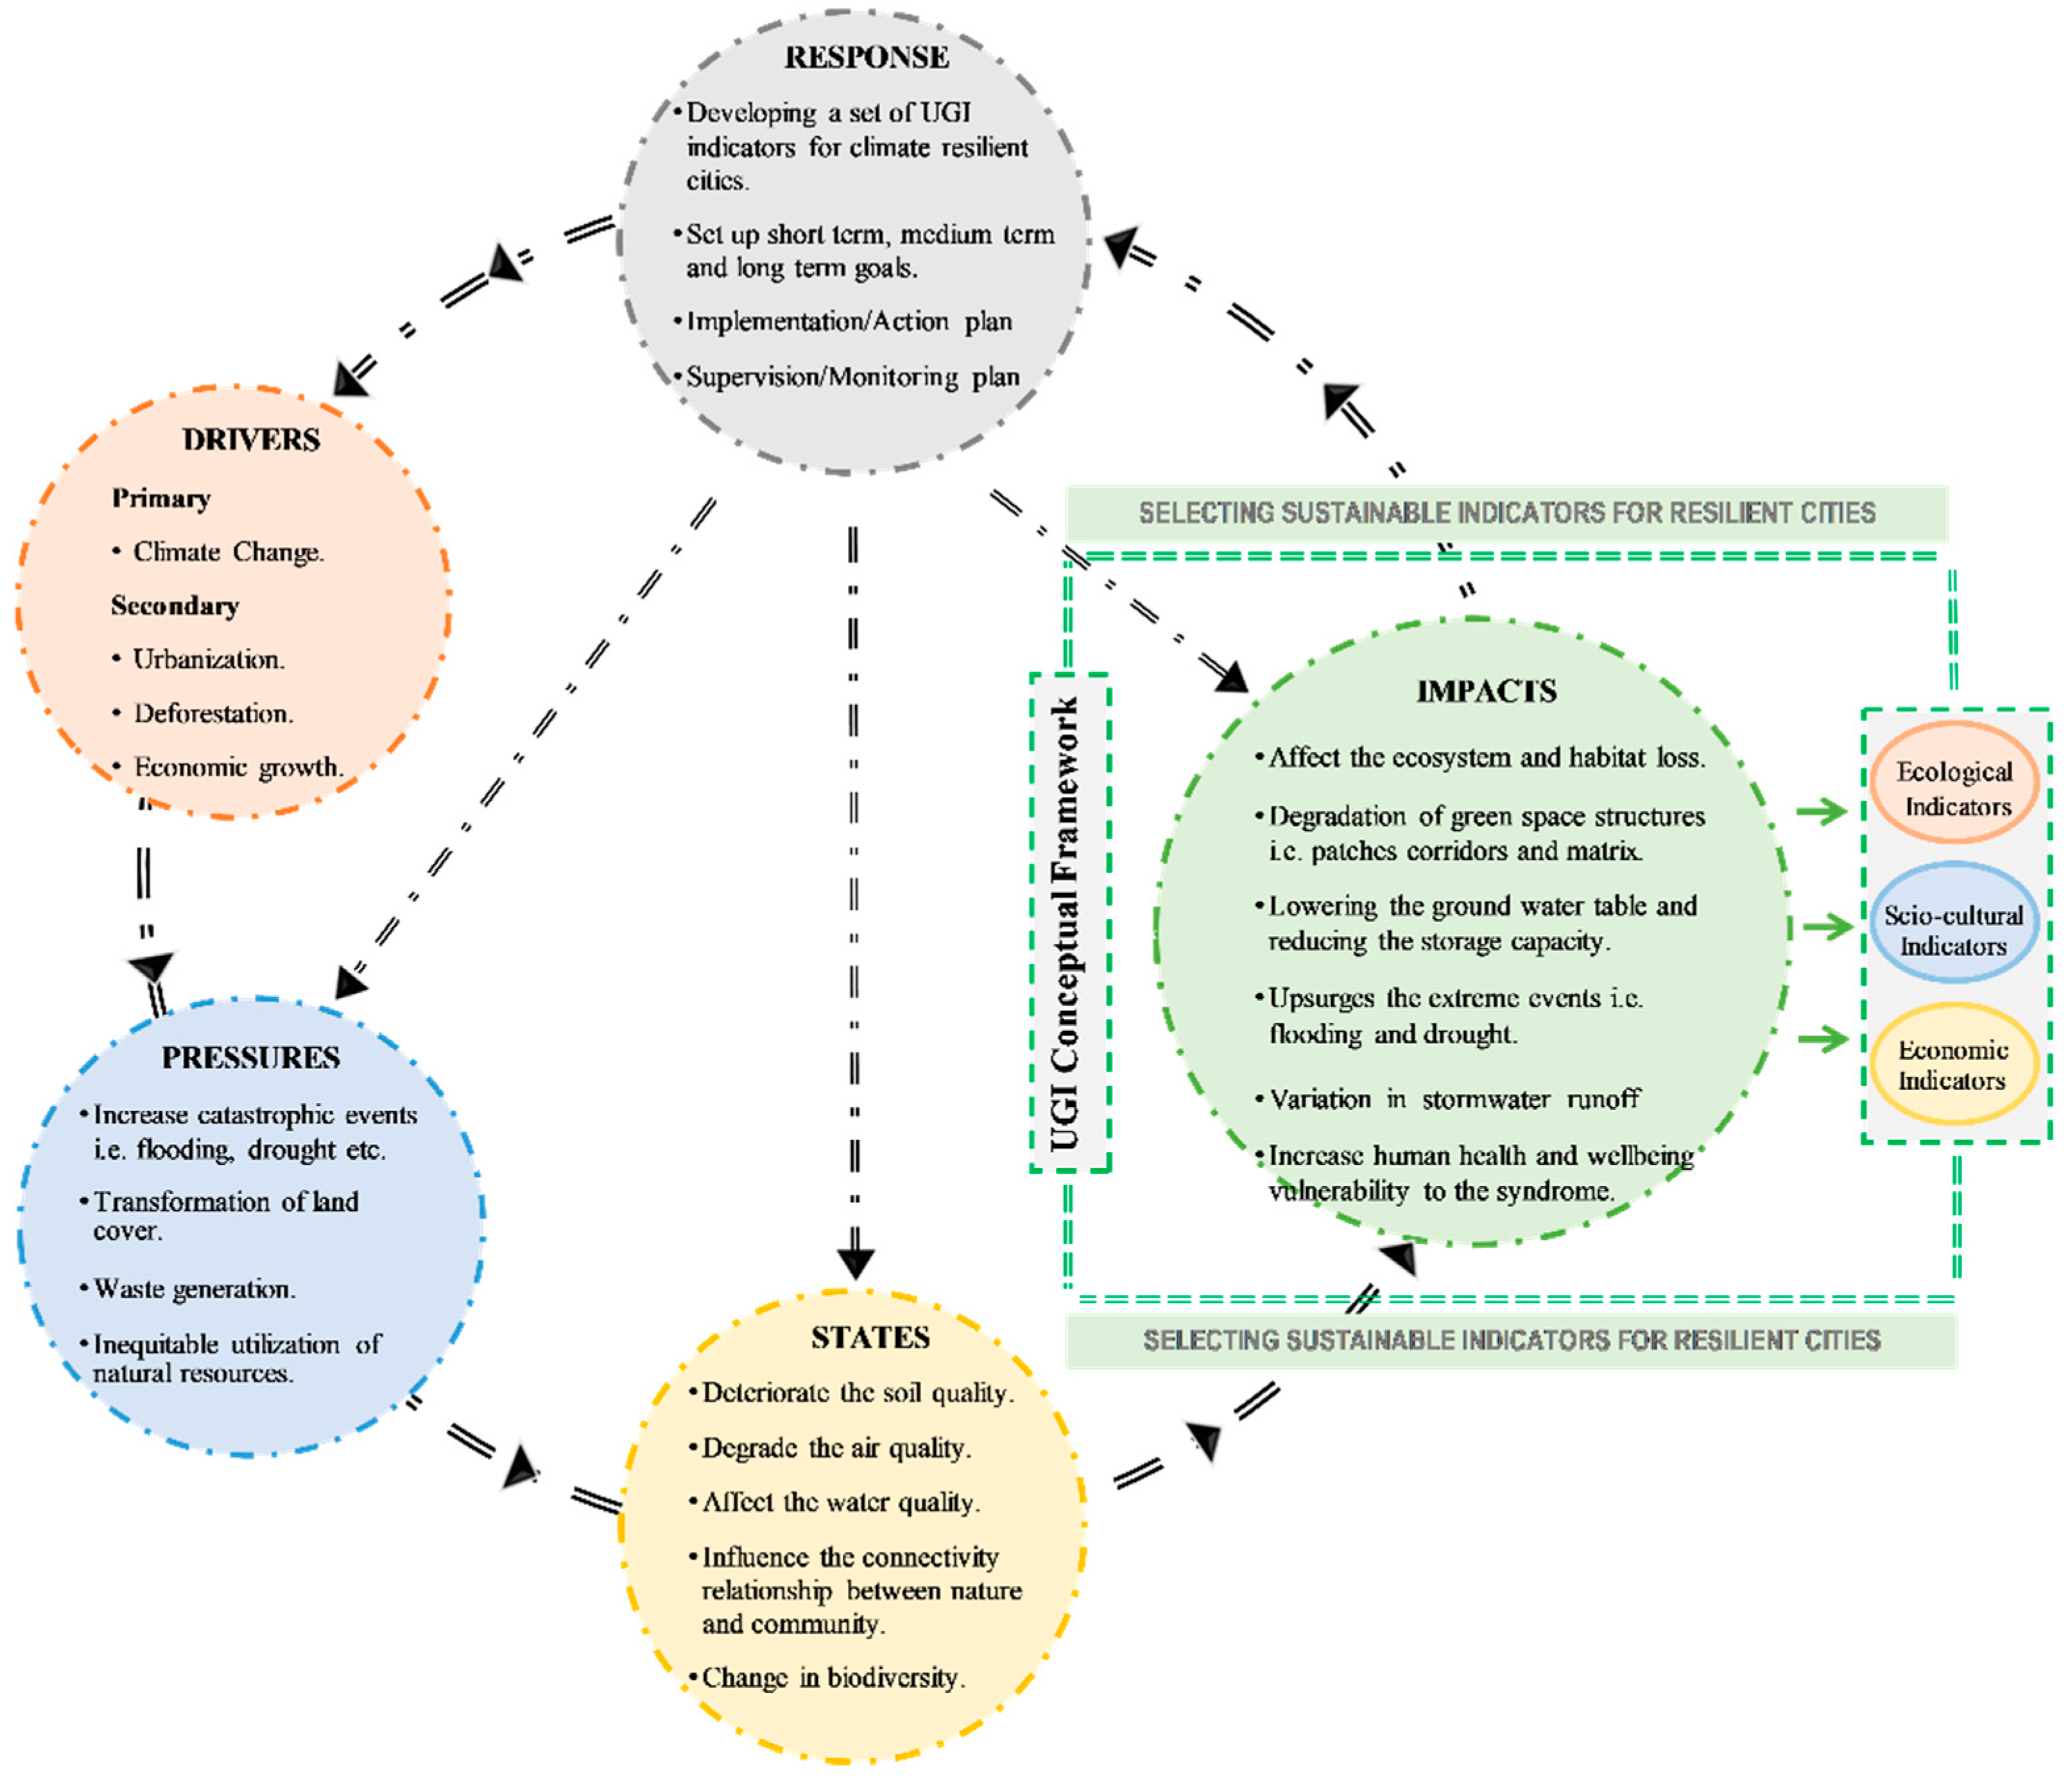
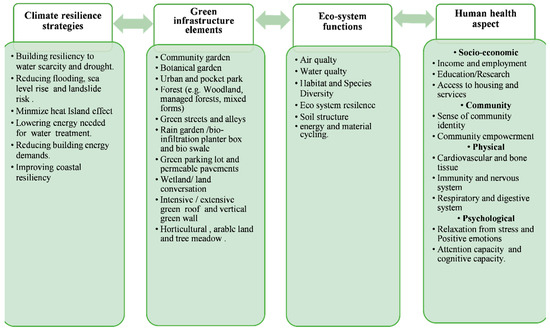
Figure A2.
Conceptual base model: climate resilience strategies, ecosystem functions, human well-being, and GI elements. Source: Authors’ own elaboration [38].
Figure A2.
Conceptual base model: climate resilience strategies, ecosystem functions, human well-being, and GI elements. Source: Authors’ own elaboration [38].
Appendix C
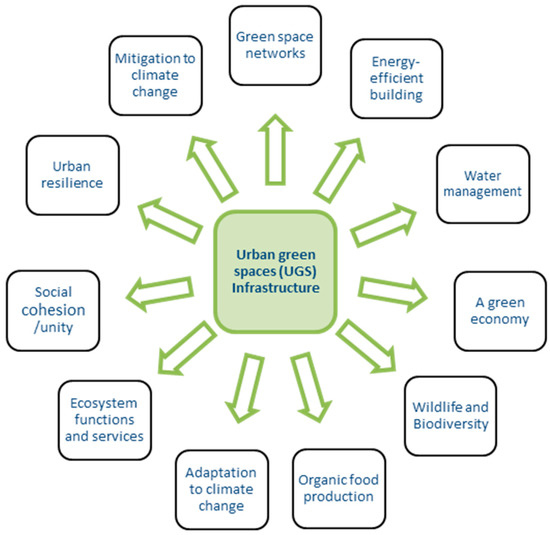
Figure A3.
List of concepts evolved from the semi-structured meetings with native experts. Source: Authors’ own elaboration.
Figure A3.
List of concepts evolved from the semi-structured meetings with native experts. Source: Authors’ own elaboration.
Appendix D
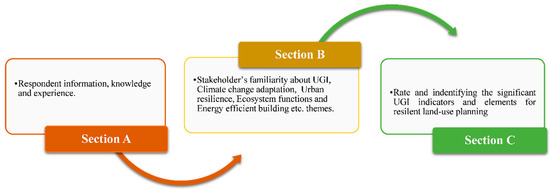
Figure A4.
Hierarchical sections of an in-depth (expert and community) questionnaire survey. Source: Authors’ own elaboration [20].
Figure A4.
Hierarchical sections of an in-depth (expert and community) questionnaire survey. Source: Authors’ own elaboration [20].

Appendix E
Verifying and validating the local multi-stakeholder (planning experts and community members) perspective, knowledge, beliefs, attitudes, and preferences on the proposed potential possibilities and definitions of the UGI, urban resilience, climate change, and adaptations.
The following four questions appeared in section B of the community-based empirical survey and expert-based perception survey, defining the notion of the aforementioned themes, depending on the native spatial context.
- “What does climate change mean for you”?
- “What does adaptation to climate change mean for you”?
- “What does urban resilience mean for you”?
- “What does green infrastructure mean for you”?
Appendix F
Table A2.
Sample size for the community survey.
Table A2.
Sample size for the community survey.
| District | Tehsil (Selection Based on a High Urban Population) | Tehsil Population | Union Council Population (Selection Based on a High Urban Population with the Integration of the Interquartile Range Technique (IQR) | Sample size Population with 95 CI and + 5 Margins of Error | Average HH Size (Source: KP Bureau of Statistics) | HH Sample 399.6/6.2 399.5/7 339.7/5.6 |
|---|---|---|---|---|---|---|
| Mardan | Mardan | 1,403,394 | 411,148 | 399.6 | 6.2 | 64 |
| Charsadda | Charsadda | 804,194 | 350,483 | 399.5 | 7 | 57 |
| Peshawar | Town3 | 8,210,59 | 575,409 | 399.7 | 5.6 | 71 |
Source: Authors’ own elaboration [77], compilation from the KP Bureau of Statistics (2018) [107].
References
- EC-European Commission. Towards an EU Research and Innovation Policy Agenda for Nature-Based Solutions & Re-Naturing Cities, Final Report of the Horizon 2020 Expert Group on Nature-Based Solutions and Re-Naturing Cities; European Commission: Brussels, Belgium, 2015. [Google Scholar]
- European Union. Green Infrastructure (GI)–Enhancing Europe’s Natural Capital; European Commission: Brussels, Belgium, 2013. [Google Scholar]
- Mazza, L.; Bennett, G.; De Nocker, L.; van Diggelen, R. Green Infrastructure Implementation and Efficiency; Final Report for the European Commission, DG Environment on Contract ENV.B.2/SER/2010/0059; Institute for European Environmental Policy: Brussels, Belgium, 2011. [Google Scholar]
- Matthews, T.; Lo, A.Y.; Byrne, J.A. Reconceptualizing green infrastructure for climate change adaptation: Barriers to adoption and drivers for uptake by spatial planners. Landsc. Urban Plan. 2015, 138, 155–163. [Google Scholar] [CrossRef]
- USEPA. Green Infrastructure Case Studies: Municipal Policies for Managing Stormwater with Green Infrastructure; EPA (USA): Washington, DC, USA, 2010.
- Ahern, J. Green infrastructure for cities: The spatial dimension. In Cities of the Future: Towards Integrated Sustainable Water and Landscape Management; IWA Publishing: London, UK; Citeseer: Princeton, NJ, USA, 2007. [Google Scholar]
- IPCC. Managing the Risks of Extreme Events and Disasters to Advance Climate Change Adaptation Special, Managing the Risks of Extreme Events and Disasters to Advance Climate Change Adaptation: Special Report of the Intergovernmental Panel on Climate Change; Cambridge University Press: Cambridge, UK, 2012. [Google Scholar] [CrossRef] [Green Version]
- IPCC. Climate Change: Impacts, Adaptation and Vulnerability; Cambridge University Press: Cambridge, UK, 2014. [Google Scholar] [CrossRef] [Green Version]
- Desa, U.N. World Urbanization Prospects, the 2011 Revision, Population Division; Department of Economic and Social Affairs, United Nations Secretariat: New York City, NY, USA, 2014. [Google Scholar]
- Desa, U.N. World Urbanization Prospects 2018: Highlights (ST/ESA/SER. A/421)2019’; United Nations: New York City, NY, USA, 2019. [Google Scholar]
- Mell, I.; Allin, S.; Reimer, M.; Wilker, J. Strategic Green Infrastructure Planning in Germany and the UK: A Transnational Evaluation of the Evolution of Urban Greening Policy and Practice. Int. Plan. Studies. 2017, 22, 333–349. [Google Scholar] [CrossRef] [Green Version]
- Lafortezza, R.; Davies, C.; Sanesi, G.; Konijnendijk, C.C. Green Infrastructure as a tool to support spatial planning in European urban regions. Ifor.-Biogeosci. For. SISEF-Ital. Soc. Silvic. For. 2013, 6, 102–108. [Google Scholar] [CrossRef] [Green Version]
- Monteiro, R.; Ferreira, J.C. Green Infrastructure Planning as a Climate Change and Risk Adaptation Tool in Coastal Urban Areas. J. Coast. Res. 2020, 95, 889–893. [Google Scholar] [CrossRef]
- TEP. Advancing the Delivery of Green Infrastructure: Targeting Issues in England’s NorthWest; The Environment Partnership: Helston, UK, 2005. [Google Scholar]
- Benedict, M.A.; McMahon, E.T. Green Infrastructure: Linking Landscapes and Communities, Urban Land; Island Press: Washington, DC, USA, 2006. [Google Scholar]
- MacFarlane, R.; Davies, C.; Roe, M. Green Infrastructure and the City Regions, Discussion Paper; NECF: Dunston, UK, 2005. [Google Scholar]
- Davies, C.; Macfarlane, R.; Mcgloin, C.; Roe, M. Green Infrastructure Planning Guide, Project: Final Report; WWF: Gland, Switzerland, 2006. [Google Scholar]
- Weber, T.C.; Allen, W.L. Beyond On-Site Mitigation: An Integrated, Multi-Scale Approach to Environmental Mitigation and Stewardship for Transportation Projects, Landscape and Urban Planning; Elsevier: Amsterdam, The Netherlands, 2010. [Google Scholar]
- Gill, S.E.; Handley, J.F.; Ennos, A.R.; Pauleit, S. Adapting cities for climate change: The role of the green infrastructure. Built Environ. 2007, 33, 115–133. [Google Scholar] [CrossRef] [Green Version]
- Rayan, M.; Gruehn, D.; Khayyam, U. Green infrastructure indicators to plan resilient urban settlements in Pakistan: Local stakeholder’s perspective. Urban Clim. 2021, 38, 100899. [Google Scholar] [CrossRef]
- Naeem, S.; Cao, C.; Fatima, K.; Najmuddin, O.; Acharya, B.K. Landscape greening policies-based land use/land cover simulation for Beijing and Islamabad-An implication of sustainable urban ecosystems. Sustainability 2018, 10, 1049. [Google Scholar] [CrossRef] [Green Version]
- Waseem, S.; Khayyam, U. Loss of vegetative cover and increased land surface temperature: A case study of Islamabad, Pakistan. J. Clean. Prod. 2019, 234, 972–983. [Google Scholar] [CrossRef]
- Khayyam, U.; Waseem, S. Carbon emission as a result of forest land change in Islamabad, Pakistan. In Climate Change Science; Elsevier: Amsterdam, The Netherlands, 2021; pp. 41–57. [Google Scholar]
- Greiving, S.; Fleischhauer, M. Climate resilience and environmental justice: State of research and implementation in planning practice in Germany and beyond. Town Plan. Rev. 2022, 93, 111–137. [Google Scholar] [CrossRef]
- Kuhlicke, C.; Albert, C.; Bachmann, D.; Birkmann, J.; Borchardt, D.; Fekete, A.; Greiving, S.; Hartmann, T.; Hansjürgens, B.; Jüpner, R.; et al. Five Principles for Climate-Proof Municipalities and Cities. 2021. Available online: https://www.ufz.de/index.php?en=48382 (accessed on 3 June 2022).
- Greiving, S. Resilience/Robustness. 2018. Available online: https://nbn-resolving.org/urn:nbn:de:0156-559919109 (accessed on 3 June 2022).
- Greiving, S. Spatial planning and dealing with uncertainties associated with future disasters. In Spatial Planning and Resilience Following Disasters: International and Comparative Perspectives; Policy Press: Bristol, UK, 2016; p. 321. [Google Scholar]
- Baycan-Levent, T.; Van Leeuwen, E.; Rodenburg, C.; Nijkamp, P. Development and management of green spaces in European cities: A comparative analysis. Res. Memo. 2002, 2002, 25. [Google Scholar]
- CABE. Community-Led Spaces: A Guide for Local Authorities and Community Groups; CABE Space: London, UK, 2010. [Google Scholar]
- Davidson, S. Spinning the wheel of empowerment. Planning 1998, 1262, 14–15. [Google Scholar]
- Harnik, P. The excellent city park system: What makes it great and how to get there. In The Human Metropolis: People and Nature in the 21st-Century City; University of Massachusetts: Amherst, MA, USA, 2006. [Google Scholar]
- Kim, T.-B. Collaborative Governance for Sustainable Development in Urban Planning in South Korea; University of Birmingham: Birmingham, UK, 2010. [Google Scholar]
- Enger, S.C. Planning for Parks, Recreation, and Open Space in Your Community; Washington State Department of Community, Trade and Economic Development: Washington, DC, USA, 2005. [Google Scholar]
- Munir, R.; Khayyam, U.; Adil, I.H. Perceptions of Glacier Grafting: An Indigenous Technique of Water Conservation for Food Security in Gilgit-Baltistan, Pakistan. Sustainability 2021, 13, 5208. [Google Scholar] [CrossRef]
- Fors, H.; Molin, J.F.; Murphy, M.A.; van den Bosch, C.K. User participation in urban green spaces—For the people or the parks? Urban Urban Green 2015, 14, 722–734. [Google Scholar] [CrossRef] [Green Version]
- Rayan, M.; Khayyam, U.; Gruehn, D. Local Perspectives on Green Resilient Settlements in Pakistan. In CIGOS 2021, Emerging Technologies and Applications for Green Infrastructure. Lecture Notes in Civil Engineering; Ha-Minh, C., Tang, A.M., Bui, T.Q., Vu, X.H., Huynh, D.V.K., Eds.; Springer: Berlin/Heidelberg, Germany, 2022; Volume 203. [Google Scholar] [CrossRef]
- Khayyam, U. Floods: Impacts on livelihood, economic status and poverty in the north-west region of Pakistan. Nat. Hazards 2020, 102, 1033–1056. [Google Scholar] [CrossRef]
- Rayan, M.; Gruehn, D.; Khayyam, U. Green Infrastructure Planning. A Strategy to Safeguard Urban Settlements in Pakistan. In Planning in Germany and Iran. Responding Challenges of Climate Change through Intercultural Dialogue; Jafari, M., Gruehn, D., Sinemillioglu, H., Kaiser, M., Eds.; Mensch und Buch Verlag: Berlin, Germany, 2021; pp. 197–220. [Google Scholar]
- PBS. Pakistan Bureau of Statistics, Urban Demographic. 2018. Available online: http://www.pbs.gov.pk/ (accessed on 11 December 2020).
- Jan, B.; Iqbal, M. Urbanization trend and urban population projections of Pakistan using weighted approach. Sarhad J. Agric. 2008, 24, 173–180. [Google Scholar]
- Haider, M.; Badami, M.G. Urbanization and Local Governance Challenges in Pakistan. Environment and Urbanization ASIA; SAGE Publications: New Delhi, India, 2010; Volume 1, pp. 81–96. [Google Scholar]
- UN-OCHA. Pakistan Flood Relief and Early Recovery Response plan; United Nations Office for the Coordination of Humanitarian Affairs: New York, NY, USA, 2010. [Google Scholar]
- Khayyam, U.; Noureen, S. Assessing the adverse effects of flooding for the livelihood of the poor and the level of external response: A case study of Hazara Division, Pakistan. Environ. Sci. Pollut. Res. 2020, 27, 19638–19649. [Google Scholar] [CrossRef]
- Eckstein, D.; Künzel, V.; Schäfer, L. Global Climate Risk Index 2021. Who Suffers Most from Extreme Weather Events? Weather-Related Loss Events in 2019 and 2000–2019. 2020. Available online: http://germanwatch.org/en/download/8551.pdf (accessed on 11 June 2021).
- NDMA. National Disaster Management Authority, Annual Report 2010; NDMA: Islamabad, Pakistan, 2010. [Google Scholar]
- Khayyam, U.; Munir, R. Flood in mountainous communities of Pakistan: How does it shape the livelihood and economic status and government support? Environ. Sci. Pollut. Res. 2022, 29, 40921–40940. [Google Scholar] [CrossRef]
- Atta-ur-Rahman; Khan, A.N. Analysis of 2010-flood causes, nature and magnitude in the Khyber Pakhtunkhwa, Pakistan. Nat. Hazards 2013, 66, 887–904. [Google Scholar] [CrossRef]
- Khayyam, U. What (Not) Advances Effective Community-Driven Development? A Socio-Economic & Politico-Cultural Analysis of the Pashtun Ethnic Society of FATA, Pakistan. Ph.D. Thesis, Universität Münster, Münster, Germany, 2016. [Google Scholar]
- Alvi, S.; Khayyam, U. Mitigating and adapting to climate change: Attitudinal and behavioural challenges in South Asia. Int. J. Clim. Chang. Strateg. Manag. 2020, 12, 477–493. [Google Scholar] [CrossRef]
- Ahmad, N.; Anjum, G.A. Legal and institutional perplexities hampering the implementation of urban development plans in Pakistan. Cities 2012, 29, 271–277. [Google Scholar] [CrossRef]
- Hussnain, M.Q.; Anjum, G.A.; Wakil, K.; Tharanga, P.H. Improving Efficiency in Data Collection for Urban Development Plans through Information and Communication Technology. In Proceedings of the International Conference on Town Planning and Urban Management (ICTPUM), Lahore, Pakistan, 29–30 September 2014. [Google Scholar]
- Wakil, K.; Hussnain, M.Q.; Yusuf, A.; Abdul Jabbar, J. Project Report: Scenario Planning based Participatory Urban Growth Management Plans Using ICT. Islamabad. 2016. Available online: https://think-asia.org/handle/11540/7573 (accessed on 11 June 2022).
- Demuzere, M.; Orru, K.; Heidrich, O.; Olazabal, E.; Geneletti, D.; Orru, H.; Bhave, A.G.; Mittal, N.; Feliú, E.; Faehnle, M. Mitigating and adapting to climate change: Multi-functional and multi-scale assessment of green urban infrastructure. J. Environ. Manag. 2014, 146, 107–115. [Google Scholar] [CrossRef] [PubMed]
- MapAction, UN-OCHA. United Nations Office for the Coordination of Humanitarian Affairs New York: Pakistan / Kyber-Pakhtunkhwa: Flood Extent (2 Sept 2010) and Flood Affected. Available online: https://reliefweb.int/map/pakistan/pakistan-kyber-pakhtunkhwa-flood-extent-2-sept-2010-and-flood-affected-districts-31-aug (accessed on 11 December 2020).
- Sturiale, L.; Scuderi, A. The role of green infrastructures in urban planning for climate change adaptation. Climate 2019, 7, 119. [Google Scholar] [CrossRef] [Green Version]
- UN-SDG. The Sustainable Development Goals Report: United Nations Department of Economic and Social Affairs. 2019. Available online: https://www.un-ilibrary.org/content/books/9789210478878/read (accessed on 6 December 2021).
- Ahsan, A. Urban Flood Risk Management in Pakistan. Islamabad: Daily Times. 2018. Available online: https://dailytimes.com.pk/280433/urban-flood-risk-management-in-pakistan/ (accessed on 8 June 2021).
- Bano, R.; Khayyam, U. Industrial air pollution and self-reported respiratory and irritant health effects on adjacent residents: A case study of Islamabad Industrial Estate (IEI). Air Qual. Atmos. Health 2021, 14, 1709–1722. [Google Scholar] [CrossRef]
- Mensah, C.A. Destruction of urban green spaces: A problem beyond urbanization in Kumasi city (Ghana). Am. J. Environ. Prot. 2014, 3, 1–9. [Google Scholar] [CrossRef] [Green Version]
- Naveed, Z.; Khayyam, U. Smog and cognitive issues in the school going children of Lahore and Islamabad, Pakistan. Int. J. Environ. Sci. Technol. 2022, 1–16. [Google Scholar] [CrossRef]
- Ashfaque, R.; Awan, M. Final Report-Policy and Legal Reform Study (GEF-Protected Areas Management Project); Ministry of Environment, Government of Pakistan: Islamabad, Pkistan, 2015.
- Nizamani, A.A.; Shah, A.A. A review of forest policy trends for community participation in Pakistan. Policy Trend Rep. 2004, 2004, 28–34. [Google Scholar]
- Iqbal, N. Supreme Court Orders Equal Benefits for Transvestites. 2009. Available online: https://www.dawn.com/news/477909/supreme-court-orders-equal-benefits-for-transvestites (accessed on 13 May 2021).
- Guramani, N. National Assembly passes bill seeking protection of transgender rights. In: DAWN. 2018. Available online: https://www.dawn.com/news/1406400 (accessed on 13 May 2021).
- Guramani, N. Senate Unanimously Approves Bill Empowering Transgenders to Determine Their Own Identity. 2018. Available online: https://www.dawn.com/news/1393766 (accessed on 13 May 2021).
- Beattie, A.; Hek, G.; Ross, K.; Galvin, K. Future Career Pathways in Nursing and Midwifery. A Delphi Survey of Nurses and Midwives in South West England, NT Research; SAGE Publications: London, UK, 2004. [Google Scholar] [CrossRef]
- Monette, D.R.; Sullivan, T.J.; DeJong, C.R. Applied Social Research: A Tool for the Human Services; Nelson Education: Scarborough, ON, Canada, 2013. [Google Scholar]
- Wan, X.; Wang, W.; Liu, J.; Tong, T. Estimating the sample mean and standard deviation from the sample size, median, range and/or interquartile range. BMC Med. Res. Methodol. 2014, 14, 135. [Google Scholar] [CrossRef] [Green Version]
- Luo, D.; Wan, X.; Liu, J.; Tong, T. Optimally estimating the sample mean from the sample size, median, mid-range, and/or mid-quartile range. Stat. Methods Med. Res. 2016, 27, 1785–1805. [Google Scholar] [CrossRef] [Green Version]
- Chinyio, E.A.; Olomolaiye, P.O.; Corbett, P. Quantification of construction clients’ needs through paired comparisons. J. Manag. Eng. 1998, 14, 87–92. [Google Scholar] [CrossRef]
- Adetunji, I.O. Sustainable Construction: A Web-Based Performance Assessment Tool. Ph.D. Thesis, Loughborough University, Loughborough, UK, 2005. [Google Scholar]
- Gavu, E.K. Understanding Location and Neighbourhood Effects: An Analysis of the Housing Submarkets in Accra–Ghana; Technische Universität Dortmund: Dortmund, Germany, 2021. [Google Scholar]
- Braimah, N.; Ndekugri, I. Consultants’ Perceptions on Construction Delay Analysis Methodologies. J. Constr. Eng. Manag.-Asce 2009, 135, 1279–1288. [Google Scholar] [CrossRef]
- Akadiri, O.P. Development of a Multi-Criteria Approach for the Selection of Sustainable Materials for Building Projects; University of Wolverhampton: Wolverhampton, UK, 2011. [Google Scholar]
- Foster, J.; Lowe, A.; Winkelman, S. The value of green infrastructure for urban climate adaptation. Cent. Clean Air Policy 2011, 750, 1–52. [Google Scholar]
- Rouse, D.C.; Bunster-Ossa, I.F. Green Infrastructure: A Landscape Approach; American Planning Association: Chicago, IL, USA, 2013. [Google Scholar]
- Rayan, M.; Gruehn, D.; Khayyam, U. Planning for Sustainable Green Urbanism: An Empirical Communal-Based Study on Green Infrastructure Indicators in Pakistan. Land Use Policy 2022. under review. [Google Scholar]
- UNDP-Pakistan. Development Advocate Pakistan. Sustain. Urbanization. 2018. Available online: https://www.undp.org/pakistan/publications/sustainable-urbanization (accessed on 16 August 2021).
- UNDP-Pakistan. Development Advocate Pakistan, Population Growth: Implications for Human Development. 2019. Available online: https://www.pk.undp.org/content/pakistan/en/home/library/development_policy/dap-vol6-iss1-population-growth.html (accessed on 16 August 2021).
- Pauleit, S.; Ambrose-Oji, B.; Andersson, E.; Anton, B.; Buijs, A.; Haase, D.; Elands, B.; Hansen, R.; Kowarik, I.; Kronenberg, J.; et al. Advancing urban green infrastructure in Europe: Outcomes and reflections from the GREEN SURGE project. Urban For. Urban Green. 2019, 40, 4–16. [Google Scholar] [CrossRef]
- Buishand, A.; Wijngaard, J. Statistiek van Extreme Neerslag Voor Korte Neerslagduren; KNMI: De Bilt, The Netherlands, 2007.
- Wise, S.; Braden, J.; Ghalayini, D.; Grant, J.; Kloss, C.; MacMullan, E.; Morse, S.; Montalto, F.; Nees, D.; Nowak, D.; et al. Integrating valuation methods to recognize green infrastructure’s multiple benefits. In Low Impact Development 2010: Redefining Water in the City; ASCE Publications: Reston, VA, USA, 2010; pp. 1123–1143. [Google Scholar]
- Jacobs, C.; Elbers, J.; Brolsma, R.; Hartogensis, O.; Moors, E.; Márquez, M.T.R.-C.; van Hove, B. Assessment of evaporative water loss from Dutch cities. Build. Environ. 2015, 83, 27–38. [Google Scholar] [CrossRef]
- Nowak, D.J.; Crane, D.E.; Stevens, J.C. Air pollution removal by urban trees and shrubs in the United States. Urban For. Urban Green. 2006, 4, 115–123. [Google Scholar] [CrossRef]
- Yang, J.; Yu, Q.; Gong, P. Quantifying air pollution removal by green roofs in Chicago. Atmospheric Environ. 2008, 42, 7266–7273. [Google Scholar] [CrossRef]
- Pugh, T.A.M.; MacKenzie, A.R.; Whyatt, J.D.; Hewitt, C.N. Effectiveness of Green Infrastructure for Improvement of Air Quality in Urban Street Canyons. Environ. Sci. Technol. 2012, 46, 7692–7699. [Google Scholar] [CrossRef] [Green Version]
- Samara, T.; Tsitsoni, T. The effects of vegetation on reducing traffic noise from a city ring road. Noise Control Eng. J. 2011, 59, 68–74. [Google Scholar] [CrossRef]
- Van Renterghem, T.; Botteldooren, D.; Verheyen, K. Road traffic noise shielding by vegetation belts of limited depth. J. Sound Vib. 2012, 331, 2404–2425. [Google Scholar] [CrossRef] [Green Version]
- Weilenmann, M.F.; Vasic, A.-M.; Stettler, P.; Novak, P. Influence of Mobile Air-Conditioning on Vehicle Emissions and Fuel Consumption: A Model Approach for Modern Gasoline Cars Used in Europe. Environ. Sci. Technol. 2005, 39, 9601–9610. [Google Scholar] [CrossRef]
- Mentens, J.; Raes, D.; Hermy, M. Green roofs as a tool for solving the rainwater runoff problem in the urbanized 21st century? Landsc. Urban Plan. 2006, 77, 217–226. [Google Scholar] [CrossRef]
- Akbari, H.; Taha, H. The impact of trees and white surfaces on residential heating and cooling energy use in four Canadian cities. Energy 1992, 17, 141–149. [Google Scholar] [CrossRef]
- McKinney, M.L. Urbanization as a major cause of biotic homogenization. Biol. Conserv. 2006, 127, 247–260. [Google Scholar] [CrossRef]
- Weber, T.; Sloan, A.; Wolf, J. Maryland’s Green Infrastructure Assessment: Development of a comprehensive approach to land conservation. Landsc. Urban Plan. 2006, 77, 94–110. [Google Scholar] [CrossRef]
- Adams, L.W. In our own backyard. J. Urban For. 1994, 92, 24–25. [Google Scholar]
- Hartig, T.; Mitchell, R.; de Vries, S.; Frumkin, H. Nature and Health. Annu. Rev. Public Health 2014, 35, 207–228. [Google Scholar] [CrossRef] [Green Version]
- Clark, K.H.; Nicholas, K.A. Introducing urban food forestry: A multifunctional approach to increase food security and provide ecosystem services. Landsc. Ecol. 2013, 28, 1649–1669. [Google Scholar] [CrossRef] [Green Version]
- Giles-Corti, B.; Broomhall, M.H.; Knuiman, M.; Collins, C.; Douglas, K.; Ng, K.; Lange, A.; Donovan, R.J. Increasing walking: How important is distance to, attractiveness, and size of public open space? Am. J. Prev. Med. 2005, 28, 169–176. [Google Scholar] [CrossRef]
- Weldon, S.; Bailey, C.; O’Brien, E. New Pathways for Health and Well-Being in Scotland: Research to Understand and Overcome Barriers to Accessing Woodlands; Report to Forestry Commission Scotland: Edinburgh, UK, 2007.
- Pretty, J.; Peacock, J.; Sellens, M.; Griffin, M. The mental and physical health outcomes of green exercise. Int. J. Environ. Health Res. 2005, 15, 319–337. [Google Scholar] [CrossRef]
- Bratman, G.N.; Daily, G.C.; Levy, B.J.; Gross, J.J. The benefits of nature experience: Improved affect and cognition. Landsc. Urban Plan. 2015, 138, 41–50. [Google Scholar] [CrossRef]
- Kardan, O.; Gozdyra, P.; Misic, B.; Moola, F.; Palmer, L.J. Neighborhood greenspace and health in a large urban center. In Urban Forests; Apple Academic Press: New York, NY, USA, 2017; pp. 77–108. [Google Scholar]
- McDonnell, M.J.; Pickett, S.T.A.; Groffman, P.; Bohlen, P.; Pouyat, R.V.; Zipperer, W.C.; Parmelee, R.W.; Carreiro, M.M.; Medley, K. Ecosystem processes along an urban-to-rural gradient. In Urban Ecology; Springer: Boston, MA, 2008; pp. 299–313. [Google Scholar]
- De Vries, S.I.; Hopman-Rock, M.; Bakker, I.; HiraSing, R.A.; Van Mechelen, W. Built Environmental Correlates of Walking and Cycling in Dutch Urban Children: Results from the SPACE Study. Int. J. Environ. Res. Public Health 2010, 7, 2309–2324. [Google Scholar] [CrossRef] [PubMed] [Green Version]
- Shoup, L.; Ewing, R. The Economic Benefits of Open Space, Recreation Facilities and Walkable Community Design; A Research Synthesis; Active Living Research, a National Program of the Robert Wood Johnson Foundation: Princeton, NJ, USA, 2010. [Google Scholar]
- Gordon-Walker, S.; Harle, T.; Naismith, I. Cost-Benefit of SUDS Retrofit in Urban Areas; Environment Agency: Rotherham, UK, 2007.
- McPherson, E.G.; Muchnick, J. Effects Of Street Tree Shade On Asphalt Concrete Pavement Performance. Arboric. Urban For. 2005, 31, 303–310. [Google Scholar] [CrossRef]
- KPBOS. Khyber Paktunkhwa Bureau of Statistics. 2018. Available online: https://kpbos.gov.pk/ (accessed on 11 December 2020).

Publisher’s Note: MDPI stays neutral with regard to jurisdictional claims in published maps and institutional affiliations. |
© 2022 by the authors. Licensee MDPI, Basel, Switzerland. This article is an open access article distributed under the terms and conditions of the Creative Commons Attribution (CC BY) license (https://creativecommons.org/licenses/by/4.0/).