
Research on the Load Transfer Law of Cross-Sections of Pile-Supported Reinforced Embankments Based on the Finite Element Method


Abstract
:1. Introduction
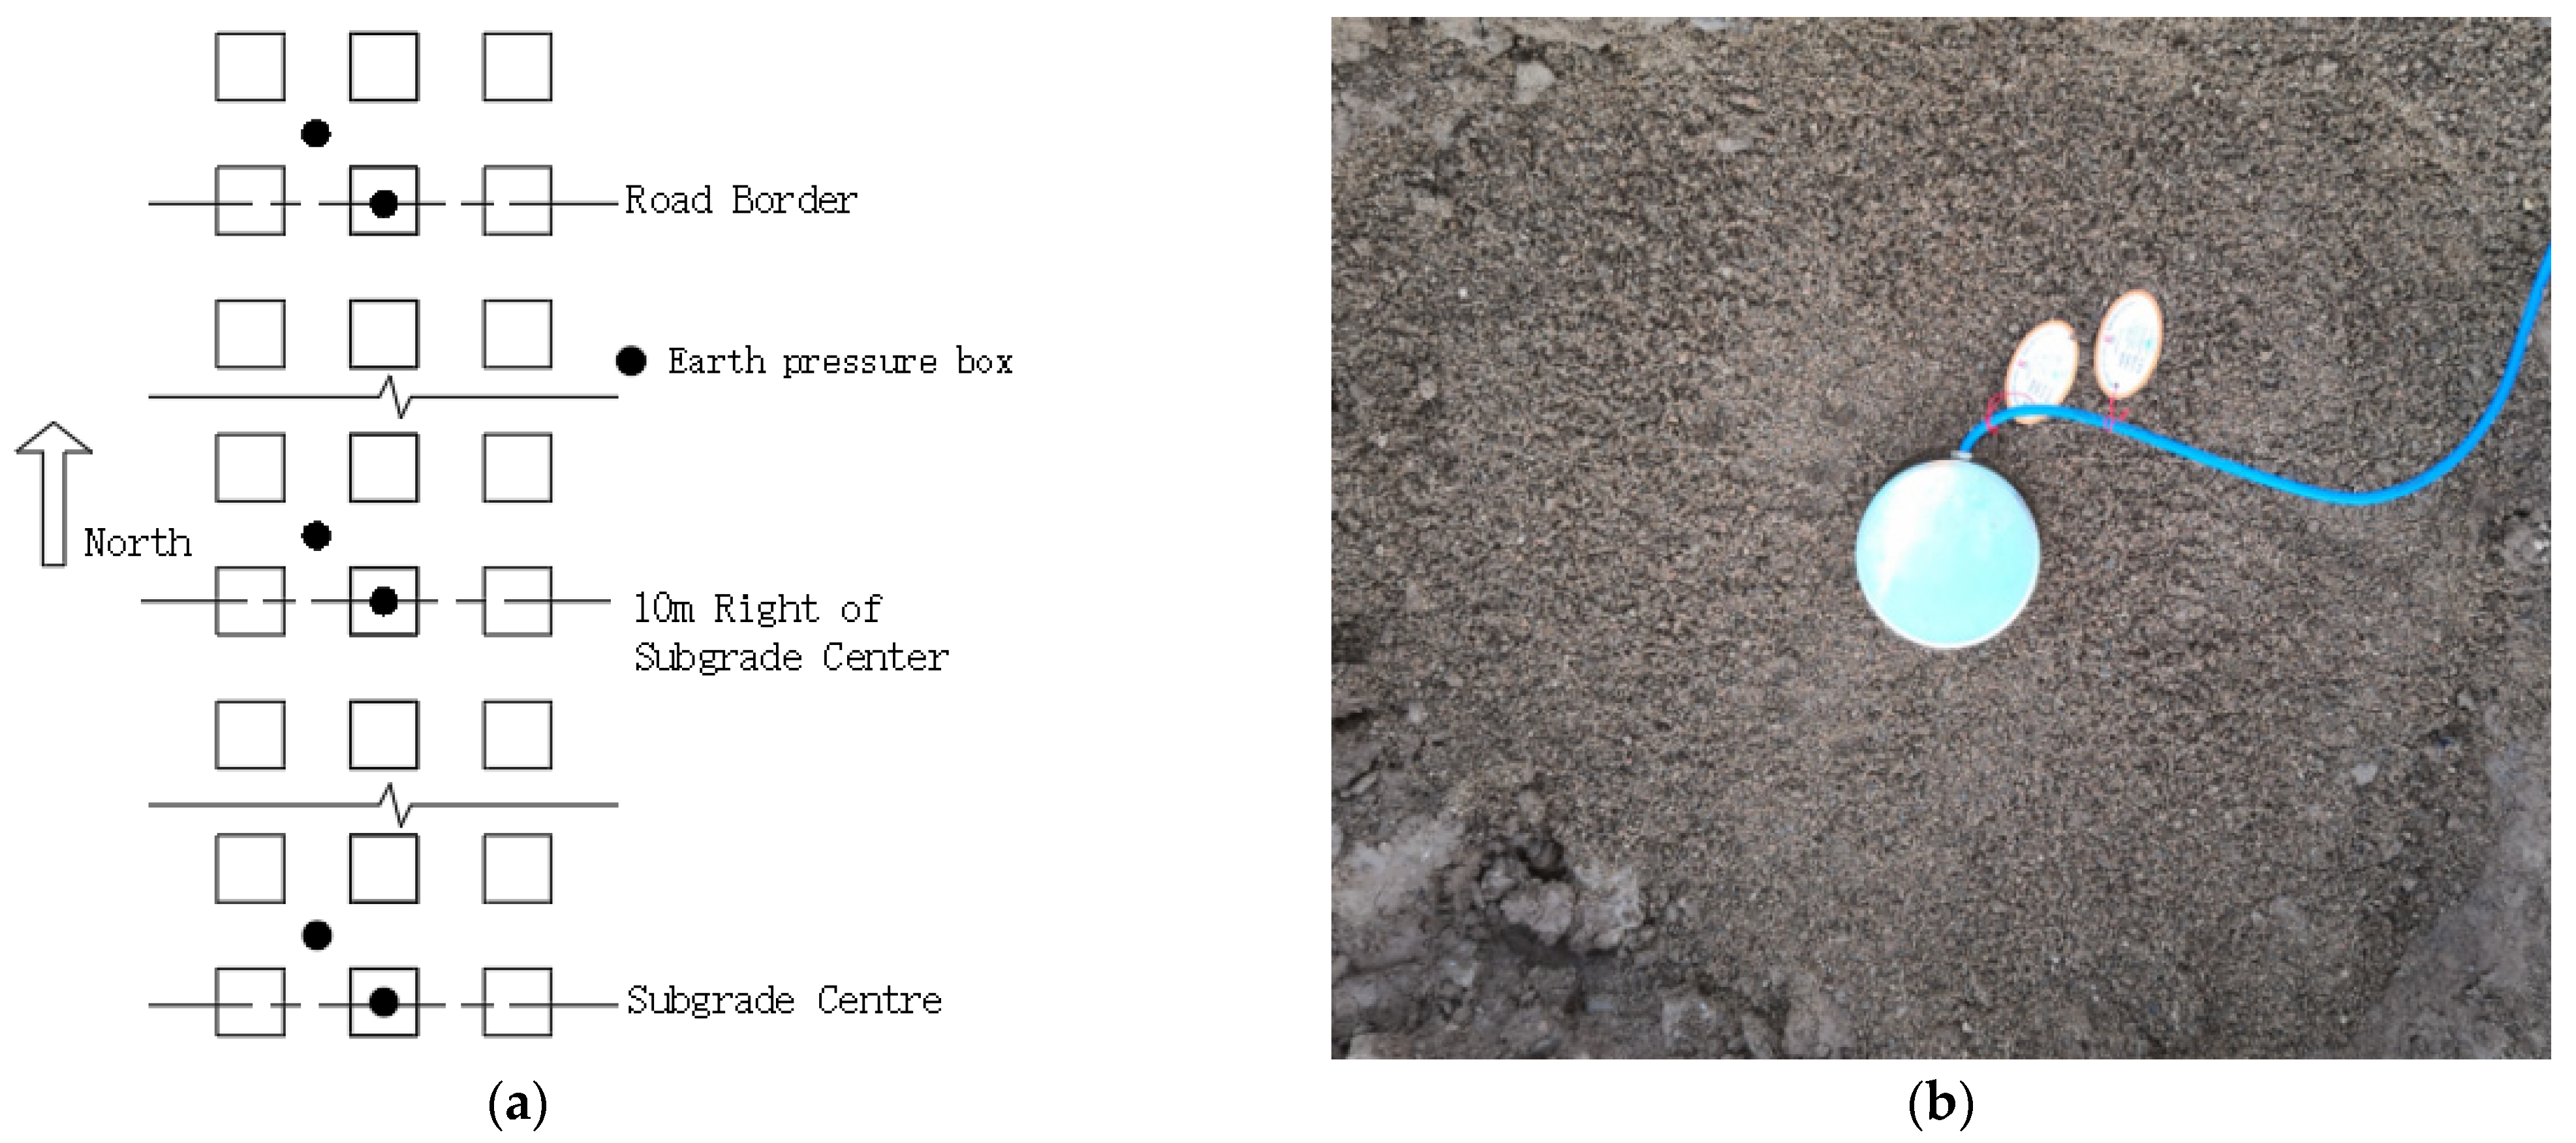
2. Field Test
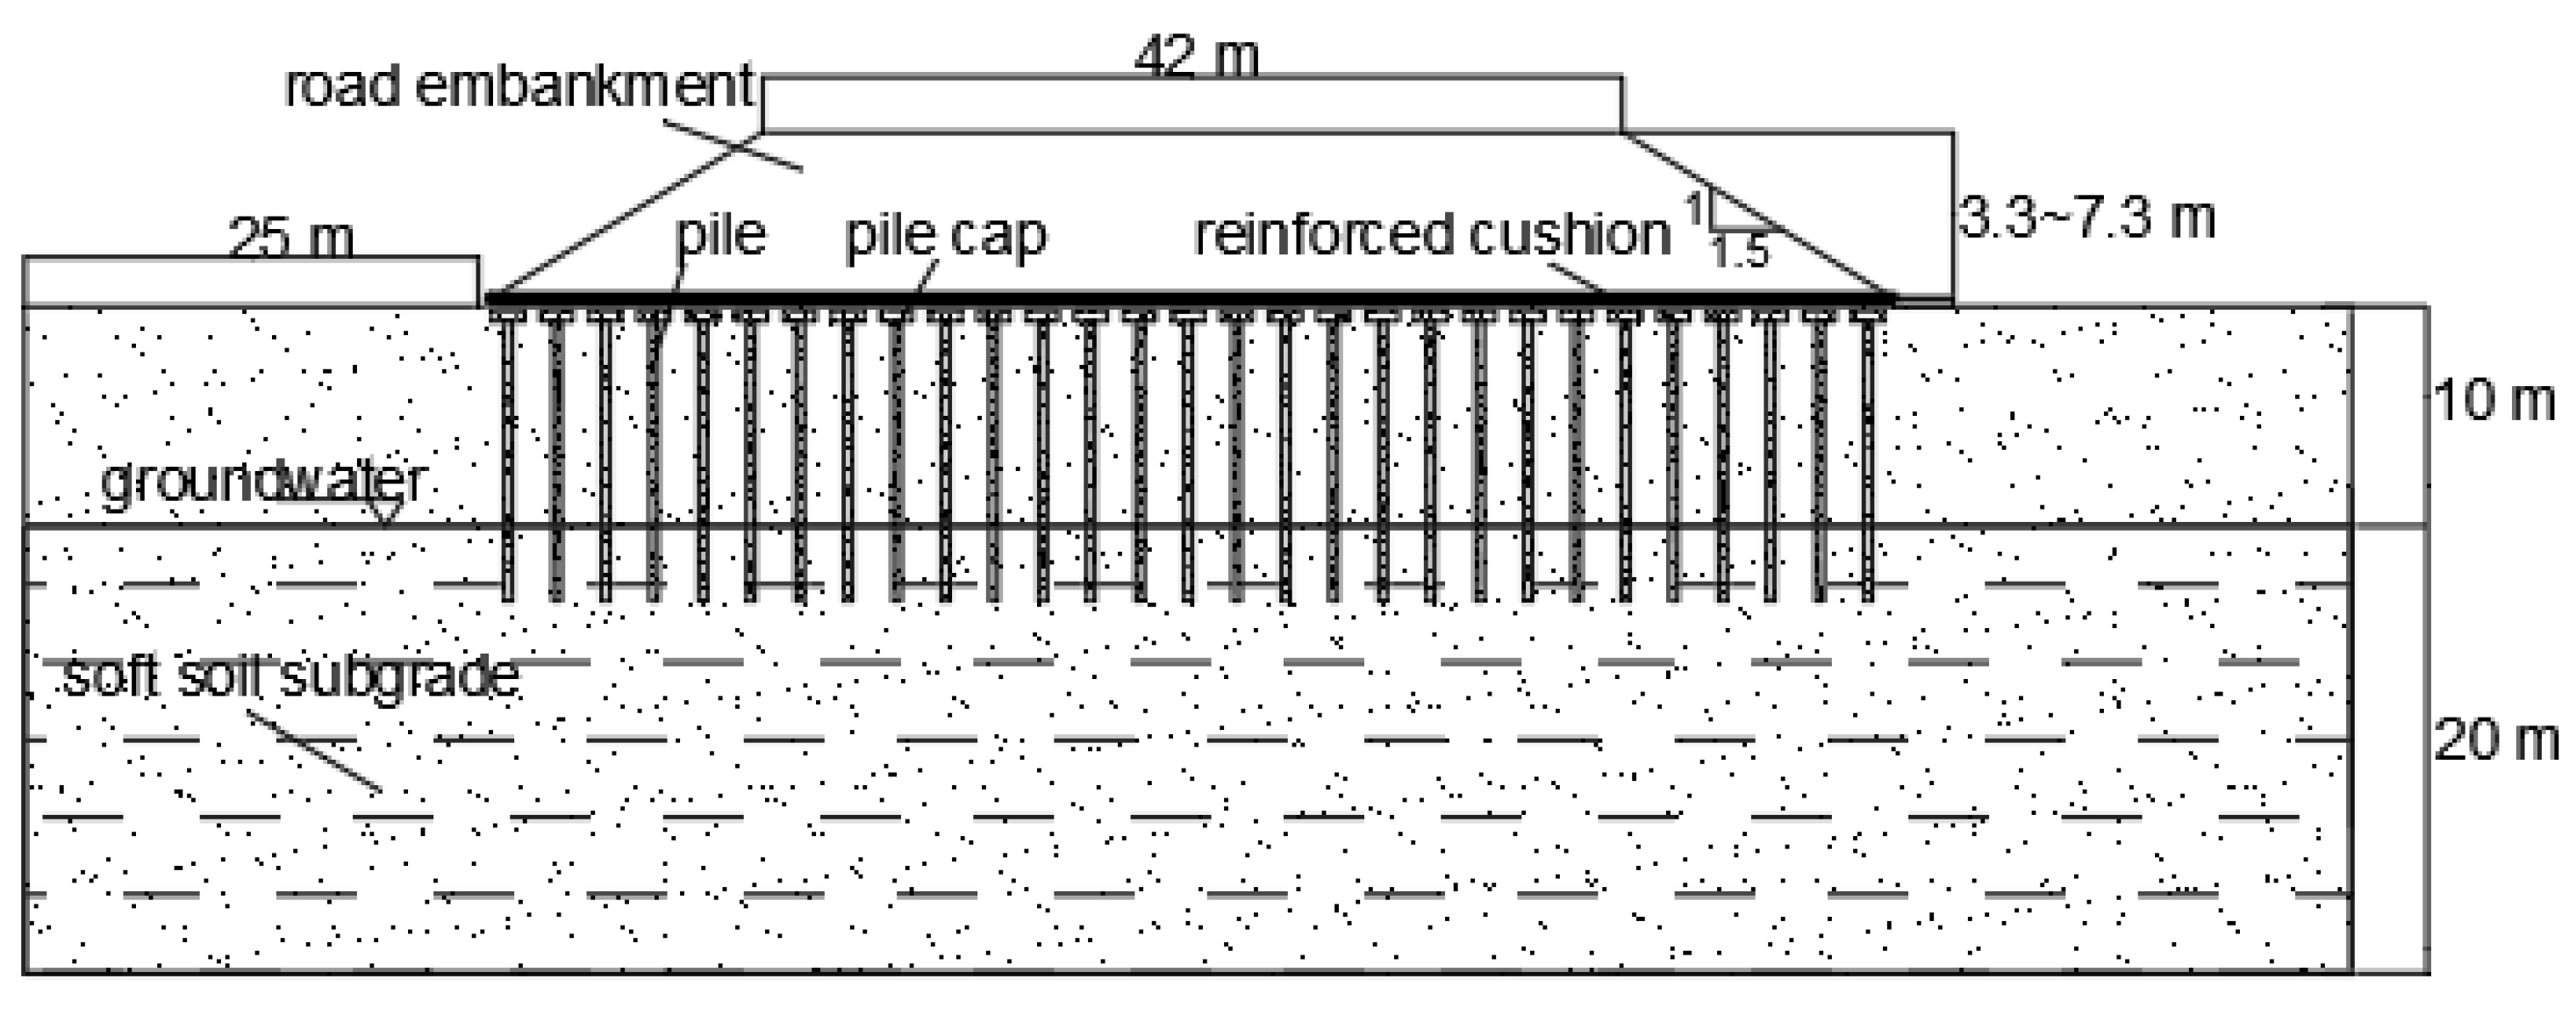
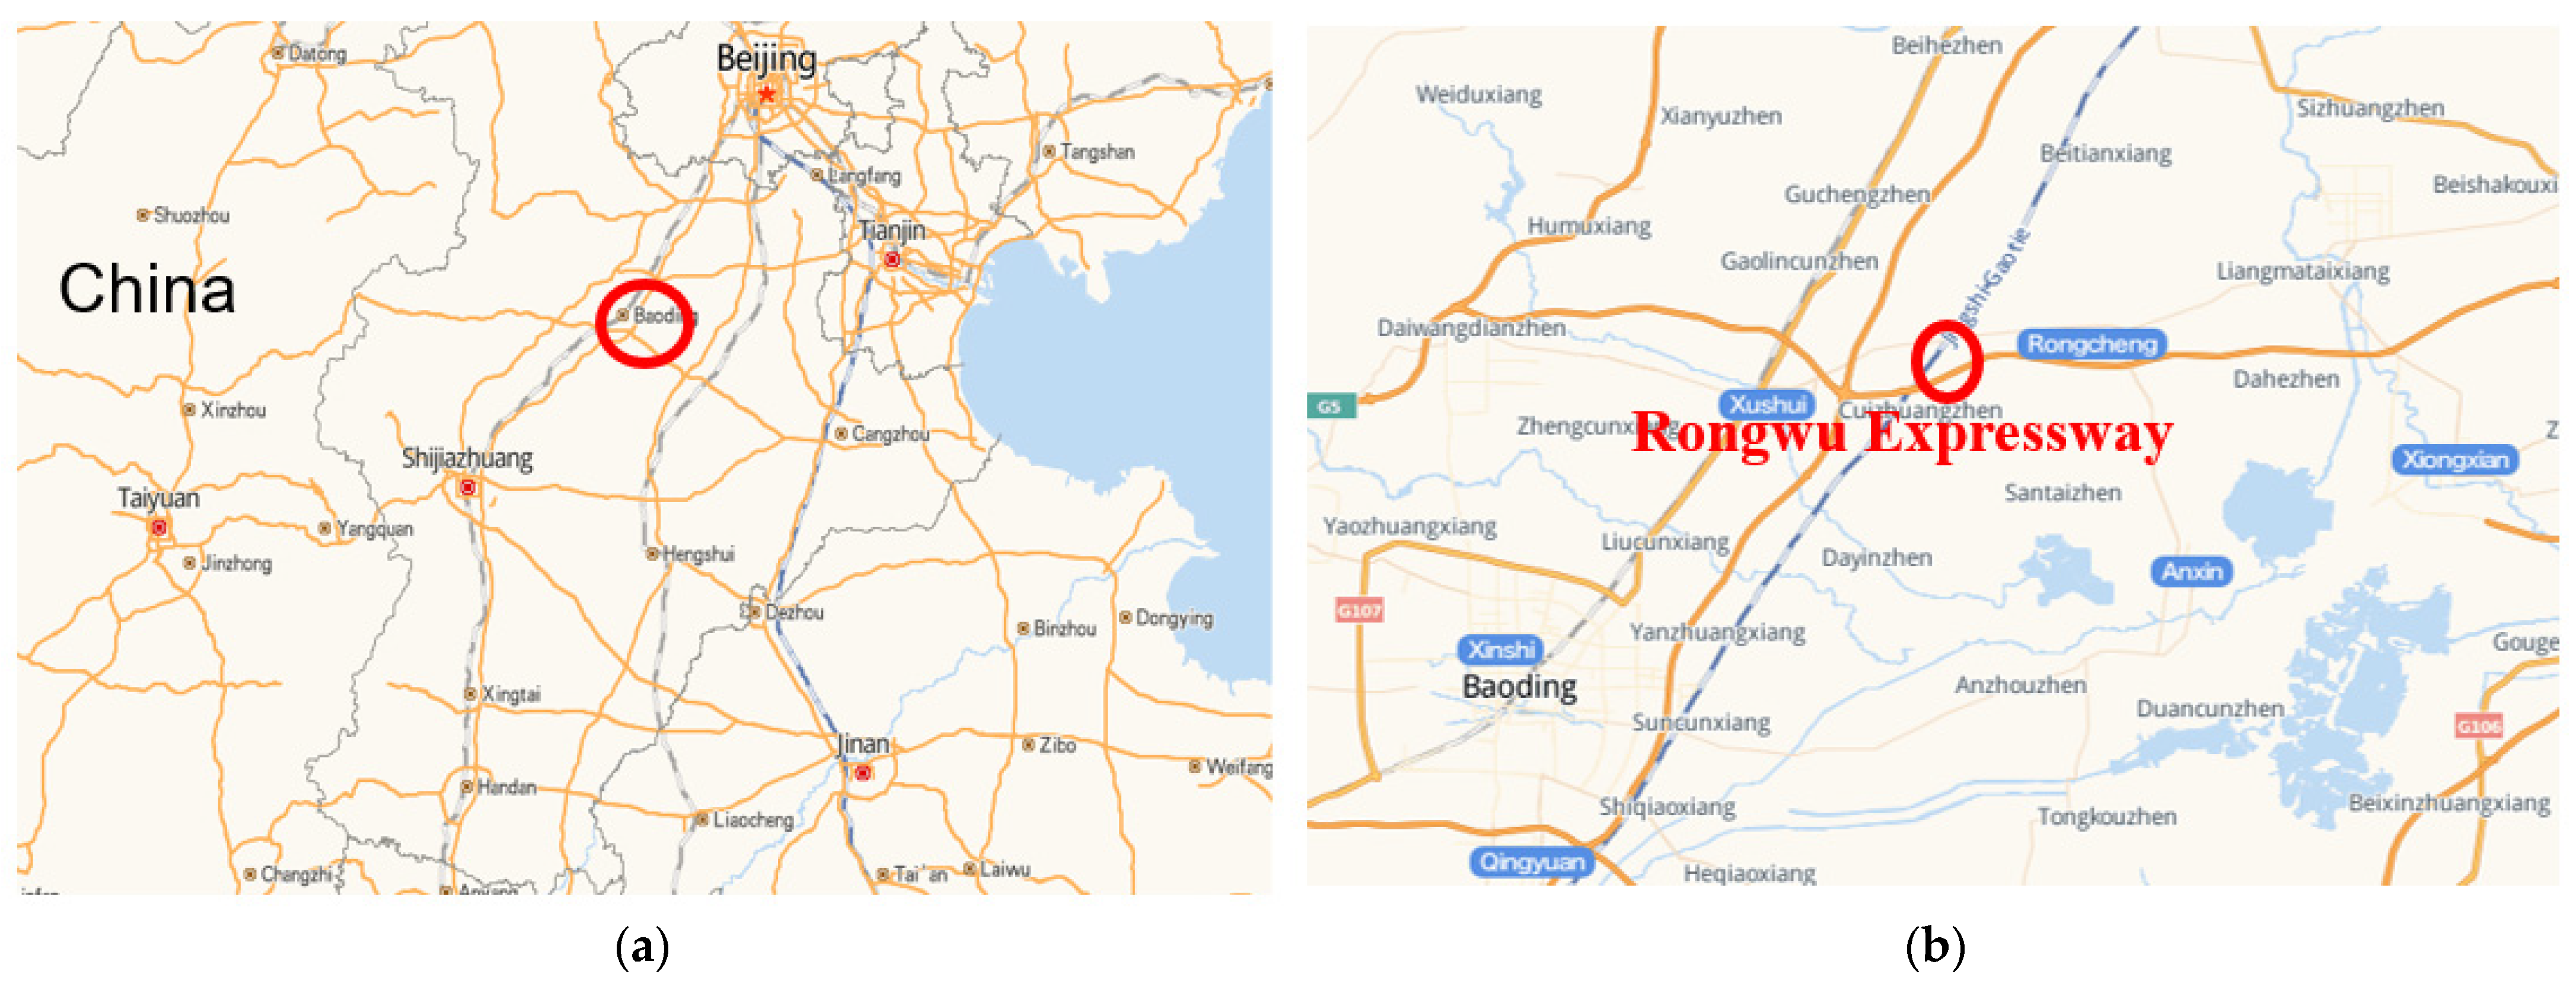
2.1. Introduction of Field Test
2.2. Test Results and Discussion
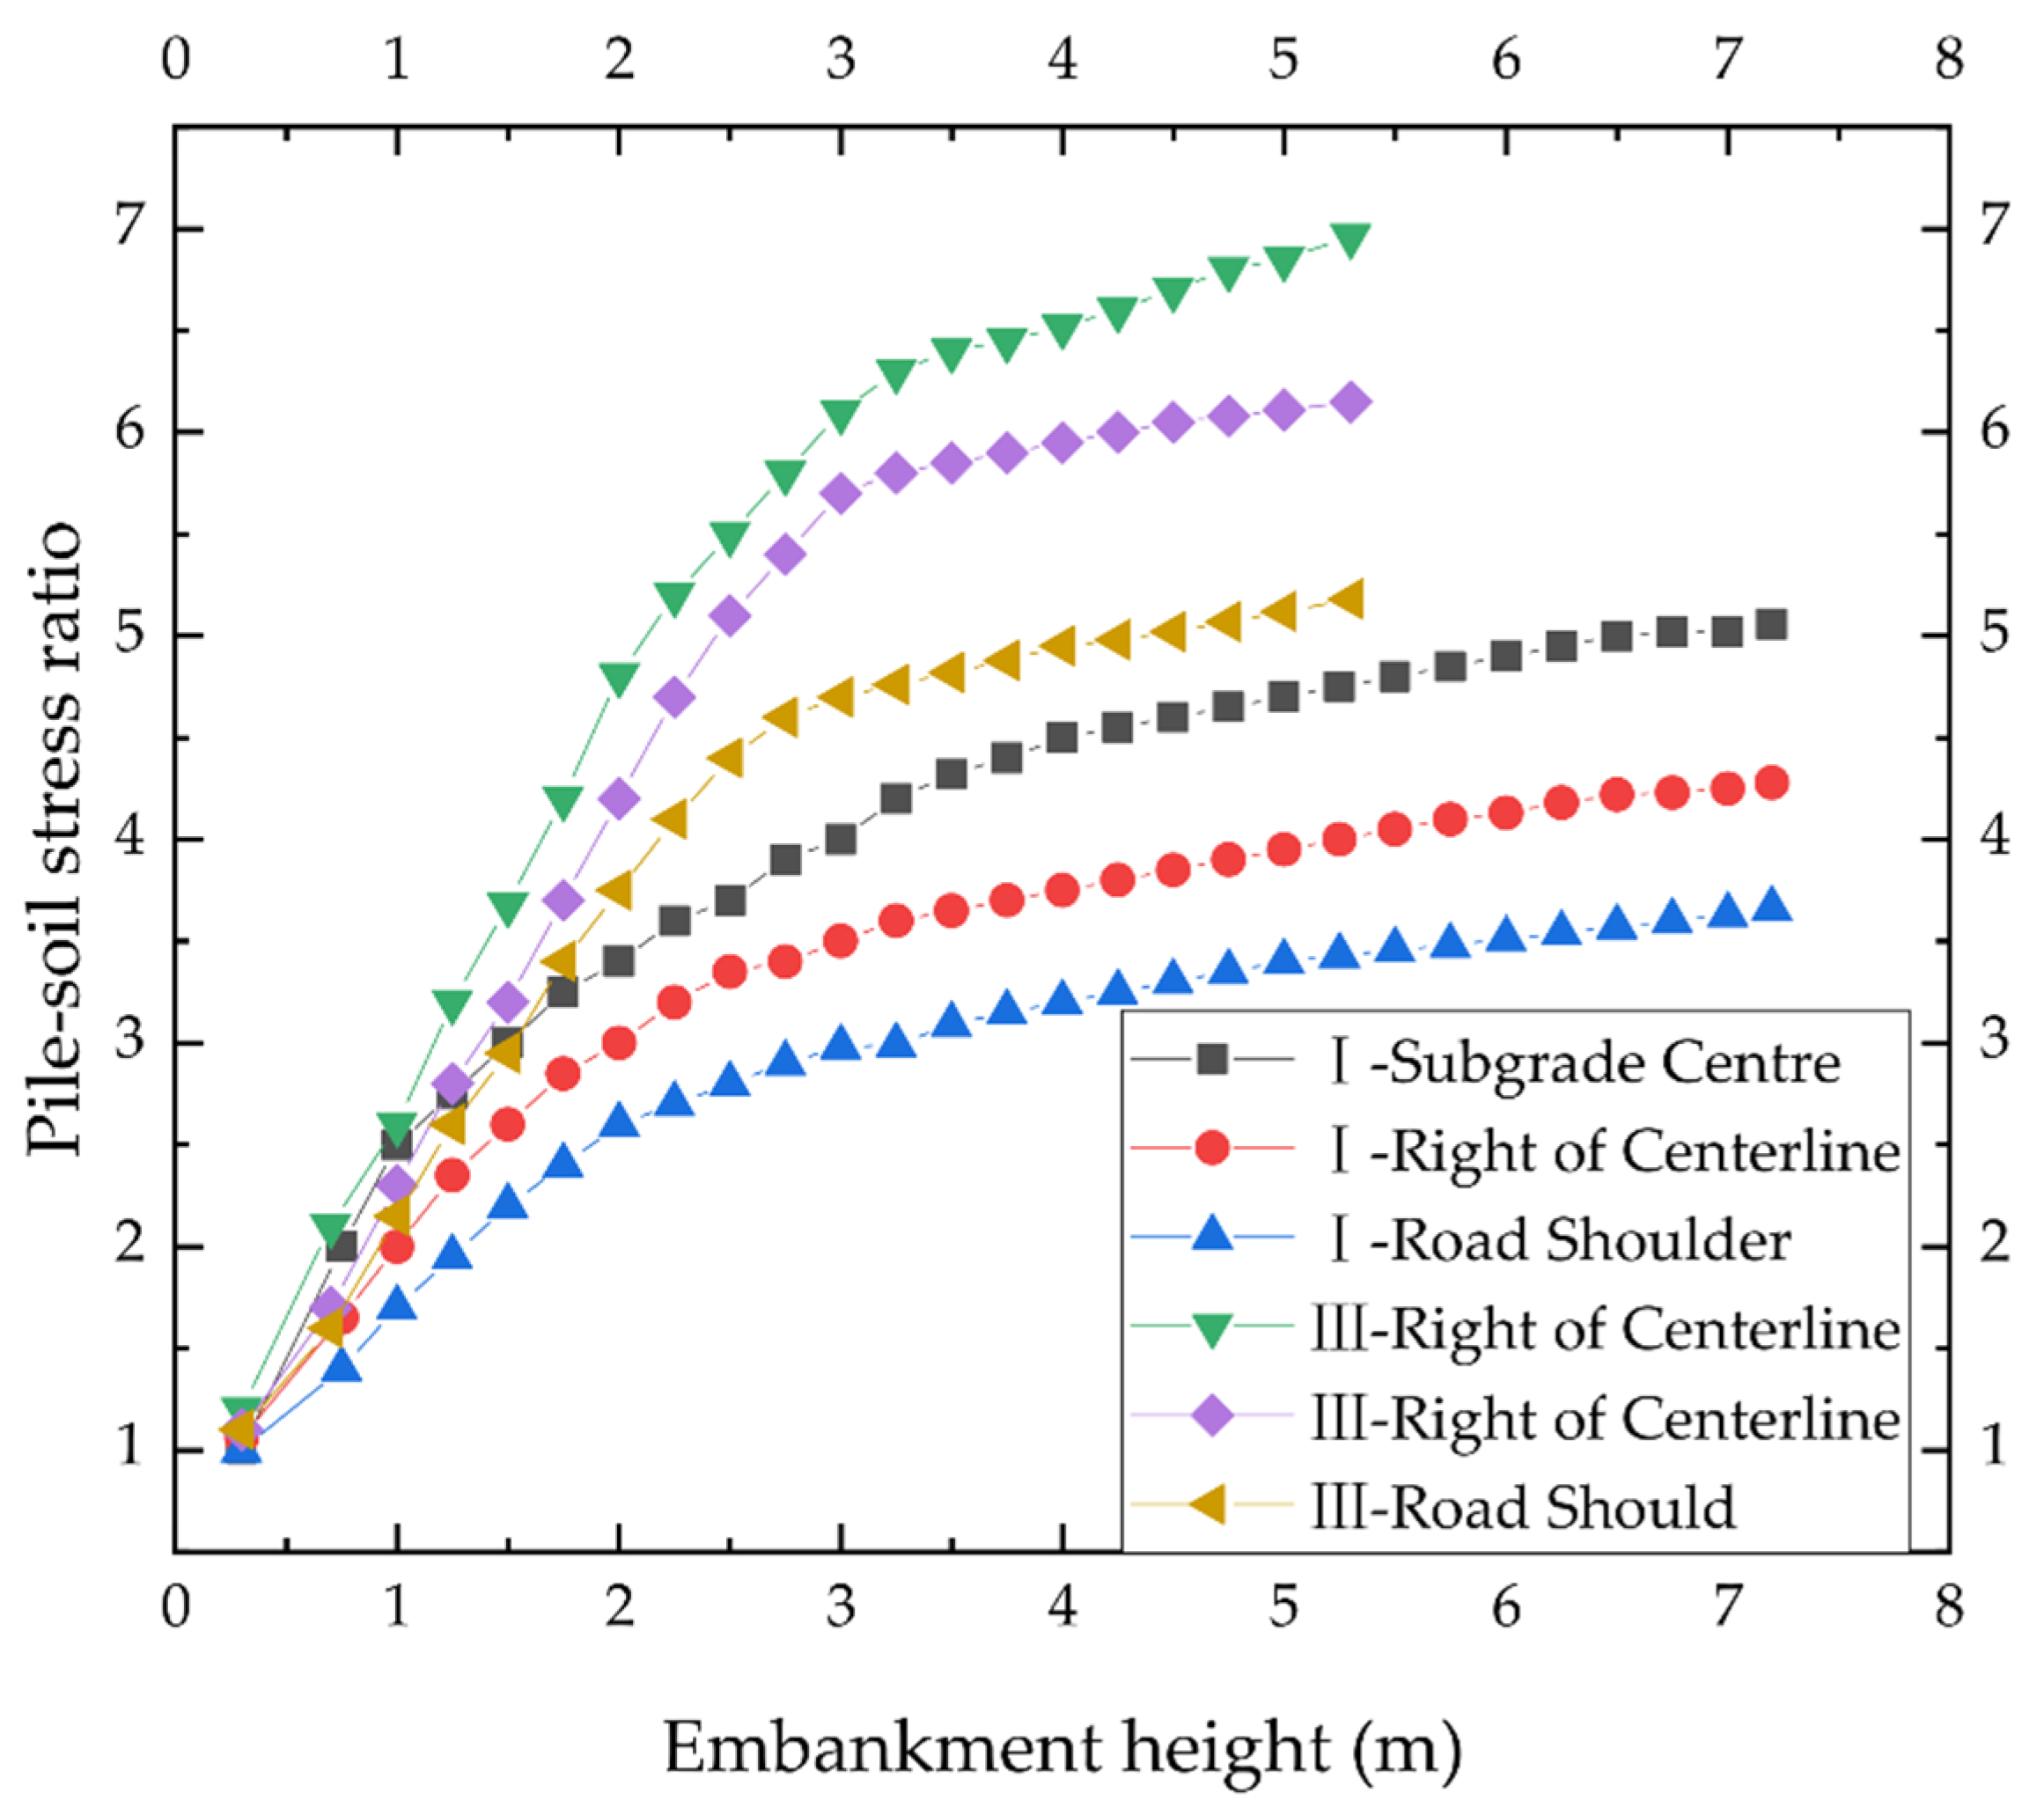
2.2.1. Variation Law of the Pile–Soil Stress Ratio
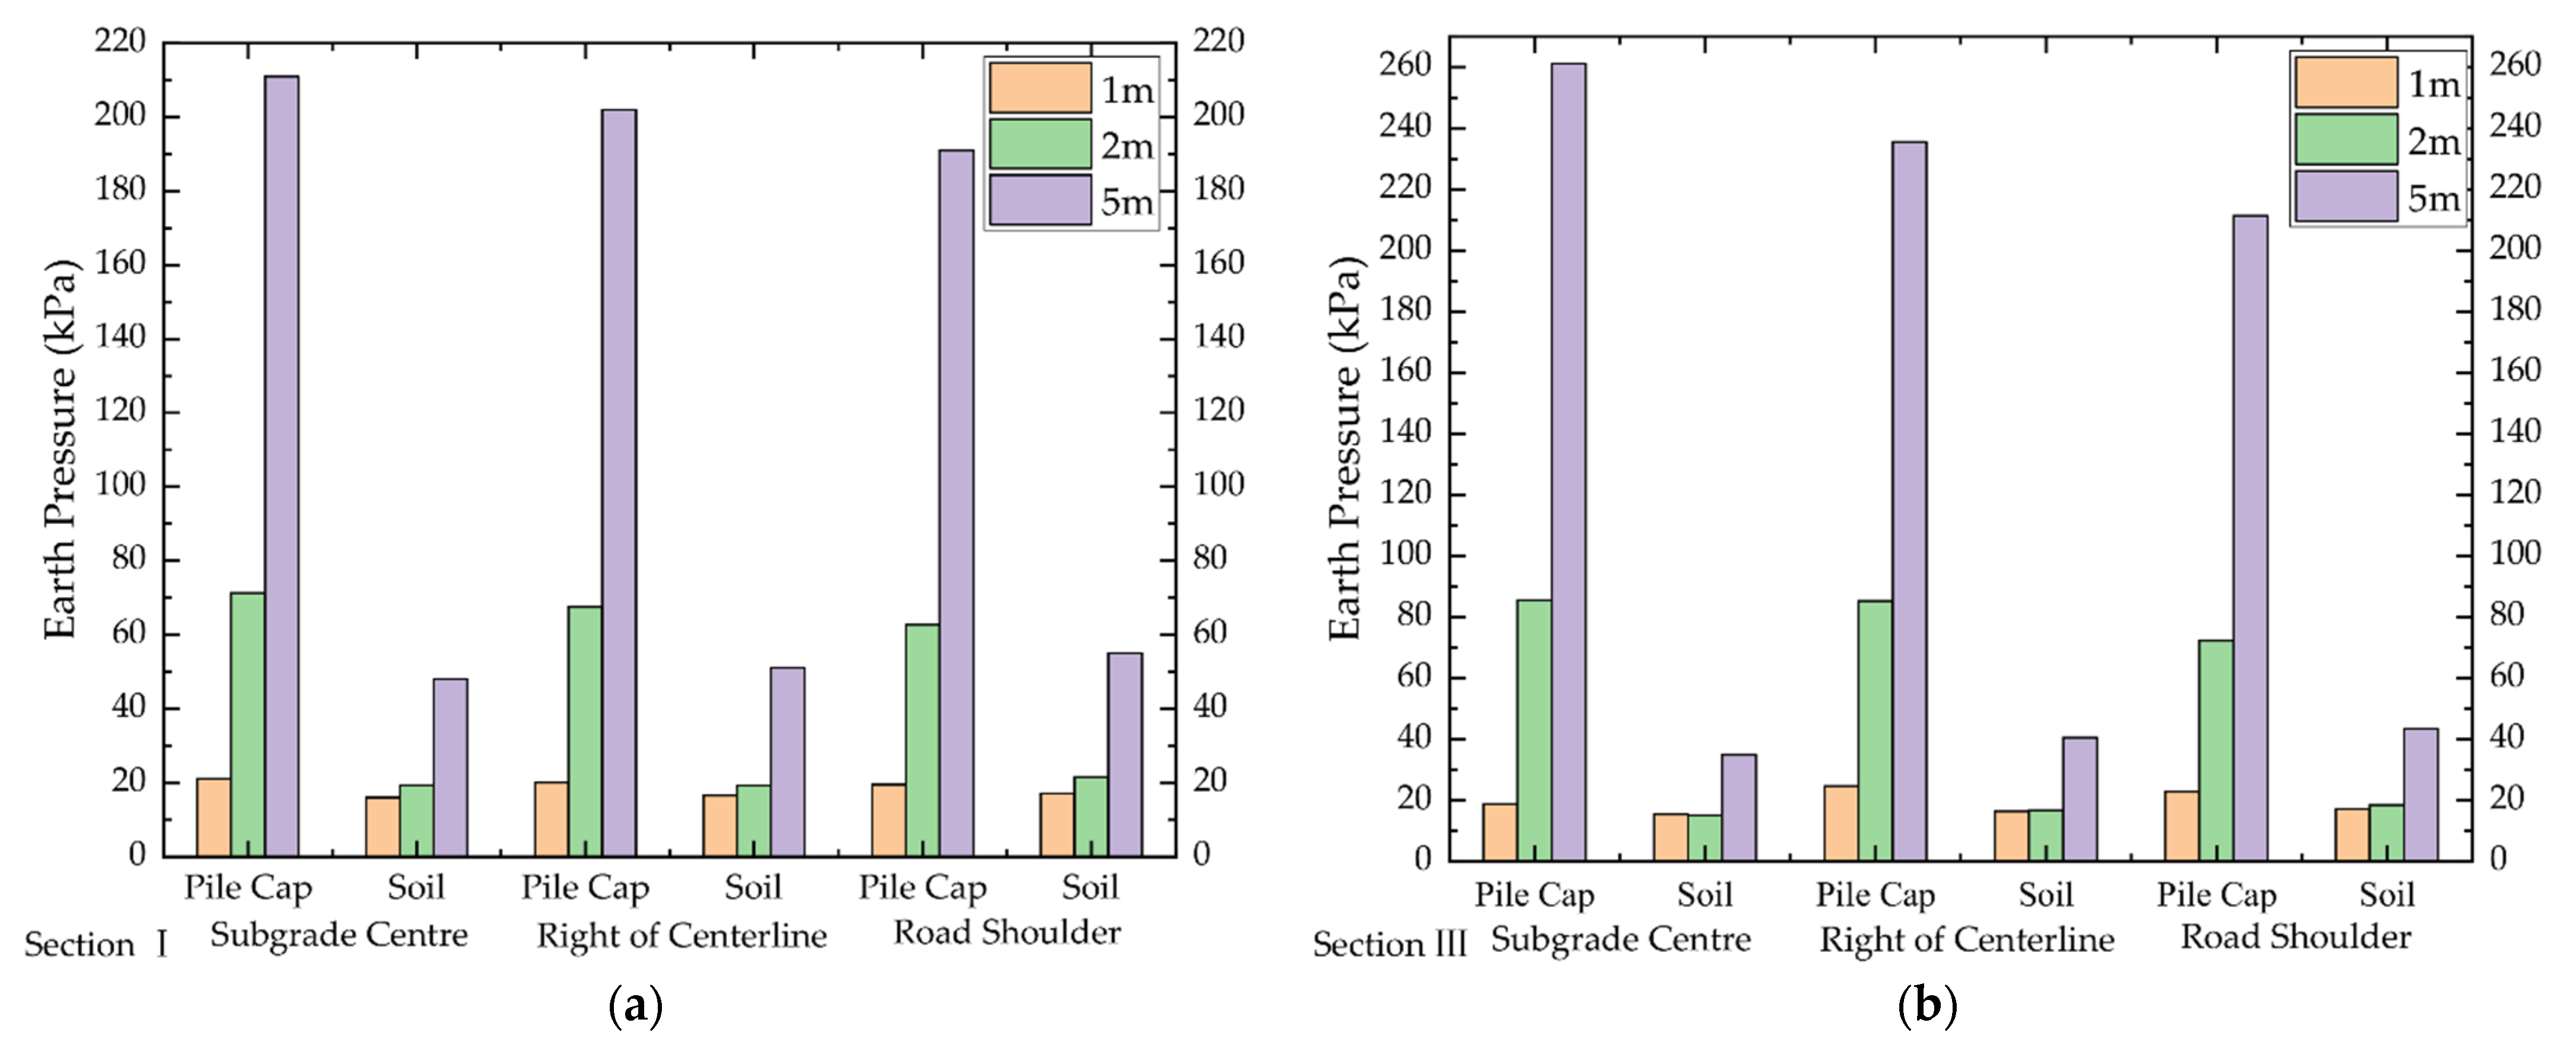
2.2.2. Load Variation Law of Subgrade Cross-Sections
3. Numerical Simulation
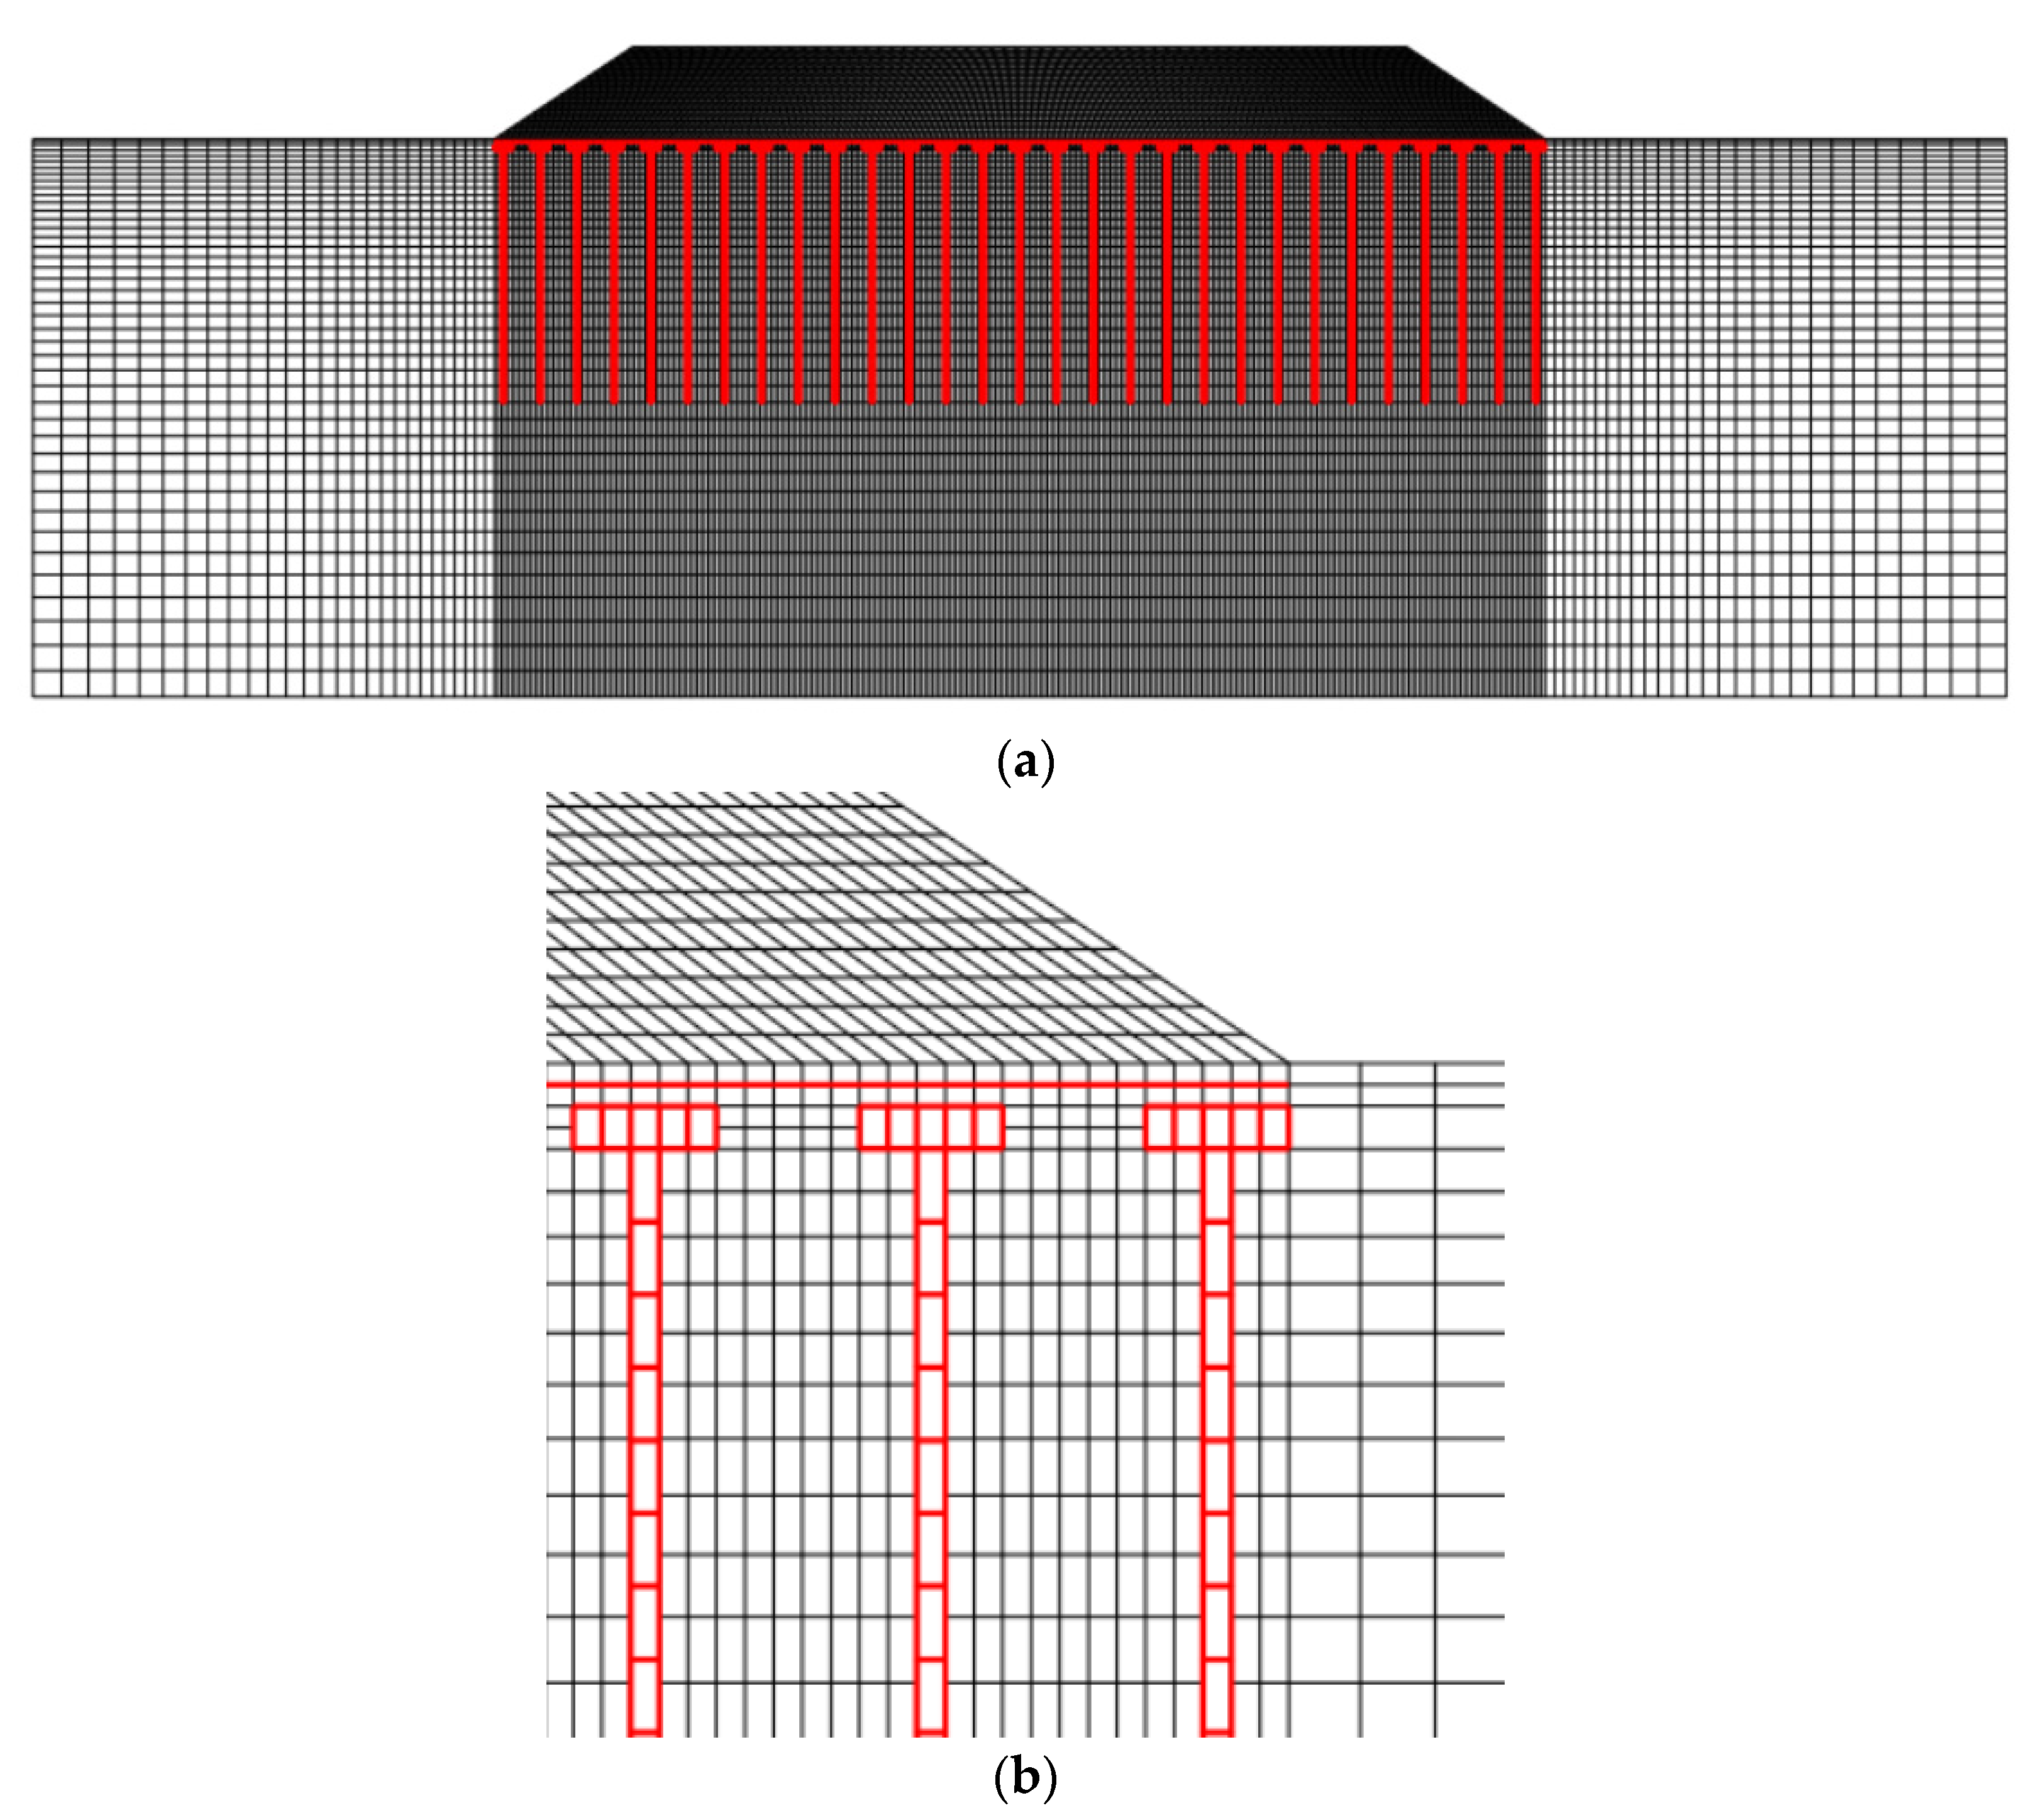
3.1. Numerical Model
3.1.1. Model Establishment and Parameter Selection
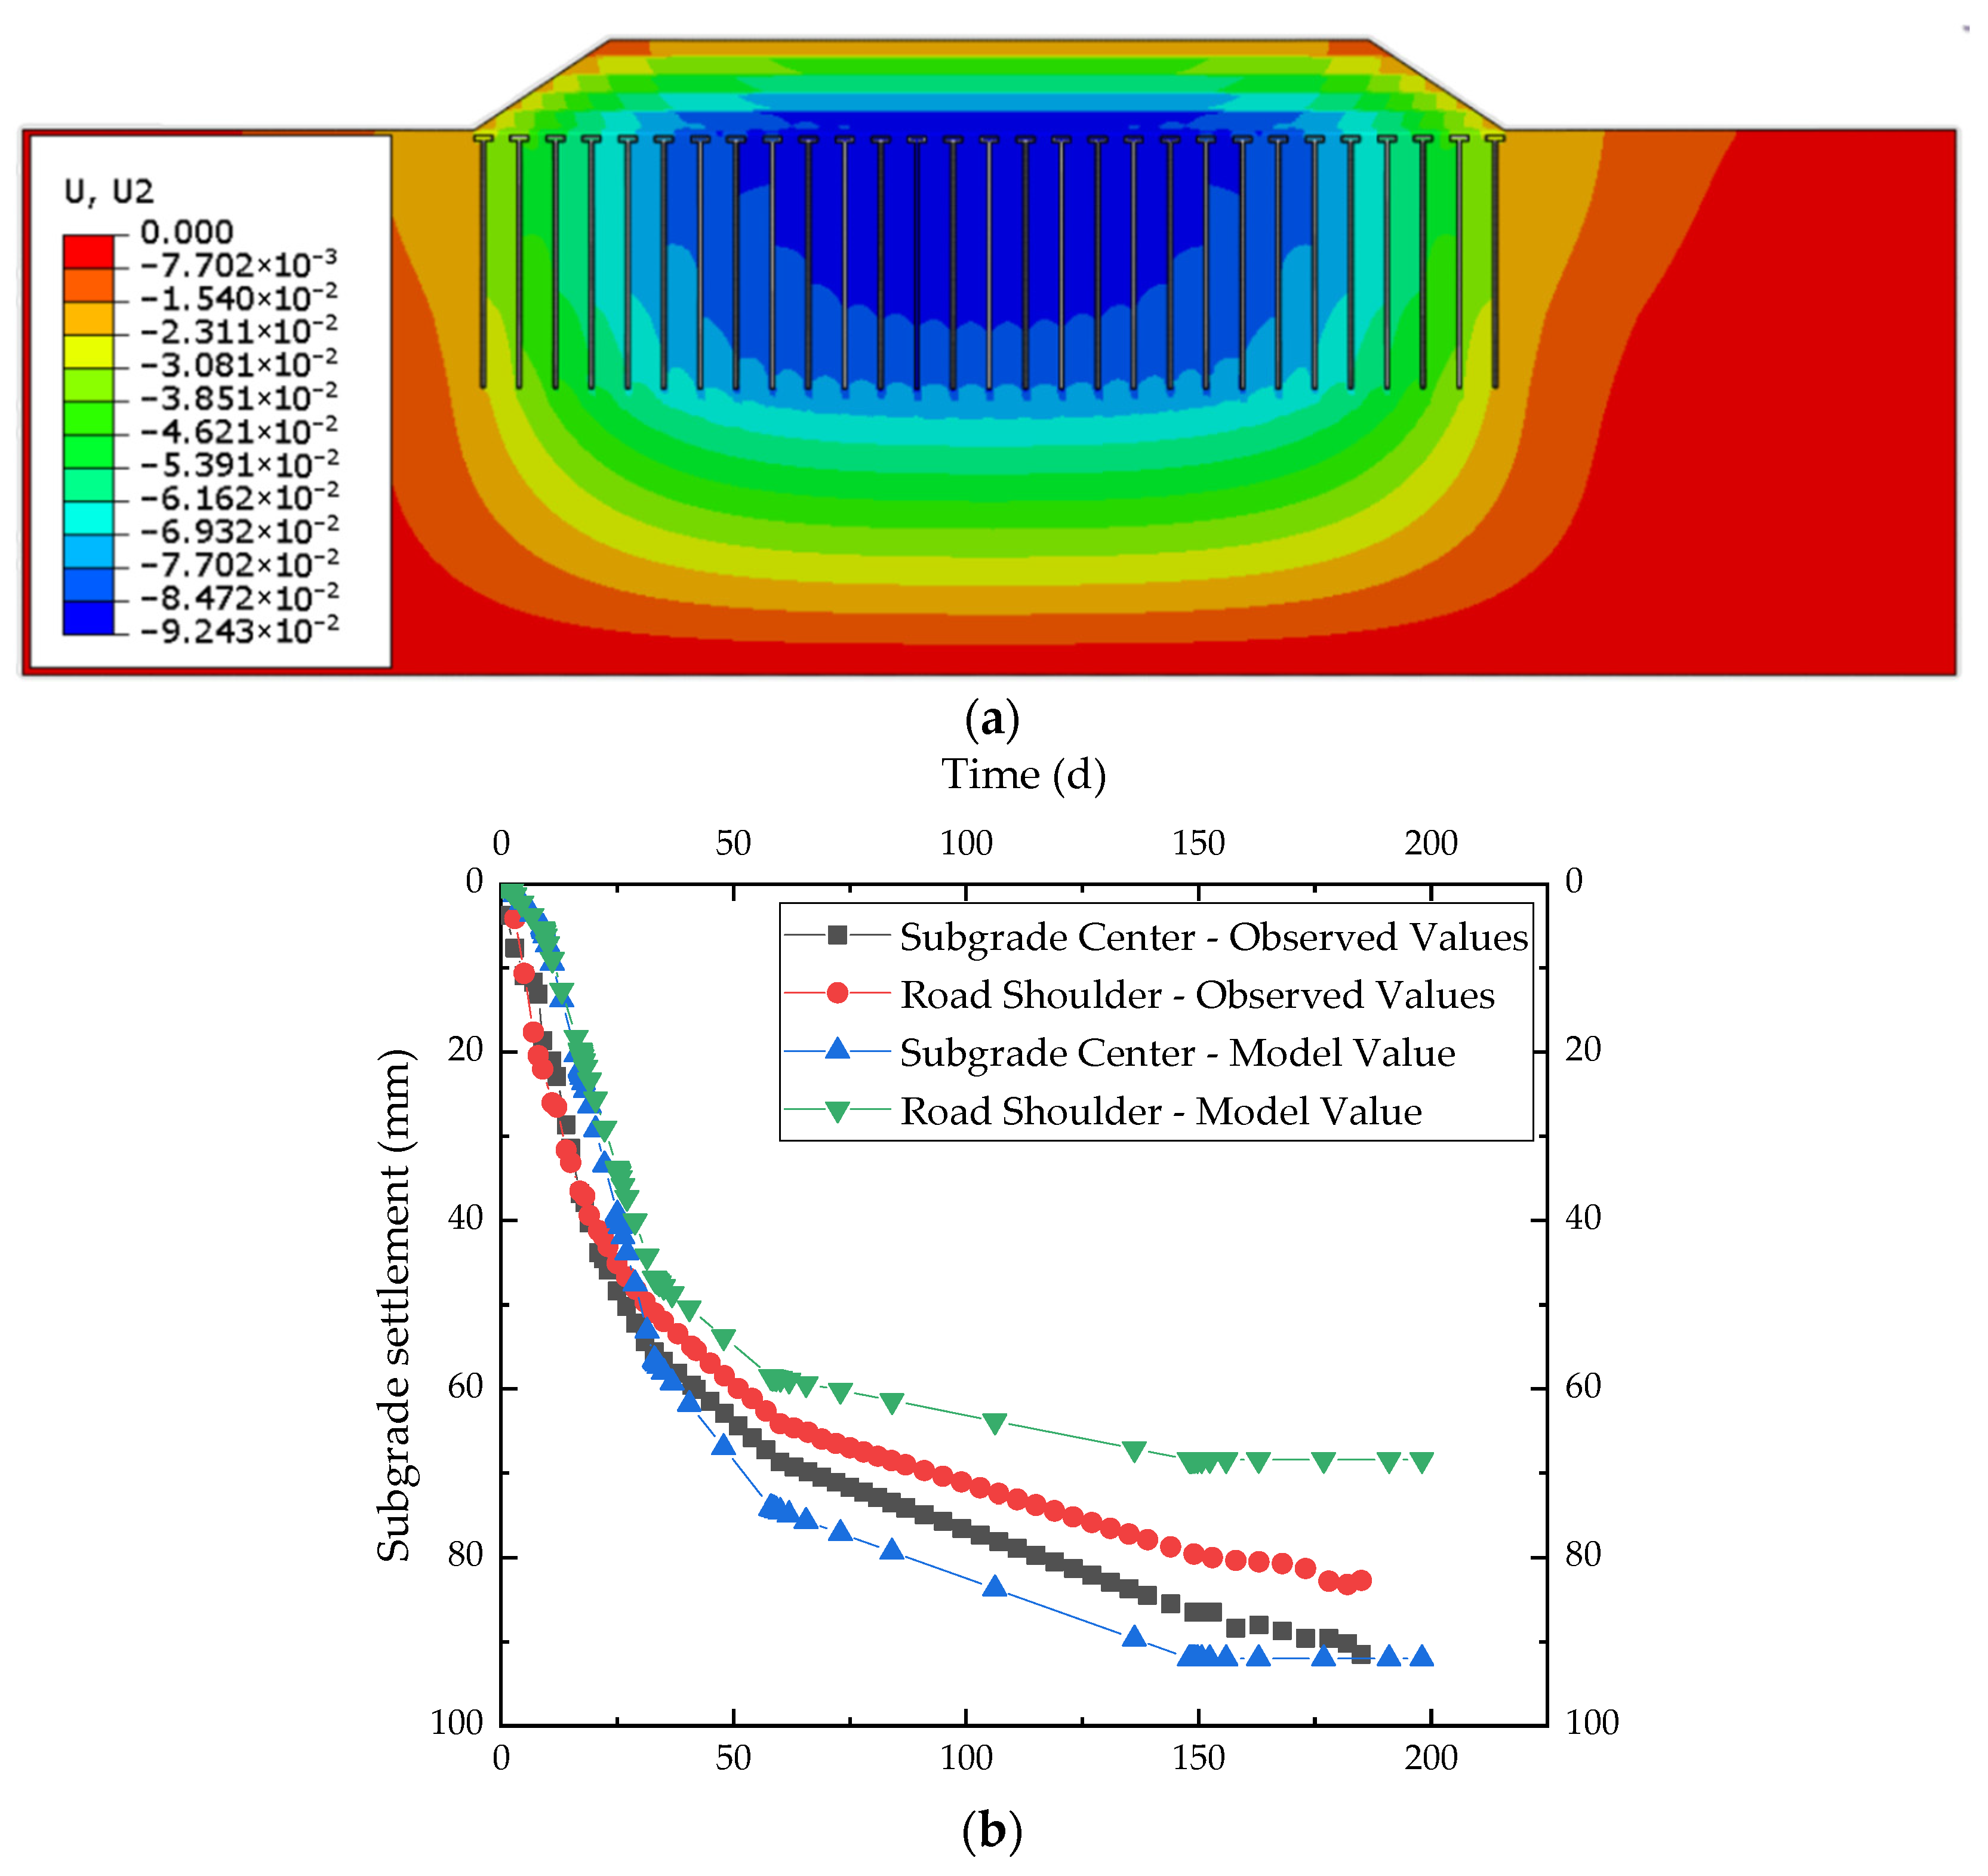
3.1.2. Model Validation
3.2. Analysis of the Numerical Simulation Results
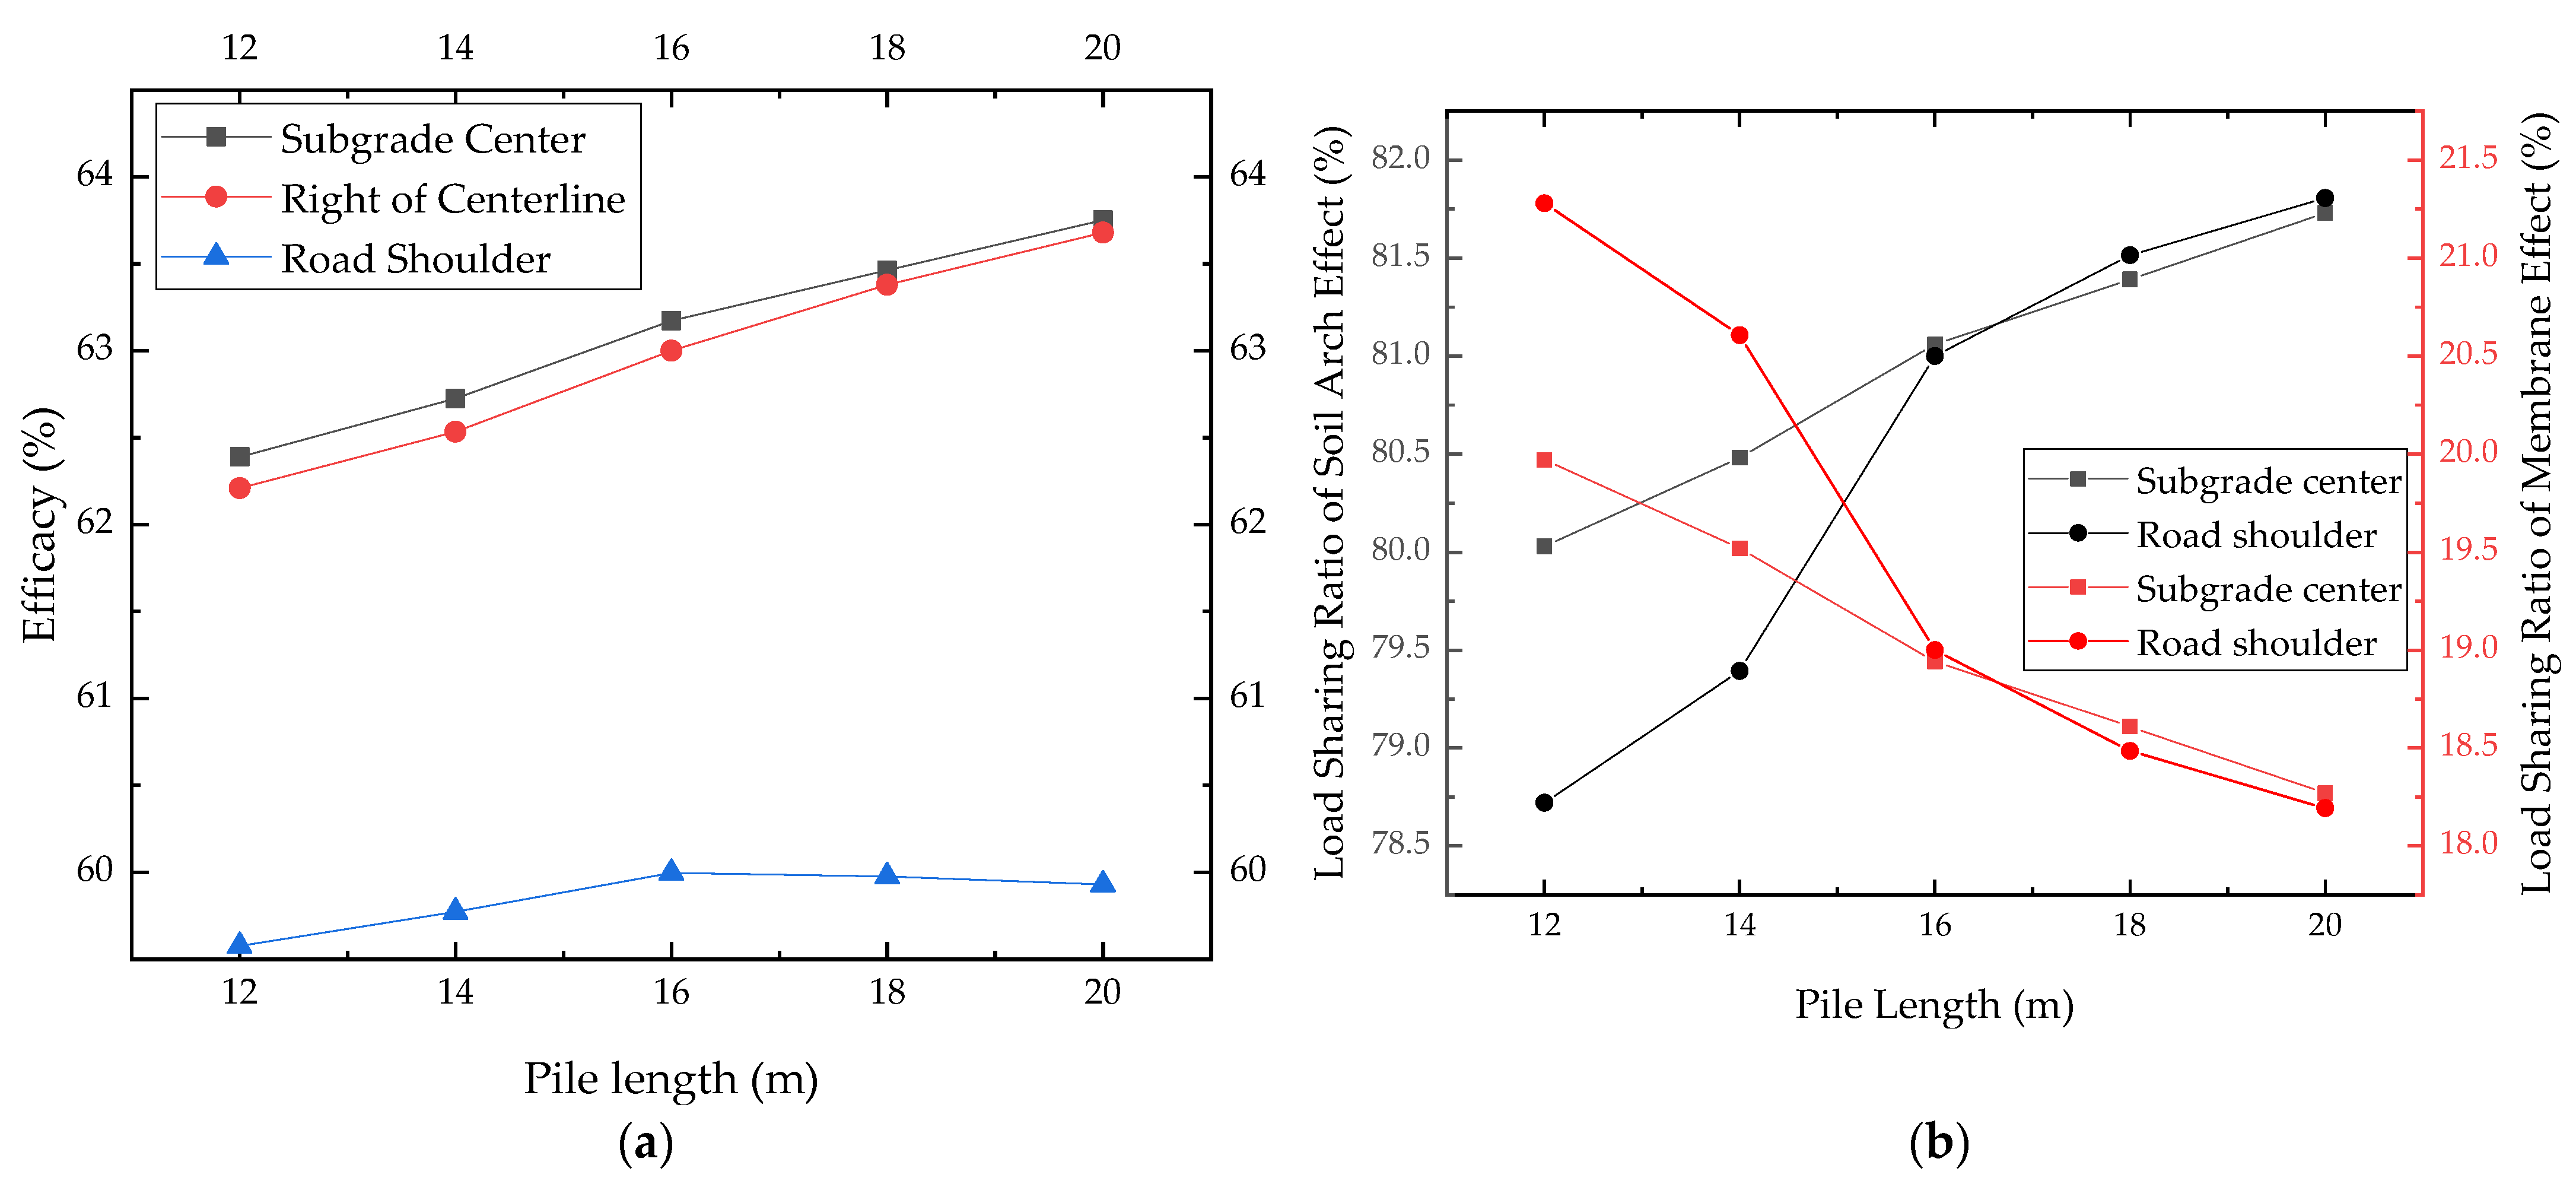
3.2.1. Variation Law of Load Transfer Efficacy
3.2.2. Load Variation Law of Subgrade Cross-Sections
Pile Length
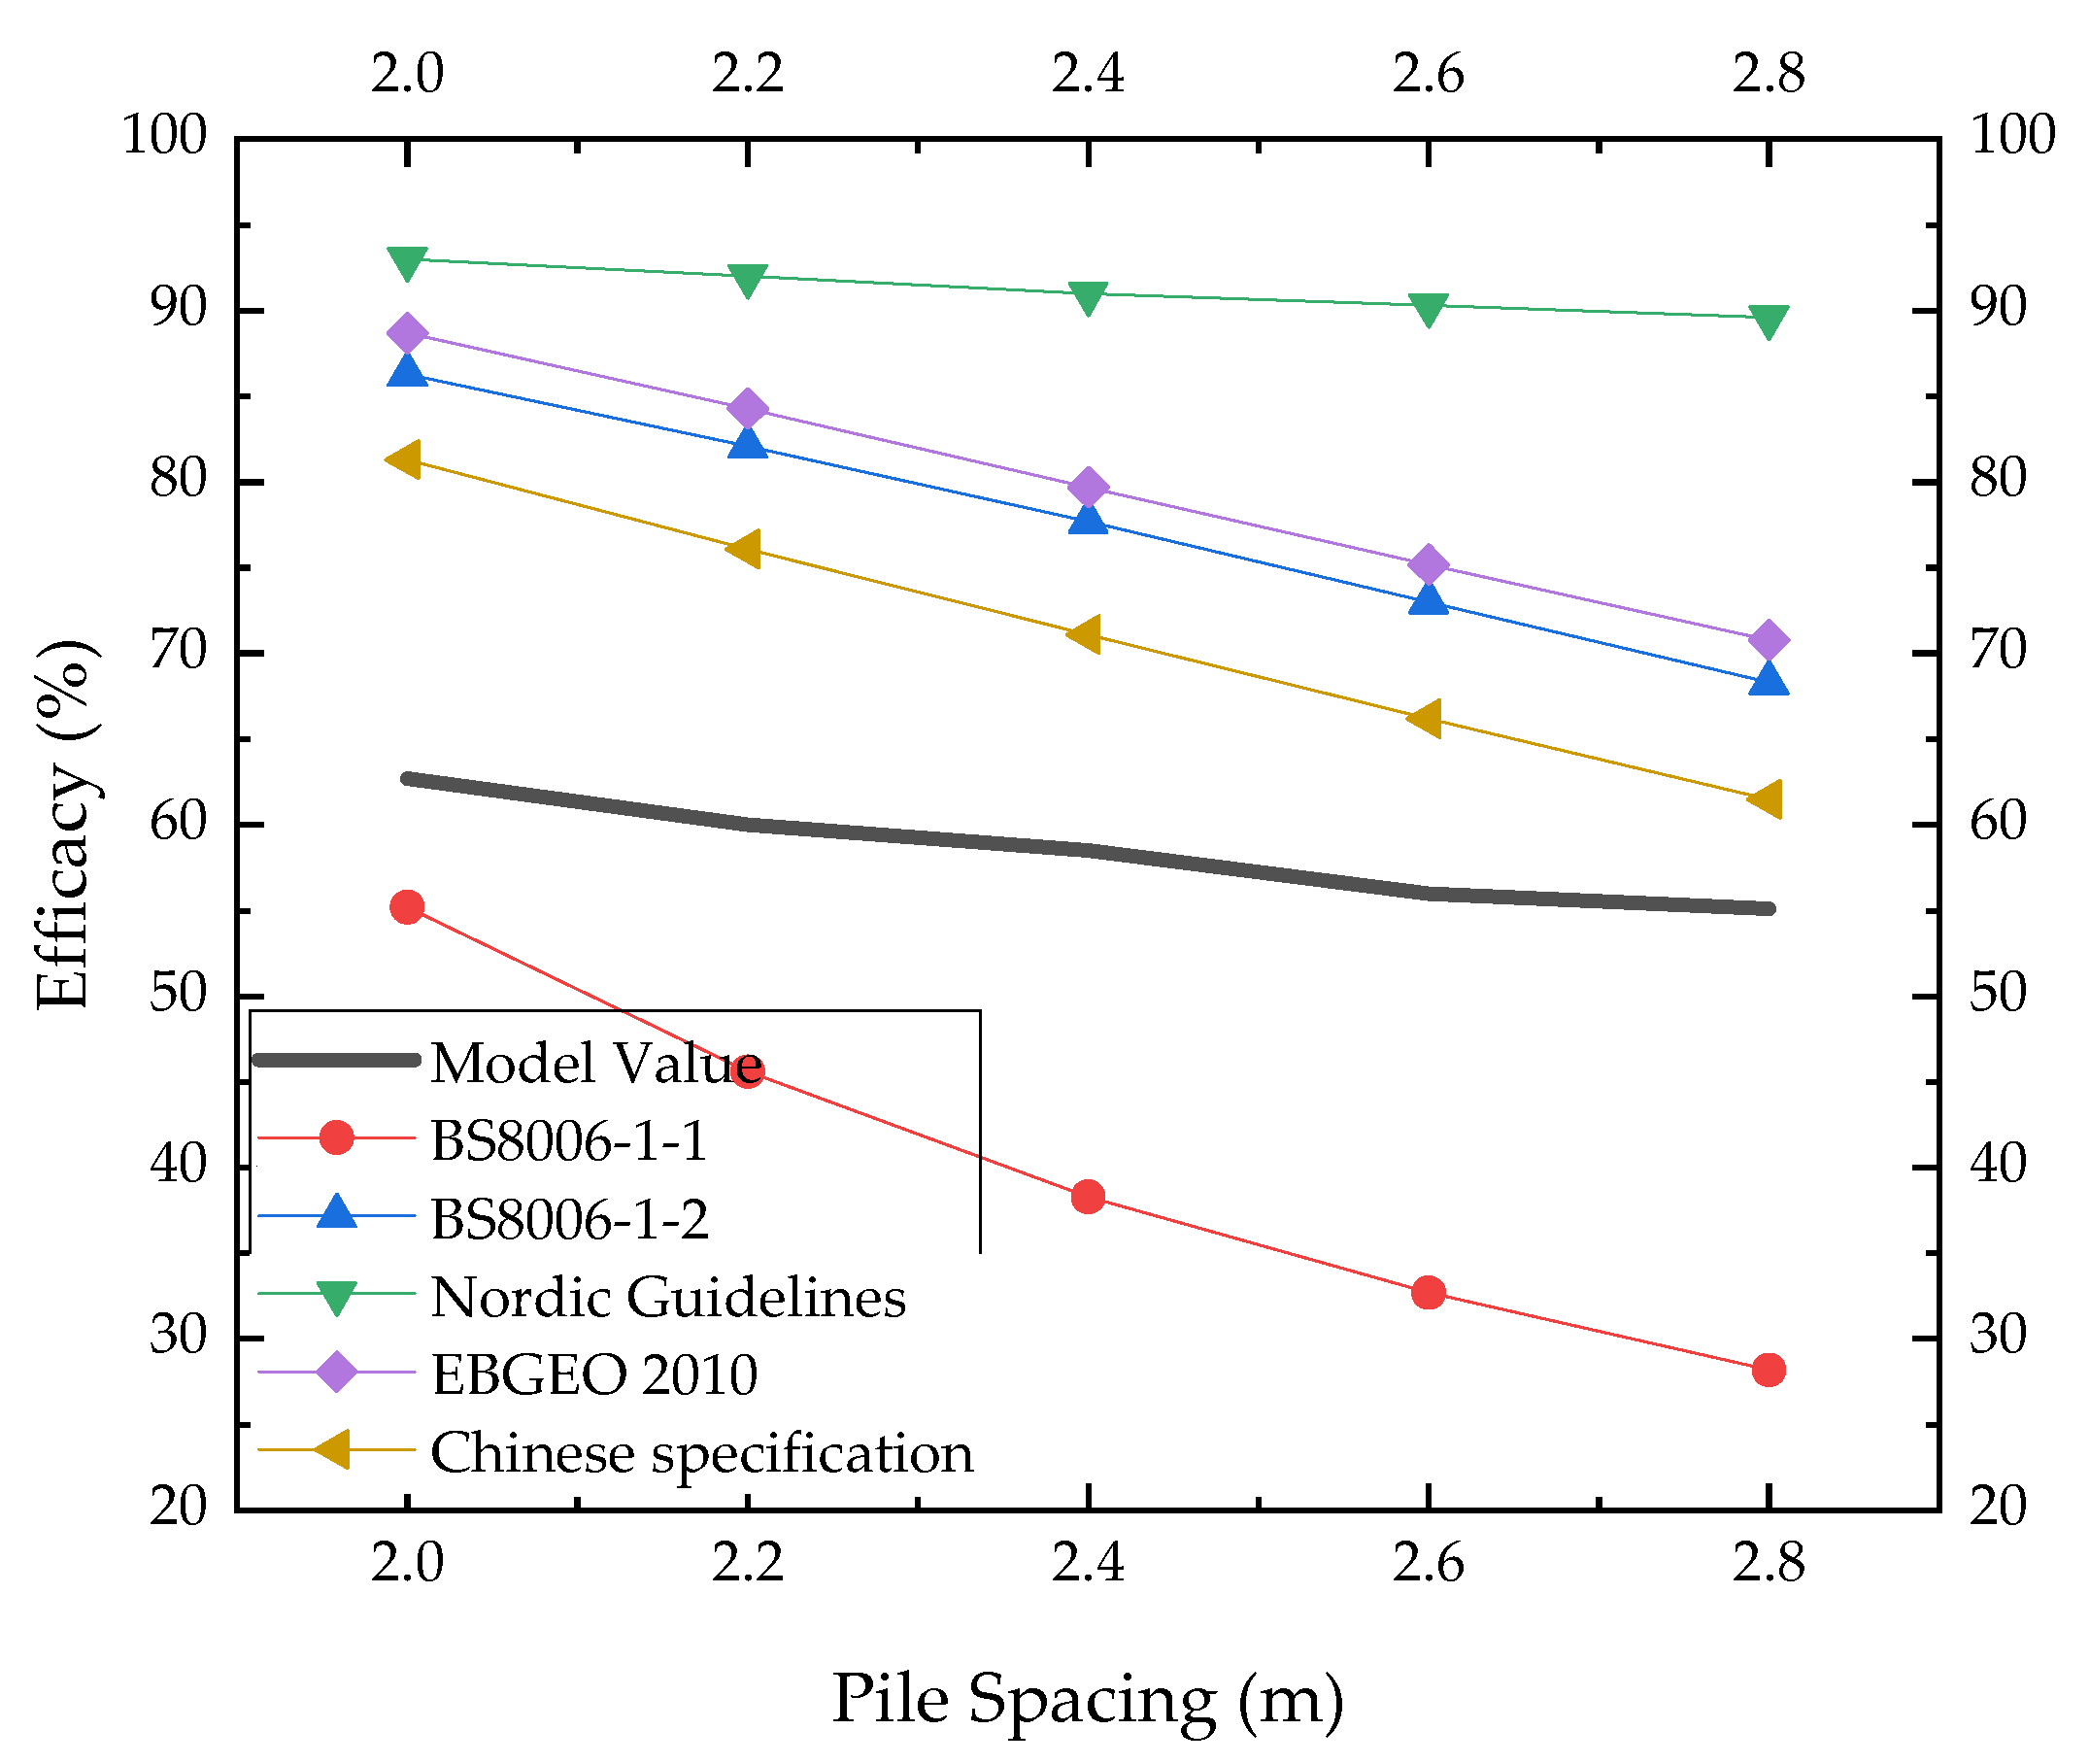
Pile Spacing
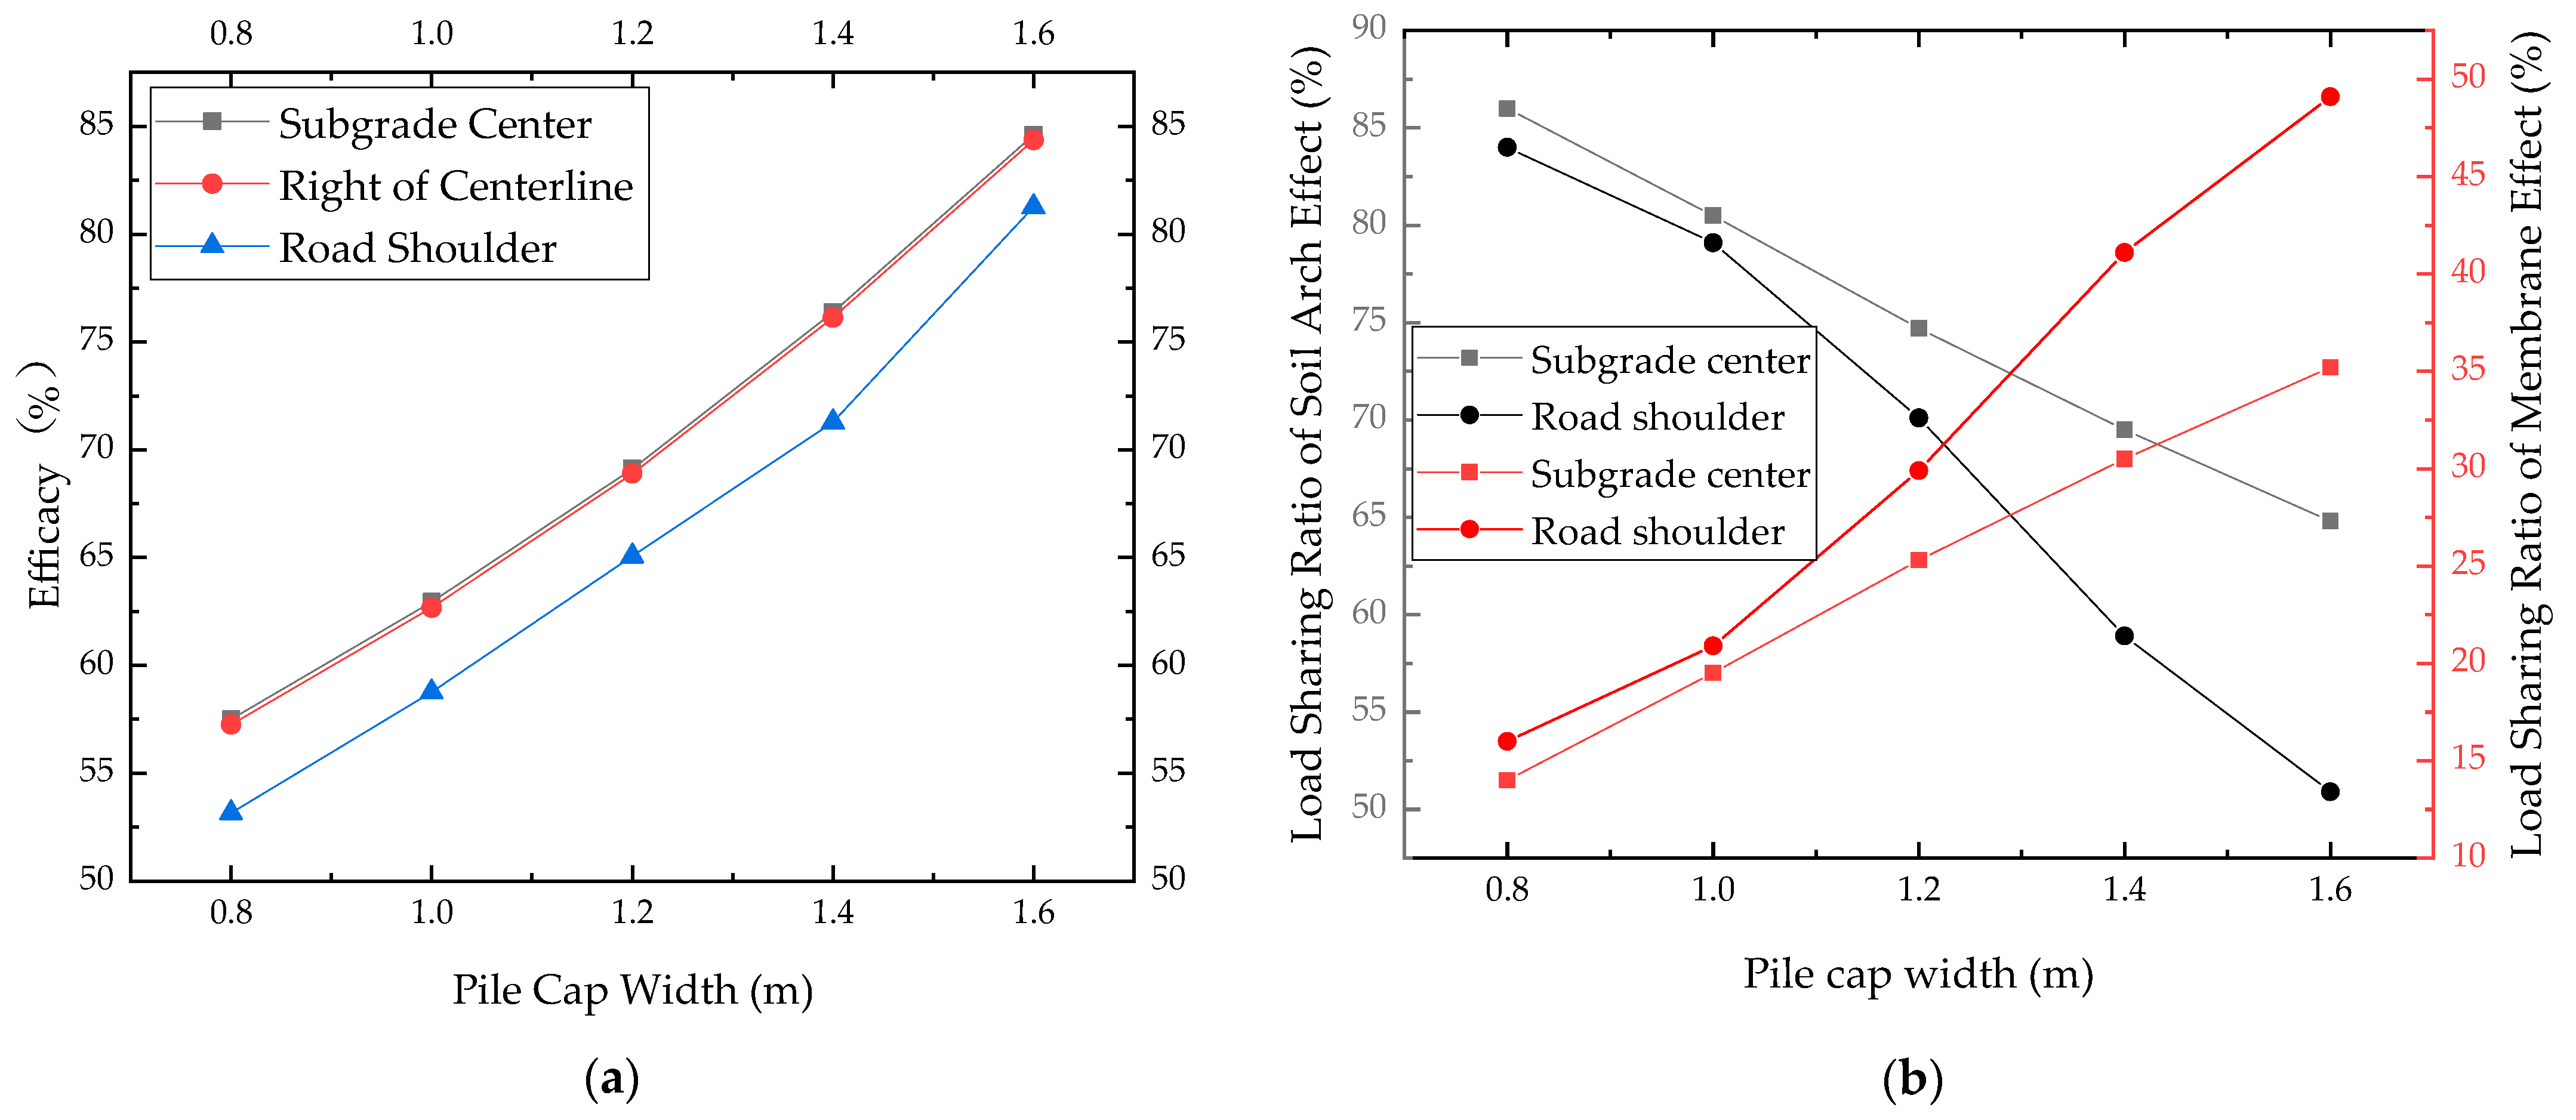
Pile Cap Width
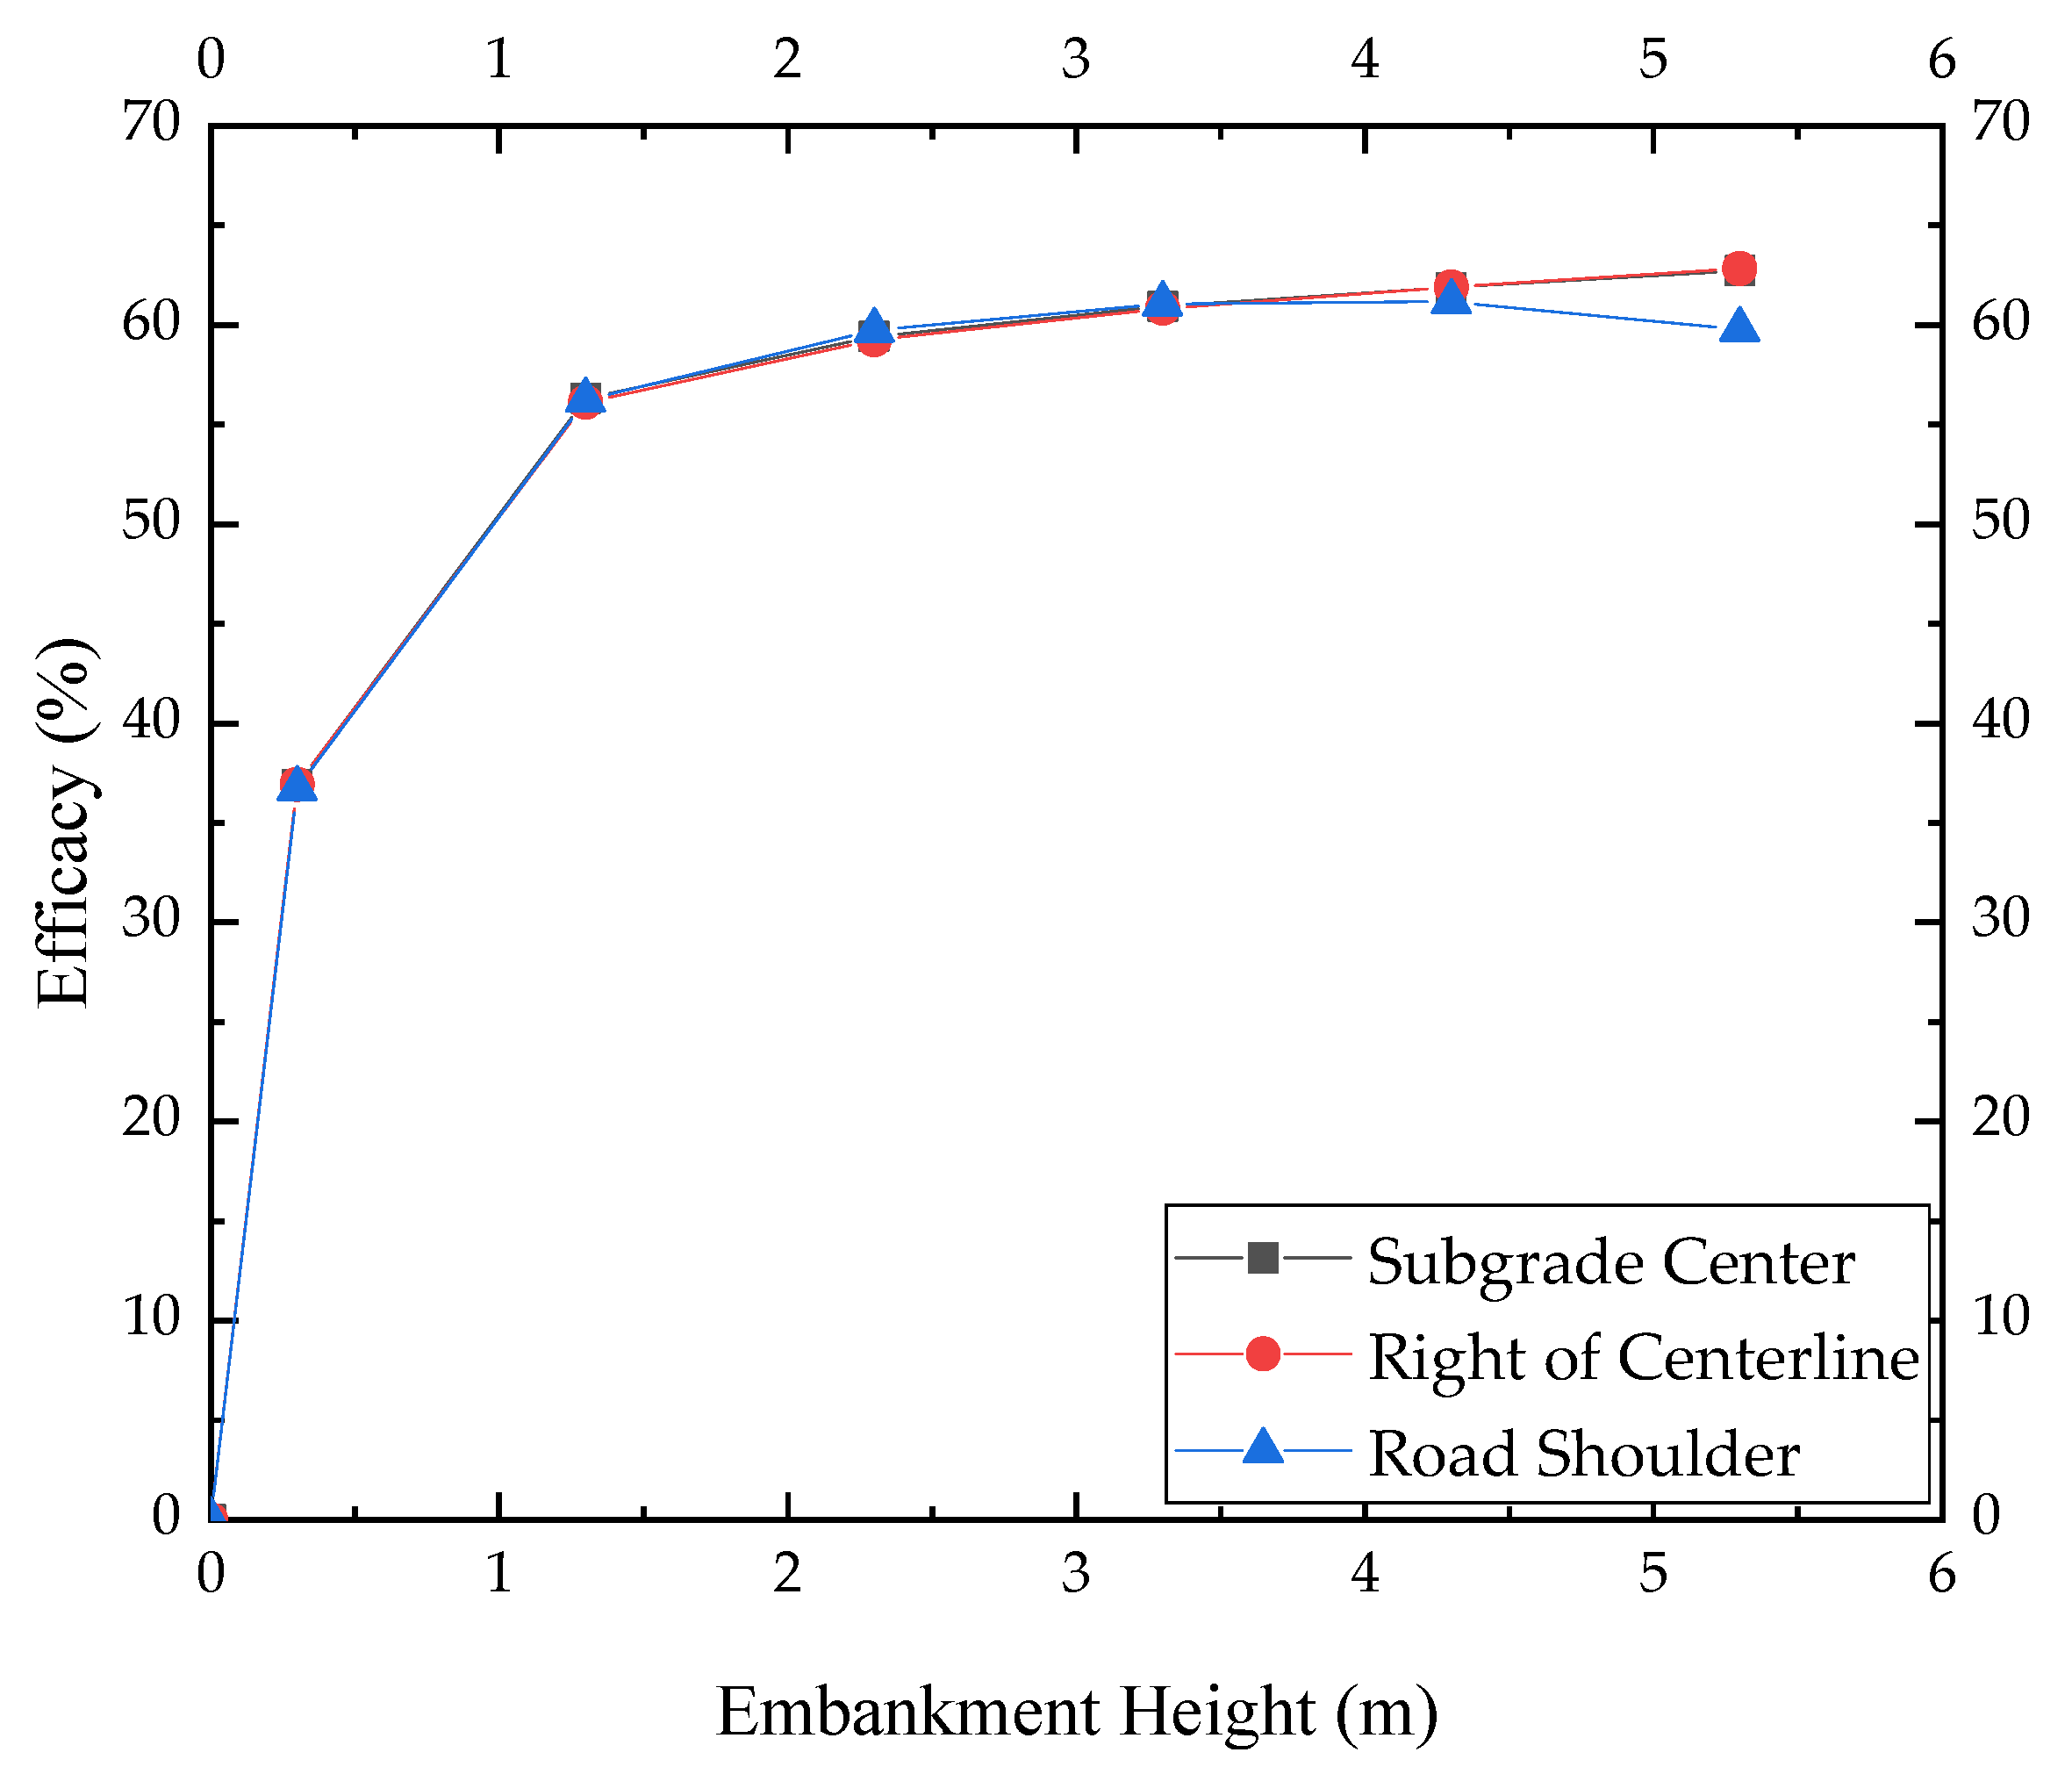
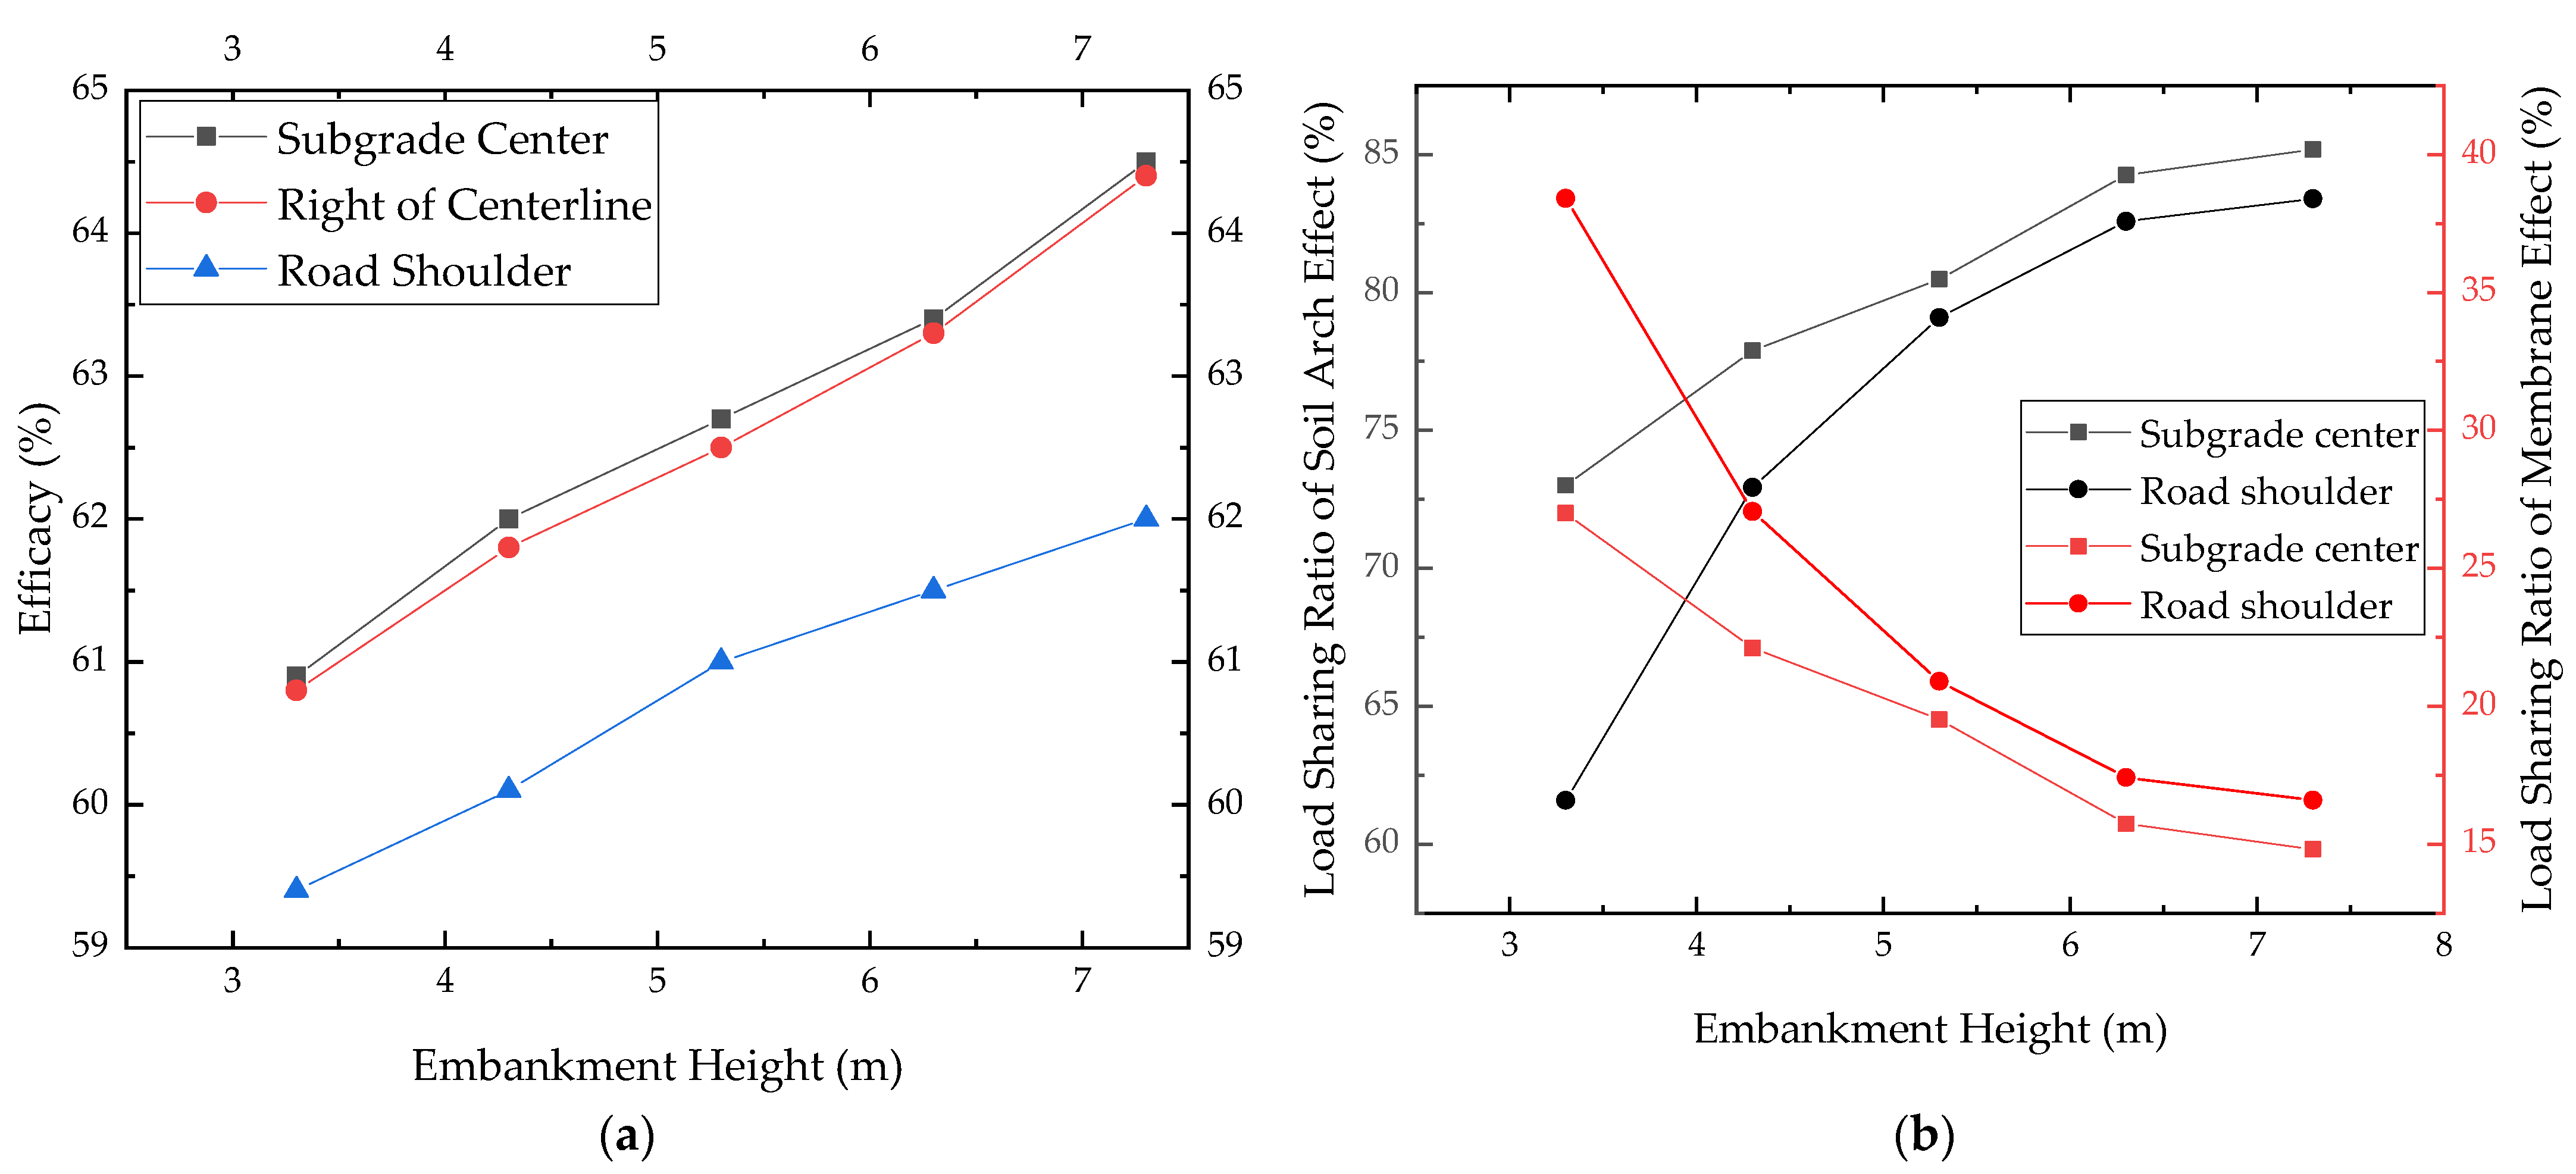
Embankment Height
3.2.3. Sensitivity Analysis of the Influencing Factors
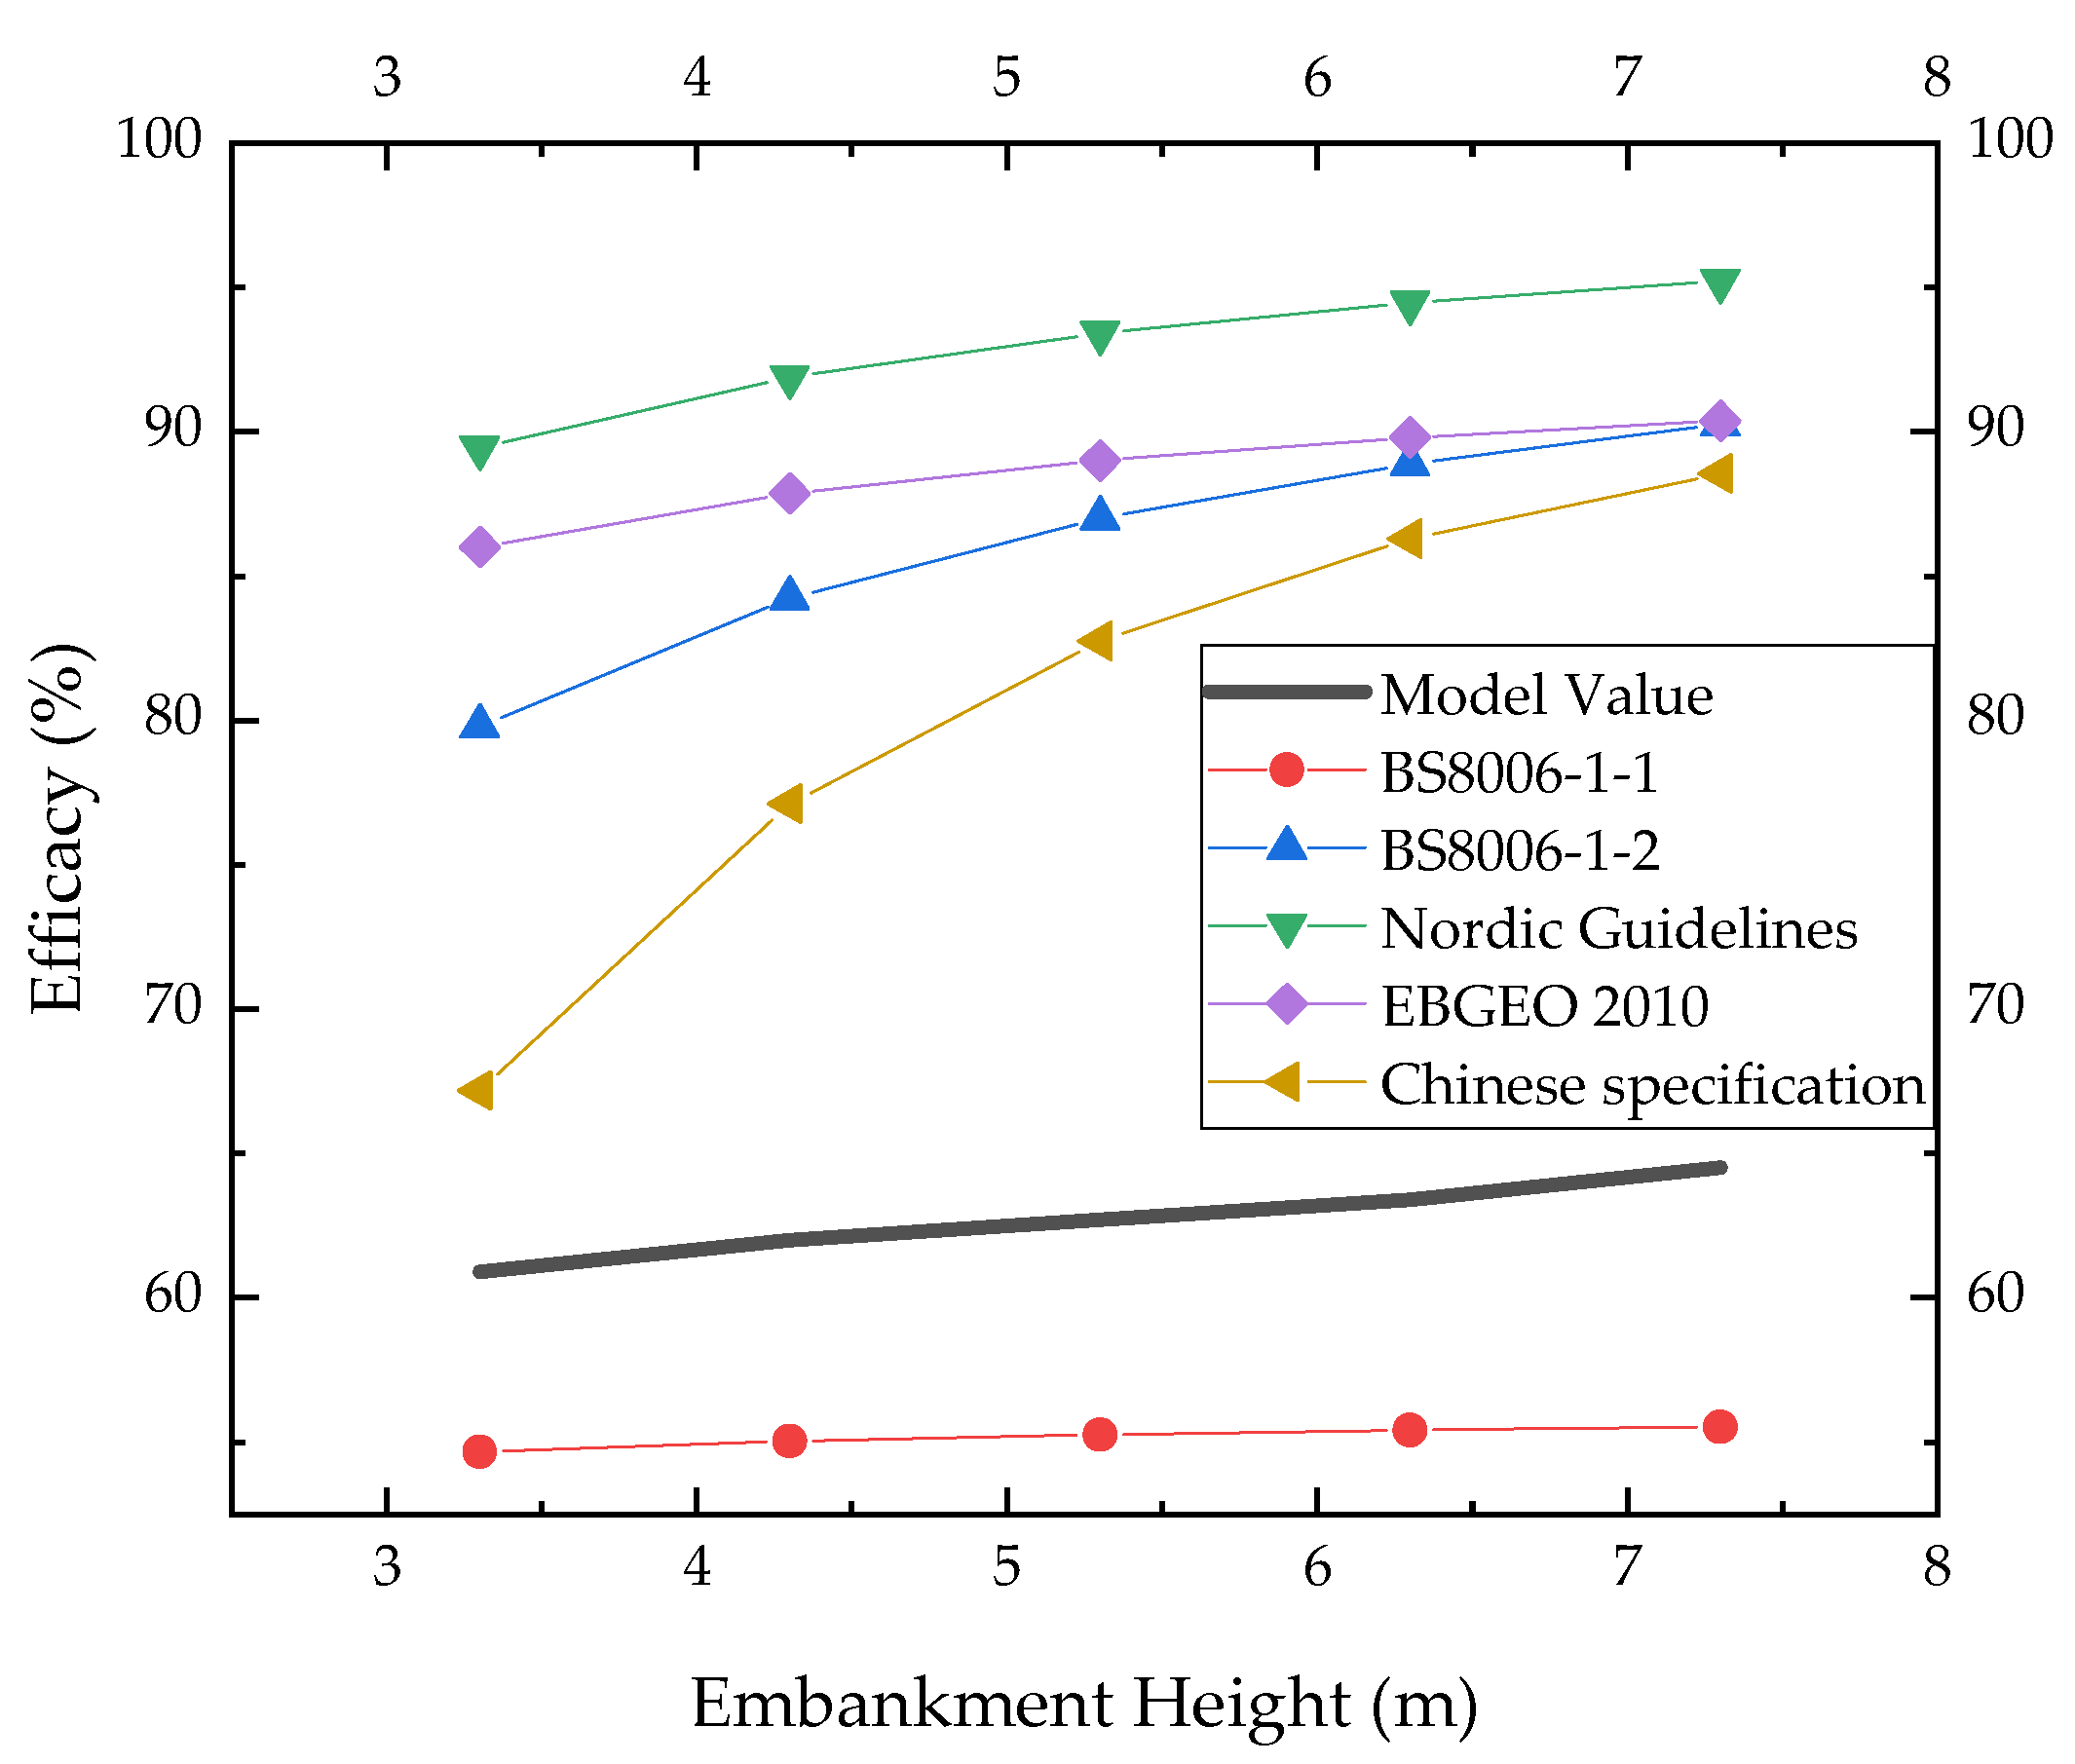
3.3. Comparison between Theoretical Value and Calculated Value
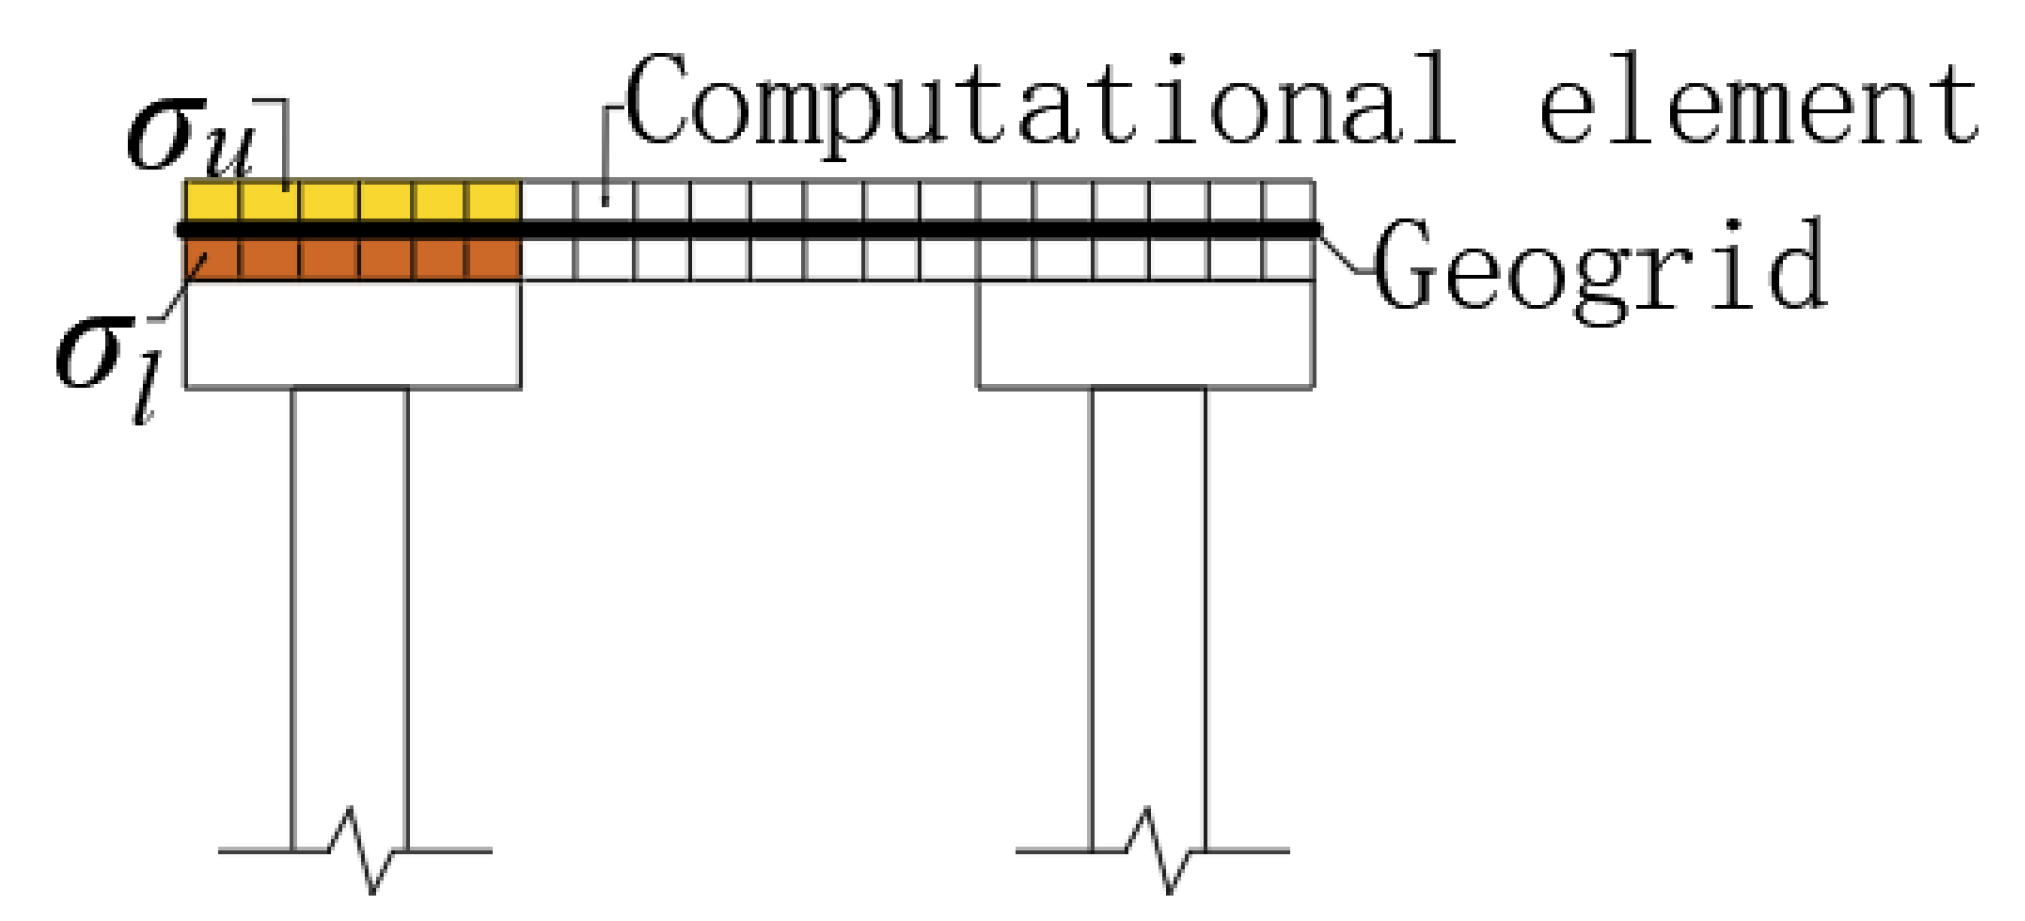
3.3.1. Analysis of Calculation Methods
3.3.2. Analysis of Calculation Results
4. Conclusions
- (1)
- Analysis of influencing factors: Increasing the pile length, pile cap width, and embankment height and reducing the pile spacing will increase the pile load transfer efficacy, that is, a single pile’s bearing capacity will be improved. The pile cap’s width has the greatest influence on the load transfer efficacy, followed by pile spacing, while the pile length and embankment height have less influence on the load transfer efficacy.
- (2)
- Variation law of the load sharing ratio of subgrade cross-sections: Macroscopically, increasing the pile length, pile spacing, and embankment height and reducing the pile cap width can improve the soil arch effect’s load sharing ratio. The load sharing ratio of the soil arch effect at the shoulder is smaller than that at the center of the subgrade, indicating that the deformation of the geogrid at the shoulder is large and the membrane effect is significant. Comparing the load sharing ratio of the soil arch effect of each calculation model, the load ratio of the embankment center is 65–90% and that of the shoulder is 51–88%. It can be seen that the load transfer of the embankment is mainly based on the soil arch effect and supplemented by the tensile membrane effect.
- (3)
- Load variation law of subgrade cross-sections: Compared with the center of subgrade, the load transfer efficacy at 10 m on the right side of the central line decreases by 0.1–1.6% and the load transfer efficacy at the shoulder decreases by 2.5–7.5%. This shows that the variation of the load transfer efficacy of subgrade cross-sections is related to the position of the observation point. From the center of the subgrade to the shoulder, the load transfer efficacy decreases gradually and the load transfer efficacy at the shoulder decreases significantly.
- (4)
- Compared with other codes, the load transfer efficacy calculated according to the Chinese specification and BS8006-1-1 is in good agreement with the simulated value.
Author Contributions
Funding
Data Availability Statement
Conflicts of Interest
References
- Lai, H.-J.; Zheng, J.-J.; Zhang, J.; Zhang, R.-J.; Cui, L. DEM analysis of “soil”-arching within geogrid-reinforced and unreinforced pile-supported embankments. Comput. Geotech. 2014, 61, 13–23. [Google Scholar] [CrossRef]
- Zhang, J.; Jia, Y.; Zheng, Y.; Miao, C. DEM Simulation of the Load Transfer Mechanism of a GRPS Embankment with a Fixed Geogrid Technique. Appl. Sci. 2021, 11, 8814. [Google Scholar] [CrossRef]
- Chen, Y.; Cao, W.; Chen, R. An experimental investigation of soil arching within basal reinforced and unreinforced piled embankments. Geotext. Geomembr. 2008, 28, 167–174. [Google Scholar]
- Wang, X.; Wang, X.; Yang, G.; Zong, Y. Study on Load Transfer Mechanism of Pile-Supported Embankment Based on Response Surface Method. Appl. Sci. 2022, 12, 4905. [Google Scholar] [CrossRef]
- Chew, S.H.; Phoon, H.L. Geotextile reinforced piled embankment-full-scale model tests. In Proceedings of the 3rd Asian Regional Conference on Geosynthetics, Seoul, Korea, 21–23 June 2004; pp. 661–668. [Google Scholar]
- van Eekelen, S.; Bezuijen, A.; van Tol, A. An analytical model for arching in piled embankments. Geotext. Geomembr. 2013, 39, 78–102. [Google Scholar] [CrossRef]
- Hu, S.; Zhuang, Y.; Zhang, X.; Dong, X. A Design Chart for the Analysis of the Maximum Strain of Reinforcement in GRPEs Considering the Arching and Stress History of the Subsoil. Appl. Sci. 2022, 12, 2536. [Google Scholar] [CrossRef]
- Chen, R.P.; Wang, Y.W.; Ye, X.W.; Bian, X.C.; Dong, X.P. Tensile force of geogrids embedded in pile-supported reinforced embankment: A full-scale experimental study. Geotext. Geomembr. 2016, 44, 157–169. [Google Scholar] [CrossRef]
- Yang, G.; Wang, X.; Wang, X.Z.; Zhao, J.J.; Zhang, C. Field Test on Mechanical Behavior of Pile-supported Embankment in Soft Soil Area. Chin. J. Geotech. Eng. 2022, 1–8. Available online: https://kns.cnki.net/kcms/detail/32.1124.tu.20220414.1150.008.html (accessed on 16 April 2022).
- Abusharar, S.W.; Zheng, J.-J.; Chen, B.-G.; Yin, J.-H. A simplified method for analysis of a piled embankment reinforced with geosynthetics. Geotext. Geomembr. 2009, 27, 39–52. [Google Scholar] [CrossRef]
- Pham, T.A. Load-deformation of piled embankments considering geosynthetic membrane effect and interface friction. Geosynth. Int. 2020, 27, 275–300. [Google Scholar] [CrossRef]
- Briançon, L.; Simon, B. Performance of Pile-Supported Embankment over Soft Soil: Full-Scale Experiment. J. Geotech. Geoenviron. Eng. 2012, 138, 551–561. [Google Scholar] [CrossRef]
- Liu, H.L.; Ng, C.W.W.; Fei, K. Performance of a geogrid-reinforced and pile-supported highway embankment over soft clay: Case study. J. Geotech. Geoenviron. Eng. 2007, 133, 1483–1493. [Google Scholar] [CrossRef]
- Wachman, G.S.; Biolzi, L.; Labuz, J.F. Structural behavior of a pile-supported embankment. J. Geotech. Geoenviron. Eng. 2010, 136, 26–34. [Google Scholar] [CrossRef]
- Zheng, J.; Cao, W.; Dong, T.; Zhang, J.; Xie, M. Experimental investigation of geogrid-reinforced and pile-supported embankment on soils with medium-low compressibility. Chin. J. Geotech. Eng. 2015, 37, 1549–1555. [Google Scholar]
- Zheng, J.; Zhang, J.; Ma, Q.; Dong, Y. Experimental investigation of geogrid-reinforced and pile-supported embankment at bridge approach. Chin. J. Geotech. Eng. 2012, 34, 355–362. [Google Scholar]
- Gao, C.L.; Ling, J.M.; Du, H.; Qiu, X.; Yang, G. In-situ test on stress characteristics of composite poundation with sparse t-shaped rigid piles under widening embankment. Chin. J. Rock Mech. Eng. 2008, 27, 354–360. [Google Scholar]
- Hu, Q.; Xie, Q.; Qing, S. Field study of tensile force character of double-layered geogrid in reinforced gravel cushion. Rock Soil Mech. 2007, 28, 799–802. [Google Scholar]
- Xiong, H.; Wu, H.; Bao, X.; Fei, J. Investigating effect of particle shape on suffusion by CFD-DEM modeling. Constr. Build. Mater. 2021, 289, 123043. [Google Scholar] [CrossRef]
- Zhuang, Y.; Ellis, E.A.; Yu, H.S. Threedimensional finite-element analysis of arching in a piled embankment. Geotechnique 2012, 62, 1127–1131. [Google Scholar] [CrossRef]
- Zhuang, Y.; Ellis, E.A. Finite-element analysis of a piled embankment with reinforcement compared with BS 8006 predictions. Geotechnique 2014, 64, 910–917. [Google Scholar] [CrossRef]
- JTG/T D31-02-2013; Technical Guidelines for Design and Construction of Embankment on Soft Ground. China Communications Press: Beijing, China, 2013.
- BS 8006-1: 2010; Code of Practice for Strengthened/Reinforced Soils and Other Fills. British Standard. British Standards Institution: London, UK, 2010.
- EBGEO 2010; Recommendations for Design and Analysis of Earth Structures Using Geosynthetic Reinforcements. German Geotechnical Society: Berlin, Germany, 2010; ISBN 978-3-433-02983-1.
- Nordic Geotechnical Group. Nordic Guidelines for Reinforced Soils and Fills; Nordic Geotechnical Group: Stockholm, Sweden, 2004. [Google Scholar]
- Hewlett, W.J.; Randolph, M.F. Analysis of piled embankment. Ground Eng. 1988, 21, 12–18. [Google Scholar]
- Chen, Y.; Jia, N.; Chen, R. soil arch analysis of pile-supported embankment. China J. Highw. Transp. 2004, 17, 4–9. [Google Scholar]
- Marston, A.; Anderson, A.O. The Theory of Loads on Pipes in Ditches and Tests of Cement and Clay Drain Tile and Sewer Pipe; Bulletin: IA Engineering Experimental Station; Iowa State College: Ames, IA, USA, 1913; p. 31. [Google Scholar]
- Zaeske, D.; Kempfert, H.G. Calculation and mechanism of unreinforced and reinforced base layers on point and line-shaped support members. Civ. Eng. 2002, 77, 80–86. [Google Scholar]
- Carlsson, B. Reinforced Soil, Principles for Calculation; Terratema AB: Linöping, Sweden, 1987. [Google Scholar]


| Section Number | Foundation Treatment Method | Cushion Thickness (m) | Embankment Height (m) | Pile Length (m) | Pile Diameter (m) | Pile Spacing (m) |
|---|---|---|---|---|---|---|
| Section I | prestressed pipe pile and gravel cushion | 0.3 | 7.2 | 14 | 0.4 | 2.0 |
| Section II | prestressed pipe pile and gravel cushion | 0.3 | 7.2 | 14 | 0.4 | 2.5 |
| Section III | prestressed pipe pile, geogrid, and gravel cushion | 0.3 | 5.3 | 14 | 0.4 | 2.0 |
| Section IV | prestressed pipe pile and gravel cushion | 0.3 | 5.0 | 14 | 0.4 | 2.5 |
| No. | End of Construction Period | End of Observation Period | Decreasing Rate (%) |
|---|---|---|---|
| Section I | 4.7 | 4.3 | 8.5 |
| Section II | 6.7 | 6.3 | 6 |
| Section III | 7.7 | 6.9 | 10.5 |
| Section IV | 4.3 | 4 | 6.9 |
| Material | Thickness (Length) (m) | Volume Weight (kN/m3) | E (MPa) | Poisson Ratio | Internal Friction Angle (°) | Cohesion (kPa) | Moisture Content (%) | Void Ratio | Permeability Coefficient (10−5 m/d) |
|---|---|---|---|---|---|---|---|---|---|
| Pile | 12–20 | 25 | 20,000 | 0.2 | - | - | - | - | - |
| Geogrid | - | - | 10 | 0.2 | - | - | - | - | - |
| Cushion | 0.3 | 20 | 20 | 0.3 | 37 | 6 | - | - | - |
| Embankment | 3–7 | 18.5 | 15 | 0.35 | 30 | 6 | - | - | - |
| 1. silty clay | 4 | 19.2 | 6.3 | 0.34 | 13.8 | 24.5 | 24.9 | 0.778 | 6.1 |
| 2. silt | 6 | 19.1 | 8.7 | 0.28 | 20.8 | 11.5 | 21.2 | 0.718 | 5.9 |
| 3. silty clay | 3 | 19.6 | 5.9 | 0.28 | 12.9 | 24.7 | 24.2 | 0.737 | 5.8 |
| 4. silty clay | 9 | 18.9 | 4.1 | 0.28 | 15.5 | 18.5 | 33.5 | 0.932 | 6.3 |
| 5. silt | 8 | 20.4 | 8.8 | 0.28 | 21.3 | 12.8 | 19.8 | 0.588 | 6.2 |
| NO. | Influencing Factor | Declaration | |||
|---|---|---|---|---|---|
| Embankment Height (m) | Pile Spacing (m) | Pile Cap Width (m) | Pile Length (m) | ||
| 1 | 5.3 | 2 | 1 | 14 | Model validation |
| 2 | 5.3 | 2 | 1 | 12 | Models 1, 2, 3, 4, and 5 analyze the effect of pile length |
| 3 | 5.3 | 2 | 1 | 16 | |
| 4 | 5.3 | 2 | 1 | 18 | |
| 5 | 5.3 | 2 | 1 | 20 | |
| 6 | 5.3 | 2.2 | 1 | 14 | Models 1, 6, 7, 8, and 9 analyze the effect of pile spacing |
| 7 | 5.3 | 2.4 | 1 | 14 | |
| 8 | 5.3 | 2.6 | 1 | 14 | |
| 9 | 5.3 | 2.8 | 1 | 14 | |
| 10 | 5.3 | 2 | 0.8 | 14 | Models 1, 10, 11, 12, and 13 analyze the effect of pile cap width |
| 11 | 5.3 | 2 | 1.2 | 14 | |
| 12 | 5.3 | 2 | 1.4 | 14 | |
| 13 | 5.3 | 2 | 1.6 | 14 | |
| 14 | 3.3 | 2 | 1 | 14 | Models 1, 14, 15, 16, and 17 analyze the effect of embankment height |
| 15 | 4.3 | 2 | 1 | 14 | |
| 16 | 6.3 | 2 | 1 | 14 | |
| 17 | 7.3 | 2 | 1 | 14 | |
| Pile Length (m) | Pile–Soil Differential Settlement (mm) | ||
|---|---|---|---|
| Subgrade Center | Right of Centerline | Road Shoulder | |
| 12 | 6 | 5 | 1 |
| 14 | 6 | 5 | 2 |
| 16 | 6 | 5 | 1 |
| 18 | 7 | 6 | 1 |
| 20 | 7 | 6 | 1 |
| Pile Spacing (m) | Pile–Soil Differential Settlement (mm) | ||
|---|---|---|---|
| Subgrade Center | Right of Centerline | Road Shoulder | |
| 2 | 6 | 5 | 2 |
| 2.2 | 8 | 7 | 3 |
| 2.4 | 10 | 8 | 2 |
| 2.6 | 11 | 9 | 4 |
| 2.8 | 13 | 11 | 5 |
| Pile Cap Width (m) | Pile–Soil Differential Settlement (mm) | ||
|---|---|---|---|
| Subgrade Center | Right of Centerline | Road Shoulder | |
| 0.8 | 8 | 7 | 2 |
| 1 | 6 | 5 | 2 |
| 1.2 | 5 | 4 | 2 |
| 1.4 | 4 | 3 | 1 |
| 1.6 | 3 | 2 | 1 |
| Embankment Height (m) | Pile–Soil Differential Settlement (mm) | ||
|---|---|---|---|
| Subgrade Center | Right of Centerline | Road Shoulder | |
| 3.3 | 4 | 3 | 1 |
| 4.3 | 5 | 4 | 1 |
| 5.3 | 6 | 5 | 2 |
| 6.3 | 7 | 6 | 2 |
| 7.3 | 9 | 8 | 2 |
| Influencing Factor | Evaluation Scope | Sensitivity Coefficient |SAF| |
|---|---|---|
| Pile length (m) | 12–20 | 0.17 |
| Pile spacing (m) | 2.2–2.8 | 1.43 |
| Pile cap width (m) | 0.8–1.6 | 2.03 |
| Embankment height (m) | 3.3–7.3 | 0.27 |
Publisher’s Note: MDPI stays neutral with regard to jurisdictional claims in published maps and institutional affiliations. |
© 2022 by the authors. Licensee MDPI, Basel, Switzerland. This article is an open access article distributed under the terms and conditions of the Creative Commons Attribution (CC BY) license (https://creativecommons.org/licenses/by/4.0/).
Share and Cite
Wang, X.; Wang, X.; Yang, G.; Yang, X.; Zhang, D. Research on the Load Transfer Law of Cross-Sections of Pile-Supported Reinforced Embankments Based on the Finite Element Method. Sustainability 2022, 14, 7831. https://doi.org/10.3390/su14137831
Wang X, Wang X, Yang G, Yang X, Zhang D. Research on the Load Transfer Law of Cross-Sections of Pile-Supported Reinforced Embankments Based on the Finite Element Method. Sustainability. 2022; 14(13):7831. https://doi.org/10.3390/su14137831
Chicago/Turabian StyleWang, Xin, Xizhao Wang, Guangqing Yang, Xiang Yang, and Da Zhang. 2022. "Research on the Load Transfer Law of Cross-Sections of Pile-Supported Reinforced Embankments Based on the Finite Element Method" Sustainability 14, no. 13: 7831. https://doi.org/10.3390/su14137831
APA StyleWang, X., Wang, X., Yang, G., Yang, X., & Zhang, D. (2022). Research on the Load Transfer Law of Cross-Sections of Pile-Supported Reinforced Embankments Based on the Finite Element Method. Sustainability, 14(13), 7831. https://doi.org/10.3390/su14137831