Article

Design and Implementation of Quantity Calculation Method Based on BIM Data

1
China Construction Eighth Engineering Division Corp, Shanghai 200122, China
2
Department of Construction Management, Dalian University of Technology, Dalian 116024, China
3
Department of Architectural Engineering, Ajou University, Suwon 06499, Korea
*
Author to whom correspondence should be addressed.
Sustainability 2022, 14(13), 7797; https://doi.org/10.3390/su14137797
Submission received: 12 May 2022 / Revised: 5 June 2022 / Accepted: 14 June 2022 / Published: 27 June 2022
(This article belongs to the Section Green Building)

Abstract

:
Manual quantity takeoff using two-dimensional (2D) drawings and personal knowledge is error-prone and time-consuming. Theoretically, quantity can be automatically calculated from building information model more quickly and reliably by extracting geometric data and semantic attributes of building elements. Specific construction classification systems embedded in mainstream modeling software for building information modeling (BIM) make it difficult for countries adopting different systems to calculate quantity directly. This paper proposes a BIM-based quantity takeoff code mapping (BQTCM) method to solve the above issue, and develops a quantity takeoff code mapping plug-in (QTCMP) on a BIM modeling software based on the proposed BQTCM method to obtain an accurate bill of quantities directly and efficiently. Moreover, by conducting a statistical analysis and examining a case study, this paper verifies the accuracy and efficiency of quantity takeoff attained from the proposed BQTCM method and QTCMP.

1. Introduction

Quantity takeoff is a necessary task in construction project management [1]. It runs through the whole construction project management of feasibility analysis, investment decision-making, design, construction and completion, providing basic information for the determination, control, supervision and management of the construction cost [2,3]. However, the traditional quantity takeoff is an error-prone and time-consuming process [4], so improving the quantity takeoff method has been a major concern in the architecture, engineering and construction (AEC) industry.
Building information modeling (BIM), a modeling technology based on three dimensional (3D) digital technology, has been used in different construction applications such as energy simulation [5], sustainability [6,7], facilities management [8] and risk management [9,10], which contains information of building itself. Moreover, the information contained in BIM is computable, which provides the possibility for automatic quantity takeoff [1]. With the support of BIM platform, all information can be shared in different stages. Therefore, the information contained in the BIM-based design model can be directly used for cost estimation [11,12], which greatly improves the feedback efficiency between cost and design [13]. By extracting geometric data and semantic properties of building components [14], BIM technology can automatically measure quantity from BIM model, resulting in time saving and more reliability compared with the traditional method [15,16].
Although BIM models can provide engineering data, quantity takeoff is usually realized with specific BIM tools [2] rather than being performed directly from these models [17]. Because different BIM tools have different built-in calculating rules, the quantities obtained using different BIM tools will vary. At the same time, different countries and regions adopt different construction classification systems, which makes quantity takeoff based on the same BIM tool inapplicable. To realize the use of BIM modeling software in the process of quantity takeoff in different countries and regions, it is necessary to ensure that the calculating rules embedded in the BIM modeling software comply with the construction classification systems of the corresponding country or region. There is an urgent need to propose a method to solve this problem.
Therefore, this paper presents a BIM-based quantity takeoff code mapping (BQTCM) method to map the code between BIM data and bill of quantities in a country and develops a quantity takeoff code mapping plug-in (QTCMP) based on a BIM mainstream modeling software according to the proposed BQTCM method. The BQTCM method can avoid information loss in the process of data interaction and improve the speed of quantity takeoff. The QTCMP allows users to obtain a specification-compliant bill of quantities in a specific country from the model of a BIM modeling software directly.
In the following sections, a literature review is first provided on BIM-based quantity takeoff. Then, the impact of the BIM data creation method and calculating rules on quantity takeoff is introduced. Subsequently, the detailed mapping method between BIM data and construction classification systems is established according to the above analysis. Moreover, the implementation process of this method and the flow of the specific algorithm are shown with some examples. Following this, the accuracy and efficiency of the proposed BQTCM method and QTCMP are verified by case studies. Finally, conclusions are summarized and limitations of the present research are identified.

2. Literature Review

Many attempts show that BIM-based quantity takeoff is a suitable method for engineering practice [18,19]. Firat et al. proposed two case studies about the application of BIM-based quantity takeoff and verified the possibility of BIM-based quantity takeoff [20]. Aram et al. developed a knowledge-based system to extract the amount of precast concrete from BIM model [21]. Choi et al. proposed a BIM-based calculation process of structural component quantities in the early design stage [22]. Lim et al. developed an automatic algorithm for the calculation of reinforcement quantities [23]. Moreover, a variety of BIM-based software has been developed to improve the efficiency of cost estimation [4].
However, there are many limitations in the process of BIM-based quantity takeoff. Due to the discrepancy of the specifications between different countries and regions, most of the studies on BIM-based automatic quantity takeoff from one country or region are difficult to be used in another [24]. For example, in China, there are two main difficulties in realizing automatic quantity takeoff. Firstly, according to the ‘Code of Valuation with Bill Quantity of Construction Works (Chinese standard number GB50500-2013)’ (GB50500, hereafter) [25], the quantities should be listed by the tasks and sub-tasks defined by it. Therefore, components in BIM modeling software should be classified according to the rules of GB50500. Secondly, the quantity takeoff rules defined by GB50500 are different from those of the BIM model created by some BIM mainstream modeling software [26]. Some quantity takeoff studies have been conducted to solve this problem. Yang et al. introduced the framework of a BIM-based quantity takeoff method and proposed an algorithm to calculate the quantities of specific structural components based on GB50500 [26]. However, at present, quantity takeoff based on this method is only realized in the concrete task of frame-shear wall structure, and the quantity takeoff of other tasks such as reinforcement and decoration remains to be studied. Ma et al. established a construction product information model of the bill of quantities based on Industry Foundation Classes (IFC) data standards and formulated a general map for IFC data to generate a bill of quantities intelligently. In practical application, the number of components to generate the bill of quantities intelligently accounted for 67% [14]. Although IFC has been the main exchange format used in BIM applications in recent years, information may be lost during each exchange process, eventually leading to the additional workload to replenish it manually.

3. Impact and Analysis of BIM Modeling Method and Calculating Rules

In general, quantity takeoff is mainly affected by the following two aspects. The first one is the impact of the BIM modeling method. The other is the impact caused by the differences in the calculating rules between BIM modeling software and specific quantity takeoff standards. Depending on the above, this paper puts forward an appropriate method for BIM modeling and gives examples of special calculating rules in different countries and regions.

3.1. Impact and Analysis of BIM Modeling Method

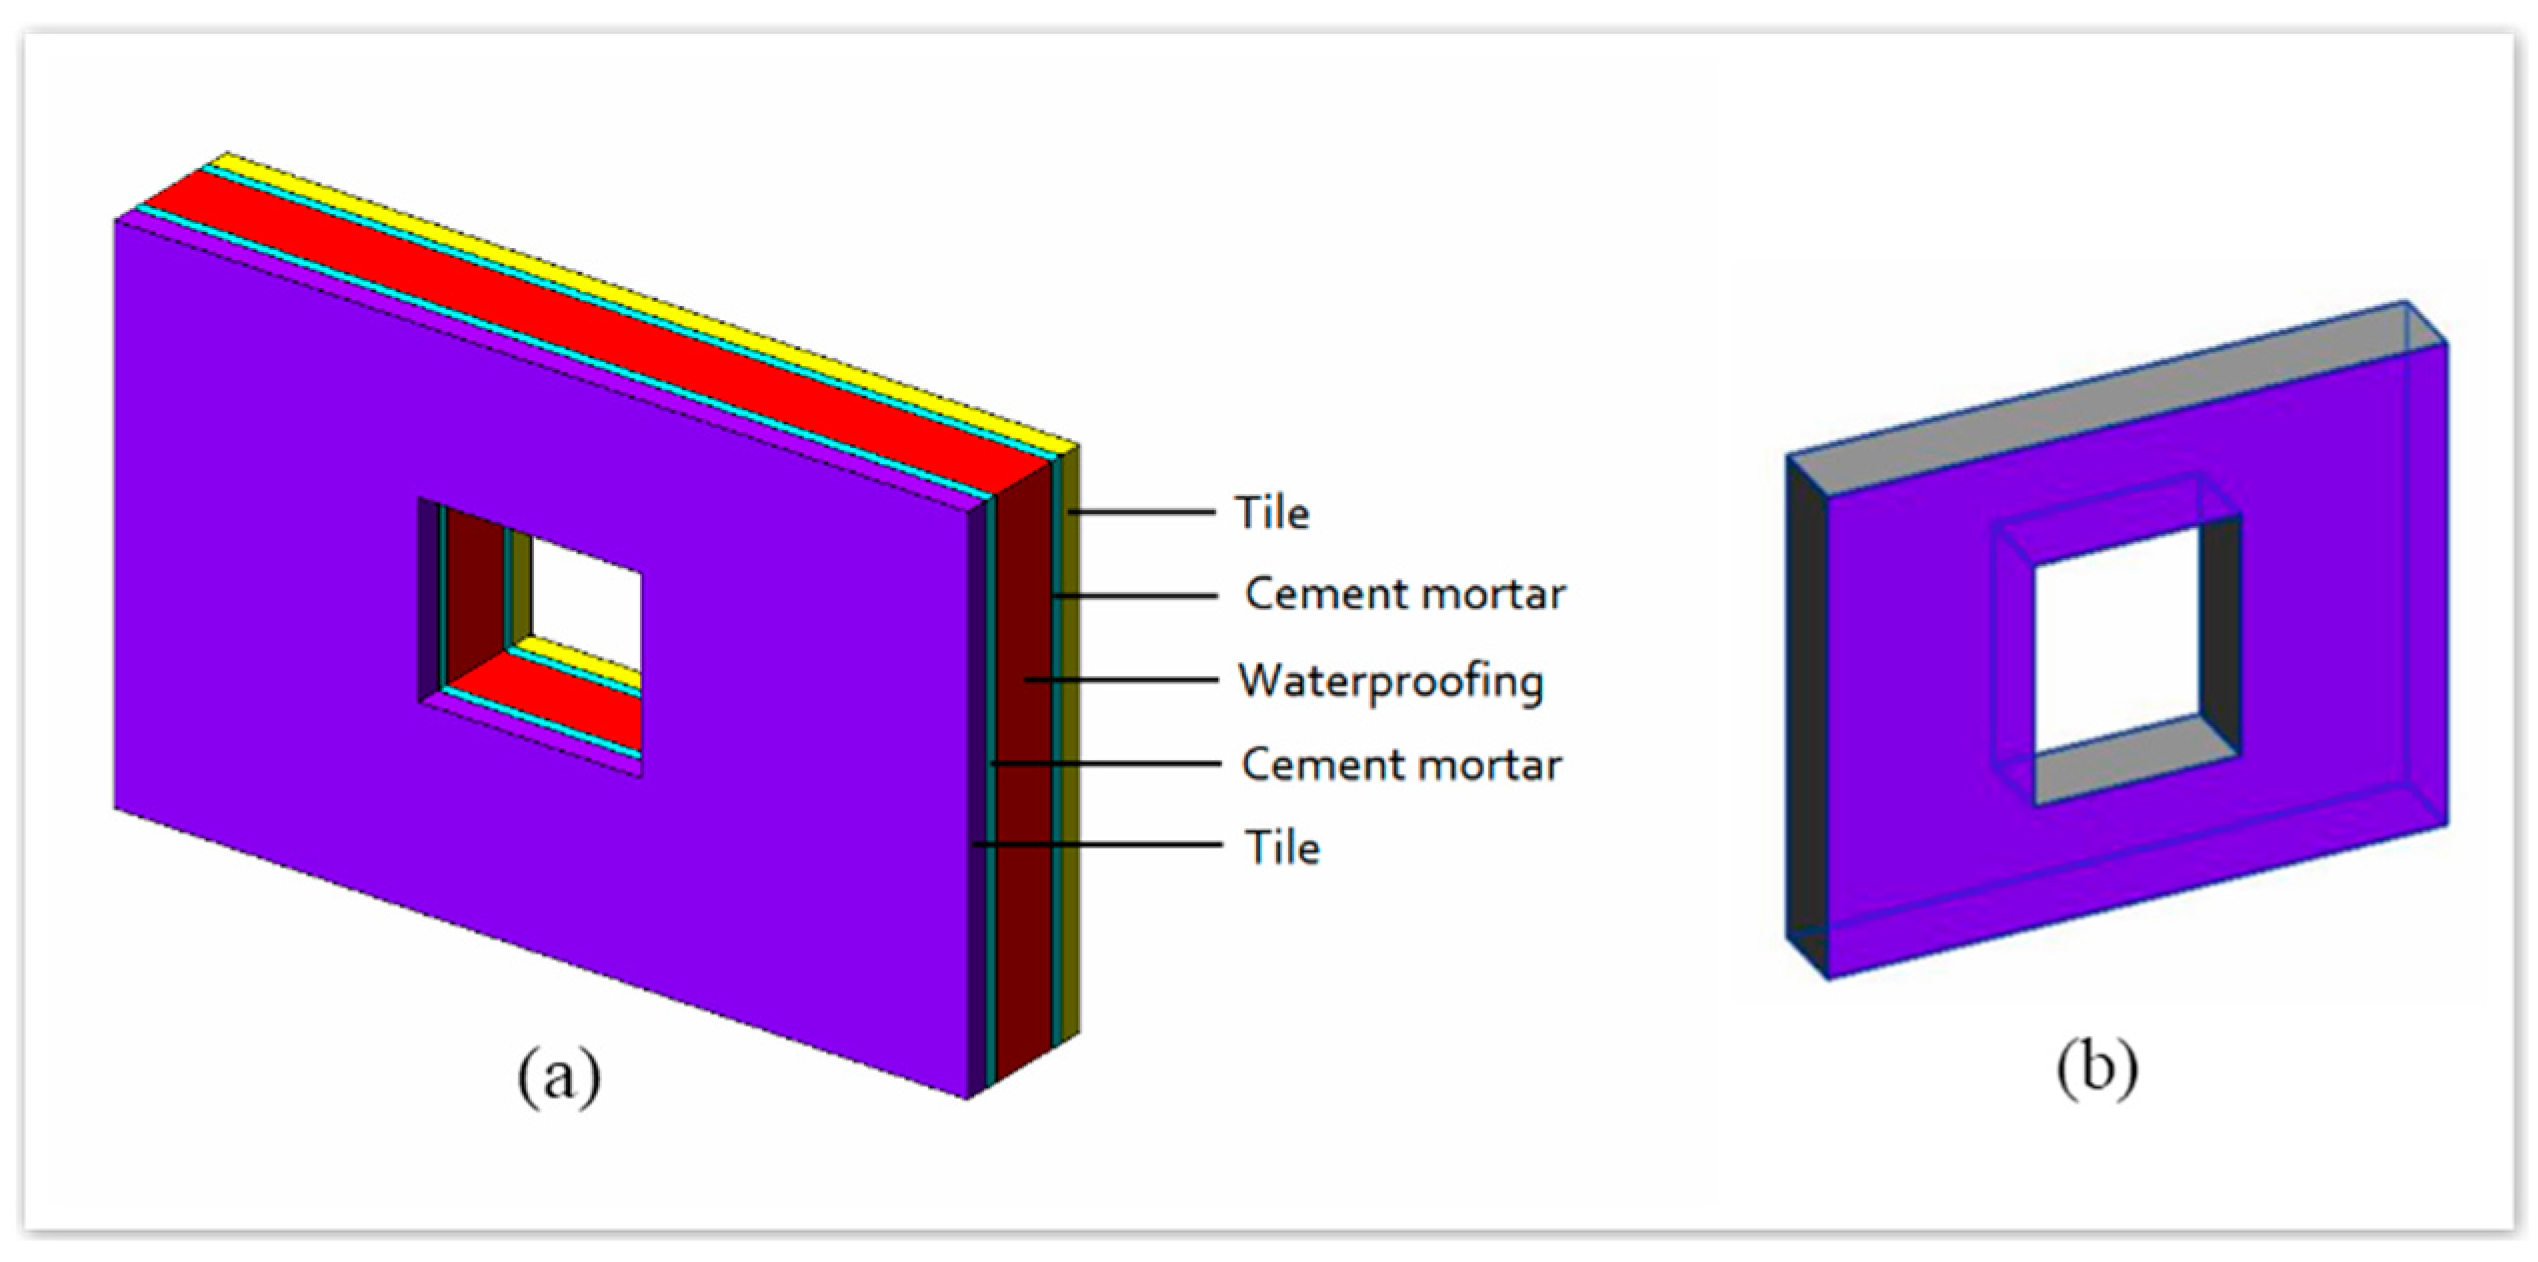
Components of BIM models can be expressed in various methods that could cause discrepancies in quantities. According to the existing research, there are two kinds of modeling methods for components: one is the individual modeling method that represents materials with independent BIM objects, the other is the compound modeling method that represents a set of materials with a single BIM object [27].
To clarify the impact of the above two kinds of modeling methods, a composite wall is taken as an example in this study. With the individual modeling method, the core wall and decorative surface of the composite wall are respectively created as two independent objects. With the compound modeling method, the core wall and decorative surface are regarded as different layers of a whole wall. The composite walls created by these two kinds of modeling methods are shown in Figure 1.
The calculation results of the wall area and volume based on these two kinds of modeling methods are shown in Table 1.
It can be seen from Table 1 that the volume calculation results obtained by these two kinds of modeling methods are exactly the same, but the area calculation results are obviously different. This difference is caused by repeated area calculation in the individual modeling method. However, the compound modeling method does not have this issue, so it can meet the requirement of quantity takeoff. When performing technical clarification and other tasks, components need to be split and cut according to processes and procedures. Therefore, the individual modeling method is more suitable for detailed technical applications.

3.2. Impact and Analysis of Calculating Rules

In addition to the BIM modeling method, calculating rules also has a direct impact on the calculation results of quantity. In other words, the difference between the actual engineering quantity calculating rules and the software built-in calculating rules will result in different quantity takeoff results. Although the calculating rules are different between different countries and regions, many of them have some special calculation requirements, which makes the quantity not equal to the actual component volume or area. Table 2 shows some examples of the special calculating rules.

4. Design of the Mapping Method between BIM Data and Construction Classification Systems

It is well known that quantity takeoff in different regions is usually carried out according to a specific construction classification system [22]. Because quantity takeoff rules and methods of compiling quantity bills are discrepant based on different construction classification systems, the accurate mapping between BIM data and a construction classification system plays an important role in the whole process of quantity takeoff [23]. To implement this mapping between BIM data and construction classification system, a method (the BQTCM method) is proposed in this paper.

4.1. Main Construction Classification Systems

Many countries and institutions have developed various classification systems, such as BSAB in Sweden, Uniclass in the United Kingdom, and DBK in Denmark. Although these classification systems are all developed to classify building artifacts, there are still big differences among them. In fact, each system has its own method of classifying construction artifacts [28].
At present, there are three main international construction classification systems, i.e., MasterFormat [29], Uniformat [30], and OmniClass [31]. MasterFormat is a construction classification system oriented to materials and types of work. It is a master list of numbers and titles classified by work results for organizing information about construction work results, requirements, products, and activities [32]. Uniformat is aimed at the physical components of buildings. Its main use is as a format for estimators to present cost estimates in the schematic design phase [28]. OmniClass is a classification system for the construction industry, which is designed to encompass objects at every scale through the entire built environment [32]. It adopts the combination of face partitioning and line partitioning. It is more comprehensive than the former two, and all information generated during a project’s life cycle can be standardized on this basis.

4.2. Mapping Method between BIM Data and Construction Classification Systems

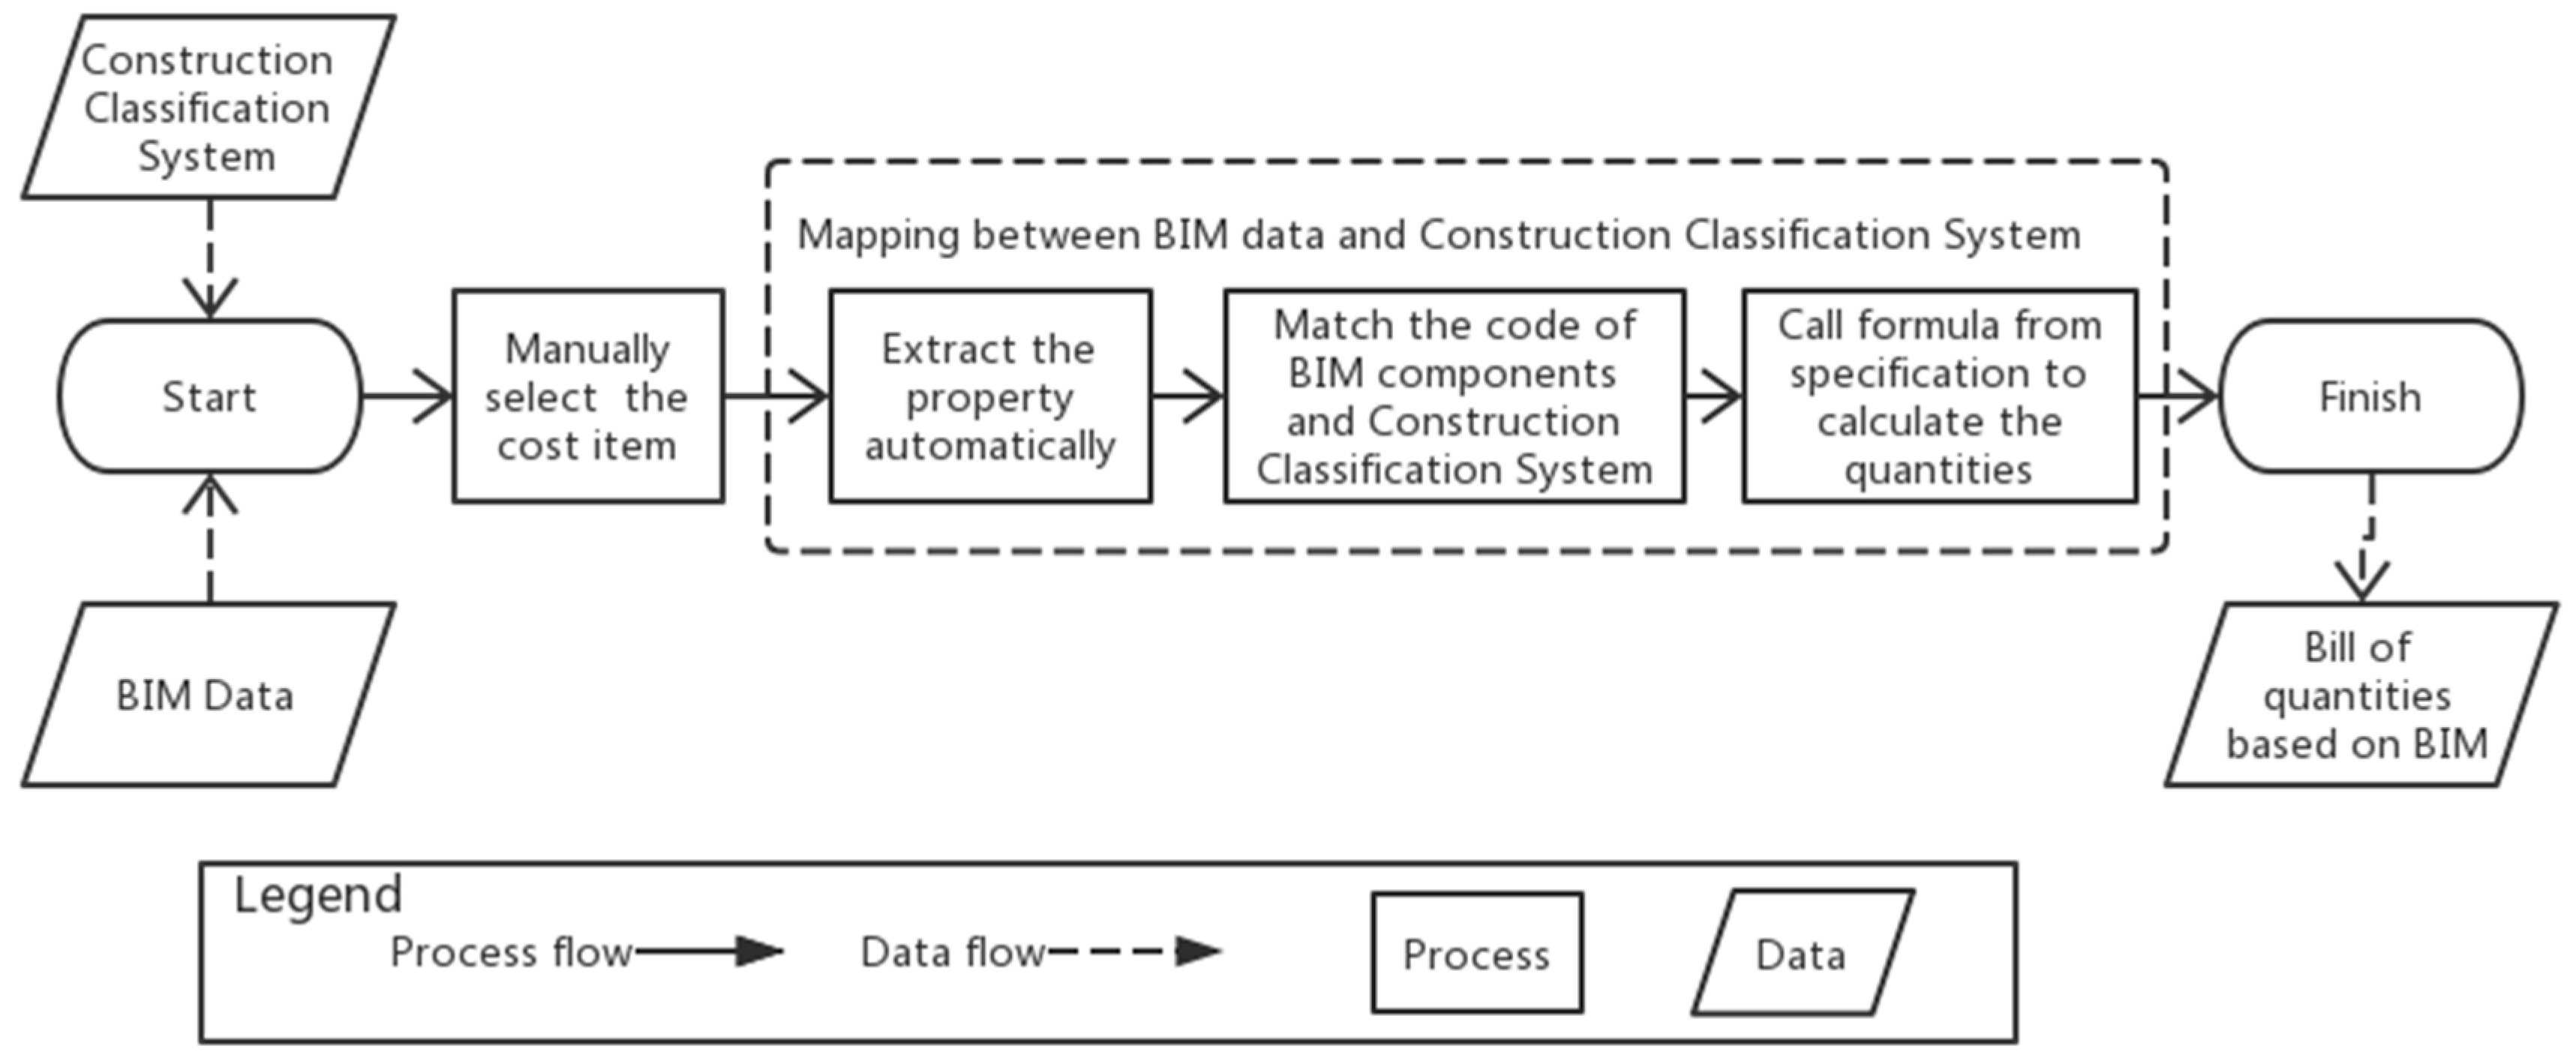
Due to the differences between the construction classification systems embedded in BIM software and the construction classification systems in various countries, it is difficult for some countries and regions to calculate quantity directly using BIM software. This paper proposes a mapping method (BQTCM) between BIM data and construction classification systems and key algorithms. A general process map for specification-compliant quantity takeoff based on BIM data of the design model is formulated, as shown in Figure 2.
By means of the proposed BQTCM method, the relevant properties of BIM components can be automatically identified and extracted, so that the components can match the corresponding codes in the construction classification system. Then, the corresponding formulas in the specification will be called to calculate quantities, and finally, the specification-compliant bill of quantities can be exported.

5. Implementation of the Mapping Method between BIM Data and Construction Classification Systems

In order to show the application effect of the BQTCM method more intuitively, this paper realizes the mapping between a specific type of BIM data and a specific construction classification system. In China, GB50500 is officially designated as the specification to guide quantity takeoff. As a widely used BIM software in China, Revit 2018 has many advantages, which include rich family libraries, well-designed functions, and user-friendly interface, and it provides solutions for architectural modeling, structural modeling, structural software integration, mechanical, electrical, and plumbing (MEP) modeling, energy demonstration, etc. [33]. Although Revit 2018 has some shortcomings in calculating the bill of quantities, such as that built-in calculating rules may not conform to the specification requirements of the area where the building is located, it cannot directly export statistical table to meet the requirements of the specifications of some countries, etc., its powerful application programming interface (API) can directly provide the data structure of Revit 2018 itself, rather than creating a new data structure [26]. RVT is one of Revit 2018’s native formats. Therefore, taking the mapping between RVT data and GB50500 as an example, the QTCMP is developed based on Revit 2018 to calculate quantity automatically.

5.1. Comparison of Construction Classification System Used by Revit 2018 and GB5050

In OmniClass, there are 15 classification tables in total and each table adopts line partitioning. By default, Revit 2018 adopts the classification code of products in table 23 of OmniClass. The numbering rules of OmniClass are as follows:
  • The first two digits represent the table number (i.e., 11, 12, 13… 36, 41, 49).
  • Additional pairs of digits designate each level of classification. Classification depth increases from left to right. Leading zeros are used for the first nine entries in each level, 01–09.
  • Each code has a minimum of 8 digits and a maximum of 14 digits. A double zero entry (00) is used to indicate that there are no entries at any given level. It is used in tables to fill a numerical string for a higher level (more conceptually broad) entry to 8 digits (such as 23–13 19 00).
Table 3 presents a code example in table 23 of OmniClass.
As the Chinese bill of quantities pricing specification, GB50500 adopts line partitioning to define a classification system similar to MasterFormat [31] and is formulated to unify quantity takeoff rules of building construction and decoration engineering and the method of compiling the quantity bill. The cost estimation of all kinds of bidding projects of building construction and decoration engineering in China, including cast-in-place concrete engineering and precast (concrete, steel, wood, etc.) engineering, should be carried out in strict accordance with this specification.
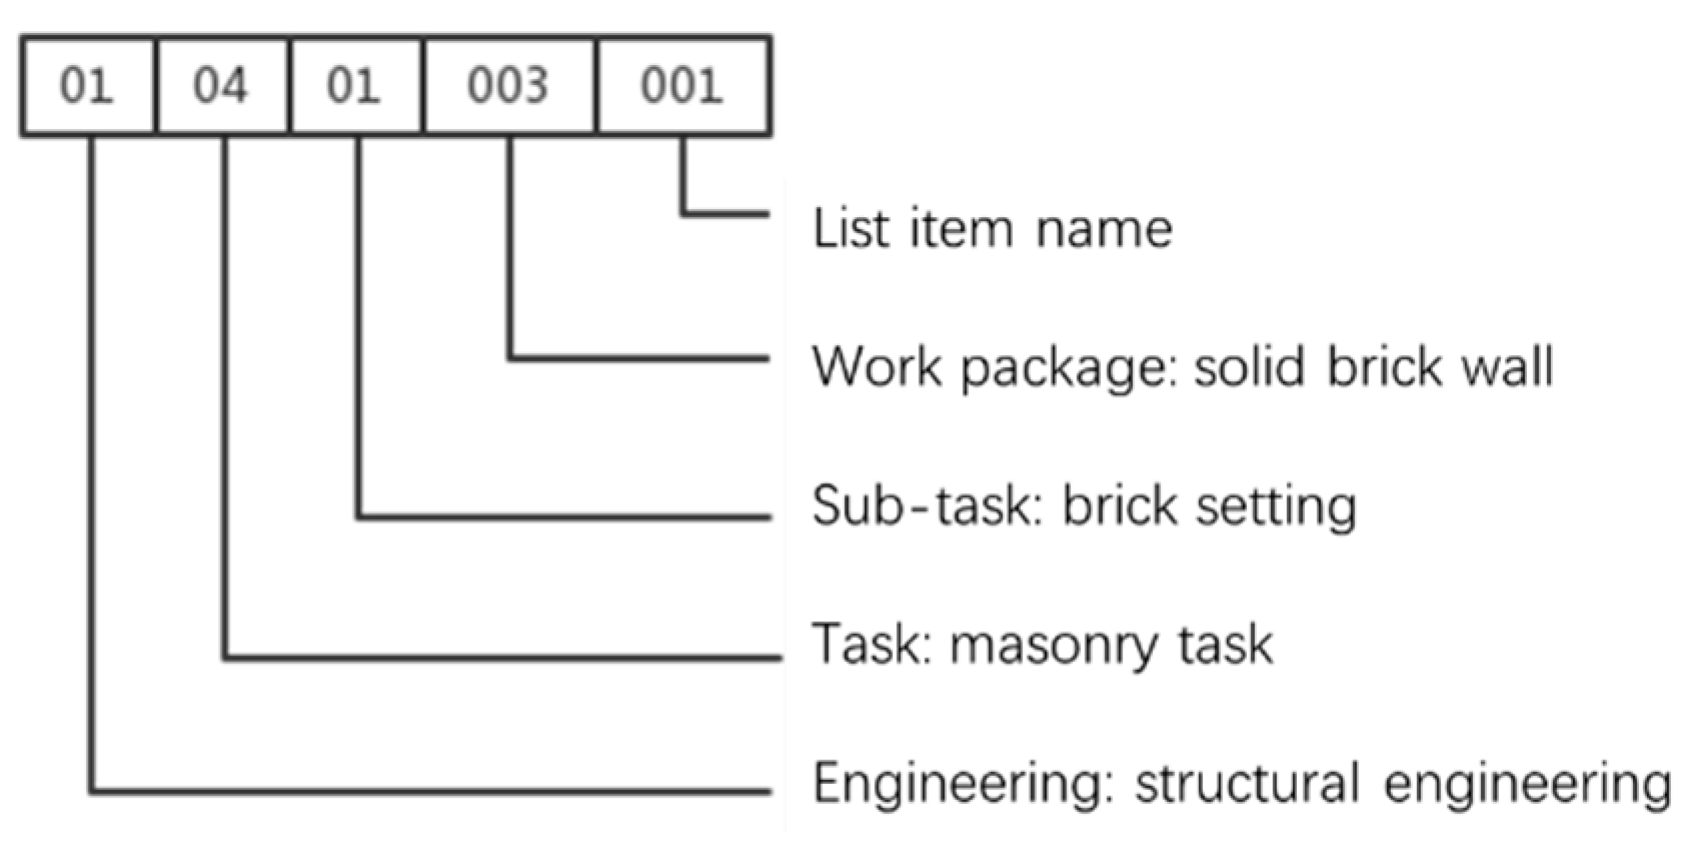
The code based on GB50500 is divided into five levels, represented by twelve digits. Unlike the unified codes of level 1, 2, 3, and 4, the fifth-level code is set according to the name and characteristics of the actual project. The meanings of codes at all levels are described below.
The first two digits are engineering sequence codes (for example structure engineering: 01, decoration engineering: 02, installation engineering: 03); the third and fourth digits are task sequence codes; the fifth and sixth digits are sub-task sequence codes; the seventh to ninth digits are work package sequence codes; the 10th to twelfth digits are bill item sequence codes. Project codes of the same bidding project should not be duplicated. A specific example of GB50500 code is shown in Figure 3.

5.2. Development of the QTCMP

Considering the main aspects affecting quantity takeoff in Section 3, this paper adopts the compound modeling method and adjusts the default calculating rules (in Revit) accordingly for the actual calculating rules (in GB50500).
The following introduces two main kinds of calculating rules in GB50500 that are different from the built-in calculating rules of Revit 2018, i.e., component deduction rule and small openings handling rule.
(1) Component deduction rule
Component deduction rule is the basis for which one of two components should be deducted when they overlap. Table 4 shows a component deduction priority list used in practice, which is suitable for the calculation of architectural and structural components. When two types of components overlap, the lower priority component should be deducted.
(2) Small openings handling rule
The small openings handling rule is that the volume occupied by a single hole with an area less than 0.3 m2 is not deducted in the quantity takeoff in GB50500. However, the quantity of walls and slabs in Revit 2018 is the actual volume of components. Based on this, the QTCMP resets calculating rule for small openings. The detailed process of dealing with small openings is shown in Figure 4.
In this paper, it should be noted that the influence of small openings on quantity takeoff of the architecture and structure has been considered, but the influence of small openings on quantity takeoff of decoration has not been considered.
The main operation interface of the QTCMP is shown in Figure 5. On the left side of the interface is the calculation category dialog box. The calculation categories (beams, slabs, columns, walls, etc.) listed in the dialog box are consistent with the calculation categories in GB50500. Users can select the type of quantity to be calculated through this interface.
On the right side of the interface, there are three dialog boxes, namely the property dialog box, the rule identification dialog box, and the bill coding dialog box.
(1) The property dialog box (as shown in Figure 5a) is used to automatically identify BIM components and read the corresponding properties.
(2) The rule identification dialog box is used to establish a matching relationship between the BIM component and the calculation category on the left, which is shown in Figure 5b.
(3) The bill coding dialog box shows specific bill coding and corresponding quantity takeoff rule (from GB50500) matching the selected BIM component in the upper half, and GB50500 is embedded in the lower half of this interface, as shown in Figure 5c.
This paper takes a beam as an example to show the detailed process of using the QTCMP as follows:
Firstly, a beam is automatically identified and its corresponding properties are read by the property dialog box (Figure 5a).
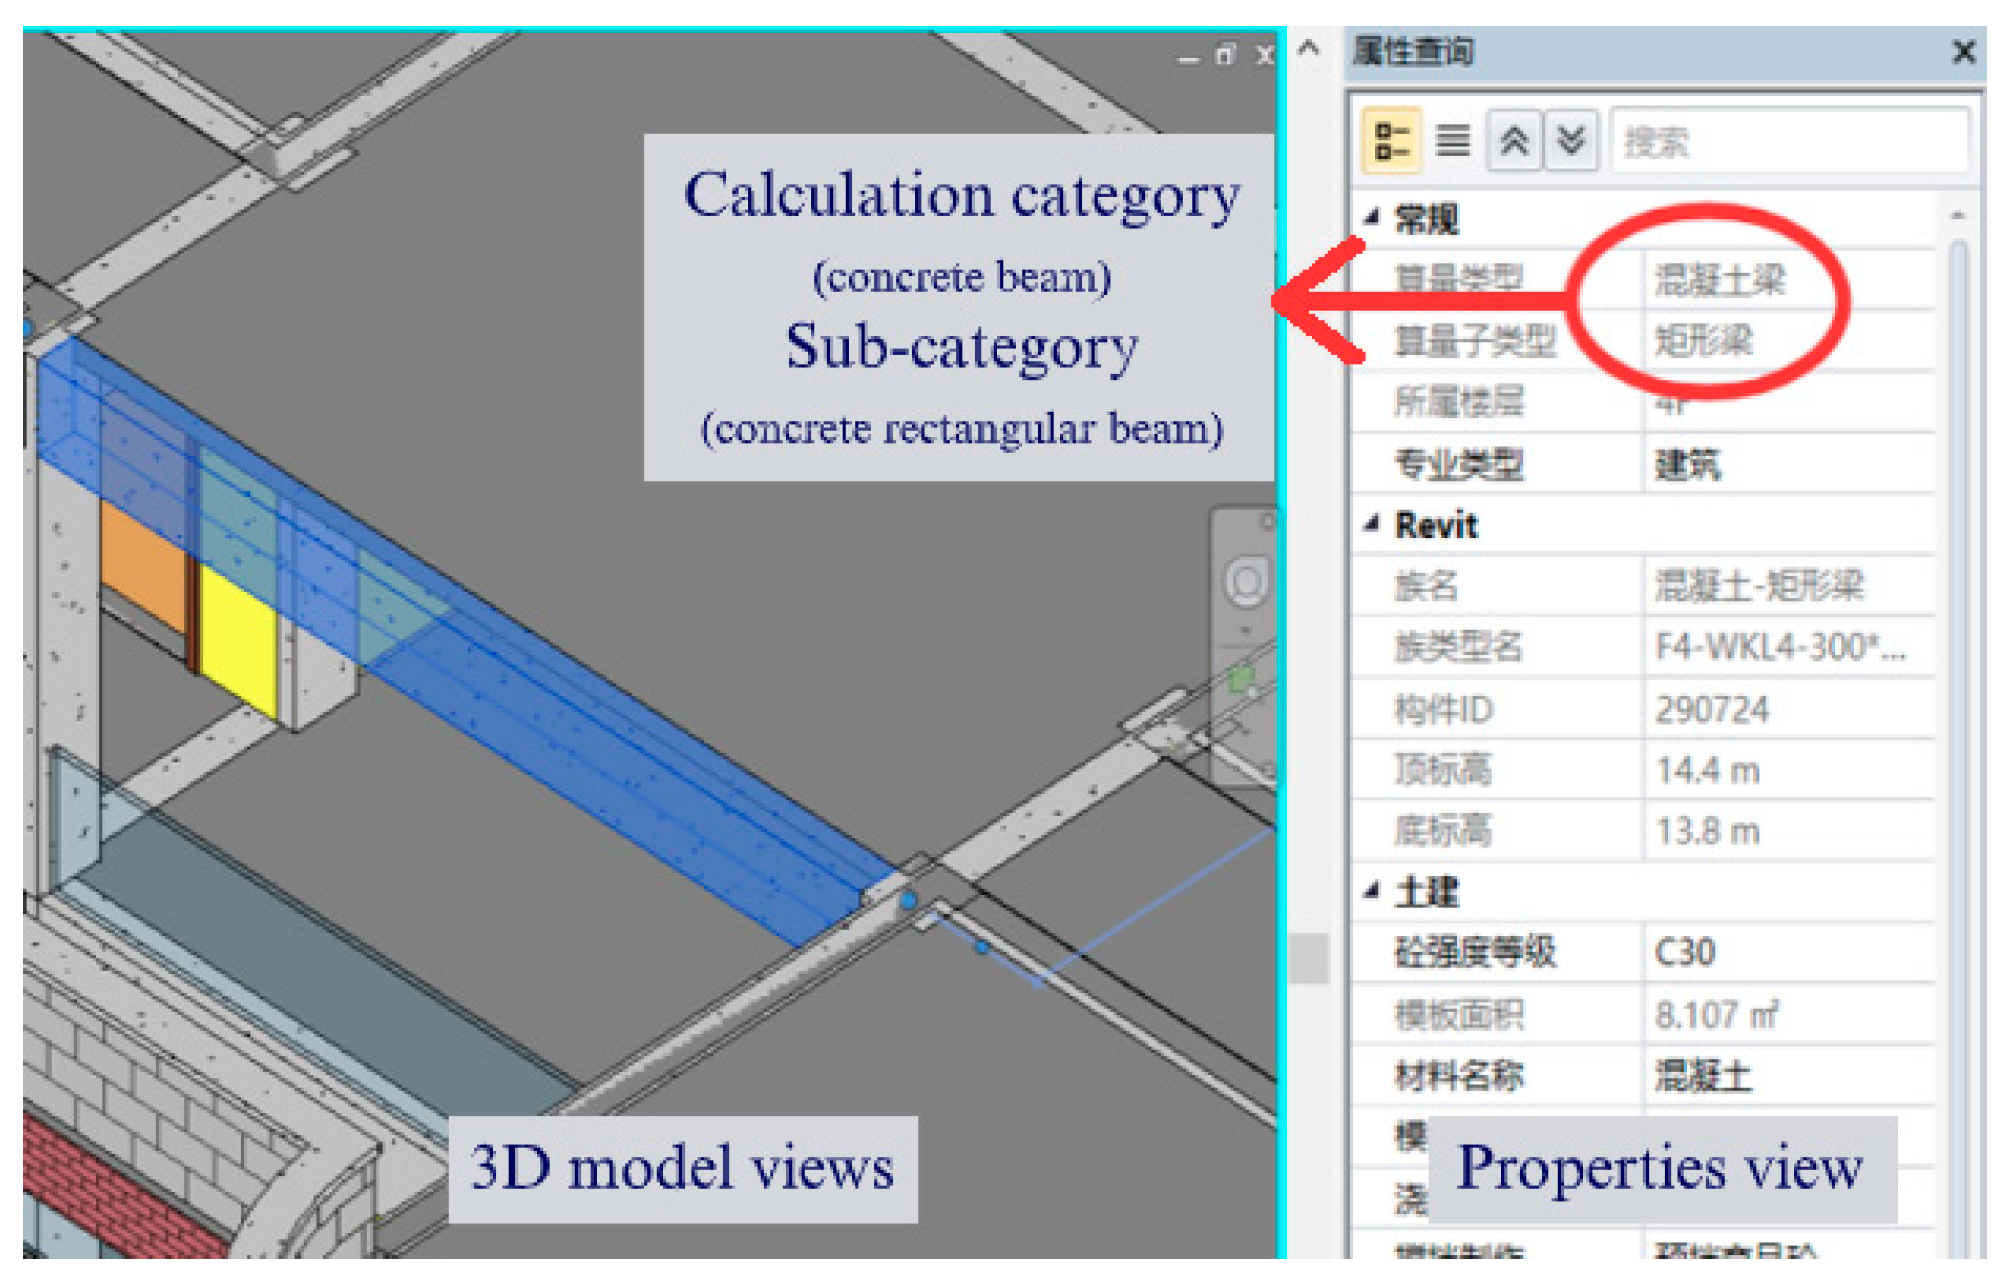
Secondly, a matching relationship between the beam and the calculation category on the left is established by the rule identification dialog box (Figure 5b). In detail, its calculation category is a concrete beam and its sub-category is a concrete rectangular beam, as shown in Figure 6.
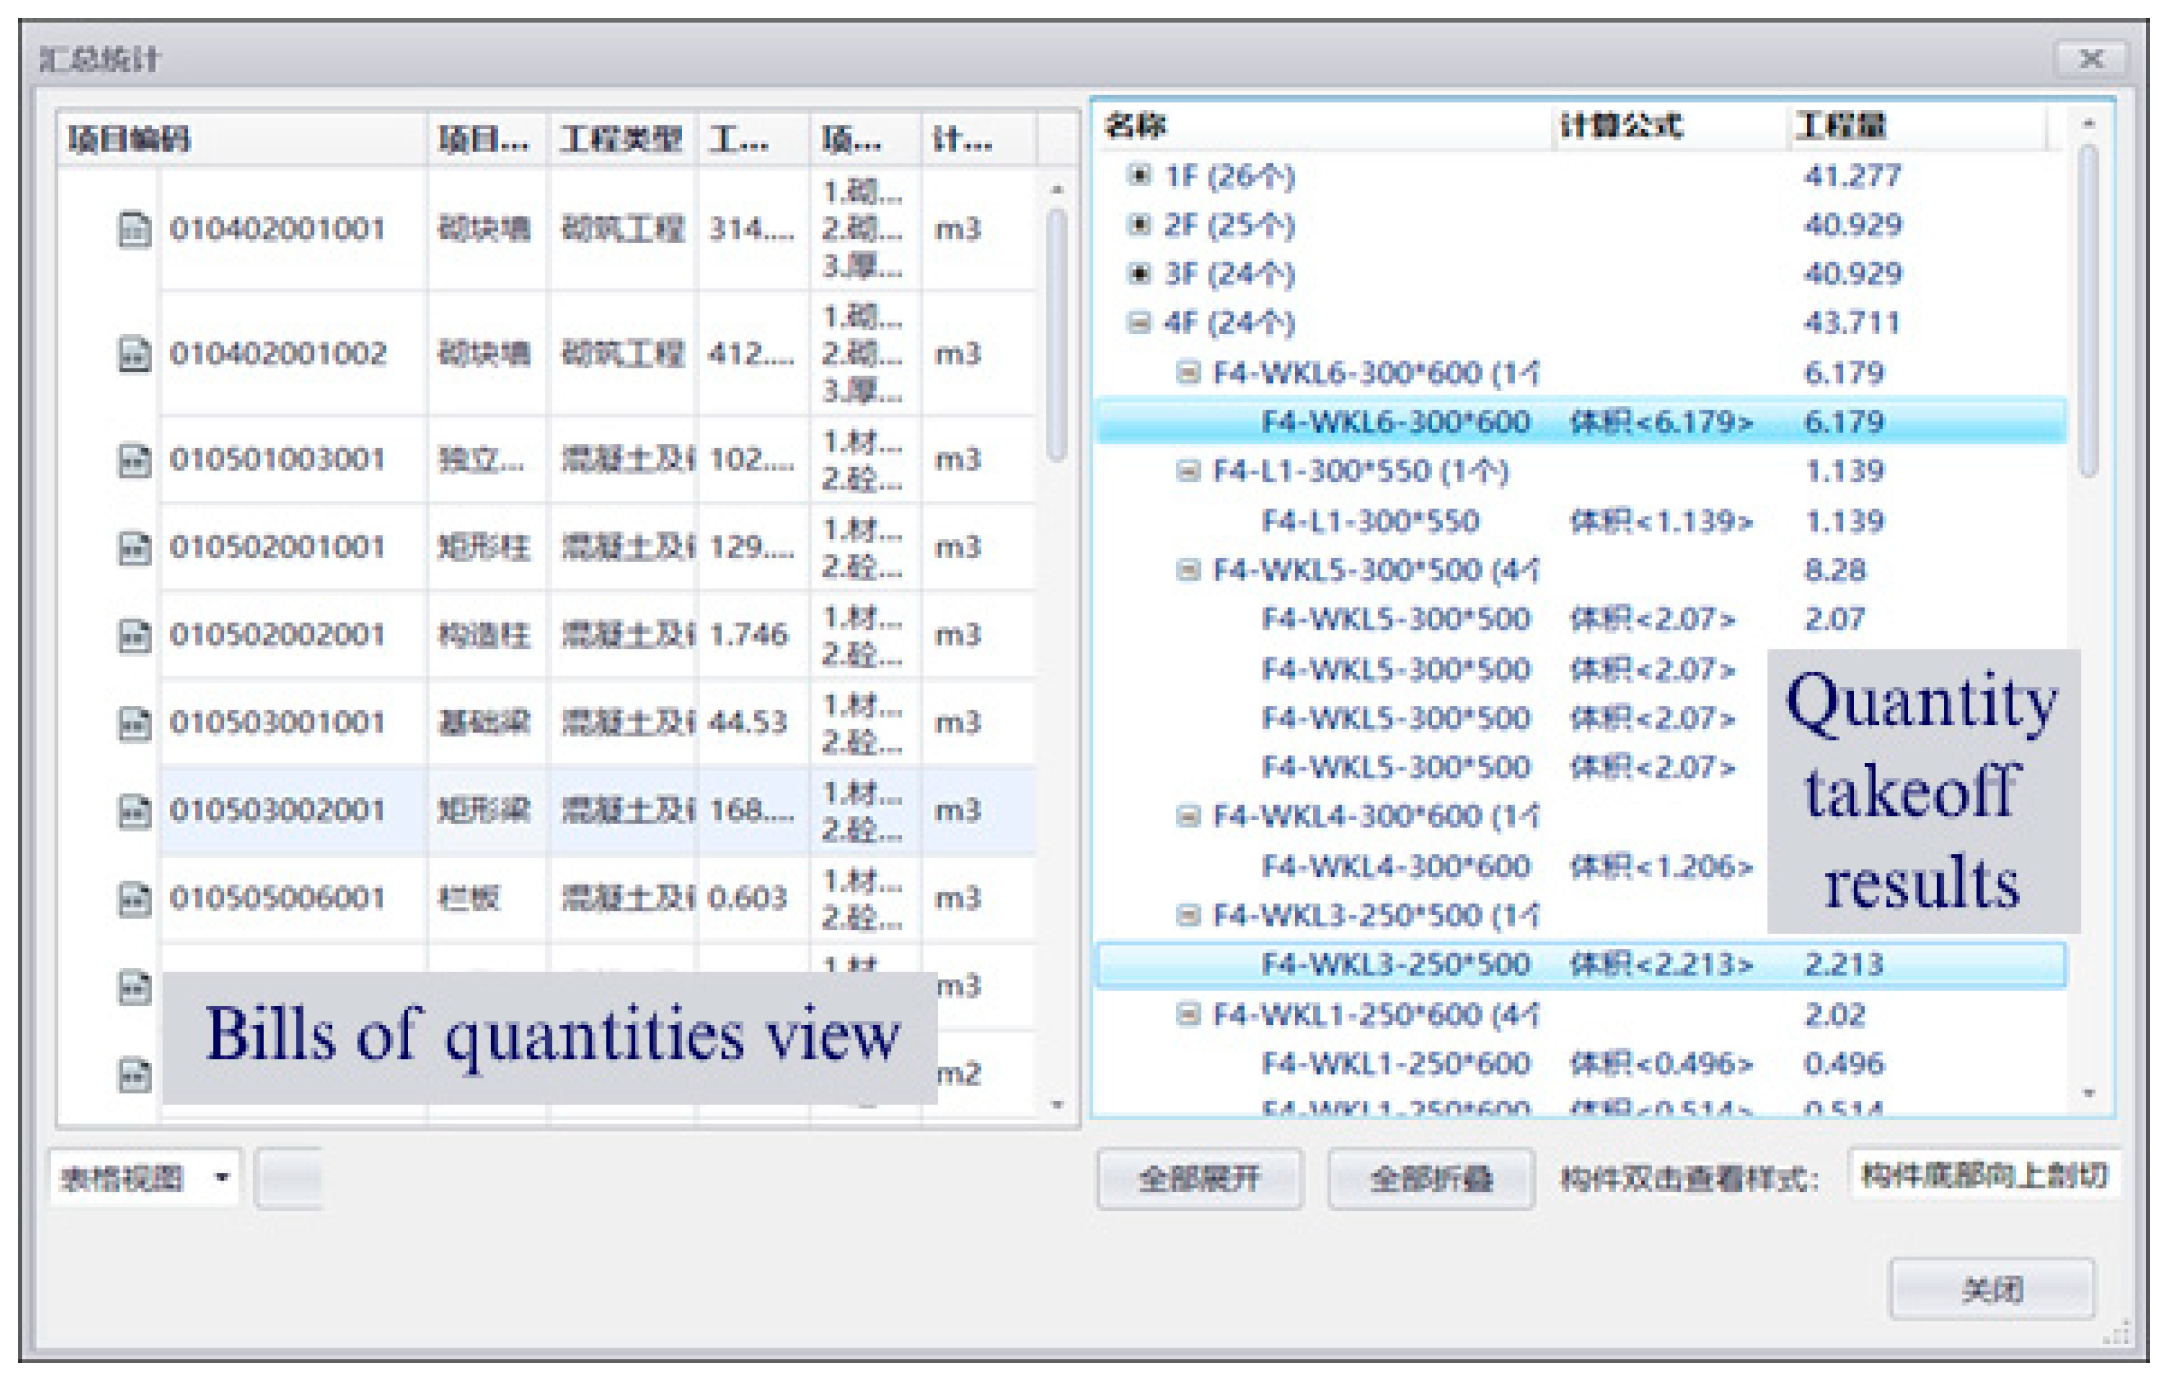
Finally, based on the bill coding dialog box (Figure 5c), the concrete volume and formwork area of this beam are calculated according to GB50500. The quantity takeoff results of this beam are as shown in Figure 7.
Affected by the example BIM software (Revit 2018) and building classification system (GB50500), QTCMP has some limitations, but it does not affect the universality of the BQTCM method. Except for fine decoration engineering, municipal engineering, garden engineering, structural metallic engineering, roof and waterproof engineering, and anticorrosion and insulation engineering, other calculation categories can be implemented in the QTCMP.

5.3. The Key Algorithms of Quantity Takeoff Based on QTCMP

Examples of three engineering types for the key algorithms of quantity takeoff based on QTCMP are as follows:
(1)
Concrete engineering
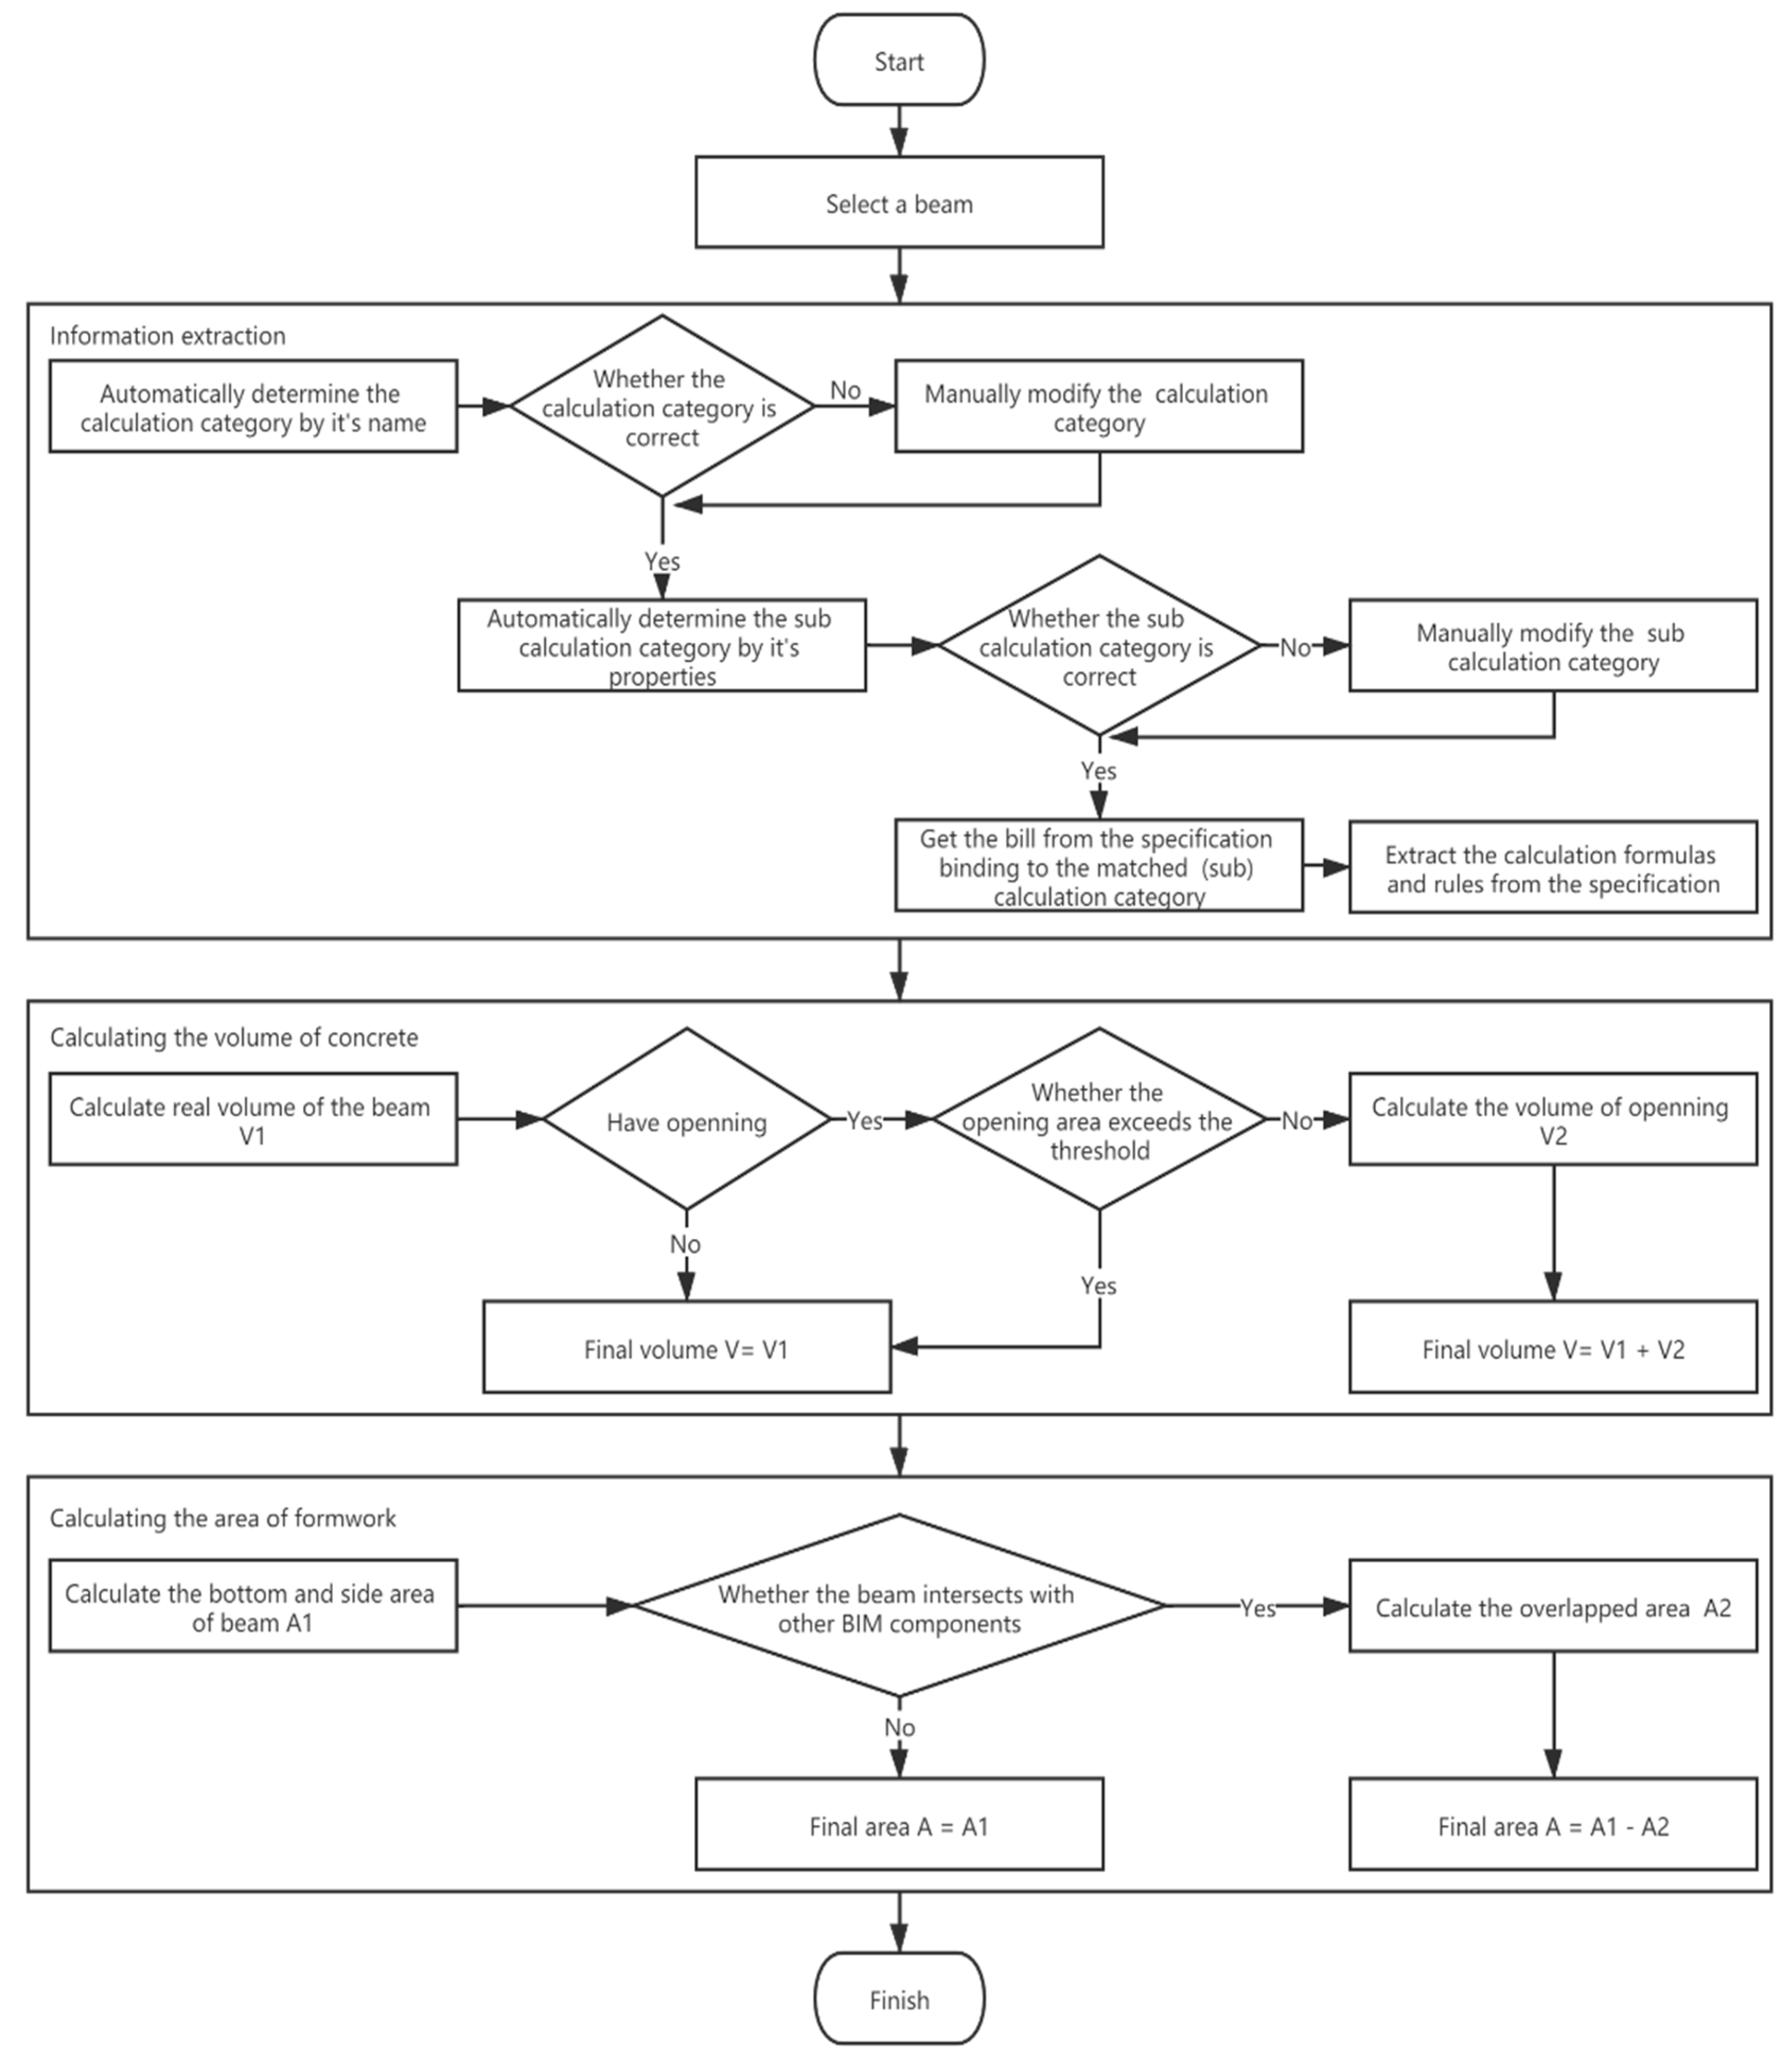
The key algorithm for concrete engineering (taking a beam’s quantity takeoff as an example) based on QTCMP is shown in Figure 8.
The details of the quantity calculation method are introduced as follows.
Step 1 Choose a beam.
Step 2 Automatically determine the beam’s calculation category by its name.
Step 3 Automatically determine the sub-calculation category of the beam by its properties.
Step 4 Manually check if the (sub-) calculation category is correct: if correct, perform step 5; if not, manually adjust the calculation category and sub-calculation category, and then perform Step 5.
Step 5 Get the bill code corresponding to the calculation category and sub-calculation category.
Step 6 Get the details of the bill, including the calculation formulas and rules of quantity takeoff, etc.
Step 7 The concrete volume is calculated as follows:
1) First calculate the actual volume V1 of the beam.
2) Check whether there is a hole:
i. If there is no hole, perform step 3);
ii. If there is a hole, check whether the hole area is greater than the threshold predefined in GB50500: if not, calculate the hole volume V2 and perform step 4); if it is greater than the threshold, perform step 3).
3) Concrete volume = actual volume V1.
4) Concrete volume = actual volume V1 + hole volume V2.
Step 8 Calculate the formwork area, the specific process is as follows:
1) First calculate the total area of the bottom and sides of the beam A1.
2) Find the members intersecting with the beam.
3) Judge whether there are intersecting components: if there are no intersecting components, perform step 4); if there are intersecting members, calculate the area of the overlapping surface between them A2, and perform step 5).
4) Formwork area = the total area of the bottom and sides of the beam A1.
5) Formwork area = the total area of the bottom and sides of the beam A1—the area of the overlapping surface A2.
(2)
Installation engineering
The calculation of duct area is taken as an example of the quantity takeoff of installation engineering. The calculation process of the duct area is shown in Figure 9.
1) Calculate the duct’s superficial area A1.
2) Check whether there is a fitting:
i. If no, the final area A = A1;
ii. If yes, the next calculation process is as follows:
Firstly, calculate the extended length of ducts L1: if more than one duct is connected to this fitting, L1 is normally equal to the distance between the endpoint and the center point of this fitting; if only one duct is connected, L1 is normally equal to the distance between two endpoints of this fitting.
Secondly, calculate the cross-section perimeter of duct Pc.
Thirdly, calculate extended area A2 = L1 × Pc.
Finally, get the final area A = A1 + A2.
(3)
Reinforcement engineering
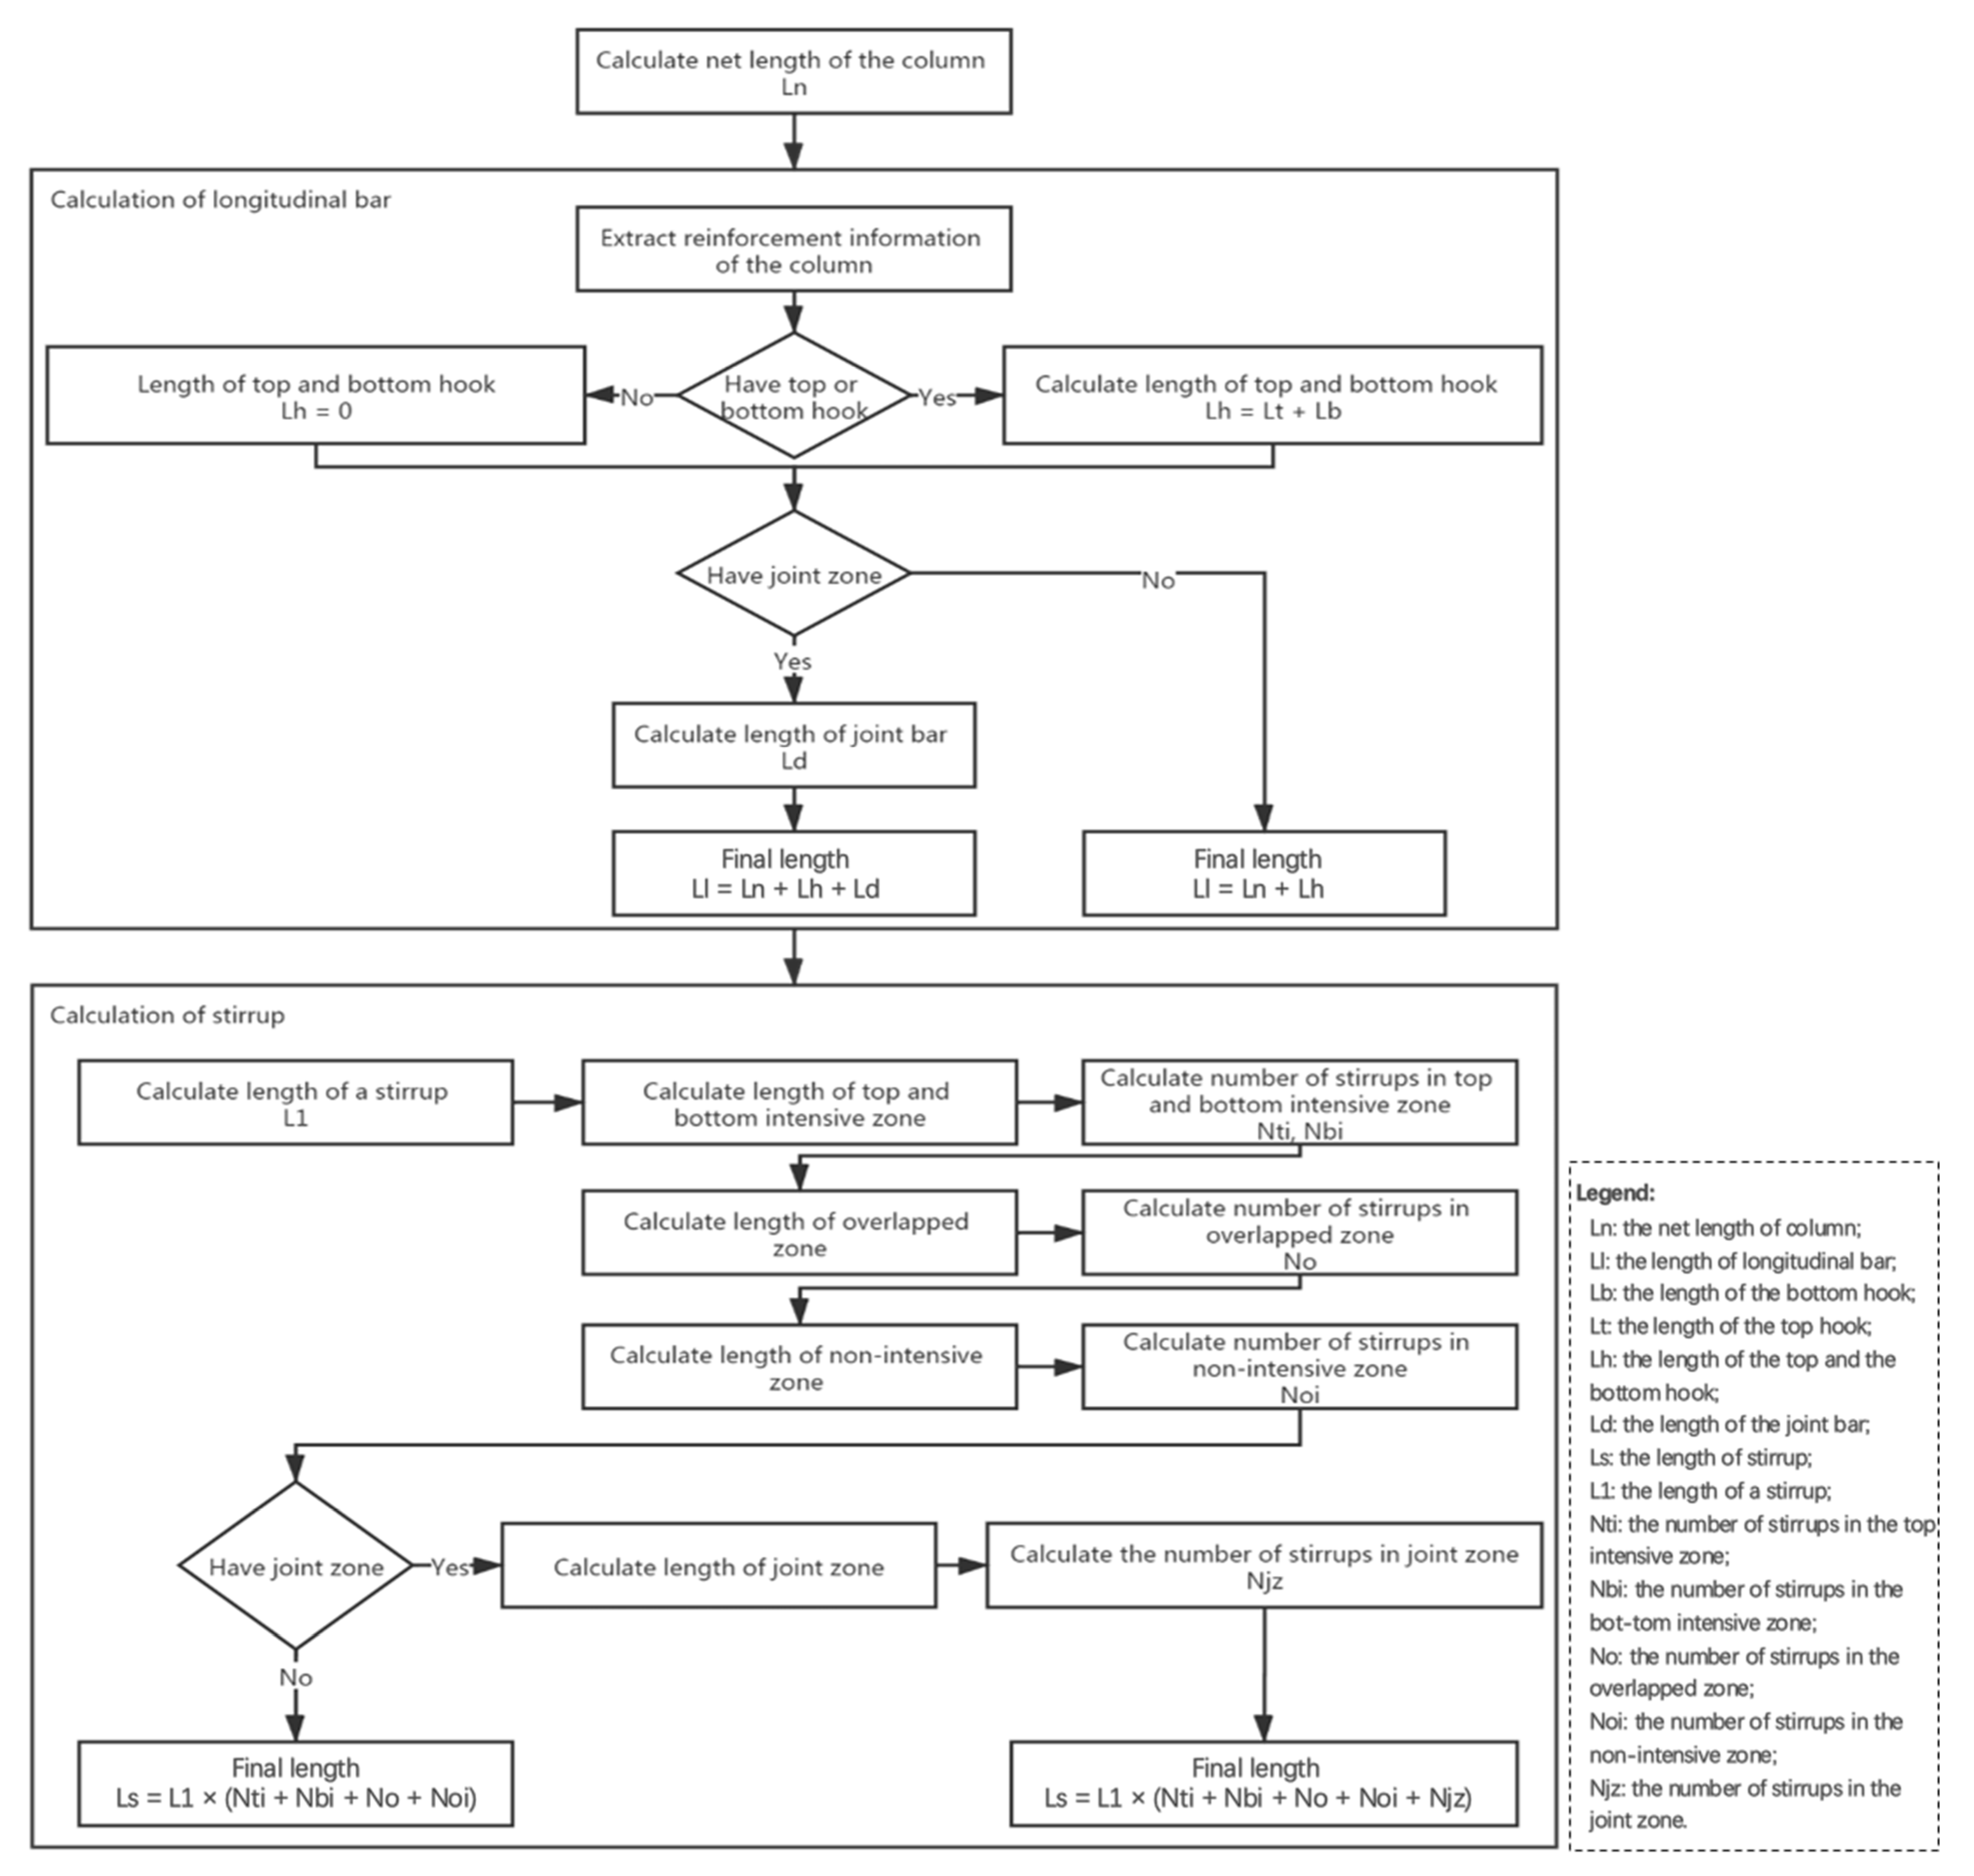
The calculation process of reinforcement is shown in Figure 10, taking the reinforcement of the column as an example.
1) Calculate the net length of column Ln = actual length of a column - max length of the top component - max length of the bottom component.
2) Calculate the length of longitudinal bar Ll:
i. Check whether there are hooks: if yes, calculate the length of the bottom hook Lb and the length of the top hook Lt, and the length of the top and the bottom hook Lh = Lb + Lt; if no, Lh = 0.
ii. Check whether there is a joint zone: if yes, calculate the length of the joint bar Ld, and the length of the longitudinal bar Ll = Ln + Lh+ Ld; if no, the final length Ll = Ln + Lh.
3) Calculate the length of stirrup Ls:
i. Calculate the length of a stirrup L1.
ii. Calculate the length of the top and the bottom intensive zone. The number of stirrups in the top intensive zone Nti and the number of stirrups in the bottom intensive zone Nbi are calculated respectively according to the length of the top and the bottom intensive zone.
iii. Calculate the length of the overlapped zone. The number of stirrups in the overlapped zone No is calculated according to the length of the overlapped zone.
iv. Calculate the length of the non-intensive zone. The number of stirrups in the non-intensive zone Noi is calculated according to the length of the non-intensive zone.
v. Check whether there is a joint zone: if yes, calculate the length of the joint zone and calculate the number of stirrups in the joint zone Njz according to the length of the joint zone; obtain the final length Ls = L1 × (Nti + Nbi + No + Noi + Nf + Njz). If no, obtain the final length Ls = L1 × (Nti + Nbi + No + Noi + Nf).
6. Verification

As one of the most widely applied cost estimation software in China, G is an innovative, efficient and easy-to-use cost estimation software, so most participants involved in the construction stage usually use it for quantity takeoff. Therefore, this paper adopts the G method (i.e., quantity takeoff based on the G cost estimation software, G method hereafter) as a benchmark.

6.1. Computational Accuracy Analysis Parameters in Quantity Takeoff

To describe the similarity between the proposed BQTCM method and the benchmark, the Cosine similarity and the Pearson coefficient are adopted as the computational accuracy analysis parameters.
The Cosine similarity uses the cosine of the angle between two vectors as a measure to describe the similarity of two vectors accurately [15]. Suppose that x and y represent two vectors, x = ( x 1 , x 2 , , x n ) t , y = ( y 1 , y 2 , , y n ) t . Then, the Cosine similarity between x and y can be expressed as:
c = i = 1 n x 1 · y 1 i = 1 n x 1 2 · i = 1 n y 1 2
The closer the Cosine similarity is to 1, the angle between x and y is closer to 0, which means x and y are more similar.
The Pearson correlation method is the most common method for numerical variables; it assigns a value between −1 and 1, where 0 is no correlation, 1 is the total positive correlation, and −1 is the total negative correlation [13]. It can also be used to reflect the linear correlation between two vectors. Suppose that x and y represent two vectors, respectively, then the Pearson coefficient between x and y can be expressed as:
p = i = 1 n ( x 1 x ¯ ) · ( y 1 y ¯ ) i = 1 n ( x 1 x ¯ ) 2 · i = 1 n ( y 1 y ¯ ) 2
If p > 0, x and y are positively correlated. It means that when a value becomes larger, the value of the other increases correspondingly. If p < 0, x and y are negatively correlated. This means that when a value becomes larger, the value of the other value decreases correspondingly.

6.2. Calculation Results and Accuracy Analysis

This paper shows the calculation accuracy and efficiency of the BQTCM method in terms of quantity takeoff by comparing the BQTCM method with the G method in three practical cases. The first case calculates quantities of the concrete, formwork, water supply and drainage, rebar, and rough decoration (including skirting board, wall plastering, floor surface course, etc.) engineering of the project, the second case counts the calculation time of concrete and rebar engineering, and the third case counts the calculation time of MEP and rough decoration engineering. All cases are validated on a PC with Intel Core i5-9400 CPU, 16G RAM, and NVIDIA GeForce GTX 1050 Ti GPU in Windows 10 Enterprise. The details of cases, calculation results, and analysis are described below.
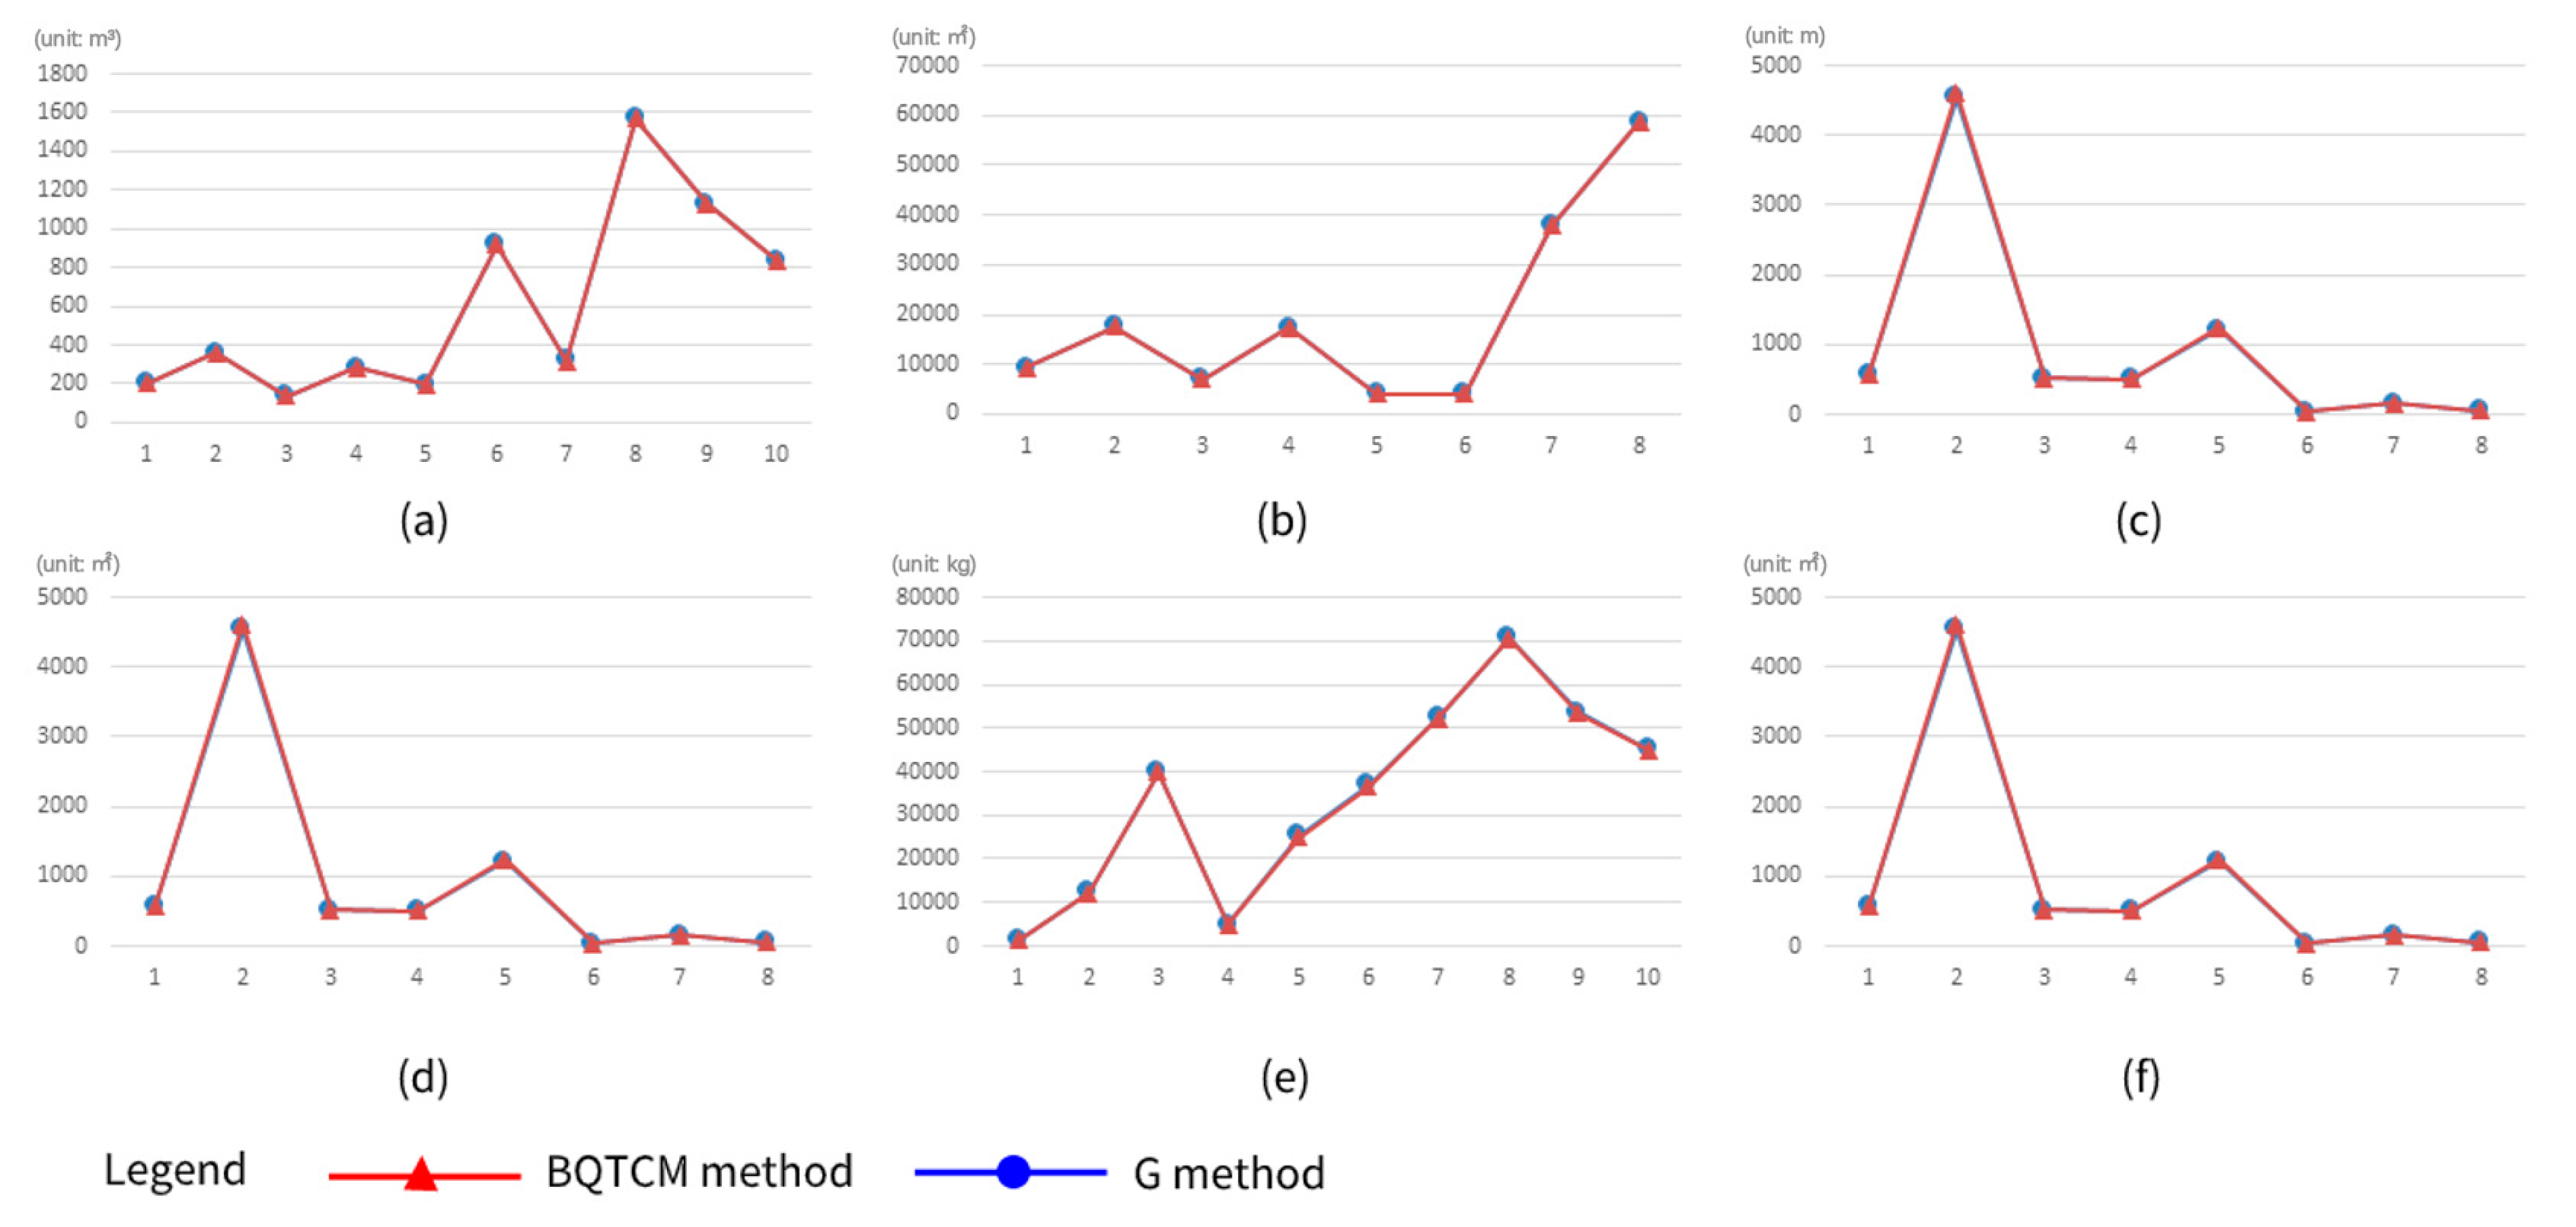
Case 1 is a project with a floor area of 100,000 square meters. Table 5, Table 6, Table 7, Table 8, Table 9 and Table 10 illustrate the comparison of the calculation accuracy between the G method and the BQTCM method in the quantity takeoff of concrete, formwork, water supply and drainage, rebar, and rough decoration, respectively. In Figure 11, the horizontal axis represents the number of data points. The vertical axis represents quantity takeoff results. The circular dots and the triangular dots represent the quantity takeoff results obtained by the G method and the BQTCM method, respectively.
Table 5 and Figure 11a show that, in the quantity takeoff results of concrete volume, the largest absolute percentage deviation between the G method and the BQTCM method is 0.9% and the quantity takeoff results obtained by these two methods are highly relevant.
Table 6 and Figure 11b show that, in the quantity takeoff results of formwork area, the largest absolute percentage deviation between the G method and the BQTCM method is 0.7% and the quantity takeoff results obtained by these two methods are highly relevant.
Table 7 and Figure 11c show that, in the quantity takeoff results of bridge frame length and plumbing pipeline length, the largest absolute percentage deviation between the G method and the BQTCM method is 1.9% and the quantity takeoff results obtained by these two methods are highly relevant.
Table 8 and Figure 11d show that, in the quantity takeoff results of mechanical pipeline area, the largest absolute percentage deviation between the G method and the BQTCM method is 1.7% and the quantity takeoff results obtained by these two methods are highly relevant.
Table 9 and Figure 11e show that, in the quantity takeoff results of rebar weight, the largest absolute percentage deviation between the G method and the BQTCM method is 1.5% and the quantity takeoff results obtained by these two methods are highly relevant.
Table 10 and Figure 11f show that, in the quantity takeoff results of rough decoration area, the largest absolute percentage deviation between the G method and the BQTCM method is 1.8% and the quantity takeoff results obtained by these two methods are highly relevant.

6.3. Calculation Time and Efficiency Analysis

Case 2 is a six-story building project with a floor area of approximately 12,000 square meters. The size of the structure model file of this building is 205 MB. Only the amount of reinforcement of one story is calculated as an example, and the size of the rebar model file is 55M. Case 3 is a four-story shopping mall project with a total construction area of approximately 122,000 square meters. Only the MEP engineering quantity of the local area in one story (about 1/6 of one story) is calculated as an example, and the size of the MEP model file is 58.9 MB.
Table 11 shows the time of quantity takeoff using the BQTCM method and the G method in four aspects, i.e., concrete, MEP, rebar, and rough decoration. In addition, this paper regards the time taken by the G method for quantity takeoff as 1, which can reflect the quantitative comparison of these two methods in quantity takeoff time more intuitively.
Moreover, combined with the actual situation, when the G method is adopted to calculate quantities, the input data are the calculation model rather than the BIM model of buildings, which means that the step of establishing the calculation model needs to be carried out before quantity takeoff. The time spent in this step is not reflected in Table 11, and it is longer or at least not shorter than the calculation time of using this method. However, when the BQTCM method is used for quantity takeoff, the BIM model can be directly used as input data for calculation. In general, compared with the G method, the BQTCM method shows a higher computational efficiency in quantity takeoff.
In combination with the above two sections, the BQTCM method shows a better application prospect for quantity takeoff in practice both in accuracy and efficiency.

7. Conclusions

This paper presents the BQTCM method to map BIM data and construction classification systems and develops the QTCMP based on Revit 2018 for quantity takeoff as the implementation of the BQTCM method. Through the comparison between the quantity takeoff results obtained by the BQTCM method and the G method in three cases, the findings of this paper are concluded as follows:
(1) The BQTCM method can be used to complete the bill of quantities of architecture, structure, MEP, rebar, and rough decoration models. According to the quantity takeoff result of engineering examples using the QTCMP, the quantity takeoff accuracy of the BQTCM method is very high, which is similar to the quantity takeoff result of the G method. At the same time, it shows a higher computational efficiency in quantity takeoff using the QTCMP compared with the G method.
(2) Compared with the method of quantity takeoff based on BIM data proposed in the previous study [14], the BQTCM method is more convenient. Due to no data format conversion, no erroneous data are generated.
(3) In addition to being applicable to the calculation of bill of quantities in China, the BQTCM method can also be applied to other countries or regions by changing the built-in quantity takeoff rules.
This paper provides valuable insights for BIM-based engineering quantity calculation automation. Through the mapping of BIM data and construction classification system, the accuracy and efficiency of BIM-based engineering quantity calculation results are improved, which can be served as a reference for future researchers in similar fields. Although the BQTCM method is applicable to a wider range, there are still some difficulties in the realization of the complete automation of quantity takeoff. For some tasks and subtasks without standard family libraries, it is difficult to automatically convert them to bill items through the component information obtained by the Revit 2018 model. The mapping between the tasks or sub-tasks and the Chinese quantity takeoff code still needs to be done manually. The automation of quantity takeoff has not been completely realized. For some buildings with lots of components that are not parts of the standard family libraries, the task of cost engineers in quantity takeoff is still heavy. There are two possible solutions to this problem, one is enriching the Revit 2018 standard family libraries, the other is increasing component classification conditions, which ensures that the components not belonging to standard family libraries can be classified easier in the process of identification rules.

Author Contributions

Conceptualization, B.C. and Y.S.; Data curation, Y.S. and Y.M.; Formal analysis, B.C., S.J. and Y.M.; Funding acquisition, B.C. and S.J.; Investigation, M.W.; Methodology, L.Q.; Project administration, S.J. and L.Q.; Resources, Y.S.; Software, M.W.; Supervision, S.J. and L.Q.; Validation, Y.M.; Visualization, M.W. and H.S.C.; Writing—original draft, B.C. and M.W.; Writing—review and editing, S.J., Y.M. and H.S.C. All authors have read and agreed to the published version of the manuscript.

Funding

The work described in this paper was supported by the National Natural Science Foundation of China (Grant No. 52078101), the Fundamental Research Funds for the Central Universities (Grant No. DUT20TD113), and the National Key R&D Program of China (Grant No. 2016YFC0702100).

Data Availability Statement

The data presented in this study are available on request from the corresponding author. The data are not publicly available due to privacy.

Acknowledgments

The authors would also like to thank the anonymous reviewers who provided invaluable suggestions for improving the quality of the manuscript.

Conflicts of Interest

The authors declare no conflict of interest.

References

  1. Monteiro, A.; Martins, J.P. A survey on modeling guidelines for quantity takeoff-oriented BIM-based design. Autom. Constr. 2013, 35, 238–253. [Google Scholar] [CrossRef]
  2. Liu, H.; Lu, M.; Al-Hussein, M. Ontology-based semantic approach for construction-oriented quantity take-off from BIM models in the light-frame building industry. Adv. Eng. Inform. 2016, 30, 190–207. [Google Scholar] [CrossRef]
  3. Mashayekhi, A.; Sherafat, B.; Taghaddos, H. Automation of Construction Quantity Take-Off: Using Building Information Modeling (BIM). 2019, pp. 2218–2227. Available online: https://ascelibrary.org/doi/pdf/10.1061/9780784479827.221 (accessed on 11 May 2022).
  4. Khosakitchalert, C.; Yabuki, N.; Fukuda, T. Improving the accuracy of BIM-based quantity takeoff for compound elements. Autom. Constr. 2019, 106, 102891. [Google Scholar] [CrossRef]
  5. Abanda, F.H.; Byers, L. An investigation of the impact of building orientation on energy consumption in a domestic building using emerging BIM (Building Information Modelling). Energy 2016, 97, 517–527. [Google Scholar] [CrossRef]
  6. Abanda, F.H.; Nkeng, G.E.; Tah, J.H.M.; Ohandja, E.N.F.; Manjia, M.B. Embodied Energy and CO2 Analyses of Mud-brick and Cement-block Houses. AIMS Energy 2014, 2, 18–40. [Google Scholar]
  7. Abanda, F.H.; Manjia, M.B.; Pettang, C.; Tah, J.H.M.; Nkeng, G.E. Building Information Modelling in Cameroon: Overcoming Existing Challenges. IJ3DIM 2014, 3, 1–25. [Google Scholar] [CrossRef] [Green Version]
  8. Hsieh, C.-C.; Liu, C.-Y.; Wu, P.-Y.; Jeng, A.-P.; Wang, R.-G.; Chou, C.-C. Building information modeling services reuse for facility management for semiconductor fabrication plants. Autom. Constr. 2019, 102, 270–287. [Google Scholar] [CrossRef]
  9. Chong, H.-Y.; Lee, C.-Y.; Wang, X. A mixed review of the adoption of Building Information Modelling (BIM) for sustainability. J. Clean. Prod. 2017, 142, 4114–4126. [Google Scholar] [CrossRef] [Green Version]
  10. Zou, Y.; Kiviniemi, A.; Jones, S.W. A review of risk management through BIM and BIM-related technologies. Saf. Sci. 2017, 97, 88–98. [Google Scholar] [CrossRef]
  11. Azhar, S. Building Information Modeling (BIM): Trends, Benefits, Risks, and Challenges for the AEC Industry. Leadersh. Manag. Eng. 2011, 11, 241–252. [Google Scholar] [CrossRef]
  12. Sampaio, A.Z.; Antunes, B.G.; de Almeida, N.M. Quantity Take-Off Process Supported by Building Information Modeling (BIM) Methodology; Springer International Publishing: Cham, Switzerland, 2020; pp. 21–28. [Google Scholar]
  13. David, N. Chapter 6—Selection of Variables and Factor Derivation; Elsevier Inc.: San Francisco, CA, USA, 2014; pp. 79–104. [Google Scholar]
  14. Ma, Z.; Wei, Z.; Zhang, X. Semi-automatic and specification-compliant cost estimation for tendering of building projects based on IFC data of design model. Autom. Constr. 2013, 30, 126–135. [Google Scholar] [CrossRef]
  15. Jiawei, H.; Micheline, K.; Jian, P. 2—Getting to Know Your Data, 3rd ed.; Elsevier Inc.: Cham, Switzerland, 2012; pp. 39–82. [Google Scholar]
  16. Liu, H.; Cheng, J.C.P.; Gan, V.J.L.; Zhou, S. A knowledge model-based BIM framework for automatic code-compliant quantity take-off. Autom. Constr. 2022, 133, 104024. [Google Scholar] [CrossRef]
  17. Olsen, D.; Taylor, J.M. Quantity Take-Off Using Building Information Modeling (BIM), and Its Limiting Factors. Procedia Eng. 2017, 196, 1098–1105. [Google Scholar] [CrossRef]
  18. Zhou, W.; Qin, H.; Qiu, J.; Fan, H.; Lai, J.; Wang, K.; Wang, L. Building information modelling review with potential applications in tunnel engineering of China. R. Soc. Open Sci. 2017, 4, 170174. [Google Scholar] [CrossRef]
  19. Zhiliang, M.; Zhenhua, W.; Wu, S.; Zhe, L. Application and extension of the IFC standard in construction cost estimating for tendering in China. Autom. Constr. 2011, 20, 196–204. [Google Scholar] [CrossRef]
  20. Firat, C.E.; Arditi, D.; Hámälainen, J.P.; Stenstrand, J.; Kiiras, J. Quantity take-off in model-based systems. In Proceedings of the 27th CIB W78 International Conference, Cairo, Egypt, 16–19 November 2010. [Google Scholar]
  21. Aram, S.; Eastman, C.; Sacks, R. A Knowledge-Based Framework for Quantity Takeoff and Cost Estimation in the AEC Industry Using BIM. In Proceedings of the International Symposium on Automation and Robotics in Construction, Sydney, NSW, Australia, 9–11 July 2014; IAARC Publications: Sydney, NSW, Australia, 2014; pp. 428–436. [Google Scholar]
  22. Choi, J.; Kim, H.; Kim, I. Open BIM-based quantity take-off system for schematic estimation of building frame in early design stage. J. Comput. Des. Eng. 2015, 2, 16–25. [Google Scholar] [CrossRef] [Green Version]
  23. Lim, C.; Hong, W.-K.; Lee, D.; Kim, S. Automatic Rebar Estimation Algorithms for Integrated Project Delivery. J. Asian Arch. Build. Eng. 2016, 15, 411–418. [Google Scholar] [CrossRef] [Green Version]
  24. Salama, D.M.; El-Gohary, N.M. Semantic Text Classification for Supporting Automated Compliance Checking in Construction. J. Comput. Civ. 2016, 30, 4014106. [Google Scholar] [CrossRef]
  25. Code of Valuation with Bill Quantity of Construction Works GB 50500—2013. 2012, Volume 2022. Available online: http://www.jianbiaoku.com/webarbs/book/104/2116942.shtml (accessed on 9 January 2016).
  26. Yang, B.; Zhang, B.; Wu, J.; Liu, B.; Wang, Z. A BIM-based Quantity Calculation Framework for Frame-shear Wall Structure. Struct. Eng. Int. 2019, 29, 282–291. [Google Scholar] [CrossRef]
  27. Kim, S.; Chin, S.; Kwon, S. A Discrepancy Analysis of BIM-Based Quantity Take-Off for Building Interior Components. J. Manag. Eng. 2019, 35, 5019001. [Google Scholar] [CrossRef]
  28. Afsari, K.; Eastman, C.M. A Comparison of Construction Classification Systems Used for Classifying Building Product Models. In Proceedings of the 52nd ASC Annual International Conference, Provo, Utah, 9 January 2016. [Google Scholar]
  29. CSI (Construction Specifications Institute). MasterFormat. CSI (Construction Specifications Institute), CSC (Construction Specifications Canada): Alexandria, United States of America. 2006. Available online: https://www.csiresources.org/standards/masterformat (accessed on 11 May 2022).
  30. CSI (Construction Specifications Institute). Uniformat. CSI (Construction Specifications Institute), CSC (Construction Specifications Canada): Alexandria, United States of America. 2006. Available online: https://www.csiresources.org/standards/uniformat (accessed on 11 May 2022).
  31. CSI (Construction Specifications Institute). OmniClass. CSI (Construction Specifications Institute), CSC (Construction Specifications Canada): Alexandria, United States of America. 2006. Available online: https://www.csiresources.org/standards/omniclass (accessed on 11 May 2022).
  32. Weygant, R.S. BIM Content Development: Standards, Strategies, and Best Practices; Wiley: New York, NY, USA, 2011. [Google Scholar]
  33. Yun, S.; Kim, S. Basic Research on BIM-Based Quantity Take-off Guidelines. Arch. Res. 2013, 15, 103–109. [Google Scholar] [CrossRef] [Green Version]
Figure 1. (a) Individual and (b) compound modeling method.
Sustainability 14 07797 g001
Figure 2. General process map for specification-compliant quantity takeoff based on the BIM data of design model.
Sustainability 14 07797 g002
Figure 3. A specific example of GB50500 code.
Sustainability 14 07797 g003
Figure 4. Process of dealing with small openings.
Sustainability 14 07797 g004
Figure 5. Main operation interface of the QTCMP: (a) property dialog box; (b) rule identification dialog box; (c) bill coding dialog box.
Sustainability 14 07797 g005
Figure 6. An application example of the mapping interface.
Sustainability 14 07797 g006
Figure 7. The quantity takeoff results.
Sustainability 14 07797 g007
Figure 8. The key algorithm for a beam’s quantity takeoff based on QTCMP.
Sustainability 14 07797 g008
Figure 9. The process map for the calculation of the duct area.
Sustainability 14 07797 g009
Figure 10. The process map for the calculation of the column reinforcement length.
Sustainability 14 07797 g010
Figure 11. Analysis of quantity takeoff results of the BQTCM method and G method for different engineering types: (a) concrete; (b) formwork; (c) water supply; (d) water drainage; (e) rebar; (f) rough decoration.
Sustainability 14 07797 g011
Table 1. The calculation results obtained by individual and compound modeling methods.
MethodArea (m2)Volume (m3)
Individual252
Compound52
Table 2. The special calculating rules around the world.
RegionStandardClause
United KingdomRICS New Rules of Measurement 2No deductions made for voids ≤ 1.00 m2 (in the quantity takeoff of crib walls)
ChinaGB50500The volume occupied by a single hole with an area less than 0.3 m2 is not deducted
Sri LankaSri Lanka Standard 573No deduction shall be made for openings of 0.5 m2 or less (in the quantity takeoff of the slab’s formwork)
Table 3. A code example in table 23 of OmniClass.
OmniClass CodeLevel 1Level 2Level 3Level 4Level 5
23–13 00 00Structural and Exterior Enclosure Products
23–13 19 00 Sheets, Boards, and Slabs
23–13 19 13 Rigid Sheets, Slabs, Plates
23–13 19 13 11 Solid Sheets
23–13 19 13 11 13 Solid Cementitious Sheets
23–13 19 13 11 19 Solid Metal Sheets
Table 4. Component deduction priority list.
NoComponentPriority
1Structural wall1
2Structural slab2
3Structural column3
4beam4
5Architectural wall5
6Architectural column6
Table 5. Analysis of quantity takeoff results of the concrete volume (m3).
NumberCalculation CategoriesG MethodBQTCM MethodAbsolute Percent Deviation
1Pile203.4203.40
2356.6356.60
3Cap137.9139.10.9%
4281.7281.80.4%
5Column198.1198.10
6916.2916.20
7Beam318.9316.40.8%
81567.71567.70
9Slab1127.41128.90.1%
10834.7834.70
c1
p1
Table 6. Analysis of quantity takeoff results of the formwork area (m2).
NumberCalculation CategoriesG MethodBQTCM MethodAbsolute Percent Deviation
1Beam9275.39280.90.6%
217529.117535.20.3%
3Slab6955.56957.90.7%
417325.717338.10.1%
5Column3979.13985.90.1%
64055.74057.80.5%
7Wall37799.137816.30.1%
858668.558678.10.1%
c1
p1
Table 7. Analysis of quantity takeoff results of the MEP pipeline length (m).
NumberCalculation CategoriesG MethodBQTCM MethodAbsolute Percent Deviation
1Bridge Frame19.619.91.5%
215.114.91.3%
312.312.40.8%
477.979.41.9%
5Plumbing Pipeline453.6450.90.6%
6338.4341.50.9%
71115.71115.30
811.911.90
c1
p1
Table 8. Analysis of quantity takeoff results of the MEP pipeline area (m2).
NumberCalculation CategoriesG MethodBQTCM MethodAbsolute Percent Deviation
1Mechanical Pipeline564.5560.30.8%
24534.94612.81.7%
3521.3523.10.3%
4503.6510.31.3%
51218.51236.71.5%
631.331.81.6%
7158.6161.31.7%
852.853.71.7%
c1
p1
Table 9. Analyses of quantity takeoff results of the rebar weight (kg).
NumberG MethodBQTCM MethodAbsolute Percent Deviation
1130612931%
212310121761%
339980399260.1%
4495749900.7%
525324249521.5%
636933366020.9%
752521522950.4%
870701703970.4%
953531533010.4%
1045147449420.5%
c1
p1
Table 10. Analyses of quantity takeoff results of the rough decoration area (m2).
NumberCalculation CategoriesG MethodBQTCM MethodAbsolute Percent Deviation
1Coating area of wall2827.51.8%
21211.90.8%
3Coating area of ceilings5453.70.6%
42322.71.3%
5Ceiling area of rooms7271.30.9%
65655.11.6%
7Ceiling area of corridors7573.81.6%
870.369.51.5%
c1
p1
Table 11. Comparison of the quantity takeoff time of these two methods.
Case DisciplineQuantity Takeoff Time of the G Method (s)Quantity Takeoff Time of the BQTCM Method (s)Quantity Takeoff Time Ratio
2Concrete3254851:1.5
Rebar4326451:1.5
3Heating ventilating15781:9.1
Water supply and drainage54
Electricity4
Rough decoration3375051:1.5
Publisher’s Note: MDPI stays neutral with regard to jurisdictional claims in published maps and institutional affiliations.