Article

Effects of Soil Properties and Tree Species on Root–Soil Anchorage Characteristics

1
Department of Civil Engineering, Beijing Forestry University, Beijing 100083, China
2
Key Laboratory of State Forestry Administration on Soil and Water Conservation, Beijing Forestry University, Beijing 100083, China
*
Author to whom correspondence should be addressed.
Sustainability 2022, 14(13), 7770; https://doi.org/10.3390/su14137770
Submission received: 28 May 2022 / Revised: 17 June 2022 / Accepted: 21 June 2022 / Published: 25 June 2022
(This article belongs to the Special Issue Slope Stability Analysis and Landslide Disaster Prevention)

Abstract

:
Root anchoring provides nonnegligible assistance to prevent soil erosion and stabilize slopes. The anchoring ability of plants suffers a tremendous impact from the soil conditions and the root characteristics. To reveal the root reinforcement effect, a group of pullout tests was conducted on five different tree root systems (Pinus tabulaeformis, Betula platyphylla, Larix gmelinii, Quercus mongolica, and Ulmus pumila) with different soil moisture contents and soil dry weights. The results indicate that the root property (species, diameter, and tensile strength) and soil condition (water content 9.72%, 12.72%, 15.72%, 18.72%, and dry weight 1.32 g/cm3, 1.42 g/cm3, 1.52 g/cm3) had a significant effect on the anchoring effect of the soil. The anchoring effect is more obvious for the roots with a larger diameter and higher tensile strength. With the increase in the soil water content and the dry weight, the root system is more prone to failure but the root anchoring effect of soil with an optimum soil water content performs the best. Among the five different tree species, Pinus tabulaeformis roots were the least effective in anchoring the soil and Betula platyphylla roots performed the best.

1. Introduction

Plant roots play an important role in reinforcing the soil, preventing harmful soil movement, and stabilizing the plant itself. A proper understanding of root reinforcement and anchoring mechanisms is important to prevent soil erosion and stabilize slopes and riverbanks [1,2,3,4,5].
Root reinforcement of the soil is divided into two types: fine-root reinforcement [6] and large-root anchoring [7]. Studies on root anchoring have shown that vertical roots can penetrate deep into the soil and enhance soil stability through friction between the primary and lateral roots and the soil body [8,9,10]. The root system pullout resistance in soil plays a critical role in root anchorage and has received much attention in past studies [11,12,13]. The anchoring effect of root systems in the soil is mainly verified by root pullout tests and numerical simulations [14,15]. The major factors influencing it include soil physical properties, soil shear strength, root distribution, root morphological characteristics, and root tensile properties [16,17,18,19]. Some scholars analyzed root pullout resistance and displacement curves by root pullout tests and studied the characteristics of mechanical processes and damage modes of roots being pulled out of the soil [20,21,22]. The physical properties of the soil have a significant effect on the anchoring effect of the root system [23]. According to pullout tests on tree and shrub roots, the maximum pullout force of plant roots in soil decreases with increasing soil water content [24,25]. The tensile strength of roots in soils with low water content increases significantly [26,27]. At the same time, plant roots have a significant enhancement of soil shear strength under high water content soil conditions, which improves soil stability [28,29]. In addition, the different soil types (freely draining mineral soils, gleyed mineral soils, peaty mineral soils, and deep peat soils) had an obvious effect on the anchorage of the roots [30]. The results of numerical simulations showed that the soil type (clay soils, sandy soils, clay loam soils) had a strong influence on the resistance to uprooting [31]. Therefore, soil properties have an important effect on root anchorage performance, but the effect of different dry weight soils on root anchorage performance is less reported.
Regarding the influence of plant roots on the anchorage effect. Enno et al. [32] proposed a critical root length (Lcrit) to define the fracture and slip of the root system in the soil during pullout, a value proportional to the root diameter. There is a positive correlation between root tensile properties and maximum pullout force in pullout tests [33], and Young’s modulus also plays an important role in root anchorage [34,35]. Different root diameters and root water content of different tree species have a significant effect on tensile strength [36]. The results of some root pullout tests showed that branching and bending of roots increased the anchorage force [13,37], and the branch angle and branch root diameter of the branch root system affected the anchorage characteristics between the root system and the soil [35,38]. The root pullout force increased with the loading rate and the depth of root addition [39,40]. In addition, some scholars have constructed theoretical models of root anchorage through numerical simulations to investigate the mechanisms of root configuration, soil properties, root branching patterns, and root distribution on root anchorage to soil [15,41,42,43]. However, the numerical models must be based on in situ or laboratory experimental data on root anchoring. Several past scholars have discussed the anchoring effect of roots of many different tree species through in situ and indoor pullout tests, such as Pinus sylvestris L. [44], Brassica apus L. [10], Eugenia grandis Wight [45], Chamaecyparis obtuse [46], Salix babylonica, and Juglans ailanthifolia [14]. Kurniatun et al. discussed the differences in root distribution of five tree species (Swietenia mahogani, Gmelina arborea, Toona sureni, Coffea canephora, and Bambusa arundinacea) on the soil anchoring effect [47]. The root anchorage properties of many tree species widely planted in northern China have been less reported.
In summary, previous scholars have conducted numerous studies on the anchoring effect of root systems on soils. However, less attention has been paid to the relationship between soil dry weight and different tree species on root reinforcement of soil in previous studies. The roots anchorage properties of five tree species (Pinus tabulaeformis, Betula platyphylla, Larix gmelinii, Quercus mongolica, and Ulmus pumila) widely planted in northern China were investigated in this study. The pullout test method in the laboratory to test the anchorage mechanics on the root–soil interface was used. The effect of tree species, roots diameter, water content, and dry weight of soils on the roots anchorage properties are discussed based on the experimental test results.

2. Materials and Methods

2.1. Study Area

The roots and soil for tests were obtained in the Beigou forestry field (800–1600 m altitude, 40°54′33″ N, 117°27′38″ E) located in Hebei province in northeastern China. The region has cold-temperate and medium-temperate, semi-arid and semi-humid transition continental monsoon climate, with an annual average temperature of −1.4–4.7 °C. In this region, the rainfall is mainly concentrated in June–September with an annual average rainfall of 390–570 mm. The soil in the area is a representative sandy soil of the Rocky Mountain region in the north of China, a fine sandy loam with dark brown and light-colored grains. As the climate of Beigou Forest is humid all year round, the topography and soil conditions are suitable for the growth of Pinus tabulaeformis, Betula platyphylla, Larix gmelinii, and other plants.

2.2. Soil and Root Collection
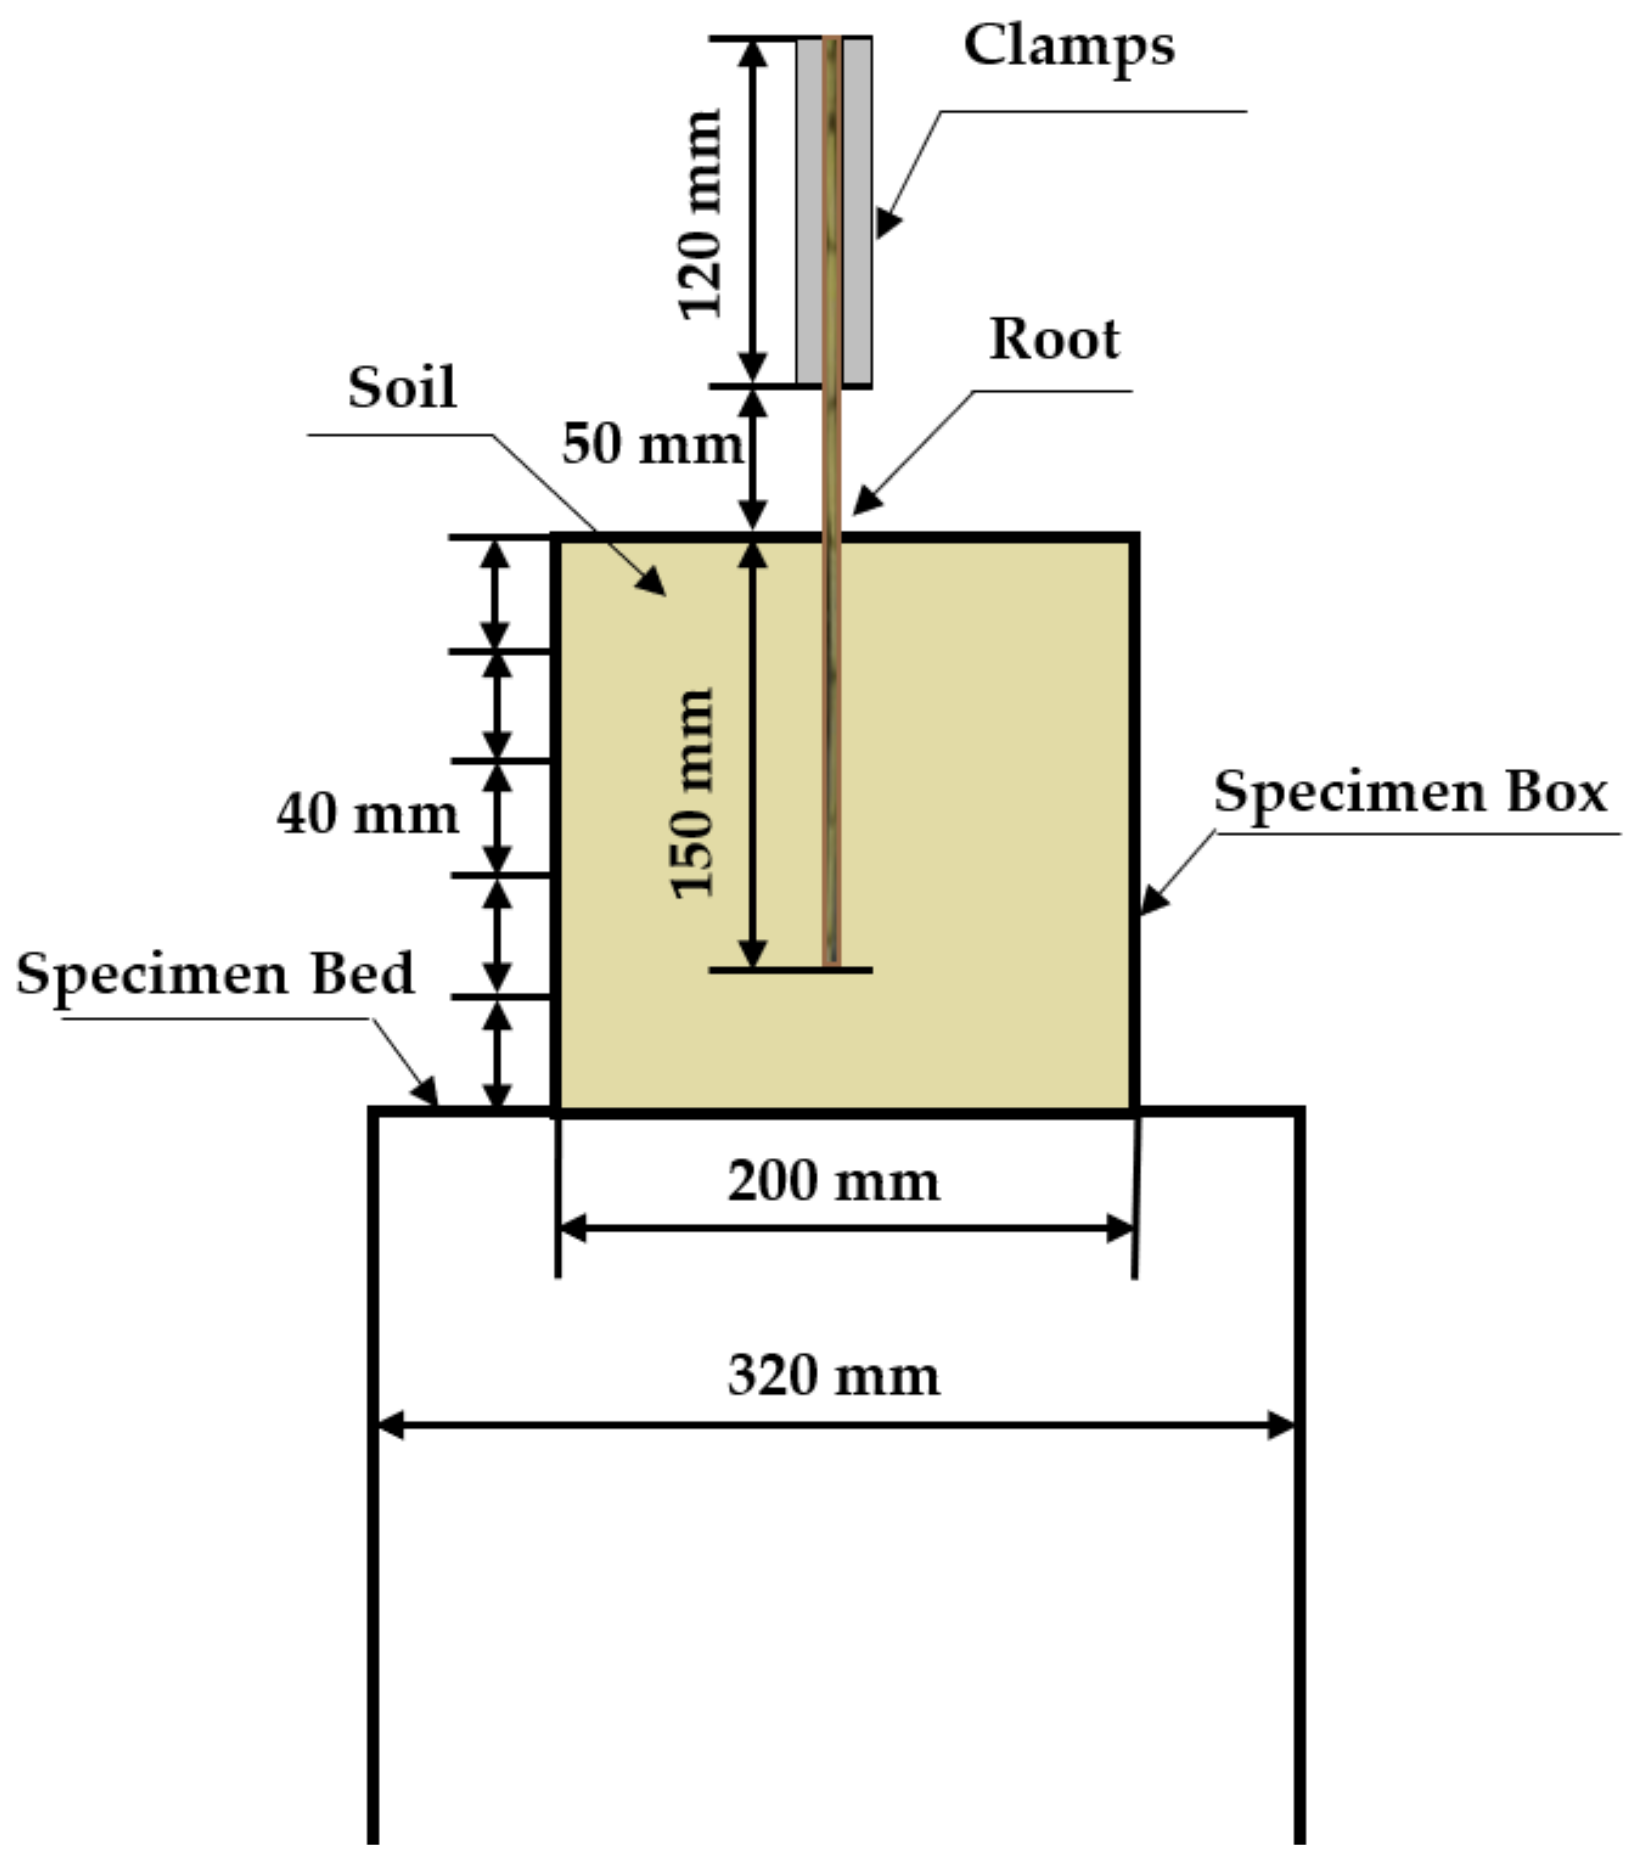
Five species of trees commonly found in the study area were selected for this experiment, three trees were excavated for each species. All the trees were located on sunny slopes. The mean slope angle was 8°. The mean tree age and mean height at breast height were 25 years and 9.2 cm (Pinus tabulaeformis), 24 years and 10.3 cm (Betula platyphylla), 21 years and 13.3 cm (Larix gmelinii), 22 years and 8.5 cm (Quercus mongolica), and 27 years and 12 cm (Ulmus pumila), respectively. All the roots were sampled with the whole root system excavating method. The chosen trees were cut 30 cm above the ground. The soil around the trunk was cleaned out carefully until the root system was entirely exposed as shown in Figure 1. Then, the roots were taken out, being careful to avoid any root damage or stress. The excavated roots were put in sealed bags and transported to the laboratory then stored in the refrigerator at 4 °C. To ensure the freshness of the roots, the roots were subjected to pullout tests within 1 month after sampling. After collecting the roots, the soil near the roots of the plants in the soil pit shown in Figure 1 was collected and the top layer of soil (0–20 cm) discarded. The collected soil was sieved through a 2 mm mesh and then sent to the laboratory for analysis of the physical properties of the soil. The following section describes the soil and root system properties in detail.

2.3. Test Methods

Based on the indoor pullout test method, we designed a test apparatus independently, as shown in Figure 2. The test apparatus consists of a drive system, a loading system, a specimen system, and a data acquisition system. Among them, the driving system is mainly composed of two synchronous self-servo motors and vertical linear motion units. The loading system mainly consists of a portal frame, motion beam, and fixture. The specimen system mainly consists of a sample box and a liftable sample table. The sample box is a cube made of steel plate with dimensions of 200 mm × 200 mm × 200 mm. There is a narrow gap (2 cm × 5 cm) in the center of the upper surface, and the upper narrow gap and one side of the plate are removable. The sample table is fixed to the bottom of the rigid frame. The data acquisition system mainly consists of a load cell (CYB-S-10, Beijing Zhongke Mingwei Technology Co., Beijing, China), a precision displacement transducer LVDT (ZKL-A-300, Beijing Zhongke Mingwei Technology Co., Beijing, China), a data acquisition instrument, and data acquisition and analysis software (DAQ, Beijing Zhongke Mingwei Technology Co., Beijing, China).
The test procedure was as follows: first, soil preparation was performed according to the soil water content of the experimental design. The soil was added to the sample box in five layers and then laterally compacted in layers using a removable cube. After filling half of the third layer with soil, a single stand was placed in the soil through a pre-drilled hole in the steel plate at a set burial depth and then the other half of the third layer was added for compaction. Finally, the last two layers of soil were added. After soil compaction, the roots were in the center, thus ensuring uniform root stress. The final specimen system is shown in Figure 3. The test was designed with a single root burial depth of 150 mm, a free end of 50 mm, and a collet clamping length of 120 mm for each tree species, for a total of 320 mm. It was also ensured that the diameter of the entire root system did not vary more than 0.5 mm along the root length. A pullout load speed of 10 mm/min was set and the data were collected through the data acquisition system.
In this paper, first, the physical properties and root properties of the soil were determined. Second, five tree species were divided into 10 sets for root pulling tests, as shown in Table 1. The factors influencing the tests included soil water content (9.72%, 12.72%, 15.72%, 18.72%), soil dry weight (1.32 g/cm3, 1.42 g/cm3, 1.52 g/cm3), root property (diameter and tensile strength), and five tree species (Pinus tabulaeformis, Betula platyphylla, Larix gmelinii, Quercus mongolica, and Ulmus pumila). Based on the results of pullout tests, two failure modes were found, root breakage failure and pullout failure. Breakage failure refers to the root system breaking during the pullout process, and pullout failure refers to the root system being completely pulled out of the soil. Finally, the L-S (Pullout load–Slippage) curve was plotted, and the L-S curve showed the variation process of pullout load with the amount of root system slip during the pullout process. The L-S curve was used to analyze the effects of soil properties, root property, and tree species on root–soil anchorage characteristics. The regression equation of maximum bond force (Fbmax) and root system diameter (Dr) with different moisture contents and tree species was also established using Matlab (R2019b, MathWorks USA, Inc., Natick, MA, USA) software.

3. Soil and Root Properties

3.1. Soil Physical Properties

The soil is a representative sandy soil of the Rocky Mountain region of northern China with dark brown and light-colored grains. Five in-situ soil samples were collected with a ring knife, and the water content and dry density of the soil were measured using the oven-drying method (drying at 105 °C). A measure of 200 g of soil samples was weighed and a combined liquid limit and plastic limit tester (LP-100D, Beijing Aerospace Huayu Testing Instruments Co., Beijing, China) was used to measure the liquid limit and plastic limit of the soil. Based on the measured results, the plastic index of the soil was calculated and the soil type was determined to be sandy clay. The particle gradation of the soil was analyzed using a laser particle size analysis instrument (Mastersizer 3000E, Sage Technology Co., Beijing, China). The physical properties of the soil in the test area are summarized in Table 2.

3.2. Root Traits of Five Tree Species

The root traits of the five tree species were carefully measured in the field after digging the roots. The parameters, such as root diameter along the root length, root length in each soil layer, and the dry weight of roots were measured. The mean root length of the five tree species with different root diameter groups was calculated after measuring the root lengths as shown in Table 3. The roots were divided into five groups based on the root diameters: 1–3 mm (C1), 3–5 mm (C2), 5–10 mm (C3), and 10–20 mm (C4), and >20 mm (C5).The soils around the tree were divided into five layers along the depth direction: 0–20 cm (S1), 20–40 cm (S2), 40–60 cm (S3), 60–80 cm (S4), and 80–100 cm (S5). The mean root length of five tree species in different layers was calculated as shown in Table 4. The biomass of roots is one of the important factors of root morphology. The root biomass of the five tree species with different root diameter groups was measured after sampling as shown in Table 5.

3.3. Root Tensile Resistance of Five Tree Species

The root tensile properties of the five tree species were tested using a universal testing machine with a range of 100 kN (WDE-100). The root resistance of the five tree species is shown in Table 6. Many roots were tested (the minimum number of samples was 27 (Ulmus pumila), the maximum number of samples was 250 (Betula platyphylla)) and the root diameter ranged from 0.5 mm (Pinus tabulaeformis) to 9.57 mm (Betula platyphylla). The tensile test data were imported into Matlab software for fitting the equations. The regression equation for the relationship between root diameter and root tensile strength was established, as shown in Table 6. As shown by the correlation coefficient R2 (the minimum value of the correlation coefficient was 0.7327 (Ulmus pumila) and the maximum value reached 0.9627 (Pinus tabulaeformis)), the regression equation was in good agreement with experimental results. Thus, the root tensile resistance had a marked exponent relation to the root diameter for each tree species. The larger the diameter of the root system, the greater the tensile strength.

4. Results and Discussion

4.1. Root Pullout Test Pullout Load–Slippage Curves

The root–soil pullout test L-S (Pullout load–Slippage) curves are shown in Figure 4 and correspond to the results of the 10 sets of tests in Table 1. The curves showed multiple peaks with a clear dominant peak. The root slip value increases with increasing pullout load, and after the pullout load reaches its maximum value, the pullout load decreases with increasing slip and then shows a fluctuating decrease until the end of the test. Each set of curves contains pullout test curves with the same test conditions but different diameters. From each set of curves, it can be found that many curves do not start from the coordinate origin. When the root system started to slip, a certain magnitude of pullout load was already applied to the root system. We define the pullout load as when the root system starts to slip as the initial pullout load. Therefore, from the L-S curve obtained from the pullout test, we can directly obtain the maximum frictional anchorage load at the root system–soil interface, the peak slip, and the initial pullout load.
As shown in Figure 4, the maximum pullout load increases with increasing root system diameter. However, due to the biological characteristics of the forest tree root system, the different surface conditions of the root system itself, the number of nodes, etc. all have an effect on the anchoring performance of the root system to the soil [23,47]. As a result, some root curves with larger diameters were instead below the curves with smaller diameters, although the general trend is that the maximum pullout load increases as the diameter increases. The slope of the curve also tends to increase with the diameter, and the slope of the curve represents the stiffness of the action of the frictional anchorage between the root system and the soil. The greater the stiffness, the greater the ability of the interface frictional anchorage to resist slippage. As seen from the 10 sets of pullout curves, the larger the diameter of the root system under the identical pullout load, the smaller the amount of slip that occurred. Therefore, the root anchoring effect on soil increases with the increase of root diameter.

4.2. Failure Mode of the Roots

For Pinus tabulaeformis roots, the anchorage mechanical properties under different soil water content and different soil dry weights were tested with the pullout test method in the lab. The water content of the soil used in the pullout test specimen as designed was 9.72%, 12.72%, 15.72%, and 18.72%. The dry weight of the soil used in the pullout test specimen as designed was 1.52 g/cm3, 1.42 g/cm3, and 1.32 g/cm3. The test results showed that there were two types of failure modes of the roots during the pullout test for the five tree species. One is the root breakage failure, which is when the root is broken during the pullout test. The other type is pullout failure, that is, the root was pulled out from the soil completely during the pullout test. Table 1 shows the failure mode of the single root of five tree species after the pullout test. The failure mode of all the roots tests with different diameters is shown in Figure 5.
For roots that undergo breakage failure mode, when anchored in the soil, one end in the soil can be equated to being clamped. When the other end is stressed, the force required for the root to undergo breakage failure is equal to the maximum tensile strength of the root system. Therefore, the maximum pullout force was the maximum tensile resistant force that the root could bear. Figure 5 shows the maximum pullout force of the Pinus tabulaeformis roots with breakage failure mode under different experimental conditions. Table 5 gave the regression equation of the tensile resistance of the Pinus tabulaeformis roots. The calculated root resistance of the roots with breakage failure mode could be obtained based on the regression equation as shown in Figure 6. The calculated root resistance of the root with breakage failure mode was close to the maximum pullout force of the root.
There were two types of failure modes for the roots tested using the pullout test method. This result is consistent with previous studies [12,40]. The previous studies showed that the tree was broken on the stem or uprooted when the interaction between soil and root could not counteract the effect of wind load or flood load. When the tree was broken on the stem, the root did not fail. When the tree was uprooted, the root was broken or pulled out, indicating that the real failure mode of the root also had two types: pullout failure and breakage failure.

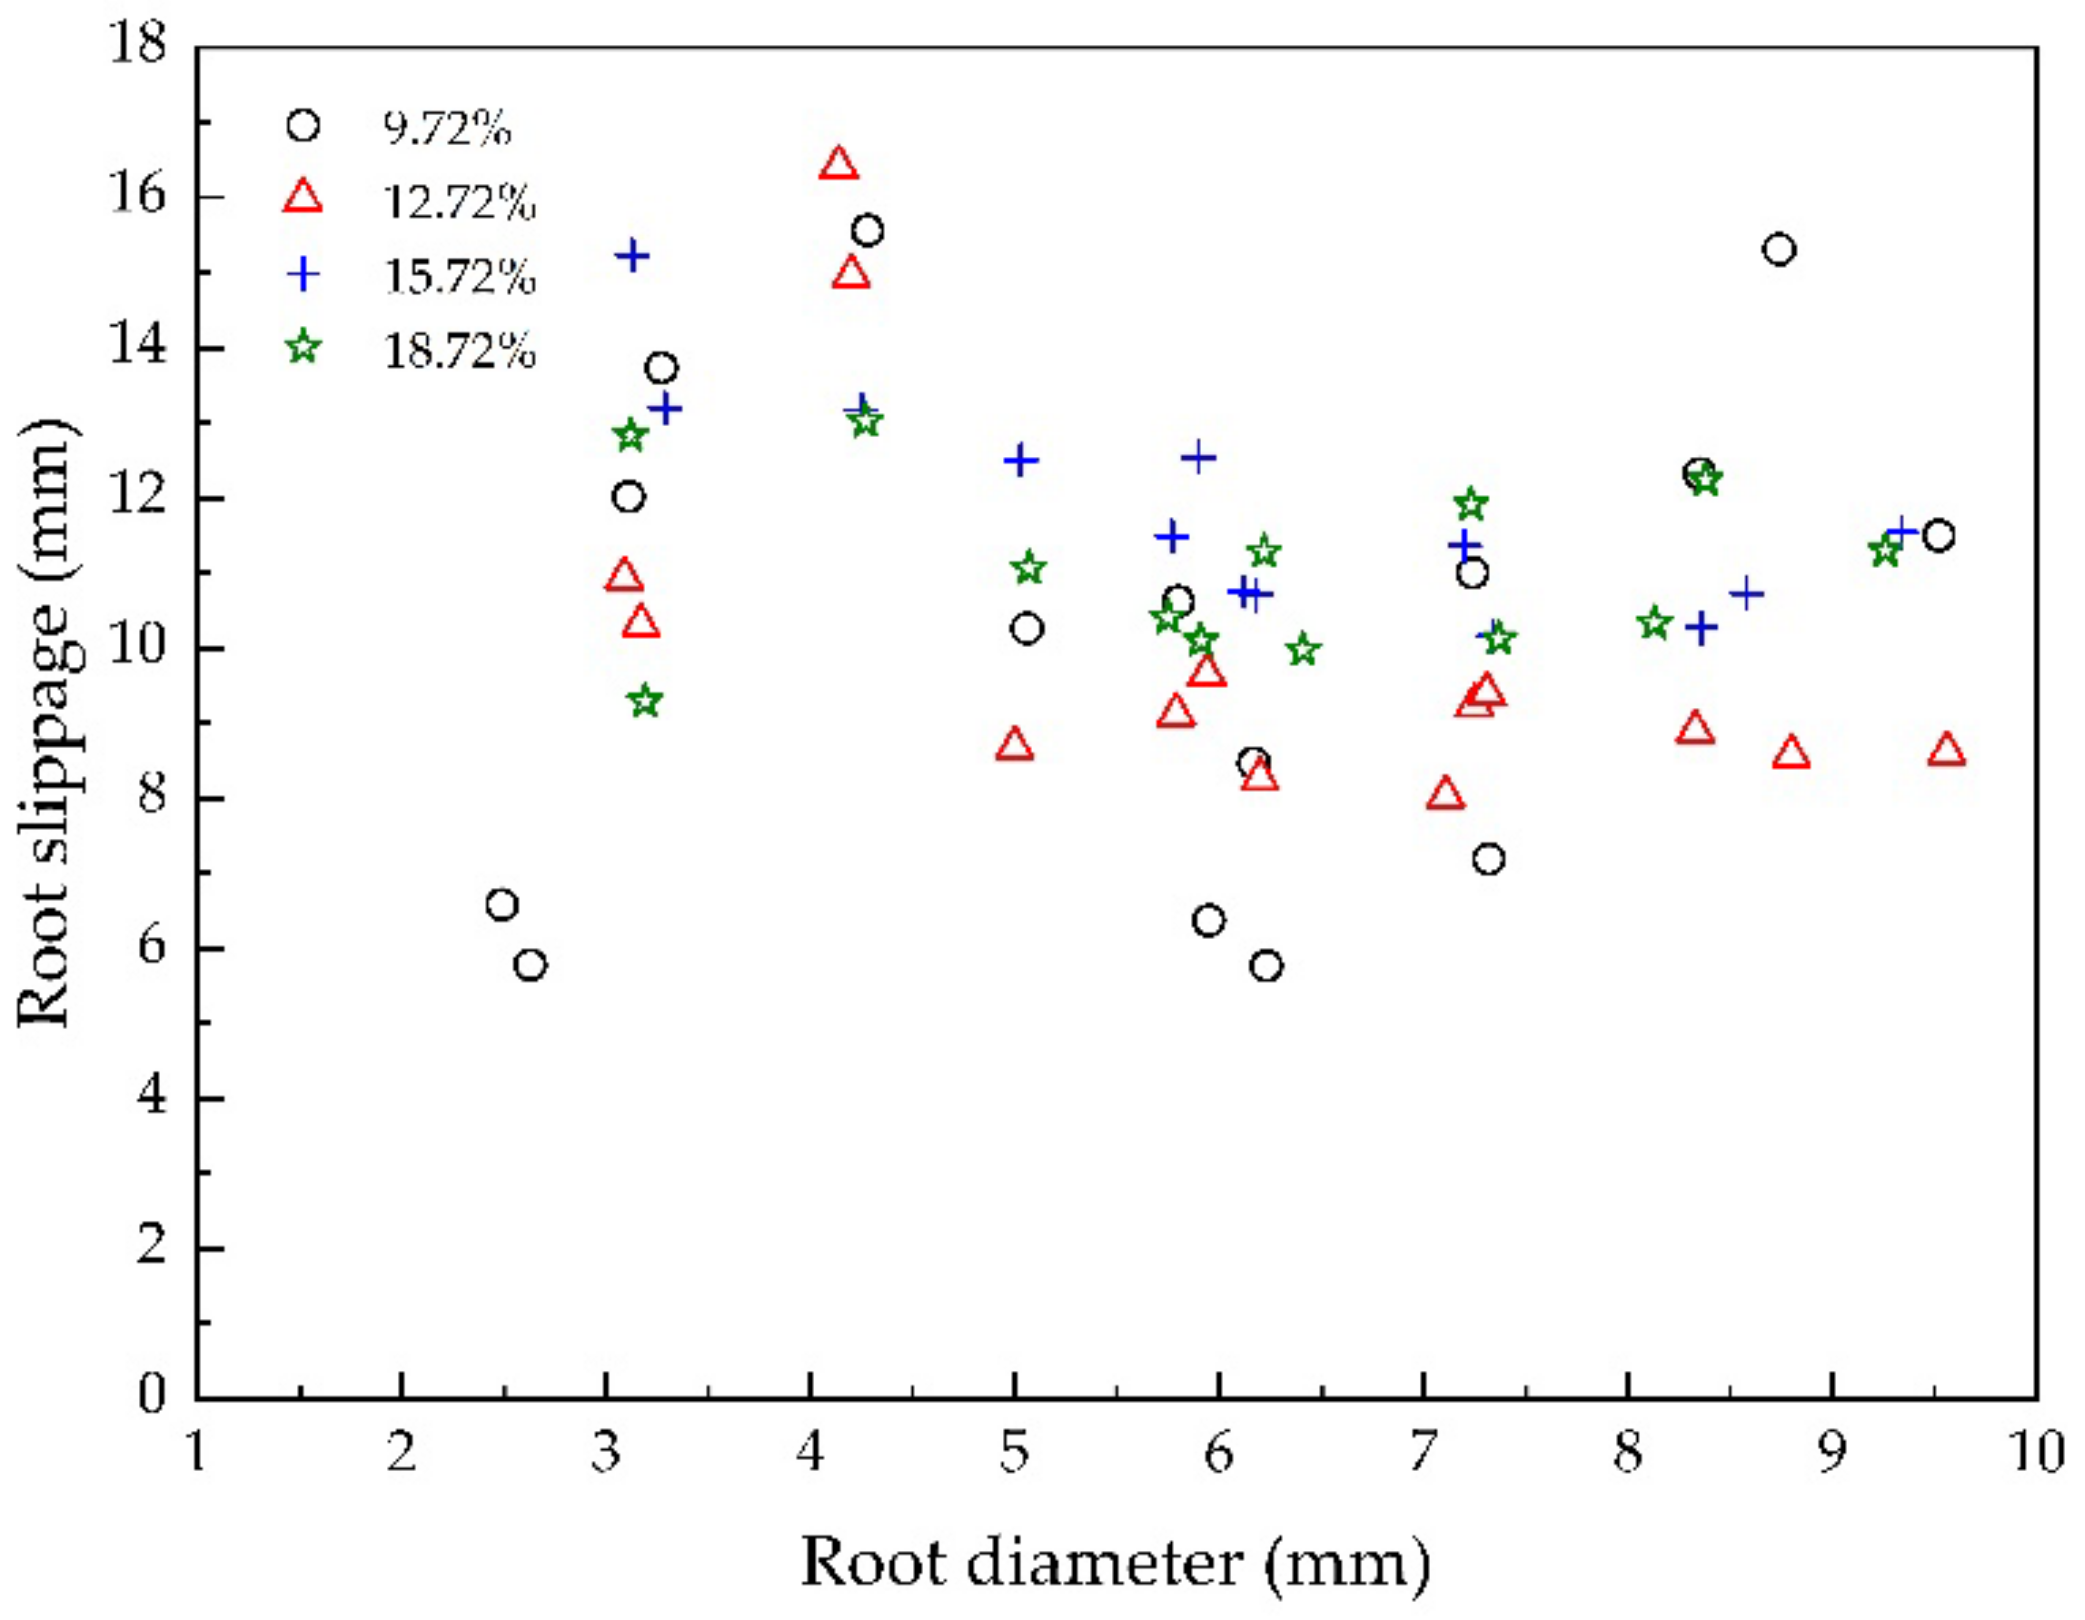
4.3. Effect of Soil Water Content on Anchoring Action

The physical properties of the soil had a significant effect on the failure mode of the root pullout test, as shown in Table 1 and Figure 5. Firstly, the water content of the soil influenced the root failure mode. Table 7 shows the situation when breakage failure occurs in roots at different soil water contents. As seen in Table 7, the maximum root diameter with breakage failure mode increased with the soil water content. The root was more easily broken during the pullout test when the level of the water content of the soil increased. With increasing soil water content, the roots were more easily broken because of the increasing pullout force reaching the larger diameter roots’ tensile resistance. As mentioned above, based on the principle of force equilibrium, the maximum bond force between root and soil should be equal to the maximum pullout force recorded by the computer during the pullout test. As shown in Table 8, the regression equation of the maximum bond force (Fbmax) and root diameter (Dr) under different soil water content could be established based on the experimental data.
F b m a x = 50.411 D r 77.266   ( R 2   = 0.991 ,   W s   = 9.72 % ) ;
F b m a x = 39.491 D r 14.891   ( R 2   = 0.954 ,   W s   = 12.72 % ) ;
F b m a x = 58.908 D r 71.812   ( R 2   = 0.961 ,   W s   = 15.72 % ) ;
F b m a x = 58.223 D r 83.417   ( R 2   = 0.963 ,   W s   = 18.72 % ) .
From the four equations above and from Figure 7, we can see that there was very significant linear positive correlation between Fbmax and Dr under different levels of soil water content. Based on Figure 7 and Table 8, the maximum bond force of the roots under Ws of 15.72% was larger than under other levels of Ws. That is, under a soil water content of 15.72%, the maximum bond force between soil and root reached the highest value. When the root diameters were similar, the Fbmax under Ws of 15.72% could be 10–30% higher than under other three levels of Ws. Based on these results, if the specimens tested in this study were more numerous, the largest root diameter with breakage failure mode should be in the testing group under soil water content of 15.72%. As shown in Figure 8, the water content does not have a very obvious effect on the peak slip even under the same conditions. From the mean value, the mean value of peak slip is 10.17 mm for 9.72% water content, 12.26 mm for 12.72% water content, 11.82 mm for 15.72% water content, and 11.06 mm for 18.72% water content, which is close to the mean value of peak slip. Therefore, we can say that the water content of the soil has no significant effect on the peak slip.
Fan and Su investigated the effect of soil water content on the deformation of root-reinforced soil and found a significant correlation between the shear strength of root-reinforced soil and soil water content [48]. The maximum pullout force and root–soil friction coefficient of the sea buckthorn root system decreased with increasing soil water content [24], and the pullout resistance of the paper mulberry root system decreased significantly with increasing soil water content [25]. Our study found that there is a reasonable soil water content which made the bond force between roots and soils reach the maximum value. Based on this study condition, the soil water content which made the bond force reach maximum value was close to 15.72%.

4.4. Effect of Soil Dry Weight on Anchorage Action

The effect of the dry weight of the soil on the failure mode of the root system is quite evident. The higher the dry weight, the easier the root system is to be broken, and the lower the dry weight, the easier the root system is to be pulled out. This can indicate that the soil dry weight is high and the soil is in closer contact with the root system. The greater the anchoring force between the root system and the soil under the pullout load, the less likely the root system will be pulled out. Under the level of soil dry weight of 1.52 g/cm3, there were four roots with breakage failure mode (1.45 mm, 1.47 mm, 2.42 mm, 2.57 mm). Under the level of soil dry weight of 1.42 g/cm3, there were four roots with breakage failure mode (1.27 mm, 1.39 mm, 2.40 mm, 2.53 mm). Under the level of soil dry weight of 1.32 g/cm3, there were two roots with breakage failure mode (1.43 mm, 1.57 mm). From the test results, we found that the roots were easier to break at the higher level of soil dry weight.
Table 9 shows the pullout force and displacement obtained from root pullout tests with pine trees at 12.72% soil moisture content and dry densities of 1.52, 1.42, and 1.32 g/cm3. Four root systems of similar diameters were selected for each soil dry weight. As shown in Table 9 and Figure 9, the pullout force when the root system was broken with a small diameter did not show a monotonic trend with decreasing dry weight of the soil. The pullout force when the root system was pulled out decreased with the decrease of soil dry weight. The effect of soil dry weight on root–soil relative displacement showed a clear pattern. As shown in Table 9 and Figure 10, the displacement when the root system was pulled off with a small diameter was smaller than the displacement when the root system was pulled out, and the displacement of the pullout root system decreased with the increase of the root system diameter. The displacement of the root system at each diameter level decreased with the decrease of the dry weight of the soil. Because the greater the dry weight of the soil, the closer the contact between the roots and soil, the greater the friction between the roots and soil, and the load on the root system in the soil exceeds the maximum net friction to produce sliding. The displacement values listed in Table 9 and Figure 10 are the partial elongations of the root system before it slides relative to the soil as a whole. This elongation increases as root–soil friction increases when the root system is deformed by elongation.
As the dry weight of soil decreases, the contact between root and soil is loosened by the increase of soil particle spacing, and the contact area between soil particles and the root system is reduced, which leads to a decrease in root–soil friction. Su et al. predicted by numerical simulation that the maximum pullout force of the cedar root system increased slowly with the increase of soil dry weight [43]. This conclusion is similar to the test results in this paper, and the increase in soil dry weight has a positive effect on the root anchorage effect.

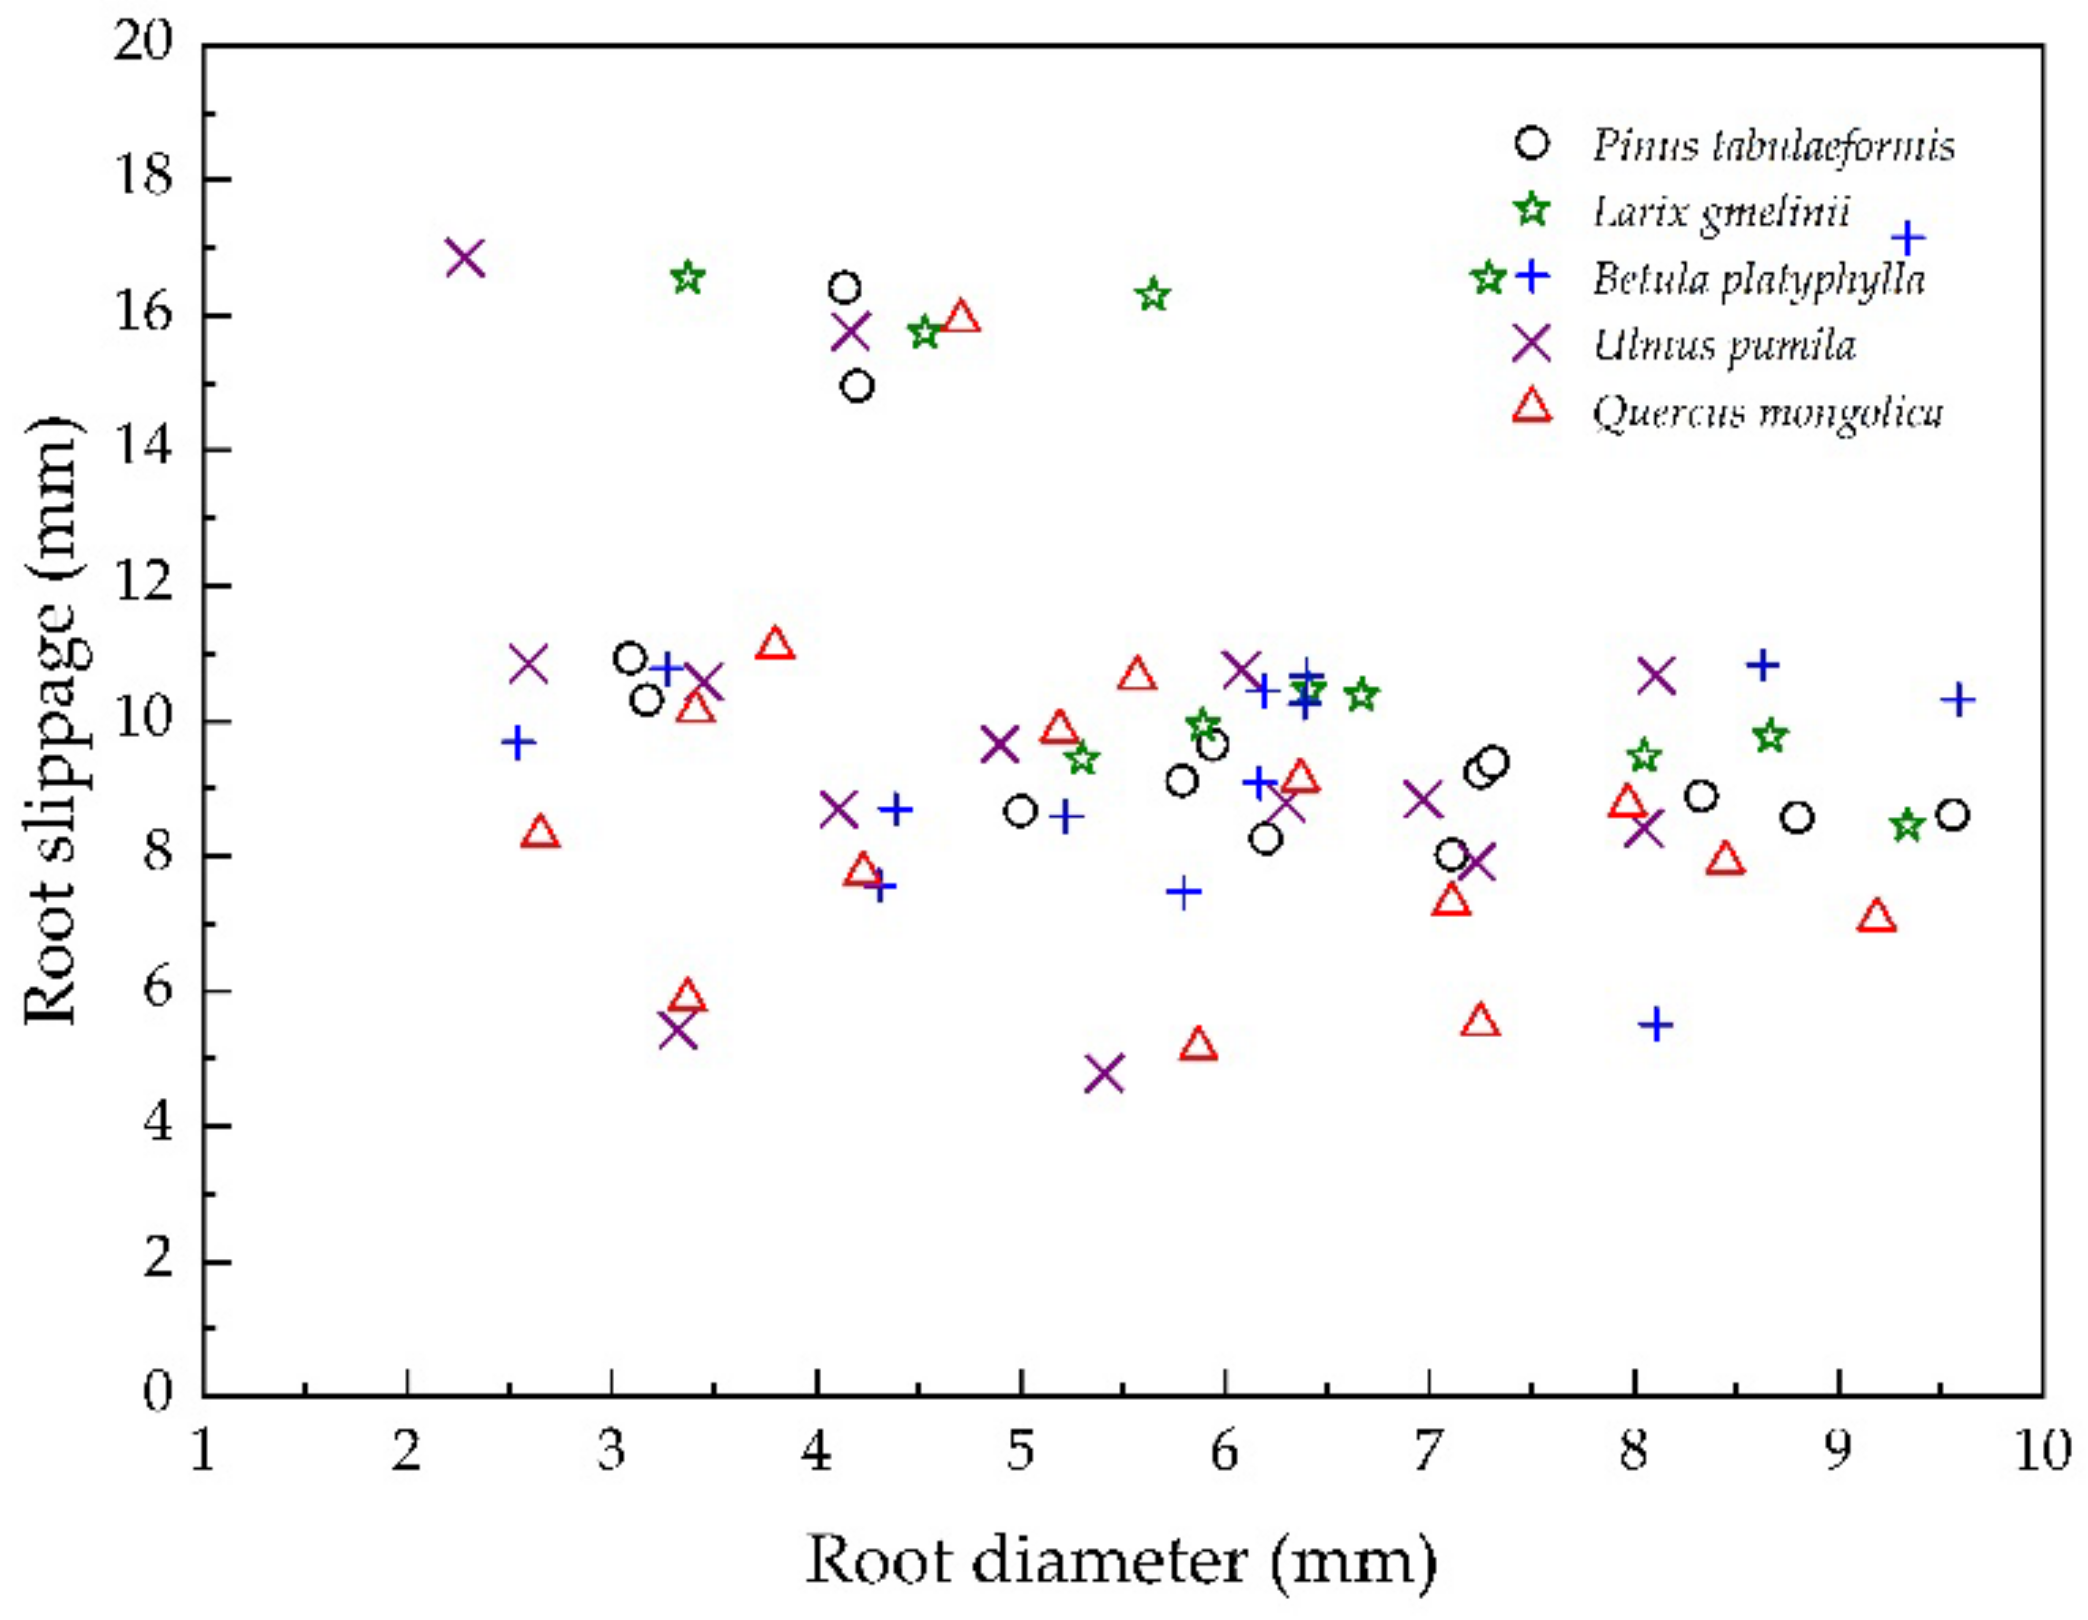
4.5. Effect of Root Species on Anchoring Action

Based on the data in Table 3, the root length of Betula platyphylla was the longest of the five root species, reaching 6928 mm. The root length of Ulmus pumila was the shortest of the five root species and was only 5154 mm. For the five species, most of the roots were fine (root diameter < 10 mm, c1, c2, and c3). For the five species, the percentage of the length of fine roots in the length of the total root reached 85.0% (Pinus tabulaeformis), 85.6% (Betula platyphylla), 77.3% (Larix gmelinii), 84.2% (Quercus mongolica), and 81.1%mm (Ulmus pumila). Thus, we mainly studied the anchorage properties of roots with a diameter ranging from 1 mm to 10 mm. Although the percentage of the length of fine roots in the length of the total root was high, the percentage of biomass of fine roots in total roots biomass was small. For the five species, the percentage of biomass of fine roots in the total roots biomass was 24.3% (Pinus tabulaeformis), 28.6% (Betula platyphylla), and 19.0% (Larix gmelinii), 16.6% (Quercus mongolica), and 25.6% mm (Ulmus pumila). The Betula platyphylla root system had more biomass and a longer length of fine roots among the five species. Based on the data in Table 4, most of the roots were found in the S1 and S2 soil layers (0–40 cm under the earth surface). For the five species, the percentage of root length found in layers S1 and S2 of the length of the total root reached 74.4% (Pinus tabulaeformis), 80.3% (Betula platyphylla), 81.3% (Larix gmelinii), 73.6% (Quercus mongolica), and 70.9% mm (Ulmus pumila).
As shown in Figure 5 and Table 1, the species of the root had a significant effect on the root failure mode. The maximum root diameter with breakage failure mode for the five species was 2.57 mm (Pinus tabulaeformis), 3.2 mm (Betula platyphylla), and 4.13 mm (Larix gmelinii), 4.21 mm (Quercus mongolica), and 2.89 mm (Ulmus pumila). For the Larix gmelinii roots, the root with a diameter of 4.21 mm got a breakage failure mode as an exception, because the roots with diameters ranging from 2.28 mm to 4.17 mm all got a pullout failure mode. The Larix gmelinii roots should be the easiest to be broken during the pullout test of the five root species. The Pinus tabulaeformis roots should be the most difficult to be broken during the pullout test under the same experimental conditions for the five root species.
Based on the data in Figure 11, the regression equation of the maximum bond force and root diameter of the five species is as follows.
Pinus tabulaeformis   F b m a x = 39.491 D r 14.891   ( R 2   = 0.954 )
Betula platyphylla   F b m a x = 47.558 D r 28.877   ( R 2   = 0.889 )
Larix gmelinii   F b m a x = 44.843 D r 1.904   ( R 2   = 0.831 )
Quercus mongolica   F b m a x = 30.909 D r + 52.219   ( R 2   = 0.887 )
Ulmus pumila   F b m a x = 36.871 D r + 35.244   ( R 2   = 0.884 )
For the five species, the maximum bond force had a significant positive correlation with the root diameter. Based on the data in Figure 11, the maximum bond force between Pinus tabulaeformis root and soil was the smallest in the five root species. The maximum bonding force of the Betula platyphylla root system is the highest. As shown in Figure 12, when the root system of each tree species reached the maximum frictional anchorage, the greatest peak slip occurred in Larix gmelinii, while the least slip occurred in Quercus mongolica. In summary, among the five different tree species, Pinus tabulaeformis roots were the least effective in anchoring the soil, and Betula platyphylla had the best anchoring effect. There was no significant effect of different tree species on the peak slip of the root system.
Nicoll et al. believed that complex differences among species and their interactions with site conditions would affect the anchorage properties of conifer species [30]. As Figure 1 showed, the root architecture of the different tree species had large differences. The root architecture influenced the root anchorage properties [21]. The root test in this study was single root and the branching roots were cut down. The roots chosen were straight and less bent for ease of comparison. From Figure 2, the roots of Pinus tabulaeformis were straighter with fewer nodes than the roots of the other four species. The friction force between the root of Pinus tabulaeformis and soil should be smaller than that of the other four species because of the smoother surface. This should be the major reason why pine root systems experience pullout failure patterns in pullout tests. Meanwhile, the tensile strength of the root system can significantly affect the anchoring effect of the root system on the soil [24,36]. As shown in Table 5, the tensile strength of the Betula platyphylla root system was significantly higher than the other four species. This should be the reason why the Betula platyphylla root system has the best anchoring effect on soil. Finally, in this paper, only single root pullout tests of root systems were conducted. The analysis of the root distribution of different tree species on the soil anchoring effect needs to be supplemented and analyzed in future experiments.

5. Conclusions

This paper investigated the effects of root diameter, soil water content, soil dry weight, and different tree species on root–soil anchorage properties through indoor single root pullout tests. The major conclusions drawn from this study are summarized as follows.
(1)
The maximum pullout force of the root system increased with increasing root diameter and tensile strength. The peak sliding decreases with the increase of root system diameter.
(2)
As the soil water content increases, the root system is more susceptible to breakage failure. An optimum soil water content exists that allows for the best anchoring of the root system roots. Soil water content has no significant effect on peak sliding.
(3)
Root systems are more susceptible to breakage failure as the dry weight of the soil increases. The maximum tension of the root system decreases with decreasing soil dry weight. As the soil dry weight decreased, the root displacement also decreased.
(4)
In the root pullout test of five species, the root system of Larix gmelinii was the most susceptible to breakage failure, while the root system of Pinus tabulaeformis was the least susceptible to breakage. The root system of Pinus tabulaeformis was the least effective in anchoring the soil, while the root system of Betula platyphylla was the most effective in anchoring.

Author Contributions

Conceptualization, S.L. and X.J.; methodology, S.L.; analysis, S.L.; resources, X.J.; writing—original draft preparation, S.L. and X.Z.; writing—review and editing, X.J.; supervision, X.J.; funding acquisition, X.J. All authors have read and agreed to the published version of the manuscript.

Funding

The investigation was supported by the National Natural Science Foundation of China (Grant No.31800610). It was also funded by the Major Science and Technology Program for Water Pollution Control and Treatment of China (No. 2017ZX07101002–002). The authors are deeply indebted to the financial supporters.

Institutional Review Board Statement

Not applicable.

Informed Consent Statement

Not applicable.

Data Availability Statement

Not applicable.

Acknowledgments

We are deeply grateful for the financial support from the National Natural Science Foundation of China. We also thank the head of the Major Science and Technology Project for Water Pollution Control and Management in China for providing financial and test site support.

Conflicts of Interest

The authors declare no conflict of interest.

References

  1. Commandeur, P.R.; Pyles, M.R. Modulus of elasticity and tensile strength of Douglas-fir roots. Can. J. For. Res. 1991, 21, 48–52. [Google Scholar] [CrossRef]
  2. Ennos, A.R.; Fitter, A.H. Comparative functional morphology of the anchorage systems of annual dicots. Funct. Ecol. 1992, 6, 71–78. [Google Scholar] [CrossRef]
  3. Mickovski, S.B.; Ennos, R.A. A morphological and mechanical study of the root systems of suppressed crown Scots pine Pinus sylvestris. Trees 2002, 16, 274–280. [Google Scholar] [CrossRef]
  4. Sun, H.; Li, S.; Xiong, W.; Yang, Z.; Cui, B.; Yang, T. Influence of slope on root system anchorage of Pinus yunnanensis. Ecol. Eng. 2008, 32, 60–67. [Google Scholar] [CrossRef]
  5. Wang, X.; Hong, M.; Huang, Z.; Zhao, Y.; Ou, Y.; Jia, H.; Li, J. Biomechanical properties of plant root systems and their ability to stabilize slopes in geohazard-prone regions. Soil Till. Res. 2019, 189, 148–157. [Google Scholar] [CrossRef]
  6. Zhang, C.; Li, D.; Jiang, J.; Zhou, X.; Niu, X.; Wei, Y.; Ma, J. Evaluating the potential slope plants using new method for soil reinforcement program. Catena 2019, 180, 346–354. [Google Scholar] [CrossRef]
  7. Yang, M.; Défossez, P.; Danjon, F.; Dupont, S.; Fourcaud, T. Which root architectural elements contribute the best to anchorage of Pinus species? Insights from in silico experiments. Plant Soil 2017, 411, 275–291. [Google Scholar] [CrossRef]
  8. Crook, M.J.; Ennos, A.R. The anchorage mechanics of deep rooted larch, Larix europea × L. Japonica. J. Exp. Bot. 1996, 47, 1509–1517. [Google Scholar] [CrossRef] [Green Version]
  9. Zhou, Y.; Watts, D.; Li, Y.; Cheng, X. A case study of effect of lateral roots of Pinus yunnanensis on shallow soil reinforcement. For. Ecol. Manag. 1998, 103, 107–120. [Google Scholar] [CrossRef]
  10. Goodman, A.M.; Crook, M.J.; Ennos, A.R. Anchorage Mechanics of the Tap Root System of Winter-sown Oilseed Rape (Brassica napus L.). Ann. Bot. -Lond. 2001, 87, 397–404. [Google Scholar] [CrossRef]
  11. Burylo, M.; Rey, F.; Roumet, C.; Buisson, E.; Dutoit, T. Linking plant morphological traits to uprooting resistance in eroded marly lands (Southern Alps, France). Plant Soil 2009, 324, 31–42. [Google Scholar] [CrossRef]
  12. Schwarz, M.; Cohen, D.; Or, D. Root-soil mechanical interactions during pullout and failure of root bundles. J. Geophys. Res. 2010, 115, F04035. [Google Scholar] [CrossRef] [Green Version]
  13. Mickovski, S.B.; Ennos, A.R. Anchorage and asymmetry in the root system of Pinus peuce. Silva Fenn. 2003, 37, 161–173. [Google Scholar] [CrossRef] [Green Version]
  14. Tanaka, N.; Samarakoon, M.B.; Yagisawa, J. Effects of root architecture, physical tree characteristics, and soil shear strength on maximum resistive bending moment for overturning Salix babylonica and Juglans ailanthifolia. Landsc. Ecol. Eng. 2011, 8, 69–79. [Google Scholar] [CrossRef]
  15. Fourcaud, T.; Ji, J.N.; Zhang, Z.Q.; Stokes, A. Understanding the impact of root morphology on overturning mechanisms: A modelling approach. Ann. Bot. 2008, 101, 1267–1280. [Google Scholar] [CrossRef] [Green Version]
  16. Cucchi, V.R.; Meredieu, C.L.; Stokes, A.; Berthier, S.P.; Bert, D.; Najar, M.; Denis, A.; Lastennet, R. Root anchorage of inner and edge trees in stands of Maritime pine (Pinus pinaster Ait.) growing in different podzolic soil conditions. Trees 2004, 18, 460–466. [Google Scholar] [CrossRef]
  17. Genet, M.; Stokes, A.; Salin, F.; Mickovski, S.B.; Fourcaud, T.; Dumail, J.; van Beek, R. The influence of cellulose content on tensile strength in tree roots. Plant Soil 2005, 278, 1–9. [Google Scholar] [CrossRef]
  18. Schwarz, M.; Cohen, D.; Or, D. Pullout tests of root analogs and natural root bundles in soil; Experiments and modeling. J. Geophys. Res. 2011, 116, F02007. [Google Scholar] [CrossRef]
  19. Li, Y.; Wang, Y.; Ma, C.; Zhang, H.; Wang, Y.; Song, S.; Zhu, J. Influence of the spatial layout of plant roots on slope stability. Ecol. Eng. 2016, 91, 477–486. [Google Scholar] [CrossRef]
  20. Ennos, A.R. The mechanics of anchorage in seedlings of sunflower, Helianthus annuus L. New Phytol. 1989, 113, 185–192. [Google Scholar] [CrossRef]
  21. Bailey, P.H.; Currey, J.D.; Fitter, A.H. The role of root system architecture and root hairs in promoting anchorage against uprooting forces in Allium cepa and root mutants of Arabidopsis thaliana. J. Exp. Bot. 2002, 53, 333–340. [Google Scholar] [CrossRef]
  22. Mickovski, S.B.; van Beek, L.P.H.; Salin, F. Uprooting of vetiver uprooting resistance of vetiver grass (Vetiveria zizanioides). Plant Soil 2005, 278, 33–41. [Google Scholar] [CrossRef]
  23. Rahardjo, H.; Harnas, F.R.; Indrawan, I.G.B.; Leong, E.C.; Tan, P.Y.; Fong, Y.K.; Ow, L.F. Understanding the stability of Samanea saman trees through tree pulling, analytical calculations and numerical models. Urban For. Urban Green. 2014, 13, 355–364. [Google Scholar] [CrossRef]
  24. Zhang, C.; Liu, Y.; Li, D.; Jiang, J. Influence of soil moisture content on pullout properties of Hippophae rhamnoides Linn. Roots. J. Mt. Sci. -Engl. 2020, 17, 2816. [Google Scholar] [CrossRef]
  25. Fan, C.; Lu, J.Z.; Chen, H.H. The pullout resistance of plant roots in the field at different soil water conditions and root geometries. Catena 2021, 207, 105593. [Google Scholar] [CrossRef]
  26. Boldrin, D.; Leung, A.K.; Bengough, A.G. Effects of root dehydration on biomechanical properties of woody roots of Ulex europaeus. Plant Soil 2018, 431, 347–369. [Google Scholar] [CrossRef] [Green Version]
  27. Jotisankasa, A.; Taworn, D. Direct shear testing of clayey sand reinforced with live stake. Geotech. Test. J. 2016, 39, 608–623. [Google Scholar] [CrossRef]
  28. Fan, C.; Su, C. Role of roots in the shear strength of root-reinforced soils with high moisture content. Ecol. Eng. 2008, 33, 157–166. [Google Scholar] [CrossRef]
  29. Mahannopkul, K.; Jotisankasa, A. Influences of root concentration and suction on Chrysopogon zizanioides reinforcement of soil. Soils Found. 2019, 59, 500–516. [Google Scholar] [CrossRef]
  30. Nicoll, B.C.; Gardiner, B.A.; Rayner, B.; Peace, A.J. Anchorage of coniferous trees in relation to species, soil type, and rooting depth. Can. J. For. Res. 2006, 36, 1871–1883. [Google Scholar] [CrossRef]
  31. Dupuy, L.; Fourcaud, T.; Stokes, A. A numerical investigation into the influence of soil type and root architecture on tree anchorage. Plant Soil 2005, 278, 119–134. [Google Scholar] [CrossRef]
  32. Ennos, A.R. The anchorage of leek seedlings: The effect of root length and soil strength. Ann. Bot.-Lond. 1990, 65, 409–416. [Google Scholar] [CrossRef]
  33. Zhang, X.; Hu, X.; Li, G.; Zhu, H.; Mao, X.; Yuan, X. Time effect of young shrub roots on slope protection of loess area in Northeast Qinghai-Tibetan plateau. Trans. Chin. Soc. Agric. Eng. 2012, 28, 136–141. [Google Scholar]
  34. Pollen, N. Temporal and spatial variability in root reinforcement of streambanks: Accounting for soil shear strength and moisture. Catena 2007, 69, 197–205. [Google Scholar] [CrossRef]
  35. Boldrin, D.; Leung, A.K.; Bengough, A.G. Root biomechanical properties during establishment of woody perennials. Ecol. Eng. 2017, 109, 196–206. [Google Scholar] [CrossRef] [Green Version]
  36. Yang, Y.; Chen, L.; Li, N.; Zhang, Q.; Hui, D. Effect of root moisture content and diameter on root tensile properties. PLoS ONE 2016, 11, e151791. [Google Scholar] [CrossRef]
  37. Mickovski, S.B.; Bengough, A.G.; Bransby, M.F.; Davies, M.C.R.; Hallett, P.D.; Sonnenberg, R. Material stiffness, branching pattern and soil matric potential affect the pullout resistance of model root systems. Eur. J. Soil Sci. 2007, 58, 1471–1481. [Google Scholar] [CrossRef]
  38. Ji, X.; Chen, L.; Zhang, A. Anchorage properties at the interface between soil and roots with branches. J. For. Res. 2017, 28, 83–93. [Google Scholar] [CrossRef]
  39. Giadrossich, F.; Schwarz, M.; Cohen, D.; Preti, F.; Or, D.; Turner, B.; Condron, L.M.; Turner, B.; Condron, L.M. Mechanical interactions between neighbouring roots during pullout tests. Plant Soil 2013, 367, 391–406. [Google Scholar] [CrossRef]
  40. Ji, X.; Cong, X.; Dai, X.; Zhang, A.; Chen, L. Studying the mechanical properties of the soil-root interface using the pullout test method. J. Mt. Sci. -Engl. 2018, 15, 882–893. [Google Scholar] [CrossRef]
  41. Baets, S.D.; Torri, D.; Poesen, J.; Salvador, M.P.; Meersmans, J. Modelling increased soil cohesion due to roots with EUROSEM. Earth Surf. Process. Landf. 2008, 33, 1948–1963. [Google Scholar] [CrossRef]
  42. Cohen, D.; Schwarz, M.; Or, D. An analytical fiber bundle model for pullout mechanics of root bundles. J. Geophys. Res. Earth Surf. 2011, 116, F03010. [Google Scholar] [CrossRef] [Green Version]
  43. Su, L.; Hu, B.; Xie, Q.; Yu, F.; Zhang, C. Experimental and theoretical study of mechanical properties of root-soil interface for slope protection. J. Mt. Sci. -Engl. 2020, 17, 2784. [Google Scholar] [CrossRef]
  44. Peltola, H.; Kellomäki, S.; Hassinen, A.; Granander, M. Mechanical stability of Scots pine, Norway spruce and birch: An analysis of tree-pulling experiments in Finland. For. Ecol. Manag. 2000, 135, 143–153. [Google Scholar] [CrossRef]
  45. Ghani, M.A.; Stokes, A.; Fourcaud, T. The effect of root architecture and root loss through trenching on the anchorage of tropical urban trees (Eugenia grandis Wight). Trees -Struct. Funct. 2009, 23, 197–209. [Google Scholar] [CrossRef]
  46. Kamimura, K.; Kitagawa, K.; Saito, S.; Mizunaga, H. Root anchorage of hinoki (Chamaecyparis obtuse (Sieb. Et Zucc.) Endl.) under the combined loading of wind and rapidly supplied water on soil: Analyses based on tree-pulling experiments. Eur. J. For. Res. 2012, 131, 219–227. [Google Scholar] [CrossRef]
  47. Hairiah, K.; Widianto, W.; Suprayogo, D.; Noordwijk, V.M. Tree roots anchoring and binding soil: Reducing landslide risk in Indonesian agroforestry. Land 2020, 9, 256. [Google Scholar] [CrossRef]
  48. Fan, C.; Su, C. Effect of soil moisture content on the deformation behaviour of root-reinforced soils subjected to shear. Plant Soil 2009, 324, 57–69. [Google Scholar] [CrossRef]
Figure 1. Root morphology of five tree species, i.e., (a) Pinus tabulaeformis (b) Betula platyphylla (c) Larix gmelinii (d) Quercus mongolica, and (e) Ulmus pumila.
Sustainability 14 07770 g001
Figure 2. Structure of the pullout test.
Sustainability 14 07770 g002
Figure 3. Specimen system of soil–root anchorage.
Sustainability 14 07770 g003
Figure 4. Curves of pullout load–root slippage, i.e., (a) Pinus tabulaeformis L-S curve (ρs = 1.52 g/cm3,Ws = 9.72%) (b) Pinus tabulaeformis L-S curve (ρs = 1.52 g/cm3, Ws = 12.72%) (c) Pinus tabulaeformis L-S curve (ρs = 1.52 g/cm3,Ws = 15.72%) (d) Pinus tabulaeformis L-S curve (ρs = 1.52 g/cm3,Ws = 18.72%) (e) Pinus tabulaeformis L-S curve (ρs = 1.42 g/cm3, Ws = 12.72%) (f) Pinus tabulaeformis L-S curve (ρs = 1.32 g/cm3, Ws = 12.72%) (g) Betula platyphylla L-S curve (ρs = 1.52 g/cm3, Ws = 12.72%) (h) Larix gmelinii L-S curve (ρs = 1.52 g/cm3, Ws = 12.72%) (i) Ulmus pumila L-S curve (ρs = 1.52 g/cm3, Ws = 12.72%) (j) Quercus mongolica L-S curve (ρs = 1.52 g/cm3, Ws = 12.72%).
Sustainability 14 07770 g004aSustainability 14 07770 g004b
Figure 5. The failure mode of the roots with different diameter.
Sustainability 14 07770 g005
Figure 6. The maximum pullout force of roots with breakage failure.
Sustainability 14 07770 g006
Figure 7. Maximum pullout force of the root system of Pinus tabulaeformis under different soil water content.
Sustainability 14 07770 g007
Figure 8. Peak slip of Pinus tabulaeformis root system under different soil water content.
Sustainability 14 07770 g008
Figure 9. Maximum pullout force of Pinus tabulaeformis roots under different soil dry weight.
Sustainability 14 07770 g009
Figure 10. Peak slip of single roots of Pinus tabulaeformis at different soil dry weight.
Sustainability 14 07770 g010
Figure 11. The maximum pullout force of the different tree species roots.
Sustainability 14 07770 g011
Figure 12. Peak slip of root system of different tree species.
Sustainability 14 07770 g012
Table 1. Pullout test scheme and two failure modes for five tree species.
TsrnTree SpeciesWs (%)ρs (g/cm3)Drmax (mm)Drmin (mm)Nr
BreakagePullout
1Pinus tabulaeformis9.721.529.521.41216
2Pinus tabulaeformis12.721.529.561.45413
3Pinus tabulaeformis15.721.529.341.35414
4Pinus tabulaeformis18.721.529.261.43414
5Pinus tabulaeformis12.721.429.511.27414
6Pinus tabulaeformis12.721.329.421.43216
7Betula platyphylla12.721.529.591.47514
8Larix gmelinii12.721.529.341.55810
9Quercus mongolica12.721.528.111.39313
10Ulmus pumila12.721.529.191.69415
Tsrn—root group number; Ws—water content of soil of sample; ρs—dry weight of soil of sample; Drmax—the maximum diameter of root tested; Drmin—the minimum diameter of root tested; Nr—the number of the root tested with different failure mode.
Table 2. Physical properties of the slope soil in the test area.
Indicator
Items
Dry Weight/g/m3Water Content
/%
Liquid
Limit
(%)
Plastic
Limit
(%)
Soil Grain Size (mm) Distribution (%)
<0.001 mm0.001–0.005 mm0.005–0.01 mm0.01–
0.05 mm
/1.5212.7224.129.516.533.474.0836.73
Table 3. Mean root length of five tree species with different root diameter groups (mm).
Tree SpeciesC1C2C3C4C5
Pinus tabulaeformis1784.3 ± 130.4 1038 ± 97.51819 ± 158.1460.7 ± 39.2359.7± 31.1
Betula platyphylla1904.0 ± 110.71982.7 ± 156.82054.7 ± 186.3667.0 ± 131.6331.0 ± 42.7
Larix gmelinii1909.0 ± 27.51357.0 ± 133.91645.3 ± 88.0971.0 ± 89.1472.1 ± 44.5
Quercus mongolica1859 ± 304.01033.0 ± 237.11607.7 ± 137.0603.0 ± 93.4243.7 ± 42.5
Ulmus pumila1488.7 ± 115.11278.7 ± 25.71442.7 ± 149.2608.7 ± 69.8372.0 ± 59.9
Table 4. Mean root length of five tree species in different soil layers (mm).
Tree SpeciesS1S2S3S4S5
Pinus tabulaeformis1448.0 ± 120.22571.3 ± 85.2848.0 ± 76.2346.0 ± 60.2185 ± 29.1
Betula platyphylla2310.7 ± 271.33263.3 ± 182.2862.0 ± 138.5349.3 ± 88.5155.3 ± 15.9
Larix gmelinii2456.3 ± 70.12752.3 ± 143.8795.3 ± 179.9233.0 ± 55.7168.0 ± 45.7
Quercus mongolica1676.3 ± 159.62527.3 ± 647.2976.3 ± 141.1340.3 ± 51.0188.7 ± 34.0
Ulmus pumila1438.0 ± 99.12264.7 ± 107.9884.3 ± 129.6437.3 ± 85.9196.7 ± 26.3
Table 5. Mean biomass of five tree species with different root diameter groups (g).
Tree SpeciesC1C2C3C4C5
Pinus tabulaeformis30.2 ± 3.953.8 ± 5.8277.0 ± 12.1273.5 ± 87.4852.1 ± 63.6
Betula platyphylla51.2 ± 4.1170.1 ± 23.7419.2 ± 45.1622.7 ± 50.1979.9 ± 122.4
Larix gmelinii52.1 ± 10.7116.7 ± 21.2536.4 ± 56.8698.9 ± 55.52309.2 ± 247.9
Quercus mongolica24.5 ± 14.166.8 ± 5.6300.4 ± 41.4584.7 ± 60.21385.9 ± 92.6
Ulmus pumila29.7 ± 7.4111.4 ± 11.3365.1 ± 15.7501.4 ± 27.1968.4 ± 137.5
Table 6. Root tensile resistance of five tree species.
Tree SpeciesD (mm)Dm (mm)fm (N)NRegression EquationR2
Pinus tabulaeformis0.5~7.752.864 ± 1.53118.809 ± 124.4152F = 5.312D1.75130.9627
Betula platyphylla0.6~9.573.203 ± 1.93250.06 ± 326.04250F = 19.912D1.8810.9469
Larix gmelinii1.86~7.174.395 ± 1.12181.161 ± 87.2781F = 17.753D1.5520.8534
Quercus mongolica1.99~6.53.686 ± 1.07255.807 ± 149.5331F = 23.879D1.76380.9471
Ulmus pumila2.5~6.694.113 ± 1.19250.778 ± 109.1127F = 45.694D1.18130.7327
D—root diameter; Dm—the mean root diameter; fm—the mean root tensile resistance; N—the number of samples tested; Regression equation—the equation of relationship between root diameter and root tensile resistance; R2—correlation coefficient.
Table 7. Root breakage failure under different soil water content.
Ws (%)Dr (mm)ρs (g/cm3)Nr
9.721.411.52Broken
1.521.52Broken
12.721.451.52Broken
1.471.52Broken
2.421.52Broken
2.571.52Broken
15.721.351.52Broken
1.571.52Broken
2.461.52Broken
2.541.52Broken
18.721.431.52Broken
1.501.52Broken
2.441.52Broken
2.771.52Broken
Table 8. Comparison of the maximum pulling force of Pinus tabulaeformis and its corresponding displacement data under different soil water content.
Dr (mm)ρs (g/cm3)Ws (%)NrPulling Force (N)Displacement (mm)
1.411.529.72Broken26.446.82
1.451.5212.72Broken28.426.83
1.351.5215.72Broken31.517.03
1.431.5218.72Broken30.6510.87
3.271.529.72Pullout73.9112.83
3.171.5212.72Pullout85.1113.46
3.251.5215.72Pullout89.6813.19
3.191.5218.72Pullout69.7810.93
5.051.529.72Pullout156.3310.63
5.001.5212.72Pullout181.7811.27
5.031.5215.72Pullout242.1212.50
5.071.5218.72Pullout227.4011.06
7.241.529.72Pullout243.9610.00
7.251.5212.72Pullout283.3710.87
7.201.5215.72Pullout377.3411.63
7.231.5218.72Pullout352.9011.91
Table 9. Comparison of the maximum pulling force of Pinus tabulaeformis and its corresponding displacement data under different soil dry weight.
Dr (mm)Ws (%)ρs (g/cm3)NrPulling Force (N)Displacement (mm)
1.45 12.72 1.52 Broken28.42 6.83
1.39 12.72 1.42 Broken26.91 6.42
1.43 12.72 1.32 Broken27.36 6.41
3.17 12.72 1.52 Pullout85.11 13.46
3.21 12.72 1.42 Pullout80.60 12.87
3.21 12.72 1.32 Pullout72.43 12.11
5.00 12.72 1.52 Pullout181.78 11.27
5.07 12.72 1.42 Pullout172.95 10.70
5.10 12.72 1.32 Pullout154.15 10.41
7.25 12.72 1.52 Pullout283.37 10.87
7.31 12.72 1.42 Pullout269.02 10.23
7.23 12.72 1.32 Pullout240.68 9.87
Publisher’s Note: MDPI stays neutral with regard to jurisdictional claims in published maps and institutional affiliations.

