1. Introduction
Since March 2022, a new round of COVID-19 has broken out in China [
1]. Consumption continues to be sluggish, and downward pressure on the economy is increasing. Provinces and cities in China have launched their own economic incentive policies in the hopes of accelerating the expansion of consumption and expanding domestic demand. Consumption coupons as an economic stimulus have been repeatedly reported in the press. For example, in April 2022, Shenzhen city issued 500 million yuan of consumption coupons to its consumers, and Ningbo issued 300 million yuan to consumers [
2]. Despite different views [
3], the effect in practice [
4,
5] has gradually gained widespread attention.
Consumers will be affected by various factors when consuming. The issuance of consumption coupons by the government to consumers does not mean that they will meet 100 percent of their consumption needs with those coupons [
6]. Rational consumers will selectively use consumption coupons based on their personal preferences, resulting in a consumers’ probability consumption scenario. The probabilistic selling [
7] strategies used by merchants also strengthen the trend of probabilistic consumer spending. This also urges the government to fully consider the probability consumption of consumers when using coupons to incentivize consumer demand.
In the era of commodity economy, the level of inventory management not only affects the cost of enterprises, but also plays a key role in stabilizing and coordinating consumer demand [
8]. The dynamic changes in consumer demand preferences determine that enterprises must always control their inventory levels, neither out of stock, nor too much inventory, resulting in backlogs. Consumer behavior using coupons will inevitably challenge the traditional level of inventory management.
Therefore, it is of great significance to analyze the probabilistic consumption of consumers and the inventory optimization level of merchants in the process of using consumption coupons, which can provide some reference for the subsequent scientific development of incentive policies of consumption coupons. In this study, an improved minimum-cost and maximum-flow model was constructed (see
Section 3.1), and the characteristic of the model was to dynamically adjust the inventory capacity of node enterprises with the level of probabilistic consumption (see
Section 3.2). Through assumptions, the paper simulated three scenarios and performed calculus (see
Section 4.2). The results showed that this study could better solve the problems of consumption coupons, probabilistic consumption and inventory optimization (see
Section 5).
2. Literature Review
In the face of the global recession and the impact of the COVID-19 pandemic on the economy, the economies of the world are facing enormous challenges. The economic contraction [
9] has been triggered by the pandemic, and social and economic losses continue to increase in many countries [
10]. The effect of investment pulling is not obvious in the short term. The pandemic has reduced investments and the fiscal revenues of governments, thus increasing uncertainty. A demand-side shock was triggered by global and national restrictions to limit the spread of COVID-19, such as lockdown measures and travel bans [
11]. The revitalization of consumption has become an important tool to stabilize the economic development. For consumers, coupons mean the increase of their temporary incomes. Such fiscal policy would increase the demand for consumption and simulate aggregate demand [
12,
13]. Stimulating the economy by issuing consumption coupons and activating market demand can better alleviate market failures, promote economic development in the short term, and help economic recovery [
14].
Consumption coupons are a temporary incentive for the government to stimulate consumption [
15], and are also a special coupon, which can be used exclusively by dividing the consumption categories of designed products [
16]. The government uses consumption coupons to boost consumer confidence [
17], which, in turn, will increase consumers’ willingness to buy more goods and thus stimulate market dynamics, thus stimulating market vitality. Experts and scholars have various views on the role of consumption coupons, such as that they can effectively improve consumption, promote economic growth and increase employment [
18]. Coupons can enhance the experience and outcomes for participants, benefiting more low-income households [
19]. Consumption coupons are effective in stimulating short-term consumption levels. It will reduce the welfare level of society as a whole if the savings plan is not optimal [
20]. The substitution effect of consumption coupons makes them difficult to pull effective demand for a long time [
21]. The multiplier brought by consumption coupons in China during the 2020 epidemic is around 5–25, which has a significant effect on the GDP in the short term [
22]. Consumption coupons are conducive to activating the frozen domestic demand [
23] and market dynamics under the epidemic and make up for the short-term gap in overseas markets due to the global spread of the epidemic.
The difference in consumer purchasing behavior mainly comes from the difference in shopping decisions, and there is uncertainty [
24] due to the influence of various factors in the process of purchasing behaviors [
25], which is generally expressed by probability. Uncertainties faced by consumers in their purchase decisions include preference uncertainty and product performance uncertainty [
26]. People may be non-indifferent towards the timing of the resolution of consumption uncertainty [
27]. Probability, as an expression of purchase intention [
28], can produce more accurate consumption predictions and may elicit different responses than standard purchase intention scales. Businesses must pay attention to consumer dynamics [
29] and make appropriate marketing decisions based on an accurate understanding of consumers. Consumer dynamics are defined as temporal changes in consumer attitudes and behaviors. Today, probabilistic selling [
30,
31] is increasingly becoming a sales strategy for businesses and growing in popularity. Probabilistic selling could generally increase a firm’s expected profit, and the firm will increase the price and the order quantity for the component product [
32]. From a business perspective, adequate and controllable inventory can help companies better gain profits while reducing total costs [
33]. Stock-outs will lead directly to lost sales, reduced profits, and the potential loss of customers [
34]. Maintenance of inventories is a significant concern for any business organization due to decay or deterioration over time [
35].
As one of the core problems of network optimization, the minimum-cost maximum-flow problem has a wide range of applications in reality, and the common special cases include the shortest path problem, the maximum-flow problem, and the assignment problem. A prognostic decision-making strategy is proposed to solve in real time the electric vehicle dynamic stochastic shortest path problem, aiming at the simultaneous utilization of historical and real-time traffic data [
36]. A network is called uncertain if the arc capacities of the network are uncertain variables. Uncertainty theory is an efficient tool to deal with nondeterministic information, especially expert data and subjective estimation [
37]. Scholars have conducted multidimensional studies based on different application scenarios [
38,
39,
40], combined with the minimum-cost maximum-flow network model, and have achieved fruitful results.
Compared with existing studies, the main contributions of this study are as follows: (1) A minimum-cost and maximum-flow model is constructed, in which the capacity value on each arc will vary with the change of consumption probability value on its own arc. This helps to more effectively regulate the relationship among coupons, probabilistic consumption and inventory optimization. (2) On the basis of satisfying the government to issue sufficient consumption coupons and to stimulate consumer demand, it can help companies minimize ineffective inventory. (3) With the dynamic change of consumption probability, the inventory of enterprises will also vary, and the needs of consumers have been fully satisfied. (4) Based on the model derivation, corresponding countermeasures are proposed.
3. Materials and Methods
3.1. The Improved Idea of a Minimum-Cost and Maximum-Flow Model, in Which the Capacity Value on Each Arc Would Vary with Its Own Probability Value
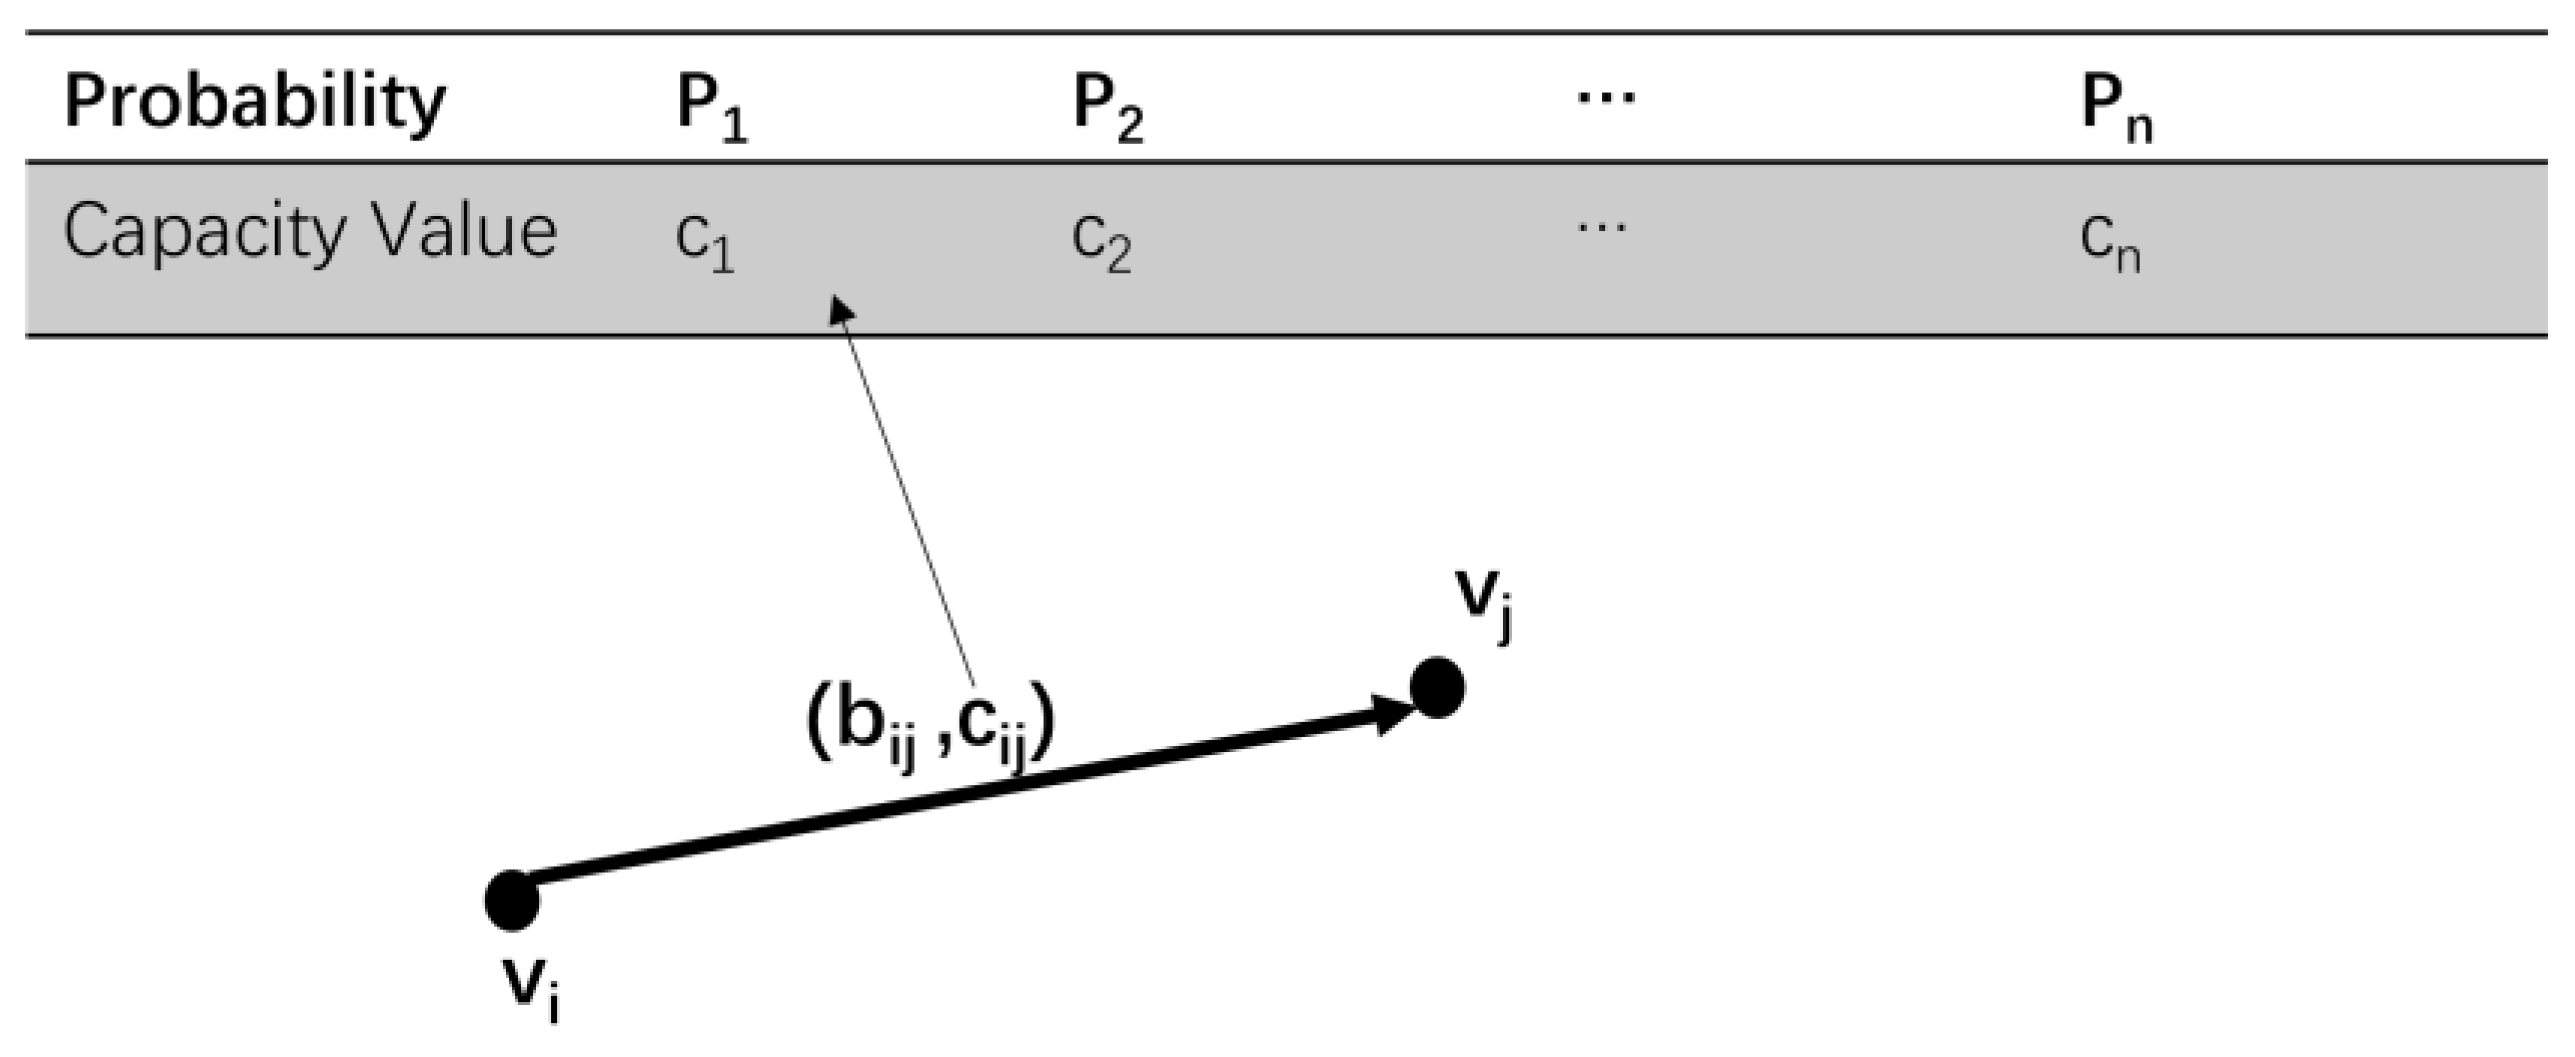
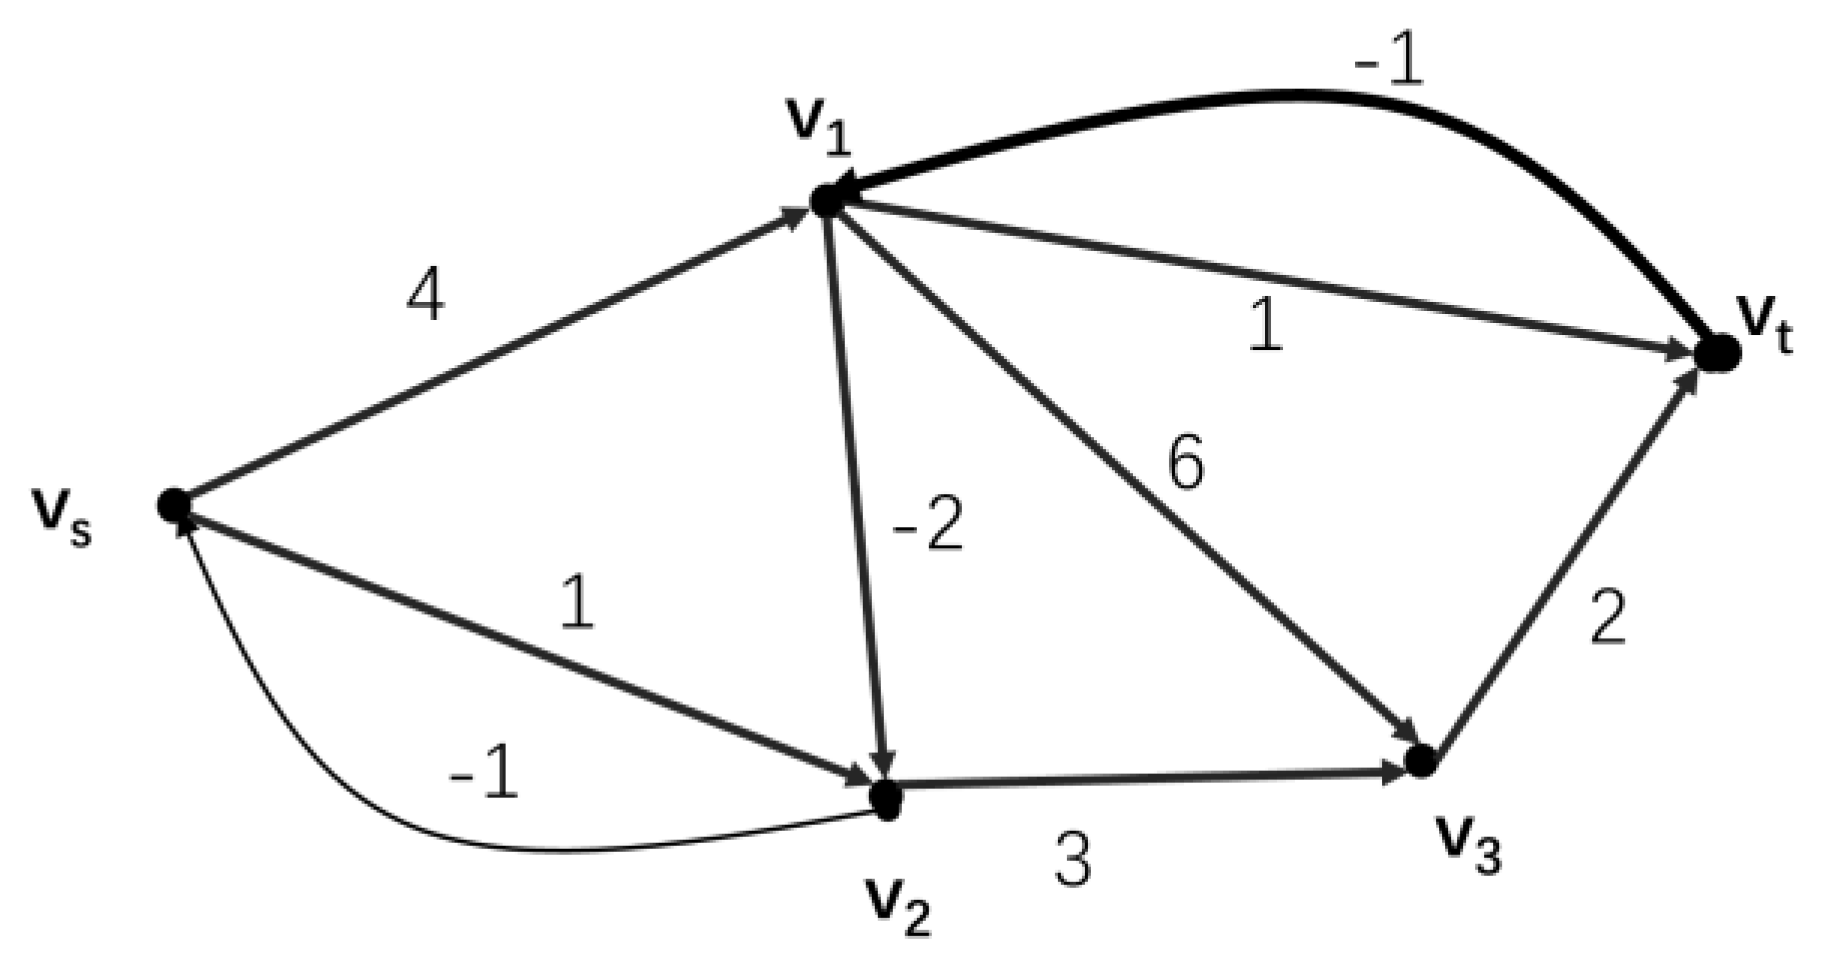
In a directed network D = (V, A, C) with only one single source node (Vs) and one single sink node (Vt), each arc (vi, vj) belonged to the capacity set (C), and the cost per unit of flow on each arc b(vi, vj) was greater than or equal to 0. Under the premise of finding a maximum flow f in this network D and minimizing , the objective was to keep the sum of C over each arc in this directed network to be minimum.
First, a table of capacity and probability values on each arc was constructed, as shown in
Figure 1.
P1 was the initial probability corresponding to the capacity c1 on an arc. As the probability value increased from P1 to P2, …, Pn, capacity value also synchronously increased from c1 to c2, …, cn. Pn was the maximum probability, and cn represented the maximum capacity value for the maximum probability. The capacity value under the initial probability P1 was chosen to generate the directed network under this initial probability. Based on the cost unit of flow (bij), a shortest path from Vs to Vt was calculated using Dijkstra’s method to find the corresponding augmented chain. Taking the initial flow f on this augmented chain as 0, the minimum value of the difference between the capacity value and the flow value of each arc on this augmented chain was used as the adjustment value to adjust the flow f. Next, the weighted digraph was constructed. We recalculated the shortest circuit, found out the corresponding augmented chain, and then adjusted the capacity value according to the probability value on each arc. We repeated the above steps until you could not find a shortest path from Vs to Vt, then ended the loop. At this point, the sum of capacity c on all arcs in the directed network was the minimum, and the maximum flow and minimum cost were satisfied.
3.2. Calculation Steps to the Model
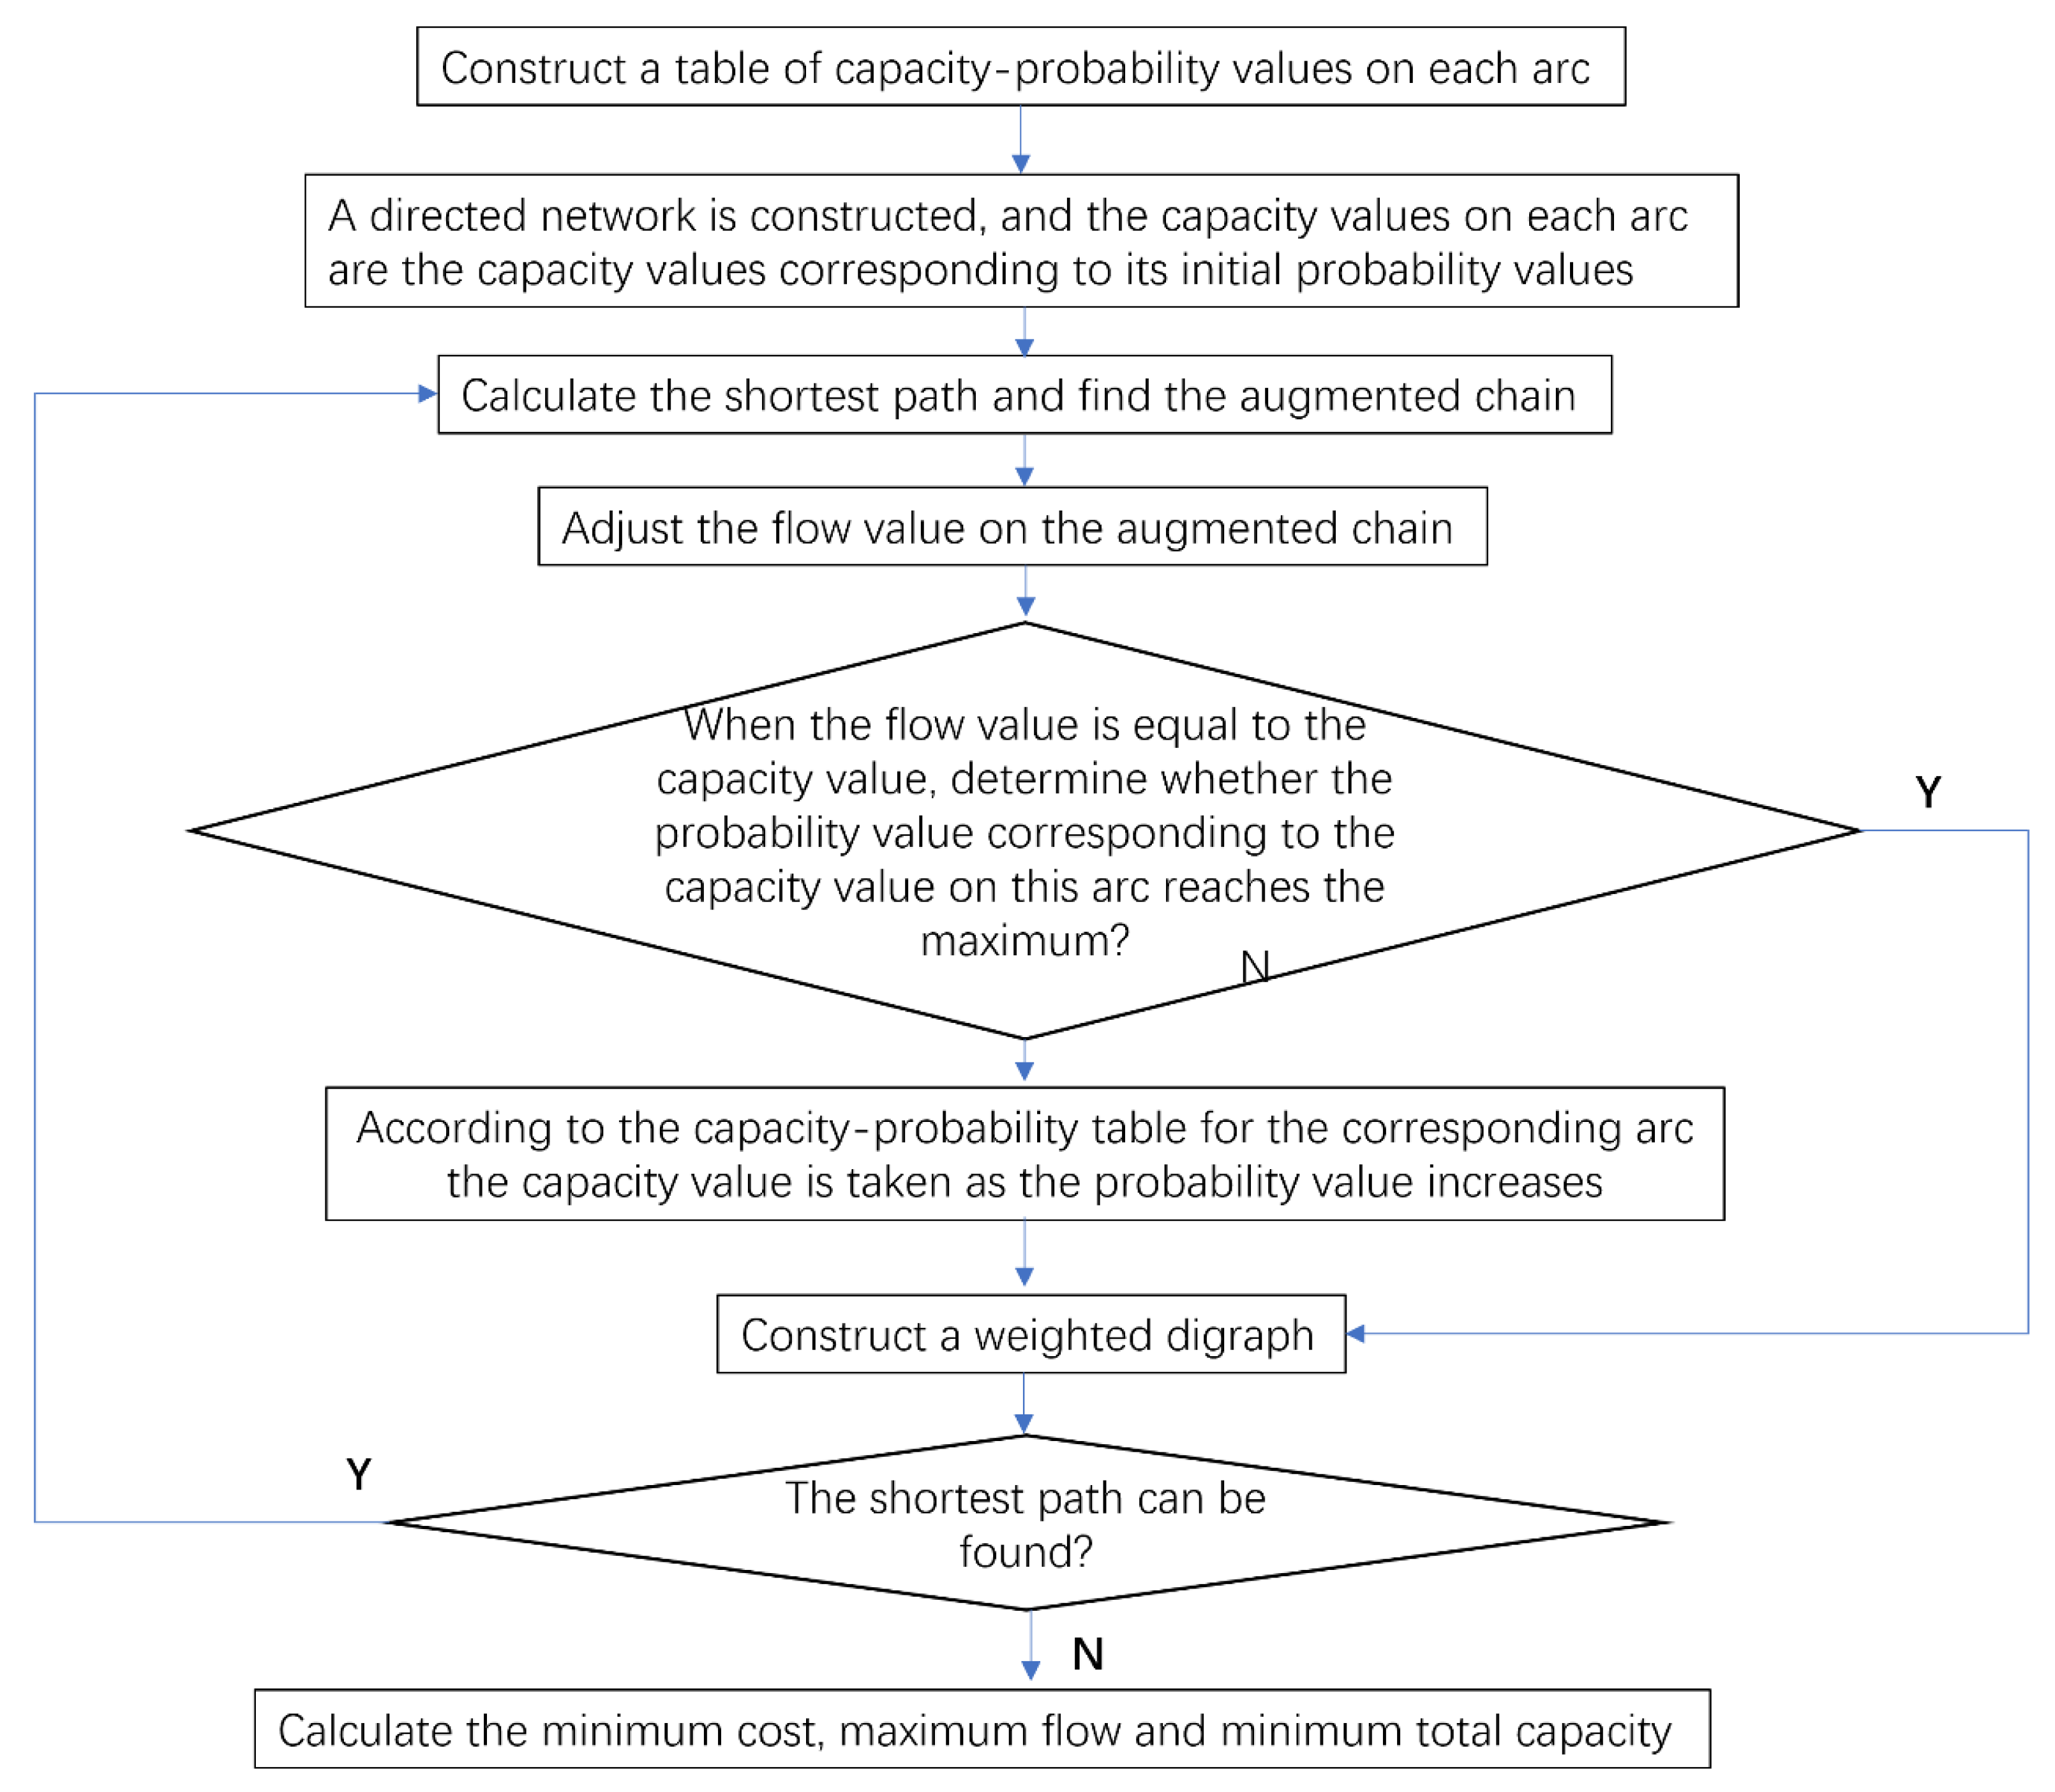
As shown in
Figure 2, the calculation steps could be expressed as:
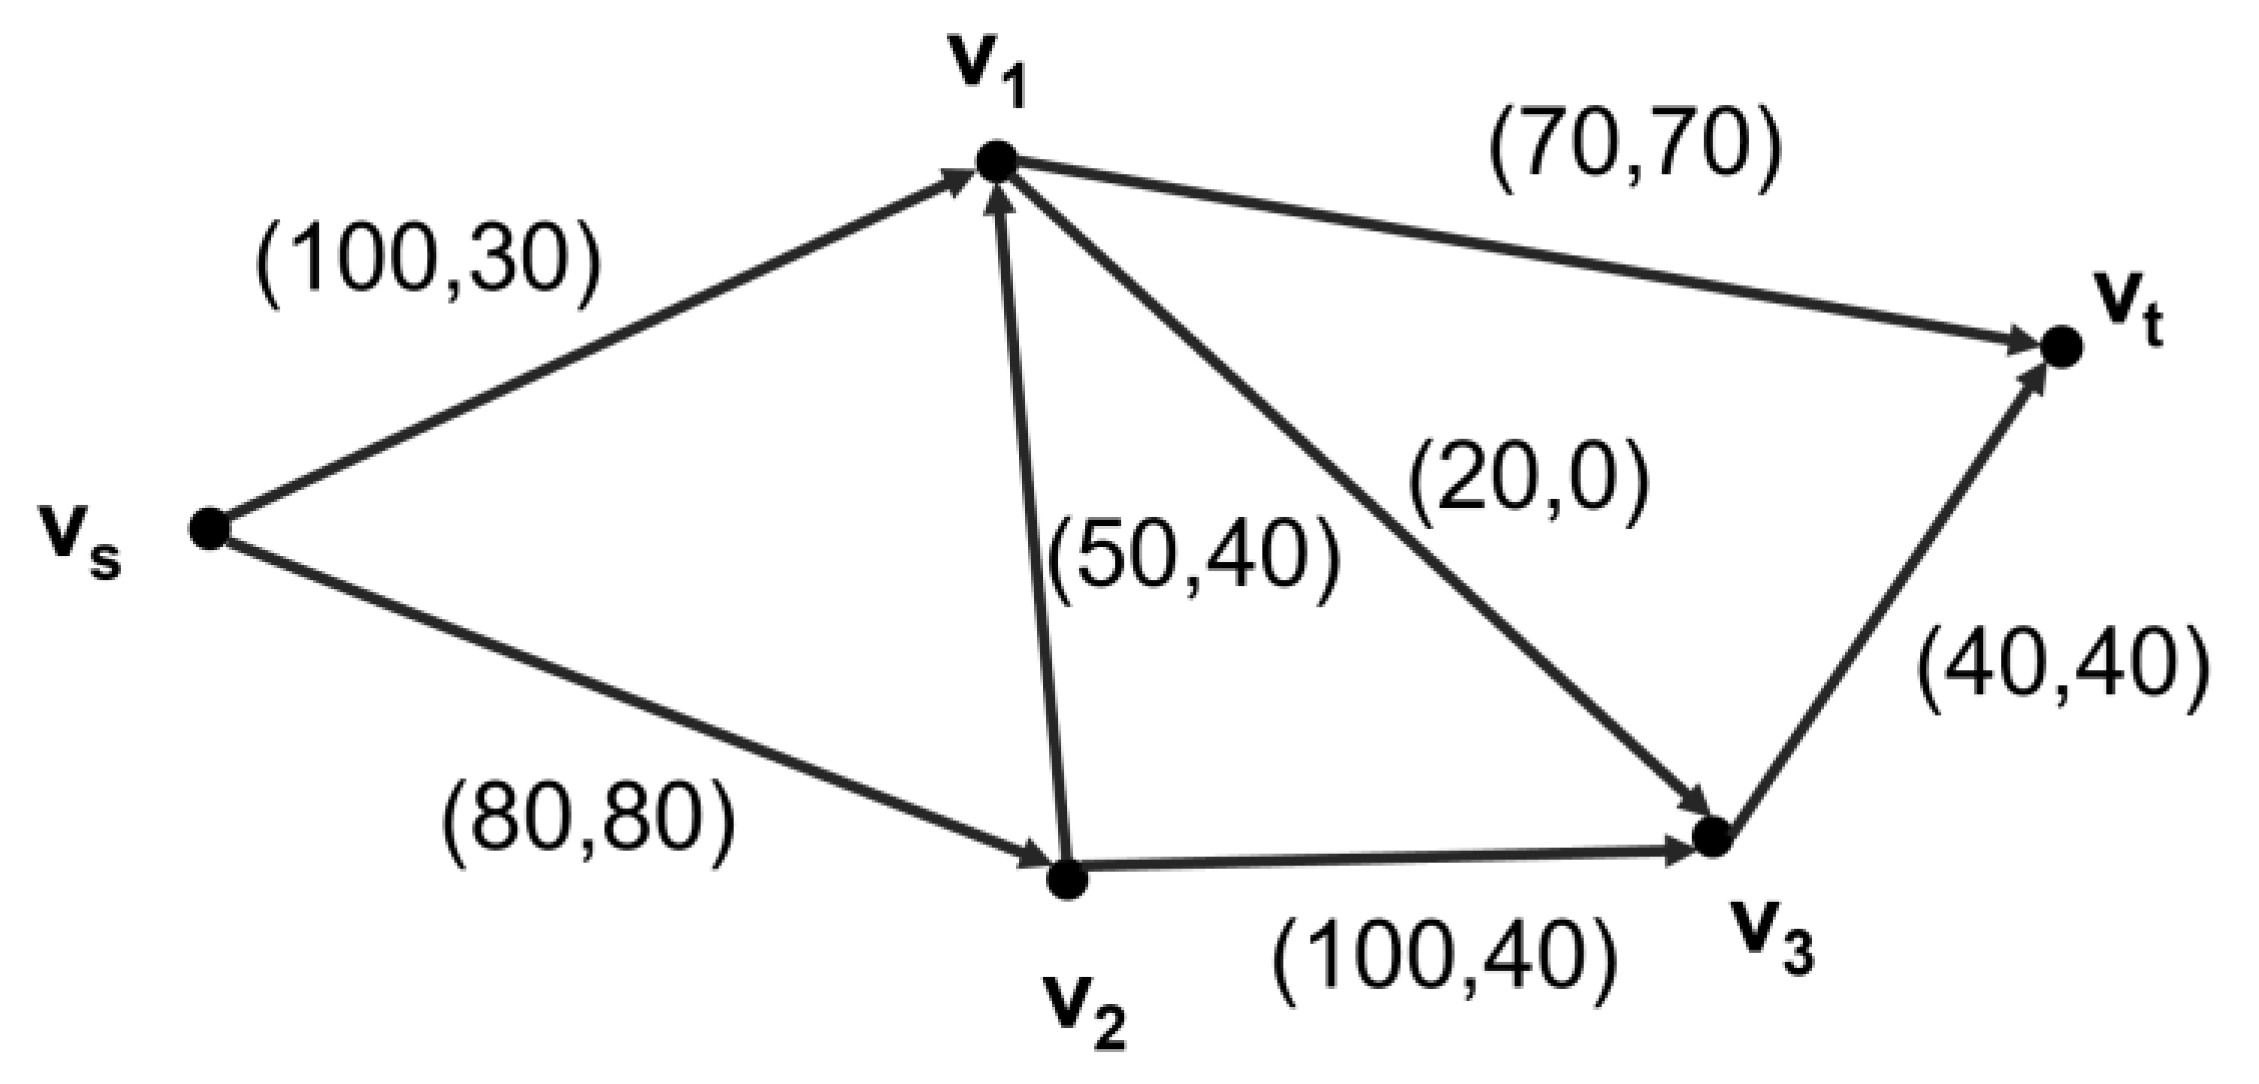
Step 1: A table of capacity-probability values on each arc was constructed. Specifically, the maximum capacity to be controlled on the arc was used as the capacity value corresponding to the maximum probability value. Different probability values were set, and different probability values correspond to different capacities to form a table of capacity-probability values. This model assumed that the probability values in the capacity-probability table showed a single-term increasing trend, and the capacity value also grew as the probability value increased.
Step 2: We constructed a directed network where the capacity value on each arc was the capacity value corresponding to its initial probability value. Depending on the purpose of the study, we determined the initial probability values corresponding to different arcs. The corresponding control capacity cij were selected by the probability values, and the directed network was constructed by combining the cost per unit of flow on each arc b(vi,vj).
Step 3: We calculated the shortest path and found the augmented chain. Using Dijkstra’s method, a shortest path from Vs to Vt was calculated based on the cost per unit of flow, b(vi,vj), on each arc, and the corresponding augmented chain was determined.
Step 4: We adjusted the flow value on the augmented chain. If the flow value on the augmented chain was calculated for the first time, the initial flow value fij on that augmented chain could be assumed to be 0. The minimum of all capacity values on that chain was used as the adjustment value θ for flow fij, and then the flow value on each arc plus θ was used as the new flow value fij. If there was already a flow value fij on an arc on the augmented chain, the minimum value of the difference between the capacity value and the flow value on each arc in the incremental chain was used as the adjustment value θ to adjust the flow fij when calculating the adjustment value, and the flow value on each arc plus θ was used as the new flow value fij.
Step 5: When the flow value was equal to the capacity value of an arc on the augmented chain, we determined whether the probability value corresponding to the existing capacity value on that arc had reached the maximum probability value. If not, we proceeded to step 6. Otherwise, we proceeded to step 7.
Step 6: We looked up the table of capacity-probability values for the corresponding arc, selected the corresponding capacity values along the probability growth direction, and adjusted the capacity values for the corresponding arcs on the augmented chain. Because the probability was one-way increasing, the adjacent probability value could be found, and we then determined the corresponding capacity control value cij by that adjacent probability value, replacing the capacity value on the existing arc.
Step 7: We constructed a weighted digraph. On the augmented chain, a weighted digraph identical to the current cost and flow network graph was constructed, and each arc in the original network was decomposed into two arcs (
vi, v
j) and (
vj,
vi) that were inverse to each other, and the weights were recorded as
ωij and
ωji, respectively. The rules were as follows:
Step 8: We determined whether the shortest circuit could be found or not. If the shortest path could be found, it meant that further adjustment was needed, then we went back to step 3. Otherwise, it meant that the augmented chain at this time was already the shortest path, there was no need to adjust, optimization was over, and step 9 was entered.
Step 9: Based on the results of step 8, the minimum cost was calculated, while the maximum network flow was determined as the sum of the outgoing flow values at node vs. The sum of the capacity values on all arcs was then calculated as the minimum total capacity on that network.
3.3. Feasibility Analysis of an Improved Model for the Application of Consumption Coupons, Probabilistic Consumption and Inventory Optimization
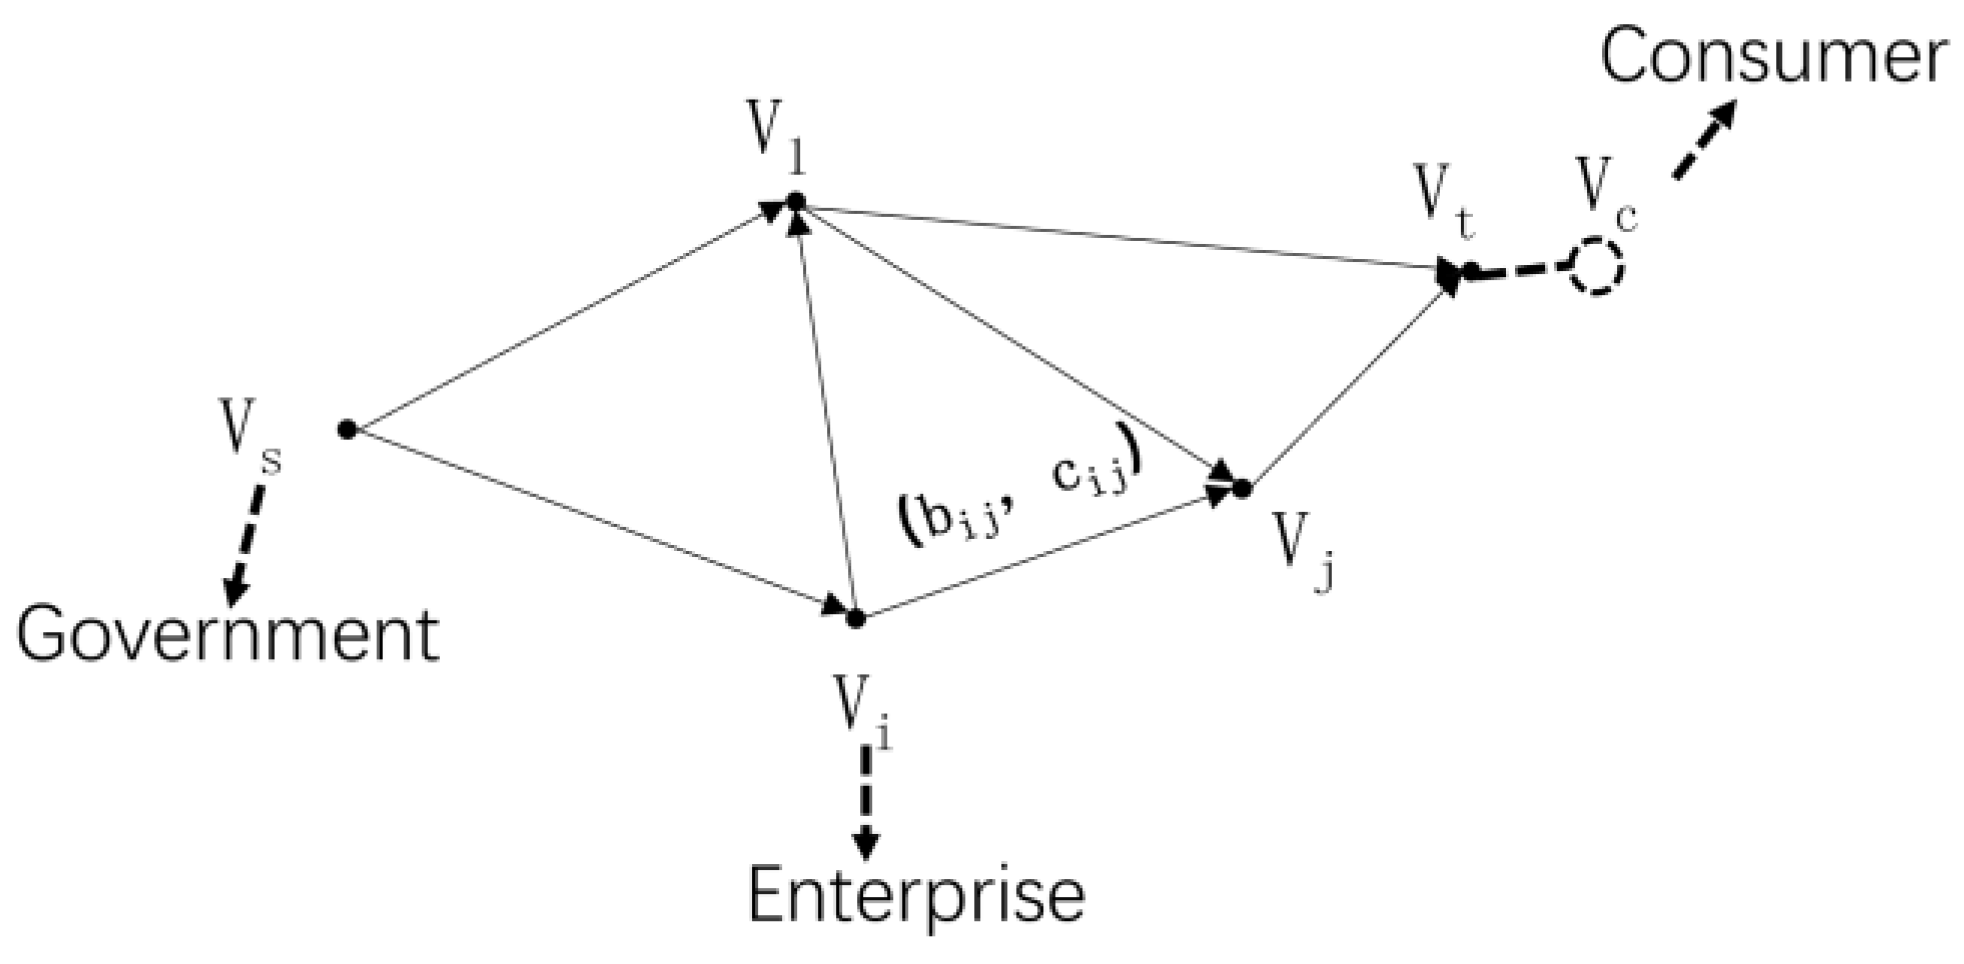
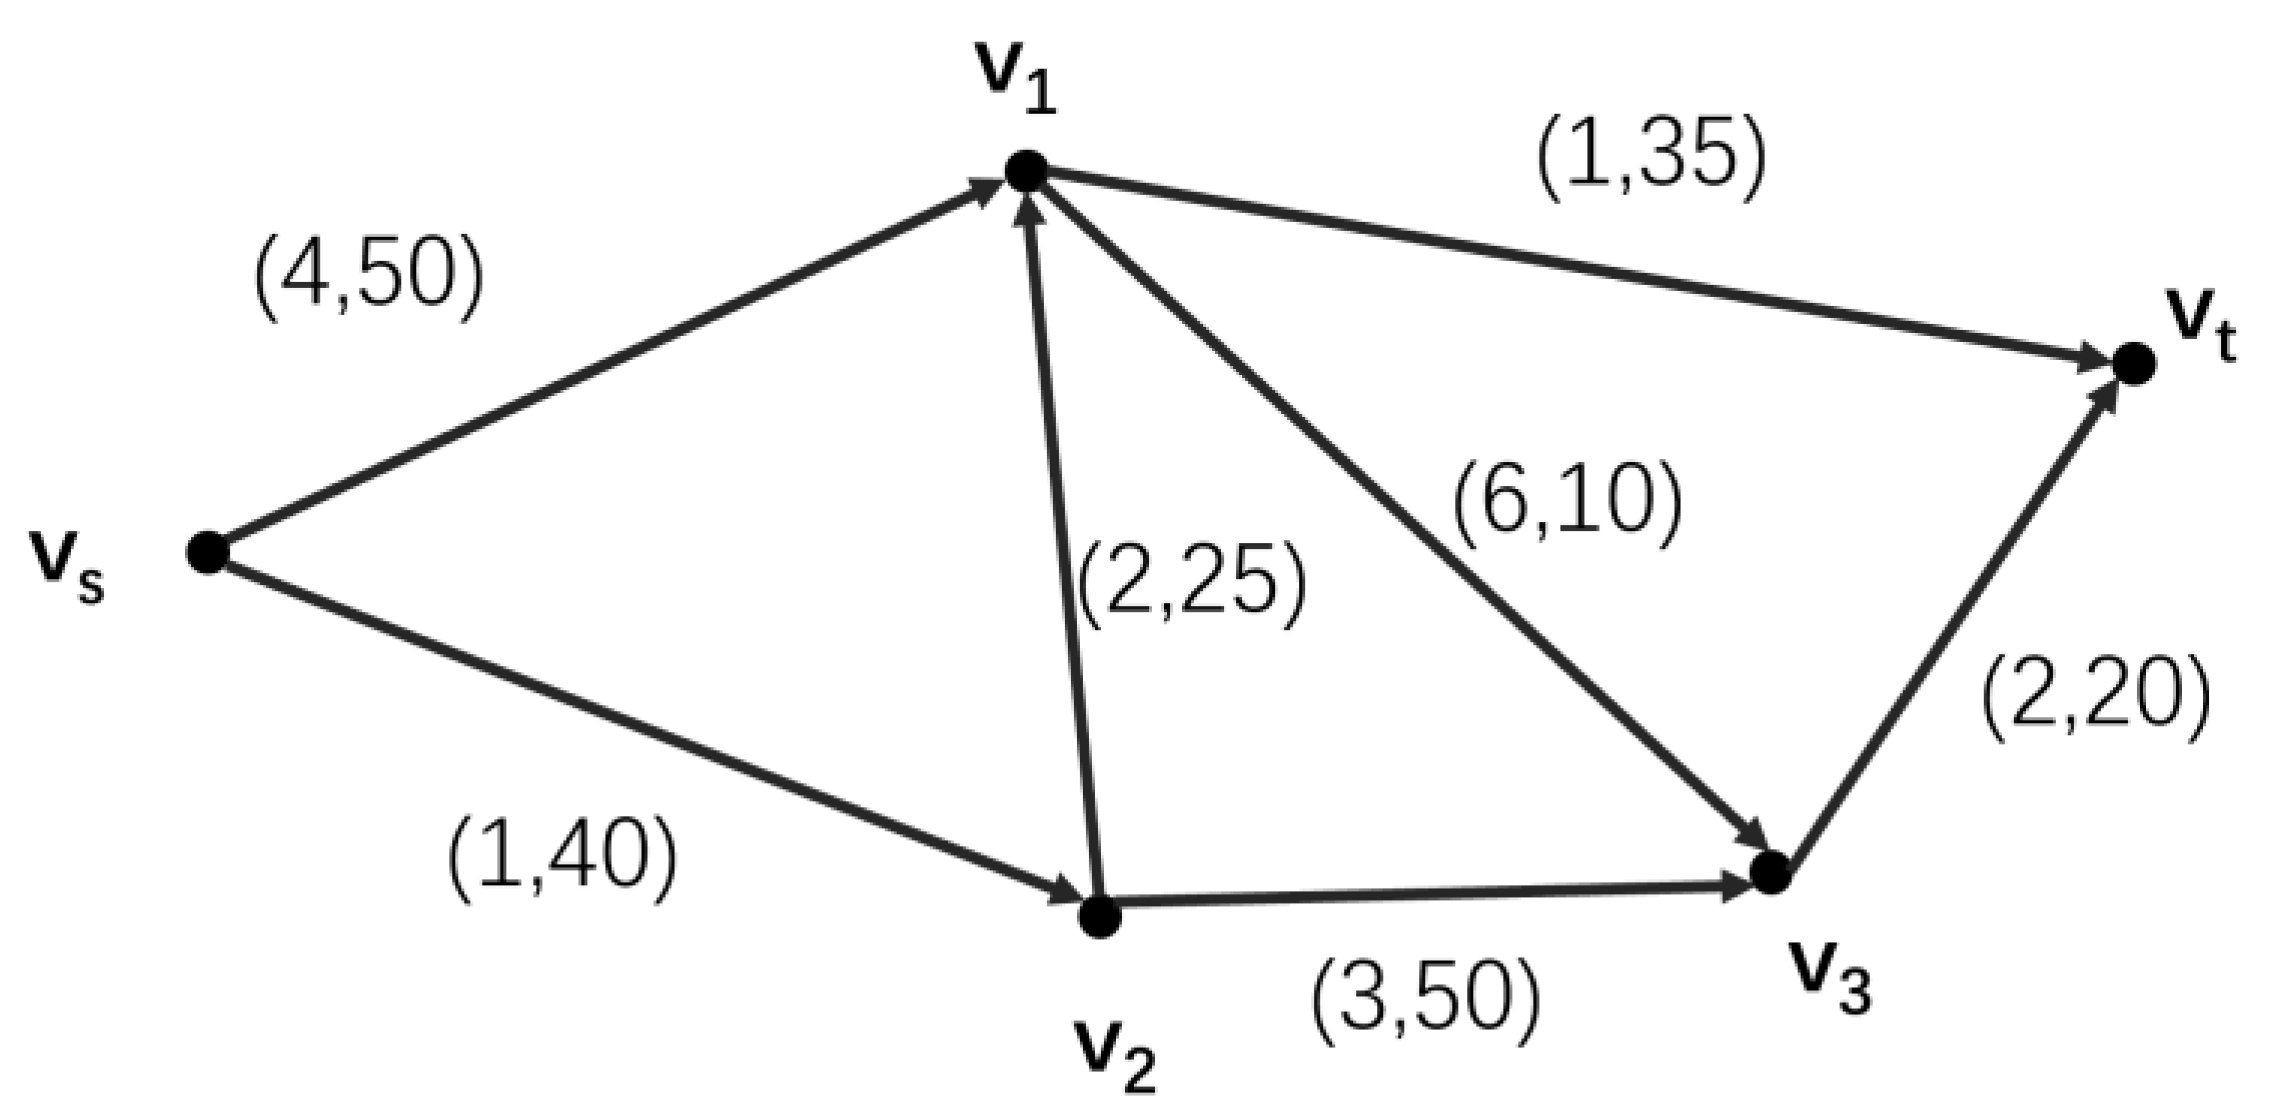
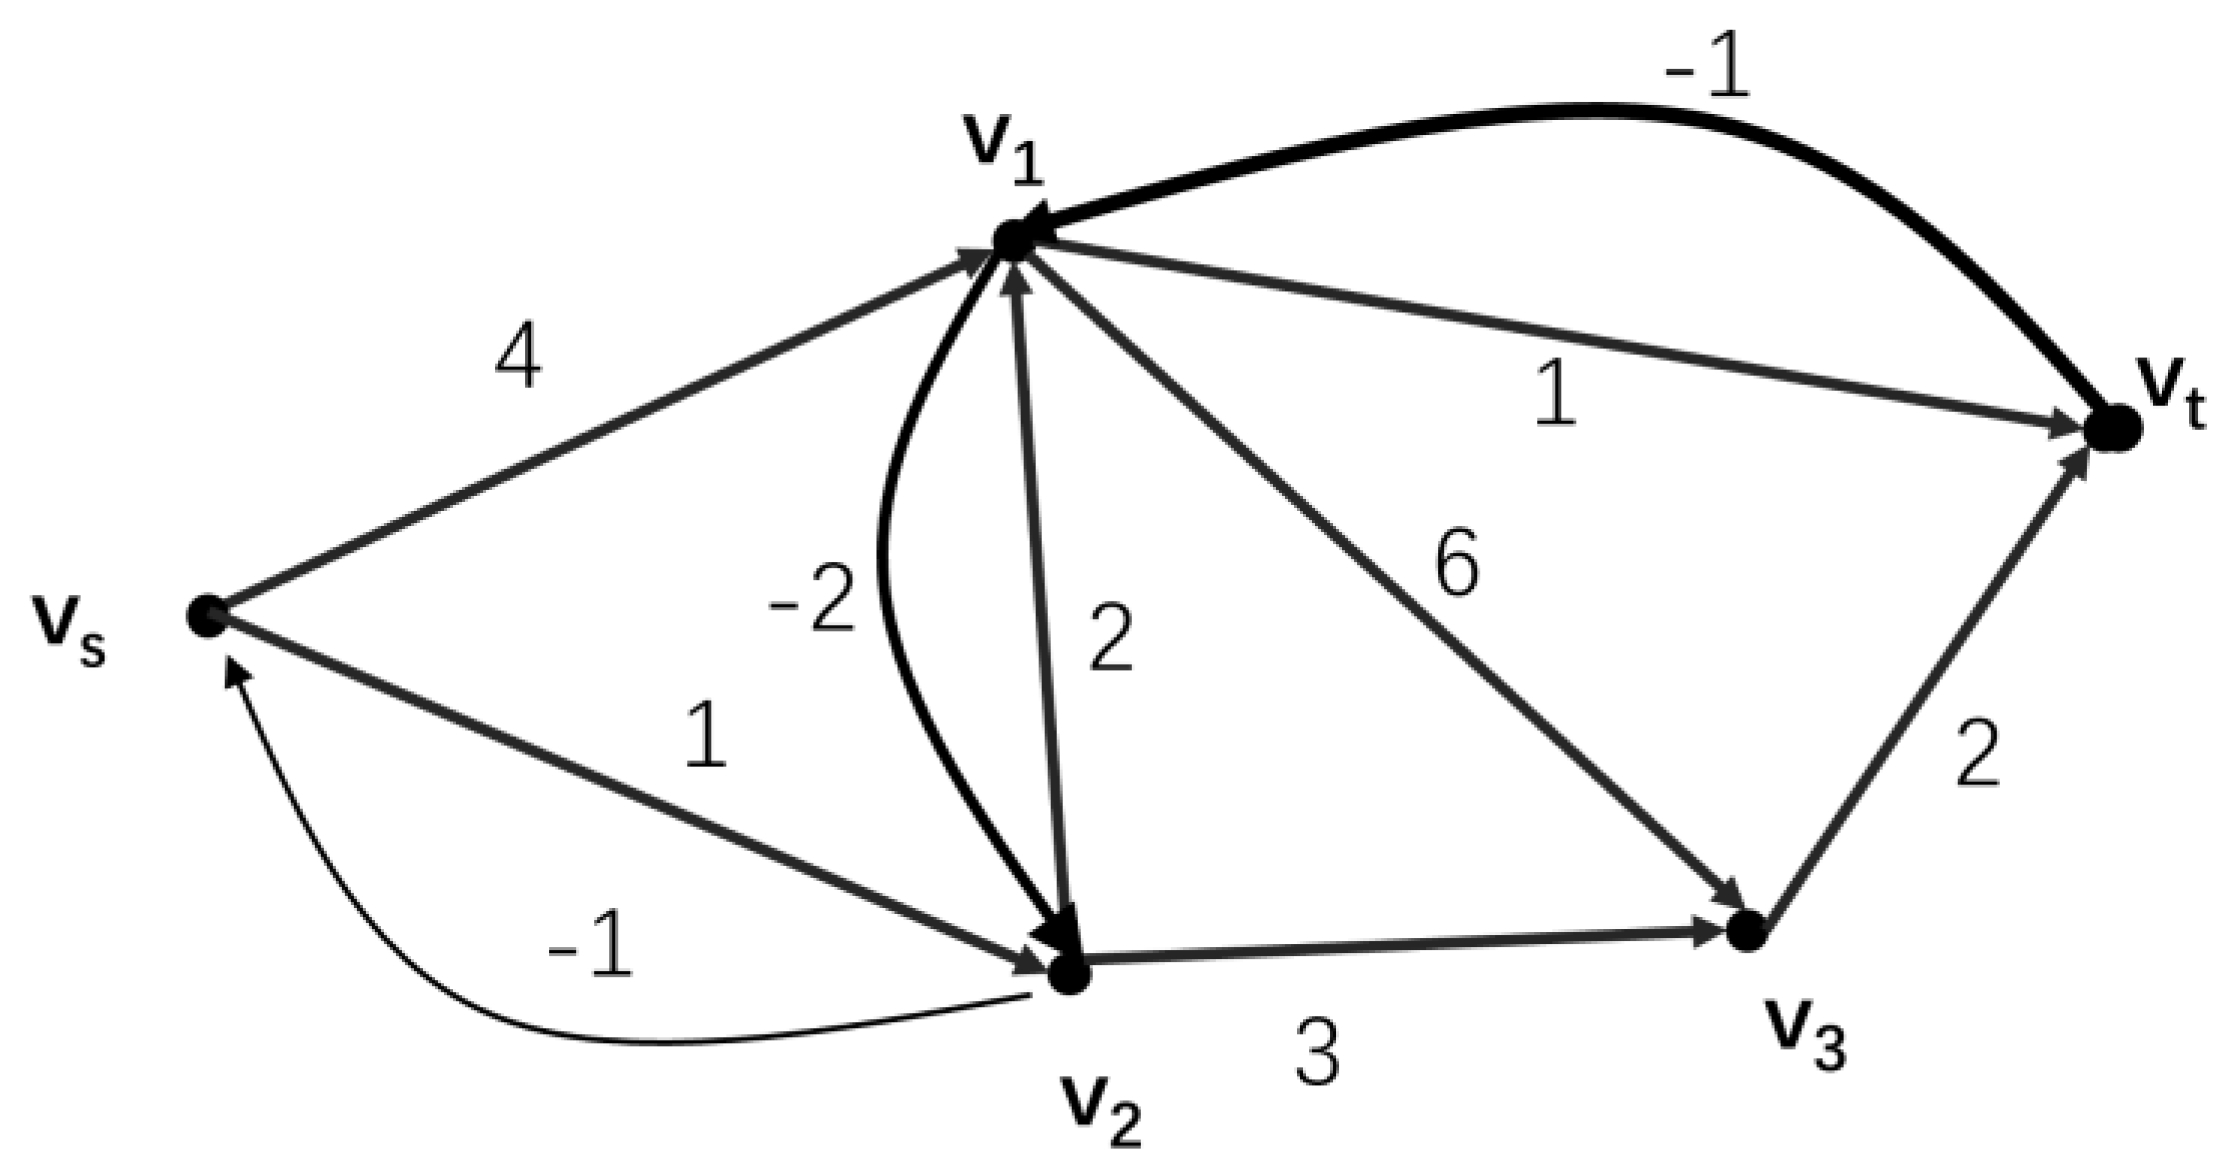
With the recurrence of COVID-19, it has become imperative for governments to take different approaches to stimulating their economies. As mentioned earlier, governments have already started to practice in many countries by issuing consumption coupons to stimulate the economy. In this scenario, three subjects would be involved, which were government, enterprises and consumers. In the minimum-cost maximum-flow graph shown in
Figure 3, node
Vs could be viewed as the government, node
Vc as the consumer, and the intermediate nodes as the firms that satisfy the different needs of the consumer. It was assumed that the government-issued consumer coupons did not restrict consumers from purchasing any goods. It was only stipulated that only one consumption coupon could be used on one commodity.
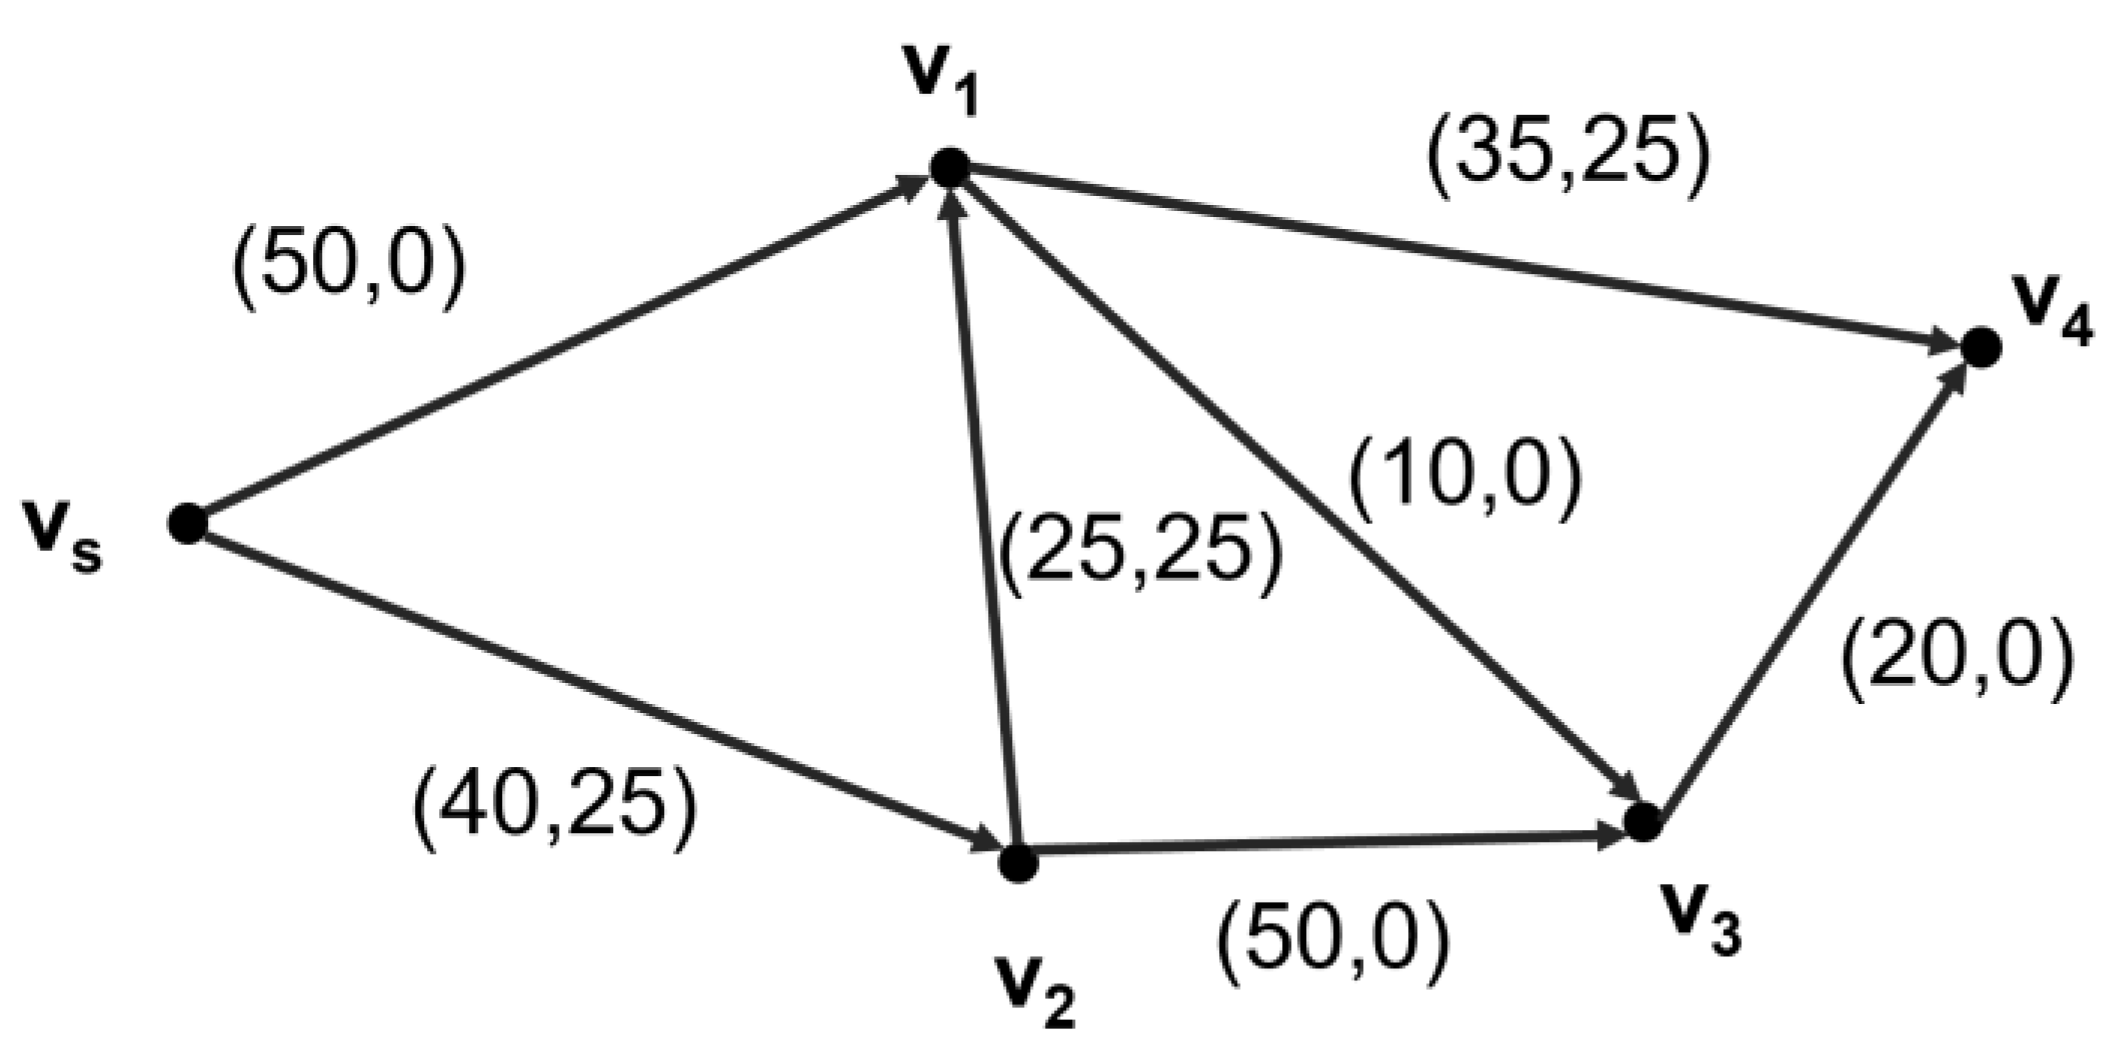
It was assumed that the government-issued consumer coupons did not restrict consumers from purchasing any goods. It was only stipulated that only one consumption coupon could be used on one commodity. The flow in the network could be regarded as the consumption coupons issued by the government to purchase goods from node enterprises to meet the needs of consumers. The use of coupons would not change the price of products while stimulating consumer demand. Therefore, the cost unit of flow on each arc could be regarded as the commodity price, and the usage of coupons could be analogous to the quantity of goods purchased. Even if consumers held enough consumer coupons, there was a probabilistic purchase problem when faced with a specific demand. It did not exactly follow the individual’s real demand to purchase the maximum goods, so the capacity on the arc also needed to change with the probability of consumer purchase. For node enterprises in the network, the capacity on the arc could be compared to the stock quantities of the enterprise. Only adequate inventory could ensure that the enterprise met the needs of consumers. Excessive inventory would inevitably increase the cost of enterprises and was not conducive to competition, which would inevitably drive enterprises to seek minimum inventory. For the government, what was needed was that the coupons paid out met the consumer demand to the greatest extent. For consumers, what was needed was to meet the maximum consumption on the basis of the minimum cost, that is, to be able to find the shortest path from node vs to node vt. In the specific calculation, the connection between node vt and node vc could be deleted, and the improved minimum-cost maximum-flow model could be directly used for calculation. According to the above analysis, it could be seen that the improved minimum-cost maximum-flow model could better complete the research and had a strong practical guidance.
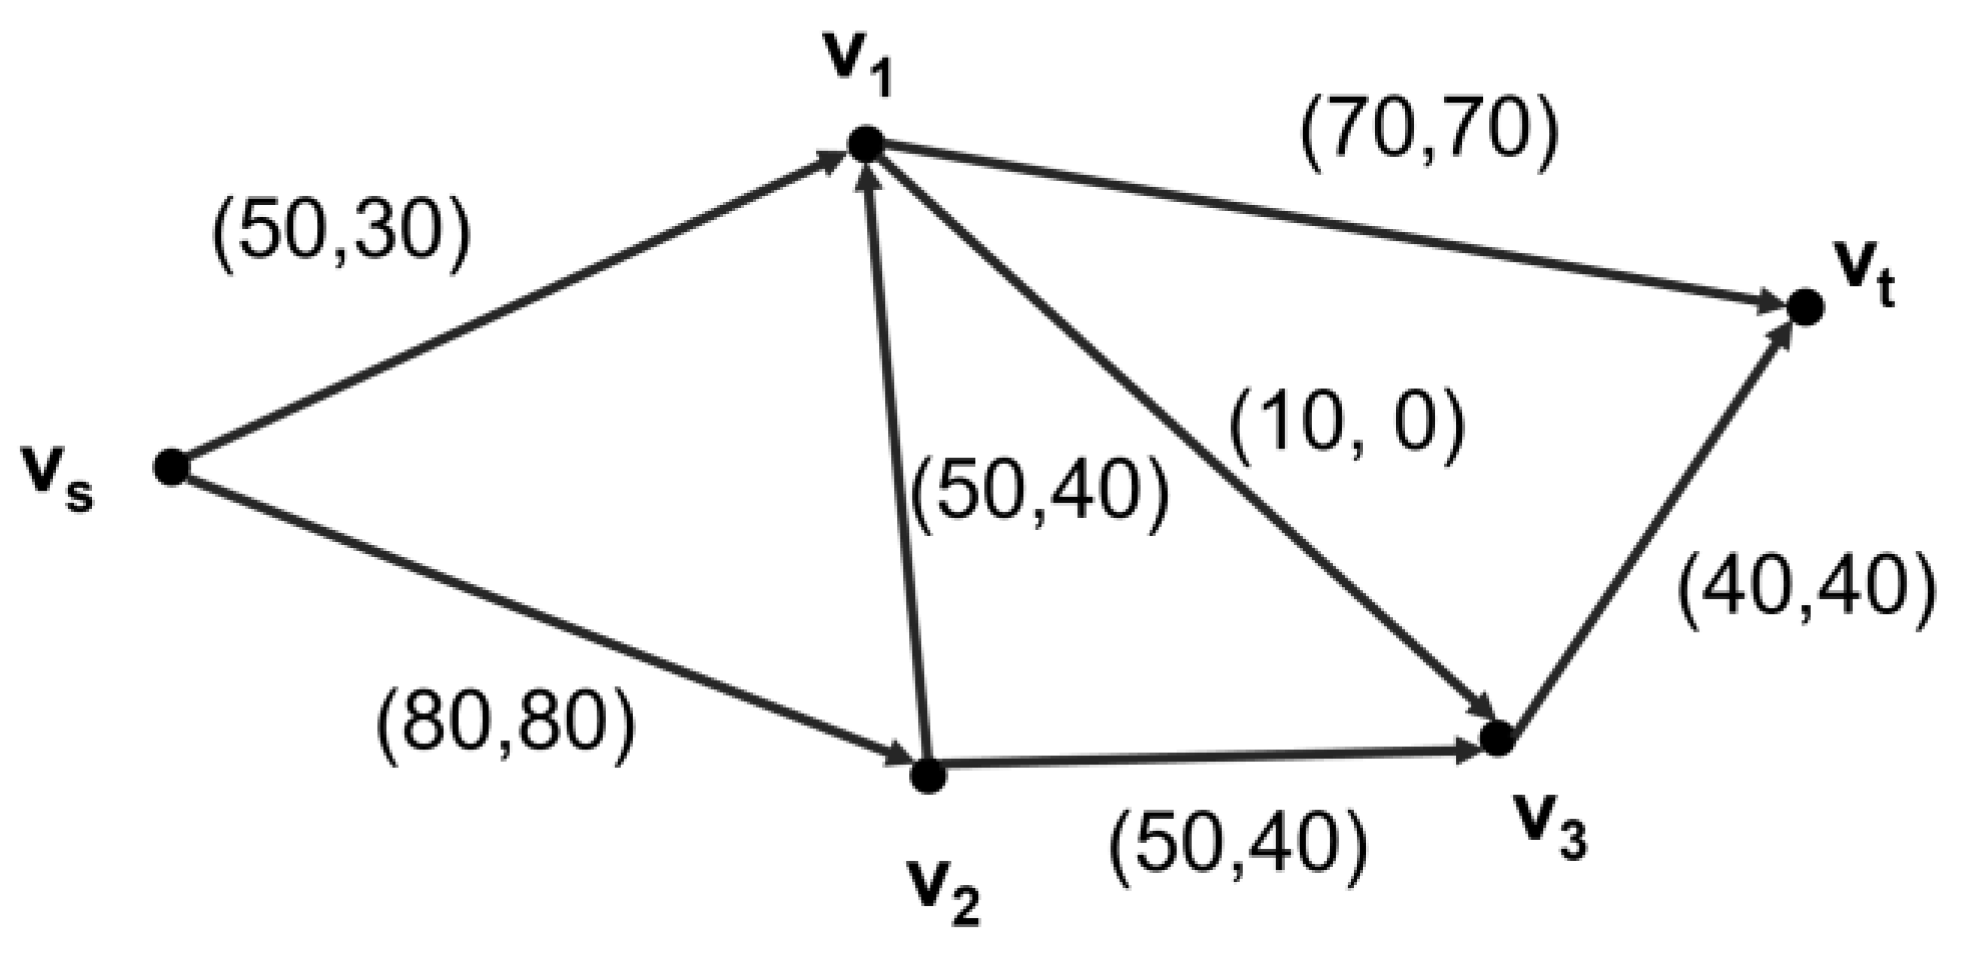
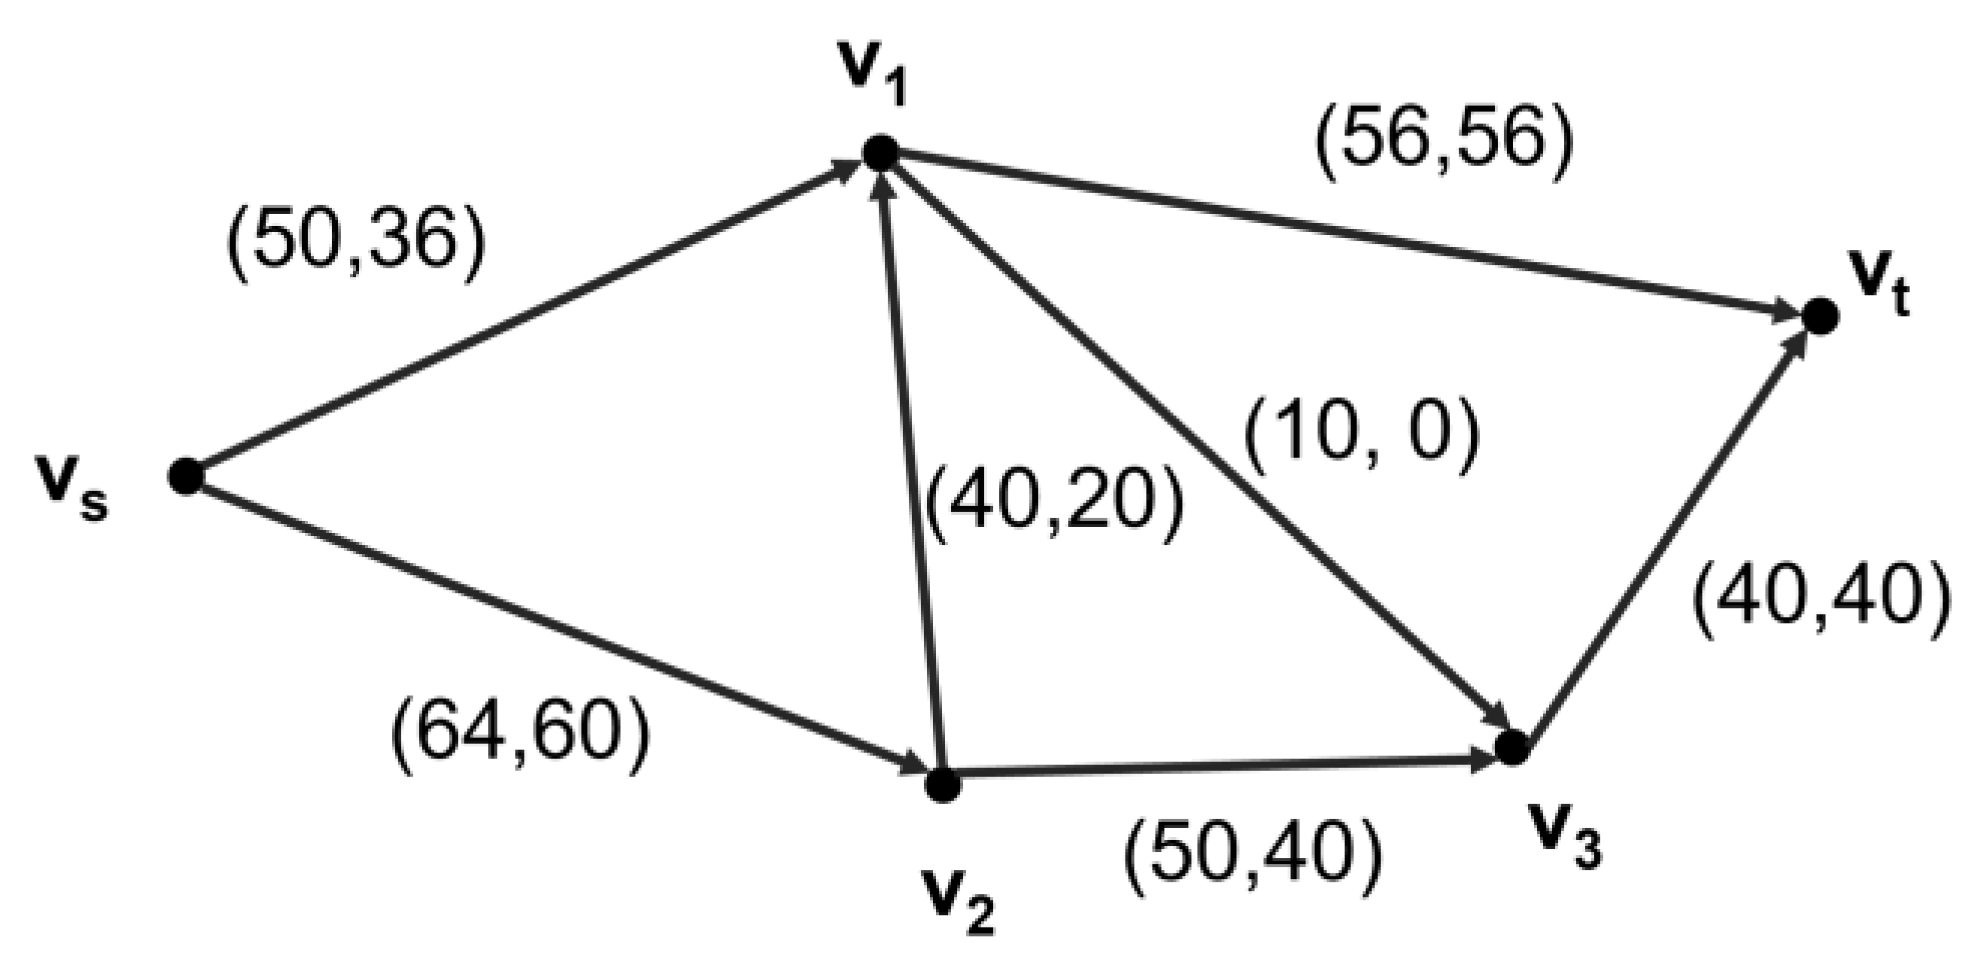
5. Conclusions and Policy Recommendations
In this paper, an improved minimum-cost maximum-flow model was constructed to study the optimization problems of consumption coupons, probabilistic consumption and inventory. With the objectives of maximizing the number of coupons issued and minimizing the enterprises’ inventory, different results of consumers’ probabilistic consumption were studied. Simulation study showed that enterprise inventories were minimized with different decisions on consumer probability consumption, and the government’s issuance of consumption coupons and the satisfaction of consumer demand have reached a dynamic balance. From the perspective of consumer demand, consumer demand is satisfied at each node by using different probabilistic consumption. From the perspective of enterprise inventory control, the optimal amount of inventory can be achieved by dynamically changing the enterprise inventory with the value of probabilistic consumption. From the perspective of government issuance of coupons to stimulate the economy, consumer welfare remains unchanged, the largest number of government consumption coupons can be issued, and the number of enterprise inventories reaches the lowest.
In order to better promote consumers’ probabilistic consumption and enterprises’ inventory optimization level in the process of using consumption coupons, the following policy recommendations are made at three levels: government-issued consumption coupons, enterprise inventory optimization and probabilistic consumption.
First, keeping a close eye on consumer demand, the government should strictly control the issuance of consumption coupons. When adopting consumer coupons to stimulate the economy, the government should not simply aim to issue the maximum number of coupons. What should be more of a concern is whether these consumption coupons can really stimulate consumers’ potential demand desire and promote consumption. Increasingly rational consumers, in the face of the uncertainty of the future brought about by the epidemic, will inevitably pursue consumption decisions at the lowest cost of consumption when consuming. Therefore, the government needs to prudently design consumption coupons so that consumers are clear about the strength of the cost discount brought by the coupons. Second, the government should fully cooperate with third-party market research companies to investigate the potential consumption needs of the target group, and determine the optimal number of consumption coupons with the help of the minimum-cost maximum-flow model, rather than issuing consumption coupons arbitrarily according to personal wishes.
Next, to help enterprises minimize inventory to the maximum extent. Supply and demand are the two ends of the economy, and only when both are smooth can we ensure sustainable economic development. In most cases, enterprises will prepare more inventory to cope with consumption and avoid losses caused by out-of-stocks. When there is a stimulus policy acting on the consumption side, this extra inventory preparation by supply-side enterprises is artificially amplified. When the stimulus ends, the growth in inventory to cope with consumption increases the cost of the business. Therefore, helping enterprises minimize inventory is a factor that must be considered when the government adopts incentive policies. The minimum inventory can be determined with the help of the minimum-cost maximum-flow models in the paper, which is not only effective but also feasible.
Last, to track consumer demand in real time and dynamically adjust consumption probability, consumers, as a fickle population, will involve a variety of factors when satisfying their own consumption. In the face of the consumption of a certain product, consumers will inevitably have a probability consumption tendency. This determines that, when launching consumption coupons to stimulate the economy, it is necessary to use modern scientific and technological means and consumption big data to track consumers’ purchase demand in real time and dynamically push the consumption probability to enterprises in real time, so as to ensure that enterprises adjust their inventory according to the purchase probability in time, thus ensuring that the inventory reaches the lowest level while meeting the consumption demand.
In the future, this paper will conduct further research on the following scenarios. First is the application of different types of consumption coupons to different goods. The second is the impact on inventories of cooperation between competing companies in the supply of goods. In the follow-up study, further cooperation will be carried out with relevant institutions such as the government, and the model will be empirically explored using real-life examples.


