Article

Learning from Neighbors: The Spatial Spillover Effect of Crisis Learning on Local Government

1
School of International Relations and Public Affairs, Fudan University, Shanghai 200433, China
2
School of Government, Nanjing University, Nanjing 210033, China
*
Author to whom correspondence should be addressed.
Sustainability 2022, 14(13), 7731; https://doi.org/10.3390/su14137731
Submission received: 16 May 2022 / Revised: 16 June 2022 / Accepted: 22 June 2022 / Published: 24 June 2022

Abstract

:
Accident prevention is an important prerequisite for achieving sustainable development, and effective crisis learning is a necessary path to it. This article focuses on whether local governments in non-accident areas learn from crises in accident areas, that is “learn from the mistakes of neighbors” and “grow in wisdom.” Using panel data from 2006–2017 for 30 provinces in China, our empirical test discovered that there is not a one-to-one relationship between “learning from neighbors” and “growing in wisdom”; it is a U-shaped relationship between the frequency of major accidents and the crisis learning effect of local government. When the occurrence frequency of major accidents is low, the regulatory effect caused by major accidents leads to the effective crisis learning of local governments. However, when major accidents occur frequently and reach a certain threshold, the crisis learning effect will deteriorate due to an excessive deterrent effect. In this non-linear relationship, the impact of political pressure occurs on two fronts, a gentle U-shaped curve and a shift in the inflection point to the left, implying that political pressure plays a dual role in the crisis learning process of local government. Accordingly, local governments should fully seize the window of time to initiate crisis learning with regulatory effects and delegate political authority to supervise local crisis learning with reasonable compliance.

1. Introduction

Reducing workplace accidents is crucial for overall sustainability, especially major accidents that are not conducive to a safe and healthy working environment, and they can stymie local governments’ sustainable development [1]. For example, accidents can have a negative impact on environmental sustainability, such as spills and pollution accidents causing significant damage to the natural environment [2,3], and lead to energy sustainability and security issues [4]. The important relationship between accident prevention and sustainable development can also be seen in the 2030 Sustainable Development Goals (SDGs); Sub-Target 3.9, for example, aims to “…significantly reduce the number of deaths and illnesses caused by hazardous chemicals, air, water, and soil pollution and contamination” by 2030, and Target 8.8 aims to “…protect labor rights and promote safe and secure working environments” by 2030 [5,6]. Despite the international commitment to occupational safety and health, work-related accidents and diseases are still too prevalent. Therefore, all countries and local governments focus on reducing major safety accidents [7,8,9]. In the case of China, on the one hand, work safety accidents have been effectively curtailed [10], with a 58.6% decline in the number of work safety accidents and an 86.6% fall in the number of deaths nationally in 2020 compared to 2015. On the other hand, the likelihood of major accidents fluctuating and rebounding in particular locations and sectors continues to climb [11], and the “same quality and homogeneity” of accidents is evident, with comparable accidents, lessons, and mistakes recurring as frequently as in the country, such as The Jilin Petrochemical Double Benzene Plant Explosion and The Songhua River Water Pollution Accident in 2005 as well as The Shanxi Changzhi Benzene Leakage and The Turbid Zhang River Water Pollution Accident in 2012.
Crisis learning is seen as an important tool to curb the occurrence of major accidents [12,13,14]. While accidents bring unavoidable loss of life and property, they may also trigger crisis learning processes of local governments, making the occurrence of major accidents a catalyst for governmental change, social transformation, and guiding change towards desired goals [15,16], such as the Sustainable Development Goals (SDGs), disaster risk reduction, and increasing resilience [17]. The essence of crisis learning is that local governments learn from lessons and experiences through comprehensive investigations of safety incidents. Each crisis is followed by reflection and lessons learned, which should be based on recognizing the heterogeneous characteristics of various crises and the distillation of commonalities for crisis prevention and response. Some research has focused on how local governments learn from major accidents in their jurisdictions, that is, local government of crisis learning at the vertical level [18,19], but less attention has been paid to the crisis learning process from major accidents in non-jurisdictions, i.e., crisis learning by horizontal comparison among local governments [20].
Thus, this study addresses two specific questions: (i) Can there be a spatial spillover effect on the crisis learning of local governments in major accidents? I.e., can local governments of non-accident areas conduct effective crisis learning to avoid similar accidents in the region? (ii) What factors influence the spatial spillover effect on the crisis learning of local governments from major accidents? To respond to our research questions, we tested the model presented in Figure 1 and examined our model on panel data from 2006–2017 for 30 provinces in China. Therefore, this article aims to remedy the spatial spillover effect, which has been relatively neglected in previous crisis learning research, and to discuss the crisis learning relationship among local governments in the context of major accidents.
This article adds several contributions to the literature: First, it clarifies local crisis learning effects and mechanisms from a spatial perspective, which not only complements the public-sector observation perspective for developing organizational learning theory but also provides a new growth point for cross-sectional research of emergencies. Second, it empirically examines the crisis learning effects of local governments in major accidents with objective quantitative data, complementing and improving the quantitative evidence of crisis learning research. Third, this study seeks to provide evidence that extends the literature on multi-level organizational learning, moving from learning within public organizations to learning among public organizations.
The rest of the paper comprises five sections: Section 2 reviews relevant research on the crisis learning of local governments. Section 3 illuminates the theoretical background and research hypotheses based on existing research. Section 4 describes the sample data, variable definitions, and identification strategies associated with the research design. Section 5 presents the empirical results as well as robustness tests. Section 6 provides conclusions, limitations, and prospects for future research.

2. Literature Review

A government that is unable to reflect on and adjust after a crisis is not learning well [21]. Crisis learning is the expansion and enhancement of organizational learning theory in modern crisis management research. Crisis learning refers to an organization learning from one or more crisis events and changing its organizational structure or corresponding policy evolution to cope with future disasters and crises [22,23,24,25]. After a crisis, organizations will go through a defensive phase, an open learning phase, and an amnesic phase [26]. As we enter the new global crisis era, with the frequent outbreaks of major emergent crisis events worldwide, especially those represented by COVID-19, and the challenges to public values, the theory and practice of how to conduct crisis learning in the public sector have been deepening and expanding, and crisis learning has once again become the focus of discussion in the field of emergency management and public management [27].
Existing crisis learning research can be summarized in three basic areas: The first is research that examines the relationship between crisis and learning. Learning is the act of acquiring experience and knowledge through reading, observation, and practice to promote continuous changes in individual skills, methods, emotions, and values. Moreover, crises create important external conditions and learning environments for learning; Smith and Elliott (2007) earlier proposed three types of relationships: learning for crisis, learning as crisis, and learning from crisis [28]. The first type of relationship emphasizes the ability to react rather than prevent when a crisis strikes; the second type of relationship, which has attracted less academic attention and discussion, emphasizes that the learning outcomes present significant challenges to the organization’s core philosophy and the vision of senior managers, which can easily lead to secondary crises within the organization; the third type of relationship is one of the most interesting perspectives in crisis learning: organizations learn from their crisis incidents, shape them into specific prevention norms, and enhance organizational resilience [29].
The second area is represented by a focus on process research for crisis learning. Such research expects to shed light on how effective crisis learning processes are constructed through a systematic microscopic description in public organizations [30]. Different scholars have divided the whole process of crisis learning into different stages, including three stages [31], four stages [32], six stages [33], and so on. Basically, it can be summarized as starting from three types of perspectives. One is the cognitive-behavioral perspective, which emphasizes the process of crisis learning from experiential cognition to behavioral transformation, the core of which lies in the formation of experiential cognition from the accident to further change the organization’s mode of thinking and optimize the cognitive structure within the organization [34]. The second is the perspective based on social interaction, where crisis learning is a process from individual reflection to collective reflection [35] and is carried out in interactions between individuals, organizations, and the environment [36,37]. The third is the perspective of information processing or knowledge management, also the most common and accepted perspective of crisis learning process; scholars believe that the cognitive ability of an organization is expressed in its acquisition, application, and development of knowledge, and crisis learning is an effective way to enhance the cognitive ability of an organization [38]. Emphasis is on learning from information systems events, including learning from past experiences, learning lessons for future events (reflective learning model), and the increasingly noted learning through engagement with current events (embedded learning model) [39].
The third area of crisis learning research explores the influencing factors. Learning from disasters is not always a straightforward process [40]. It focuses on the influence of two main perspectives on crisis learning: cultural and structural. The cultural factor is built on the organizational community, whose common attitudes, informal procedures, and rules are essential for crisis learning, leading to organizational culture change [41,42]. In contrast to the cultural perspective, the structural perspective places more emphasis on exploring the role of the organizational structure and function in crisis learning [43], discusses mostly the impact of factors such as formal organizational standards, system control, and power distribution [44], and argues that the cultural perspective underestimates the important role of formal procedures, for example, in facilitating the learning process. Of course, these factors can not only drive the crisis learning process but also hinder it [45,46].
Research in crisis learning is emerging [47,48,49,50], and relevant prior research has provided an important foundation for this study. Still, there is room for further expansion as follows: First, from a methodological perspective, most of the existing crisis learning research is based on discursive induction and case-based deduction [51,52], with case descriptions, textual analysis, and empirical summaries, thus lacking a concrete understanding of positivism. Second, the research perspective gradually extends from intra-organizational to inter-organizational learning [53,54]. Sustainable development is a long-term goal for the survival of organizations, which requires that they can learn effectively from the experiences of other organizations in crises, forming a virtuous learning path for similar crises. However, the focus and depth of the relevant research need to be improved. Existing research has focused on learning from crises within the organization [55,56], although some scholars have begun to call for a shift to inter-organizational crisis learning [57] and have emphasized the importance of “learning from the experience of the accident” instead of “learning from the accident of a single organization” [58]. Thirdly, crisis learning is essentially the process of acquiring, transferring, and assimilating crisis knowledge with knowledge demand attributes, and the diffusion and spillover of knowledge, especially crisis knowledge [59], are its important characteristics.
To this end, this study focuses on the crisis learning effect of local governments from major accidents. It uses quantitative data to explore the crisis learning effect and spatial spillover of local government based on practical work on safety production accidents in China, and further elucidates the relationship between the two in terms of post-disaster political factors, to provide a reference for crisis learning research.

3. Theoretical Background and Research Hypothesis

3.1. Theoretical Background

When a major accident occurs in China, the government will conduct crisis learning based on three processes: Firstly, there is a stage of accident inquiry, accountability, and release. The government conducts a graded and classified accident investigation into the unexpected accident. It sets up an investigation team to identify the accident, its causes, casualties, and direct economic losses. It then determines the nature and responsibility of the accident, holds the relevant units and responsible personnel accountable, and puts forward proposals to strengthen and improve the work to form the accident investigation report for release. Secondly, government and enterprise will initiate a self-correction, special supervision, major inspection, and rectification phase. An accident investigation report is released at the same time. Major accidents especially will trigger local functional departments and industries to carry out self-examination and self-correction. If specific areas of accident problems and hidden dangers are prominent, it may be appropriate to start special rectification or even to carry out nationwide major rectification and inspection. Finally, such campaign-style inspection transforms afterwards into regular text production, policy improvements, and even legislative changes. The main focus is on rectifying and adapting inappropriate policies based on what was learned from major accidents, leading to a new round of policy text production and, in very few cases, direct or indirect legislative change.

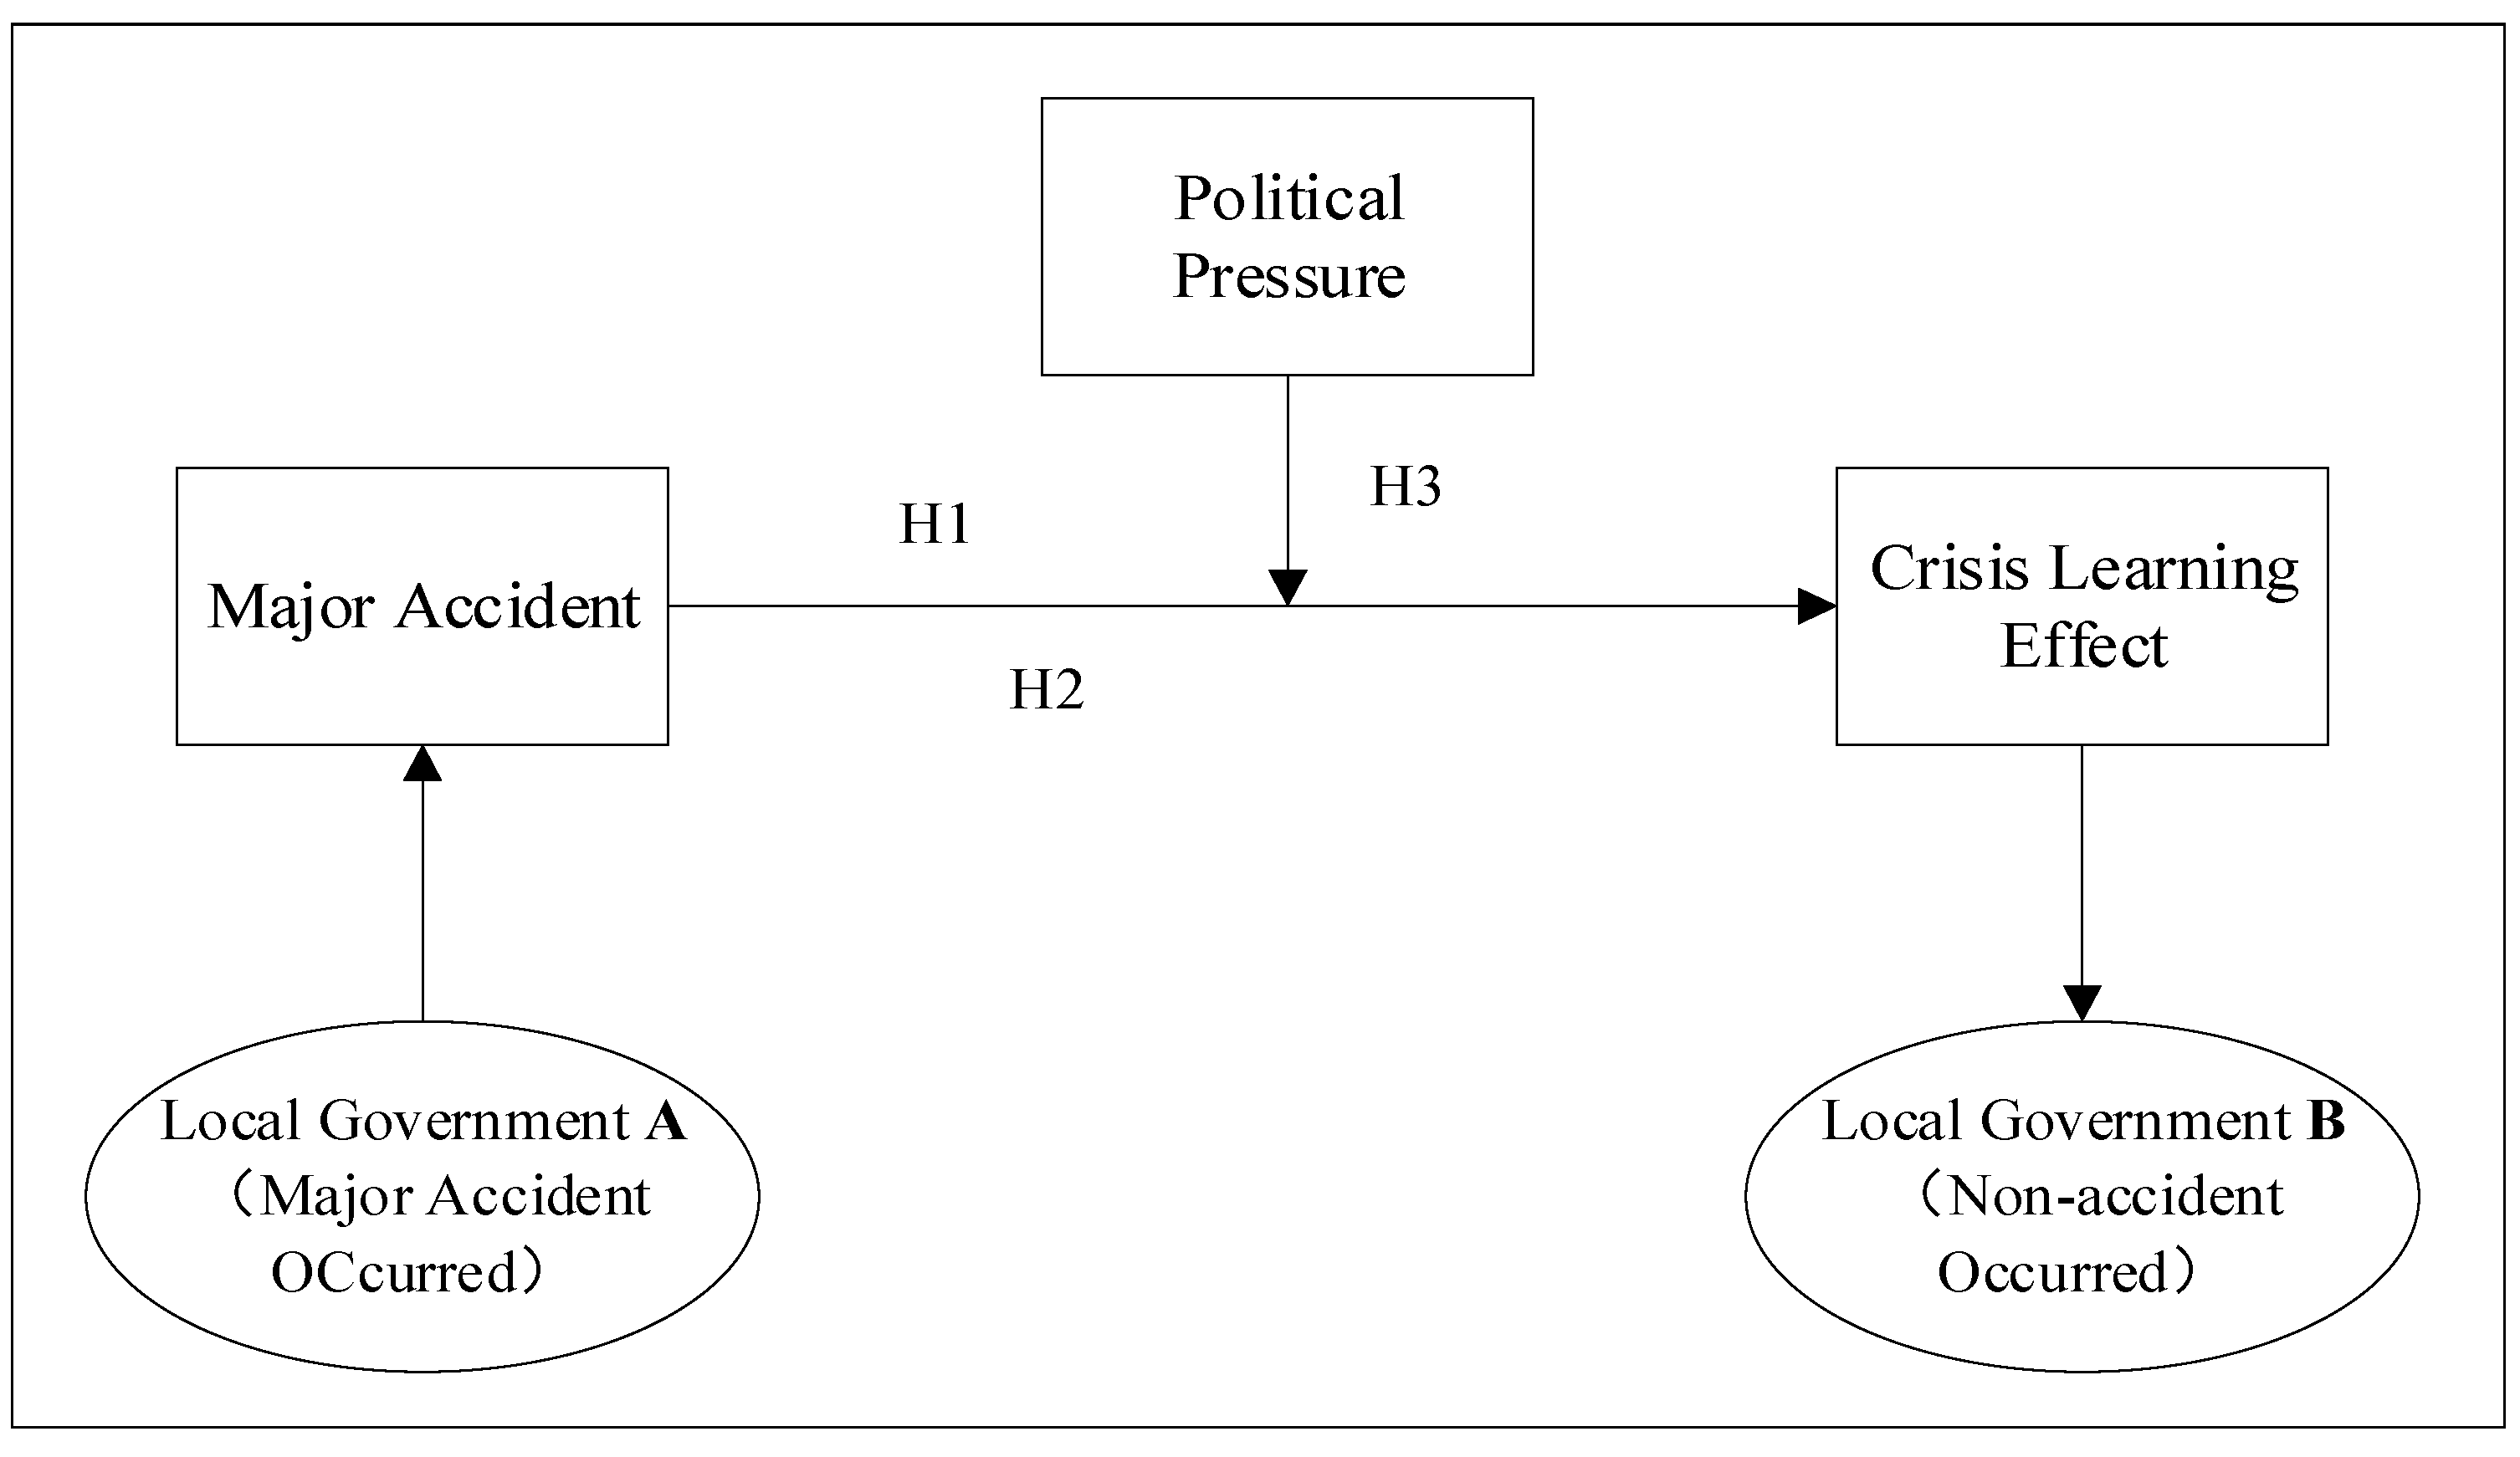
3.2. Research Hypothesis

3.2.1. Major Accidents and the Crisis Learning Effects of Local Governments

The occurrence of major accidents, while causing considerable losses of life and property safety, also creates a crisis learning field. The main steps in crisis learning are detailed investigation and accountability, industry inspection and remediation, and policy improvement and change. At the site of the accident, a recent accident will inevitably lead to active crisis learning, but the local government will also initiate crisis learning elsewhere for rational human reasons. Firstly, from the perspective of future scientific crisis decision-making and risk avoidance, learning is an important channel for rational people to gain knowledge and information; they can better understand situations and make judgments due to crisis learning. Especially in the current period of prominent risk stock and rising cumulative risk, there is uncertainty risk in all industries and better accident learning options at less cost by effectively learning from the lessons of major accidents elsewhere. Secondly, based on the external institutional environment, on the one hand, with the rapid pace of urbanization and the continual development of urban size, the causes or scope of the impact of accidents and disasters that have had a limited impact initially began to cross spatial and administrative borders, resulting in “cross-border crises” [60]. The emergency response and management of such accidents is a complex adaptive system that can only maximize collective performance if multiple actors collaborate [61], stimulating inter-regional integrated accident learning by non-incident local governments. On the other hand, there is “competition for the yardstick” between local governments [62], and it is a clear strategic competition between their own and neighboring jurisdictions in the assessment of safety management performance, which indirectly shapes the incentive to learn from accidents in non-accident areas.
In conclusion, the local government where the accident occurred will take the initiative to learn from the accident and spread it to its neighboring areas, pushing other non-accident areas to start learning from the accident. Accordingly, Hypothesis 1 is proposed.
Hypothesis 1 (H1).
There is a spatial spillover effect of crisis learning by local governments in major accidents.
What is the specific relationship between major accidents and crisis learning effects? This article tentatively argues that the relationship between major accidents and crisis learning effects of local government is not simple and linear. On the one hand, when the frequency of major accidents is low, a crisis learning process of “learning from neighbors” and “growing in wisdom” among local governments is established. The local government will immediately set up a special investigation team to investigate the cause of the specific production safety accident, summarize the lessons learned from the accident, interpret the accident investigation report in detail, and spread it to other regions [63]. After that, local governments will carry out categorized and graded accident learning and regulation, strengthening the leadership responsibility of local officials, the supervisory responsibility of safety supervision departments, and the main responsibility of the enterprises concerned by binding responsibility to bear [64], as well as supervising and inspecting high-risk areas of industry that may be exposed to accidents and carrying out in-depth investigations of safety hazards and other actions. At this stage, local governments mainly engage in crisis learning through precise and spontaneous safety regulations for specific accidents, and this “regulation effect” [65] leads to a crisis learning effect. On the other hand, when major accidents are frequent and high, the recurrence of similar accidents in similar industries or the repeated occurrence of major accidents in the same province at this stage are indicative of weaknesses in the local government’s production safety governance and of poorer crisis learning effects, which, in addition to triggering self-correction and self-investigation by various functional departments and industries, may also trigger cross-regional inspections and remediation directly led by higher authorities. The learning and reflection are campaign-like and policy-oriented and will become even more severe when the “deterrent effect” is triggered by a mandatory and high political stance and combined with departmental accountability [66]. As can be seen, crisis learning induced by the “deterrent effect” can lead to poor crisis learning and even worsen the crisis learning effect, to the detriment of improving the level of intrinsic safety.
In summary, it can be tentatively assumed that there is no simple and linear relationship between major accidents and the crisis learning effect of local government. When the frequency of major accidents is low, the crisis learning effect of local government mainly comes from the “regulatory effect,” while when major accidents are frequent, the “regulation effect” is squeezed out or even replaced by the “deterrent effect” of the external environment, such as pressure from higher levels, resulting in major accidents and a worsening of the crisis learning effect of local government. Accordingly, Hypothesis 2 is proposed.
Hypothesis 2 (H2).
There is a non-linear relationship between major accidents and the crisis learning effect of local government.

3.2.2. The Moderating Effect of Political Pressure

Political pressure is an important factor in the non-linear relationship between major accidents and the crisis learning effects of local governments. Specifically, the occurrence of major accidents is situated in a specific political arena, and the post-disaster political environment, which is composed of multiple streams of forces such as focal events, public opinion, and stakeholder groups, constructs the causal chain of the accident and the direction of learning for public organizations [67,68]. How political factors influence the crisis learning effect depends on the specific characteristics of political involvement. Political pressure can impede the integrity of organizational learning, but some researchers argue that organizational crisis learning in the public sector under political pressure emerges as a more complex relationship [69]. It can be seen that organizational learning is often indirectly interfered with by post-disaster political factors, but the specific role of disaster political factors in the process of organizational crisis learning is debated.
In the case of the political environment in China, the political attributes of high pressure can solidify information restrictions and control constraints in the crisis learning of local government [48,70]. This is reflected in two aspects: First, the steep increase in political pressure limits the processing of information for the crisis learning of local government. For example, compared to the accident investigation mechanism in developed countries, China’s inflexible investigation timeframe constrains the depth of investigation reports to a certain extent, which is not conducive to crisis learning [21]. Second, the high-pressure political station reinforces the accountability rather than the learning orientation of local governments. In the context of campaign-style supervision, the crisis learning of local government is characterized by an emergency and episodic nature, and the learning style of issuing instructions from higher levels and passive implementation by lower levels inhibits the dynamic role of learning, which also indirectly shifts the motivation of accident learning from a “regulatory effect” to a “deterrent effect”. In order to reach the goal of accident supervision and oversight quickly and in the short term, local governments engage in inefficient, stimulus-response-style crisis learning [71].
However, it has also been shown that political pressure leads to great institutional and conceptual changes, generating post-disaster, organizational double-loop learning [72]. Especially in our post-disaster political environment, leadership directives and policy texts [73] are transmitted to create a synergy of learning in public organizations. As can be seen, the political pressure increases the uncertainty of local crisis learning with respect to major accidents and influences the direction, scope, and intensity of learning in public organizations. Specifically, political pressure may influence the non-linear relationship between the frequency of major accidents and the crisis learning effect of local government. Accordingly, Hypothesis 3 is proposed.
Hypothesis 3 (H3).
Political pressure moderates the relationship between the frequency of major accidents and the crisis learning effect of local government.

4. Research Design

4.1. Sample Selection and Data Sources

This article uses panel data from 2006–2017 for 30 provinces in China, with a total of 360 observations for “year-province.” Data on the death rate of 100 million yuan of GDP in safety accidents and the number of safety accident death were obtained from the China Work Safety Yearbook, Provincial Emergency Management Departments, and the Statistical Bulletin of National Economic and Social Development. The frequency of major accidents and the number of fatalities in major accidents were obtained from the China Stock Market and Accounting Research (CSMAR) database, the policy document variables were obtained from North University Fabulous, and the data of other variables were obtained from the China Statistical Yearbook. All data are publicly available official data with high reliability.

4.2. Variable Definitions

The dependent variables. From “learn from the mistakes of neighbors”, that is, through cross-regional and cross-sectoral knowledge acquisition, knowledge transfer, and knowledge assimilation, the final crisis learning effect is reflected in the increase and update of crisis knowledge at all levels of government, i.e., “grow in wisdom.” On the one hand, the “wisdom” is reflected in the strengthening of governmental safety supervision and the standardization of the work production safety of enterprises. On the other hand, the conceptual or cultural level is the implicit change in the culture and awareness of production safety. The aim is to eliminate the potential for accidents, solve problems at the root, and ultimately reduce accidents in production safety. From this perspective, this article measures the effect of crisis learning in terms of the relative concept of the death rate of safety accidents, as similar studies have applied the same rate for computing the accident rate [74,75,76], while the absolute concept of the number of safety accident deaths is used for robustness testing. It is worth noting that no accidents have occurred in some provinces, resulting in the independent variable taking a value of zero. Meanwhile, we refer to previous studies and add 0.01 to the model before taking the logarithm, which did not affect the final results [62].
The independent variables. Considering the suddenness and severity of major accidents, in general, if a region has a number of major accidents in a row, it will highly focus the attention of the local government, and even the central government, and will initiate the crisis learning of local government. In this article, the frequency of major accidents is measured by the number of major accidents that occur in a region in a year, and the higher the frequency of major accidents, the more likely it is that crisis learning will be initiated. Robustness tests are also conducted using the number of fatalities in major accidents.
Moderating variables. In order to explore what role political factors play in the crisis learning process after accidents, the political pressure variable was introduced and was measured by the number of policy documents in the field of safety production, including laws and regulations, departmental regulations, and local normative documents. Such policy documents directly carry the top-down political will and are authoritative and compulsory. The greater the policy density, to some extent, the greater the local political pressure [77]. Specifically, the number of policy documents in the field of production safety is characterized by the use of North University Fabulous to limit local regulations and topics to be counted.
Control variables. To reduce the influence of other omitted variables, this article adds provincial-level variables that may affect the effects of crisis learning, mainly including the level of economic development, fiscal revenue, fiscal expenditure, industrial structure, fixed asset investment, per capita wage, technical equipment rate, and public safety expenditure. Variable definition and data source of the main variables are summarized in Table 1.

4.3. Identification Strategies

To test Hypothesis 1, we consider whether there is spatial autocorrelation in the crisis learning and apply the Moran Index to test the global spatial autocorrelation. To ensure the robustness of the results, this article uses the geographic adjacency matrix, the geographic distance matrix, and the economic geography matrix as the spatial weight matrix. Specifically, in the geographic adjacency matrix (denoted as W1), the corresponding element in the weight matrix takes 1 if two regions are adjacent; if two regions are not adjacent, 0. In the geographic distance matrix (denoted as W2), the geographic distance weight is expressed as the inverse of the distance between provincial capitals. The calculation method of the economic geography matrix (denoted as W3) is W 3 = W 1 D i j , where W1 is the traditional geographic adjacency matrix. The formula for D i j is
If   i j ,   D i j = 1 | X i ¯ Y i ¯ | ;   if   i = j ,   D i j = 0 ,   where   X ¯ i = 1 12 2006 2017 X i t
where X i t is the economic variable for i province in period t, i.e., the real per capita income level.
Table 2 shows the results of the Global Moran’s I index measure of crisis learning effects in 2017. The Global Moran’s I index of the local crisis learning effect is significantly positive based on the geographic proximity matrix (W1), geographic distance matrix (W2), and economic geography matrix (W3). This indicates that the spatial distribution pattern of the crisis learning effect of local government does not exhibit a random distribution, but rather a strong spatial clustering; i.e., areas that are geographically adjacent, geographically close, and economically geographically similar exhibit significant spatial clustering characteristics. Therefore, the spatial correlation that exists between regions should not be ignored when discussing the crisis learning effects of local government.
To test Hypothesis 2, a spatial panel model is considered to control for spatial correlation by including all lagged terms in the model. As a standard starting point for spatial econometric models, the spatial Durbin model is a standard framework for capturing various types of spatial spillovers, and it can be transformed into a common spatial lag and spatial error models under different coefficient settings, thus making it more general [78,79]. Therefore, this article mainly adopts the spatial Durbin model to carry out empirical tests and constructs the following model:
Y r a t e i t = α 0 + ρ 1 1 n w i j Y r a t e i t + α 1 L n M a j o r n u m i t + α 2 S L n M a j o r n u m i t +   ρ 2 1 n w i j L n M a j o r n u m i t + δ X i t + γ 1 n w i j X i t + u i t + ε i t
In Equation (2), i denotes the province, and t denotes the year. Y r a t e i t denotes the death rate of safety accidents to measure the crisis learning effect of local government, and L n M a j o r n u m i t denotes the frequency of major accidents. Based on the theoretical hypothesis of the frequency of major accidents and local crisis learning effects, a quadratic term of the frequency of major accidents is introduced into the model ( S L n M a j o r n u m i t ) to test for a possible non-linear relationship between the two. W i j   represents three types of spatial weight matrices (geographic proximity matrix W3, geographic distance matrix W2, and economic distance matrix W3) used to describe the spatial proximity relationship between regions, ρ and γ denote the spatial lag coefficients of each of the main explanatory and control variables, α represents the coefficients to be estimated, u denotes the regional fixed effects, and ε denotes the random disturbance term.
To test Hypothesis 3, this article adopts the theoretical model of the validated moderating effect proposed by Wen et al. [80] and further develops empirical evidence based on spatial econometric techniques by testing the model as follows:
Y r a t e i t = α 0 + ρ 1 1 n w i j Y r a t e i t + α 1 L n M a j o r n u m i t + α 2 S L n M a j o r n u m i t + ρ 2 1 n w i j L n M a j o r n u m i t + α 3 L n p u r e L n M a j o r n u m i t + α 4 L n p u r e S L n M a j o r n u m i t + δ X i t + γ 1 n w i j X i t + u i t + ε i t
In Equation (3), α 3 L n p u r e L n M a j o r n u m i t denotes the interaction term between the primary term of the frequency of major accidents and the crisis learning effect of local government, α 4 L n p u r e S L n M a j o r n u m i t represents the interaction term between the quadratic term of the frequency of major accidents and the crisis learning effect of local government, and the rest is the same as in Equation (2).

5. Results

5.1. Descriptive Statistics

Table 3 summarizes the results of descriptive statistics for all variables involved in the empirical model.

5.2. Major Accidents and Crisis Learning Effect of Local Government

To examine the robustness of the adopted models, this article reports non-spatial OLS, non-spatial plain panel, and spatial Durbin models. Moreover, when the regression analysis is restricted to specific individuals and the data sample is a full sample of 30 Chinese provinces, this article mainly uses fixed effects models to control for the province and year of the observed variables.
As can be seen in Table 4, the spatial lag term of the region’s accident mortality rate based on the three types of spatial weight matrix is significantly positive at the 1% level, indicating a significant spatial effect of the death rate of safety accidents. Either spatial distance indicates a positive effect of the neighboring region’s accident mortality rate on the region’s accident mortality rate, initially confirming that the crisis learning effect of local government has a spatial spillover effect. Hypothesis 1 is confirmed.
Drawing on the three-step method [81,82] to test U-curve relationships in this article, we conducted three steps. In the first step, both the primary and secondary terms of the frequency of major accidents in Model 3 and 4 are significantly positive at the 10% level, satisfying the first condition. In the second step, the slope of the two endpoints of the U-curve is required to be significantly steeper. The slope of the curve is negative when LnMajornum takes the minimum value and positive when LnMajornum takes the maximum value. Since this article focuses on the curve relationship between the frequency of major accidents and the crisis learning effect of local government, the control variables do not affect the shape of the curve relationship. The analysis of the curve shape can be simplified by finding the first-order derivative of the independent variable, which is the slope of the curve (due to space limitations and the fact that the derivation process is not the focus of the text, only the results of the established formulae are used to make a determination, with reference to the literature mentioned above for the specific derivation process). According to the descriptive statistics results in Table 3 and the regression results of Model 4, the calculation of the formula R = α 1 + 2 α 2 L n M a j o r n u m i t yields a slope of the curve for the independent variable taking a minimum value (Rmin) of −0.0186 and a slope of the curve for the independent variable taking a maximum value (Rmax) of 0.0321, which satisfies the second condition. The third step requires the inflection point to be located within the range of values of the independent variable, and the inflection point in this article is −1.94 by taking the first-order partial derivative of the regression equation and making it zero. In summary, there is a significant U-shaped curve relationship between the frequency of major accidents and the crisis learning effect of local government. With the frequency of major accidents, major accidents first have a dampening effect on the local accident mortality rate and then turn to a worsening effect, implying that the crisis learning effect of local governments changes from a positive to a negative effect. Hypothesis 2 is confirmed.
We attempt to provide here an explanation of the U-shaped effect of crisis learning based on practice in China. Firstly, when very few major accidents occur, the crisis learning of local government is based on a gradual regulation and learning approach and is focused on specific problems through supervision and supervision, and investigations into hidden dangers in specific fields and industries involved in accidents increase. However, when the stock of risks is prominent, and the risks are incrementally rising, especially when accidents in similar industries and fields are continuous and frequent, cumulative learning occurs after the accident due to the superposition of multiple accidents. Local governments in this case prefer to adopt deterrent learning, regardless of the existence of local enterprises in violation of the law, and this involves “all shut down”, “first stop and say”, and other learning methods (for example, after the “3.21” chemical plant explosion in Yancheng City, Jiangsu Province, the city decided to close down the chemical park in Ringshui. At the same time, Jiangsu Province proposed to reduce the number of chemical enterprises to 1000 by 2022). However, such deterrent learning tends to weaken the process of learning lessons and summarizing experiences of major accidents; instead, the real lessons are not learned, and accident learning is a formality. This is reflected in two ways that hinder local crisis learning: First, crisis learning induced by the deterrent effect not only fails to achieve safe development but may also become a constraint on economic development, with a higher death rate of safety accidents, despite a decline in the total number of accidents in production safety. Second, such deterrence-induced crisis learning is costlier and, from enterprises to local governments, tends to be more inefficient and superficial, even creating a situation where government and enterprises collude, which has been shown to lead to more accidents and further worsen the crisis learning effect of major accidents.

5.3. Robustness Check

To ensure the reliability of the above results, this article further employs three approaches for robustness testing: First, the core independent variables are replaced. Considering the singularity of measuring by the number of major accidents, this was replaced by the number of fatalities in major accidents to measure the crisis learning effect of local government. Second, the dependent variables were replaced. The crisis learning effect of local government is reflected not only in the decline in accident fatality rates as a relative indicator, but also as an absolute indicator [83]. This article replaces the death rate of safety accidents by the number of safety accident deaths, so as to measure the absolute crisis learning effect of local government. Thirdly, the measures were re-chosen and further tested with a spatial error model (Model 8) and a spatial autoregressive model (Model 9), taking into account the applicability of the spatial Durbin model. The results in Table 5 show, after various robustness analyses, a U-shaped relationship between the frequency of major accidents and the crisis learning effect of local government, which still supports the core findings of the previous section.

5.4. Moderating Effect of Political Pressure

Table 6 shows the moderating effect of political pressure on the frequency of major accidents and the crisis learning effect of local government. The estimation results show that the primary and secondary terms of the frequency of major accidents are significantly positive, while these terms are significantly negative after adding the interaction term, indicating that political pressure moderates the U-shaped relationship between the frequency of major accidents and the local crisis learning effect. Hypothesis 3 is initially confirmed.
So how do the effects of political pressure manifest themselves? Based on existing research [84,85], the effect of political pressure on the U-shaped curve is analyzed in terms of the shape of the curve (flat or steep) and the movement of the inflection point (left or right). First, regarding the impact of political pressure on the U-shaped curve, as can be seen from the derivation of the formula, the impact of the moderating variables on the apex of the U-shaped curve is mainly expressed in the positive and negative coefficients of the quadratic and interaction terms of the independent variables (due to space limitations and the fact that the derivation process is not the focus of this article, only the results of the formula are used to make a determination, referring to the literature above for the specific formula derivation process). If the coefficient is significantly positive, the curve shape is relatively flat; conversely, the curve shape is relatively steep. In the regression results of Model 12–14 in Table 6, the coefficients of the interaction term between political pressure and the quadratic term of the frequency of major accidents are significantly positive, indicating that the higher the political pressure, the flatter the U-shaped curve relationship between the frequency of major accidents and the crisis learning effect. Second, regarding the effect of political pressure on the movement of the inflection point, according to the derivation of the equation (in line with the previous section, the specific formula derivation process is not discussed here, and the effect of the moderating variable on the inflection point of the curve is determined by α_1 α_4-α_2 α_3), the skewed values are all less than zero, indicating that the inflection point of the U-shaped curve between the frequency of major accidents and the crisis learning effect of local government shifts to the left when political pressure increases.
It can be seen that the U-shaped relationship between the two becomes flatter as political pressure increases. When the frequency of major accidents is low, increased political pressure reduces the dampening effect of major accidents on regional accident mortality. When major accidents are frequent, increased political pressure reduces the worsening effect of major accidents on regional accident mortality. At the same time, increased political pressure can force local governments to shift from a regulatory effect to a deterrent effect in advance, even when faced with a lower frequency of accidents, in a way that is not conducive to virtuous crisis learning.
Figure 2 is further drawn to demonstrate the moderating effect of political pressure on the frequency of major accidents and the crisis learning effect of local government. Figure 2 clearly illustrates the findings of a U-shaped relationship between the two, which is explained by the fact that major accidents may contribute to both regulatory and deterrent effects, each having an opposite effect on local crisis learning effects. The regulation effect shapes a precise, progressive, and benign crisis learning process and effect, effectively reducing accident fatalities; the deterrence effect, however, presents a mandatory inappropriate crisis learning approach, which in turn increases accident fatalities and worsens accident crisis learning effects. This ultimately leads to a non-linear relationship between major accidents and the crisis learning effect of local government.
At the same time, political factors, with political pressure at their core, play a dual role in shaping a multidimensional local learning orientation by regulating the U-shaped relationship between the two. On the one hand, political pressure weakens the effect of benign local crisis learning in situations where the frequency of major accidents is low, to the detriment of sustaining long-term local learning. This is mainly due to the fact that, as political pressure increases, crisis issues are rapidly politicized [86], and the intensity of the accumulated political pressure hinders local learning [87]. In scenarios of high political pressure, crisis learning is motivated by the deterrent effect of major accidents, forcing a shift from gradual, lesson-learning-based crisis learning to movement-based learning. Meanwhile, political pressures shape complex crisis learning scenarios, with interest groups in major accidents often ignoring systemic failures to find individuals to blame, thus adopting solutions that cater to political pressures rather than evidence-based scientific solutions [88]. This approach greatly reduces the potential value of an otherwise valuable experience. In addition, political pressure drives a U-shaped inflection point to the left, which means that, even in the context of less frequent major accidents, a sudden increase in political pressure drives the perceived political risk and accountability risk of local governments to the fore, inducing a shift from a regulatory to a deterrent effect, leading to adverse crisis learning effects. However, when major accidents are highly frequent, increased political pressure can weaken the dampening effect of major accidents on local crisis learning effects. This means that political pressure plays an effective role in controlling and guiding the crisis learning process at the local level, and that the intervention of political authority regulates and corrects the adverse crisis learning effects induced by the deterrent effect at the local level.

6. Conclusions

Although sustainable development is more concerned with environmental issues [89], according to the official UN definition, “human beings are at the center of concern for sustainable development. They are entitled to a healthy and productive life in harmony with nature …” [90]. Sustainable development is not only green, but is also concerned with human sustainability [91]. In contrast to the ecological and economic development dimensions of sustainability, the social dimension of sustainability, especially safety, is often neglected [92]. Still, it is often an important basis for realizing other dimensions. Therefore, this paper focuses on accidents and safety under the topic of sustainability. While accidents undermine safe and healthy work environments, they also open a window of policy opportunity for safe and sustainable transformation through crisis learning. On the one hand, more lessons can be generated and learned from accidents with severe consequences (e.g., major accidents) than from similar accidents with limited consequences (e.g., attempted accidents) [93], and it is also more likely that crisis knowledge will be available for sustainable development. On the other hand, crisis learning research is still deficient regarding the learning process at the local level [20]. Local governments can learn through plans and policies, coordination and networks, and the knowledge of local leaders for emergency preparedness [94,95]; this also means that the important role played by local governments in the crisis learning process cannot be ignored.
Therefore, this paper focuses on the crisis learning process of local governments in major accidents and explores how better to achieve the sustainability of public safety with learning mechanisms. Specifically, this article examines the crisis learning effect of local governments from spatial effects. Based on provincial panel data from 2006–2017 in China, we conduct a systematic and robust empirical test of the proposed hypotheses. Our findings demonstrate firstly that, after a major accident, local governments in the place of occurrence take the initiative to learn from the crisis and at the same time spread their knowledge to neighboring regions, promoting other, non-accident places to start learning from the crisis, creating a spatial spillover effect of the local crisis learning effect. As we discussed earlier, this provides solid evidence for shifting from organizational learning to inter-organizational learning [53,54]. In particular, the crisis learning effect between governments (of the non-accident site and the accident site) is confirmed. Secondly, there is a U-shaped relationship between the frequency of major accidents and the crisis learning effect of local government. When the frequency of major accidents is low, the regulatory effect triggered by major accidents leads to effective crisis learning for local governments. Still, when major accidents are frequent and reach a certain threshold, the crisis learning effect is worsened by the excessive deterrent effect. Thirdly, higher political pressure weakens the relationship between major accidents and the crisis learning effect of local government by both smoothing out the U-shaped curve and shifting the inflection point to the left. Political pressure plays a dual role in the crisis learning effect of local government, which is consistent with the findings of previous studies on the multidirectional nature of factors influencing crisis learning [45,46]. This article builds on the former by providing specific pathways and mechanisms of influence.
Our findings have many policy implications and help in solving the dilemma of crisis learning failure among local governments and building a long-term crisis learning mechanism. First, this article’s findings show a significant spatial spillover effect on the crisis learning effect of local governments, implying that, to conduct crisis learning effectively, local governments must construct a collaborative learning mechanism between regions. A collaborative system of regional accident learning can be explored, and a “large system” of information sharing on major accidents can be established for emergency management needs. Second, in the face of cross-regional crisis learning with regard to major accidents, local governments should focus on effective regulatory effects to initiate crisis learning. They should fully seize the time window of the regulatory effect of the major accident, use precise and progressive safety regulations and crisis learning, and establish a comprehensive safety accident learning information system that links up and down and is consistent with the left and right. Third, this article shows that appropriate political status and authority can highlight the effects of crisis learning through regulatory effects, but excessive political power is not conducive to crisis learning. Therefore, crisis learning must not simply rely on top-down political authority but also on behavioral compliance and appropriate pressure. It is important to clarify and implement the basis and norms for political accountability in major accidents.
However, there are certain limitations to this study. First, due to data availability, the measurement of the crisis learning effect of local governments in this article needs to be further tested. Second, this article is based on provincial panel data in China, and whether there is still a spatial spillover effect on the crisis learning of municipal and even grassroots governments need to be tested. Third, this article mainly explores the crisis learning of local governments at the macro-quantitative level, and the specific patterns and details of the crisis learning process need to be explored.
Future research could also focus on a few specific areas. On the one hand, the spillover effect of local government crisis learning could be explored by expanding the sample data and variables, e.g., at a broader level (grassroots government), and the impact of other factors on crisis learning, such as variables other than political factors, could also be investigated. Additionally, the crisis learning process of local governments should be depicted in conjunction with case research to validate and complement the quantitative research on crisis learning.

Author Contributions

Conceptualization, Y.T. and Y.W.; Data curation, Y.T.; Validation, Y.W.; Writing—original draft, Y.T.; Writing—review and editing, Y.W. All authors have read and agreed to the published version of the manuscript.

Funding

This research received no external funding.

Institutional Review Board Statement

Not applicable.

Informed Consent Statement

Not applicable.

Data Availability Statement

Not applicable.

Conflicts of Interest

The authors declare no conflict of interest.

References

  1. Burgos-Garcia, A. Mainstreaming occupational safety and health into education: Good practice in school and vocational education. Int. J. Interdiscip. Soc. Sci. Annu. Rev. 2007, 2, 29–36. [Google Scholar] [CrossRef]
  2. Ryley, T.; Burchell, J.; Davison, L. Valuing air transportation and sustainability from a public perspective: Evidence from the United Kingdom and the United States. Res. Transp. Bus. Manag. 2013, 7, 114–119. [Google Scholar] [CrossRef] [Green Version]
  3. Hardcopf, R.; Shah, R.; Dhanorkar, S. The impact of a spill or pollution accident on firm environmental activity: An empirical investigation. Prod. Oper. Manag. 2021, 30, 2467–2491. [Google Scholar] [CrossRef]
  4. Burgherr, P.; Hirschberg, S. Comparative risk assessment of severe accidents in the energy sector. Energy Policy 2014, 74, S45–S56. [Google Scholar] [CrossRef]
  5. Mouneer, T.A. Sustainable Development Importance in Higher Education for Occupational Health and Safety Using Egypt Vision 2030 under COVID-19 Pandemic. J. Geosci. Environ. Prot. 2021, 9, 74. [Google Scholar] [CrossRef]
  6. ILO. Safety and Health at the Heart of the Future of Work; ILO: Geneva, Switzerland, 2019. [Google Scholar]
  7. Lu, L.; Li, W.; Mead, J.; Xu, J. Managing major accident risk from a temporal and spatial perspective: A historical exploration of workplace accident risk in China. Saf. Sci. 2020, 121, 71–82. [Google Scholar] [CrossRef]
  8. Zhen, X.; Vinnem, J.E.; Han, Y.; Peng, C.; Huang, Y. Development and prospects of major accident indicators in the offshore petroleum sector. Process Saf. Environ. Prot. 2022, 160, 551–562. [Google Scholar] [CrossRef]
  9. Baek, H.; Kim, D.H.; Jeon, Y. A Study on Disclosure Items of Safety and Health Management System for Major Injury Prevention. Korean Crisis Manag. Monogr. 2022, 18, 29–40. [Google Scholar]
  10. Jiao, Y.; Li, X.; Liu, Q.; Kong, M.; Chen, Y.; Wang, X.; Chen, W. Analysis of the characteristics of major accidents and particularly serious accidents from 2005 to 2019 in China. J. Saf. Environ. 2021, 21, 2875–2882. [Google Scholar]
  11. Chen, C.; Reniers, G. Chemical industry in China: The current status, safety problems, and pathways for future sustainable development. Saf. Sci. 2020, 128, 104741. [Google Scholar] [CrossRef]
  12. Meyer, V., Jr.; e Cunha, M.P.; Mamédio, D.F.; Nogueira, D.P. Crisis management in high-reliability organizations: Lessons from Brazilian air disasters. Disaster Prev. Manag. Int. J. 2020, 30, 209–224. [Google Scholar] [CrossRef]
  13. Eriksson, P.; Hallberg, N. Crisis management as a learning system: Understanding the dynamics of adaptation and transformation in-between crises. Saf. Sci. 2022, 151, 105735. [Google Scholar] [CrossRef]
  14. Hoelscher, K.; Geirbo, H.C.; Harboe, L.; Petersen, S.A. What Can We Learn from Urban Crisis? Sustainability 2022, 14, 898. [Google Scholar] [CrossRef]
  15. Birkmann, J.; Buckle, P.; Jaeger, J.; Pelling, M.; Setiadi, N.; Garschagen, M.; Fernando, N.; Kropp, J. Extreme events and disasters: A window of opportunity for change? Analysis of organizational, institutional and political changes, formal and informal responses after mega-disasters. Nat. Hazards 2010, 55, 637–655. [Google Scholar] [CrossRef]
  16. Pelling, M.; Dill, K. Disaster politics: Tipping points for change in the adaptation of sociopolitical regimes. Prog. Hum. Geogr. 2010, 34, 21–37. [Google Scholar] [CrossRef]
  17. Solecki, W. Hurricane Sandy in New York, extreme climate events and the urbanization of climate change: Perspectives in the context of sub-Saharan African cities. Curr. Opin. Environ. Sustain. 2015, 13, 88–94. [Google Scholar] [CrossRef]
  18. Haunschild, P.R.; Sullivan, B.N. Learning from complexity: Effects of prior accidents and incidents on airlines’ learning. Adm. Sci. Q. 2002, 47, 609–643. [Google Scholar] [CrossRef] [Green Version]
  19. Haunschild, P.R.; Rhee, M. The role of volition in organizational learning: The case of automotive product recalls. Manag. Sci. 2004, 50, 1545–1560. [Google Scholar] [CrossRef]
  20. Betten, T.; Pettersen, K.V.; Albrechtsen, E. Learning in municipalities after disasters. Disaster Prev. Manag. Int. J. 2021, 30, 400–411. [Google Scholar] [CrossRef]
  21. Ma, B.C.; Haiman. The dilemma of crisis learning: An analysis based on the investigation report of a particularly serious accident. Public Adm. Rev. 2017, 2, 118–139. [Google Scholar]
  22. Labib, A.; Read, M. Not just rearranging the deckchairs on the Titanic: Learning from failures through Risk and Reliability Analysis. Saf. Sci. 2013, 51, 397–413. [Google Scholar] [CrossRef]
  23. Faulkner, B. Towards a framework for tourism disaster management. Tour. Manag. 2001, 22, 135–147. [Google Scholar] [CrossRef]
  24. Sylves, R.T. Disaster Policy and Politics: Emergency Management and Homeland Security; CQ Press: Washington, DC, USA, 2019. [Google Scholar]
  25. Farazmand, A. Learning from the Katrina crisis: A global and international perspective with implications for future crisis management. Public Adm. Rev. 2007, 67, 149–159. [Google Scholar] [CrossRef]
  26. Kovoor-Misra, S.; Nathan, M. Timing is everything: The optimal time to learn from crises. Rev. Bus. 2000, 21, 31. [Google Scholar]
  27. Hart, P. After Fukushima: Reflections on risk and institutional learning in an era of mega-crises. Public Adm. 2013, 91, 101–113. [Google Scholar] [CrossRef]
  28. Smith, D.; Elliott, D. Exploring the barriers to learning from crisis: Organizational learning and crisis. Manag. Learn. 2007, 38, 519–538. [Google Scholar] [CrossRef]
  29. Hur, J.-Y.; Kim, K. Crisis learning and flattening the curve: South Korea’s rapid and massive diagnosis of the COVID-19 infection. Am. Rev. Public Adm. 2020, 50, 606–613. [Google Scholar] [CrossRef]
  30. Broekema, W.; Porth, J.; Steen, T.; Torenvlied, R. Public leaders’ organizational learning orientations in the wake of a crisis and the role of public service motivation. Saf. Sci. 2019, 113, 200–209. [Google Scholar] [CrossRef]
  31. Smith, D. Beyond contingency planning: Towards a model of crisis management. Ind. Crisis Q. 1990, 4, 263–275. [Google Scholar] [CrossRef]
  32. Fink, S.; American Management Association. Crisis Management: Planning for the Inevitable; Amacom: New York, NY, USA, 1986. [Google Scholar]
  33. Buchanan, D.A.; Denyer, D. Researching tomorrow’s crisis: Methodological innovations and wider implications. Int. J. Manag. Rev. 2013, 15, 205–224. [Google Scholar] [CrossRef]
  34. Lee, S.; Hwang, C.; Moon, M.J. Policy learning and crisis policy-making: Quadruple-loop learning and COVID-19 responses in South Korea. Policy Soc. 2020, 39, 363–381. [Google Scholar] [CrossRef] [PubMed]
  35. Coetzee, C.; Van Niekerk, D.; Raju, E. Disaster resilience and complex adaptive systems theory: Finding common grounds for risk reduction. Disaster Prev. Manag. 2016, 25, 196–211. [Google Scholar] [CrossRef]
  36. Simmons, C. Crisis Management & Organizational Learning: How Organizations Learn from Natural Disasters. 2009. Available online: https://ssrn.com/abstract=1351069 (accessed on 10 April 2020).
  37. Sommer, M.; Njå, O. Dominant Learning Processes in Emergency Response Organizations: A Case Study of a J oint R escue C oordination C entre. J. Contingencies Crisis Manag. 2012, 20, 219–230. [Google Scholar] [CrossRef]
  38. Dekker, S.; Hansén, D. Learning under pressure: The effects of politicization on organizational learning in public bureaucracies. J. Public Adm. Res. Theory 2004, 14, 211–230. [Google Scholar] [CrossRef]
  39. Mehrizi, M.H.R.; Nicolini, D.; Mòdol, J.R. How do organizations learn from information system incidents? A synthesis of the past, present, and future. MIS Q. 2022, 46, 531–590. [Google Scholar] [CrossRef]
  40. Le Coze, J.C. What have we learned about learning from accidents? Post-disasters reflections. Saf. Sci. 2013, 51, 441–453. [Google Scholar] [CrossRef]
  41. Turner, B.A. The organizational and interorganizational development of disasters. Adm. Sci. Q. 1976, 21, 378–397. [Google Scholar] [CrossRef]
  42. Nathan, M.L.; Kovoor-Misra, S. No pain, yet gain: Vicarious organizational learning from crises in an inter-organizational field. J. Appl. Behav. Sci. 2002, 38, 245–266. [Google Scholar] [CrossRef]
  43. Deverell, E. Crisis-Induced Learning in Public Sector Organizations; Försvarshögskolan (FHS): Stockholm, Sweden, 2010. [Google Scholar]
  44. Renå, H.; Christensen, J. Learning from crisis: The role of enquiry commissions. J. Contingencies Crisis Manag. 2020, 28, 41–49. [Google Scholar] [CrossRef]
  45. Staupe-Delgado, R.; Kruke, B.I.; Ross, R.J.; Glantz, M.H. Preparedness for slow-onset environmental disasters: Drawing lessons from three decades of El Niño impacts. Sustain. Dev. 2018, 26, 553–563. [Google Scholar] [CrossRef]
  46. Broekema, W.; Van Kleef, D.; Steen, T. What factors drive organizational learning from crisis? Insights from the Dutch food safety services’ response to four veterinary crises. J. Contingencies Crisis Manag. 2017, 25, 326–340. [Google Scholar] [CrossRef]
  47. Müller-Seitz, G.; Macpherson, A. Learning during crisis as a ‘war for meaning’: The case of the German Escherichia coli outbreak in 2011. Manag. Learn. 2014, 45, 593–608. [Google Scholar] [CrossRef]
  48. Nava, L. Rise from ashes: A dynamic framework of organizational learning and resilience in disaster response. Bus. Soc. Rev. 2022, 127, 299–318. [Google Scholar] [CrossRef]
  49. Vu, M.C.; Nguyen, L.A. Mindful unlearning in unprecedented times: Implications for management and organizations. Manag. Learn. 2021, 13505076211060433. [Google Scholar] [CrossRef]
  50. Lee, S.; Yeo, J.; Na, C. Learning before and during the COVID-19 outbreak: A comparative analysis of crisis learning in South Korea and the US. Int. Rev. Public Adm. 2020, 25, 243–260. [Google Scholar] [CrossRef]
  51. Steen, R.; Rønningsbakk, B. Emergent learning during crisis: A case study of the arctic circle border crossing at Storskog in Norway. Risk Hazards Crisis Public Policy 2021, 12, 158–180. [Google Scholar] [CrossRef]
  52. Toubes, D.R.; Araújo-Vila, N.; Fraiz-Brea, J.A. Organizational Learning Capacity and Sustainability Challenges in Times of Crisis: A Study on Tourism SMEs in Galicia (Spain). Sustainability 2021, 13, 11764. [Google Scholar] [CrossRef]
  53. Iftikhar, R.; Ahola, T.; Butt, A. Learning from interorganizational projects. Int. J. Manag. Proj. Bus. 2021, 15, 102–120. [Google Scholar] [CrossRef]
  54. Brix, J. Innovation capacity building: An approach to maintaining balance between exploration and exploitation in organizational learning. Learn. Organ. 2018, 26, 12–26. [Google Scholar] [CrossRef] [Green Version]
  55. Mainga, W. Examining project learning, project management competencies, and project efficiency in project-based firms (PBFs). Int. J. Manag. Proj. Bus. 2017, 10, 454–504. [Google Scholar] [CrossRef]
  56. Brady, T.; Davies, A. Building project capabilities: From exploratory to exploitative learning. Organ. Stud. 2004, 25, 1601–1621. [Google Scholar] [CrossRef]
  57. Williams, T. How do organizations learn lessons from projects—And do they? IEEE Trans. Eng. Manag. 2008, 55, 248–266. [Google Scholar] [CrossRef]
  58. Lundberg, J.; Rollenhagen, C.; Hollnagel, E. What-You-Look-For-Is-What-You-Find–The consequences of underlying accident models in eight accident investigation manuals. Saf. Sci. 2009, 47, 1297–1311. [Google Scholar] [CrossRef] [Green Version]
  59. Goncalves Filho, A.P.; Ferreira, A.M.S.; Ramos, M.F.; Pinto, A.R.A.P. Are we learning from disasters? Examining investigation reports from National government bodies. Saf. Sci. 2021, 140, 105327. [Google Scholar] [CrossRef]
  60. De Genova, N. Viral Borders: Migration, Deceleration, and the Re-Bordering of Mobility during the COVID-19 Pandemic. Commun. Cult. Crit. 2022, 15, 139–156. [Google Scholar] [CrossRef]
  61. Zhang, H. Cross-regional synergy in emergency management. J. Nanjing Univ. (Philos. Humanit.Soc. Sci.) 2021, 1, 102–110, 161. [Google Scholar]
  62. Shi, X.; Xi, T. Race to safety: Political competition, neighborhood effects, and coal mine deaths in China. J. Dev. Econ. 2018, 131, 79–95. [Google Scholar] [CrossRef]
  63. Lyu, Q.; Fu, G. Improvement of cause analysis in accident investigation reports—A perspective of enterprise accident cases learning. J. Saf. Sci. Technol. 2021, 17, 172–178. [Google Scholar]
  64. Guo, Q.; Zhou, P.; Zhou, M. Research on the Legal Responsibility Bearing Mechanism of Urban Risk Governance in China Reflections on the12·20Special Landslide Accident in Guangming New Area of Shenzhen. J. Catastrophol. 2018, 33, 152–155. [Google Scholar]
  65. Gao, Y.; Fan, Y.; Wang, J. Assessing the safety regulatory process of compliance-based paradigm in China using a signalling game model. Saf. Sci. 2020, 126, 104678. [Google Scholar] [CrossRef]
  66. Kovras, I.; Kutlay, M. The EU’s truth by omission: Learning and accountability after the Eurozone crisis. Br. J. Politics Int. Relat. 2022, 24, 187–204. [Google Scholar] [CrossRef]
  67. Raška, P.; Dostál, P. Evolution of disaster relief law under multiple transformations: Progressive learning or walking in a circle? Environ. Sci. Policy 2017, 76, 124–130. [Google Scholar] [CrossRef]
  68. Follert, F.; Gleißner, W.; Möst, D. What Can Politics Learn from Management Decisions? A Case Study of Germany’s Exit from Nuclear Energy after Fukushima. Energies 2021, 14, 3730. [Google Scholar] [CrossRef]
  69. Rerup, C.; Zbaracki, M.J. The politics of learning from rare events. Organ. Sci. 2021, 32, 1391–1414. [Google Scholar] [CrossRef]
  70. Deverell, E.; Olsson, E.-K. Learning from crisis: A framework of management, learning and implementation in response to crises. J. Homel. Secur. Emerg. Manag. 2009, 6, 19–42. [Google Scholar] [CrossRef]
  71. Yang, X.; Krul, K.; Sims, D. Uncovering coal mining accident coverups: An alternative perspective on China’s new safety narrative. Saf. Sci. 2022, 148, 105637. [Google Scholar] [CrossRef]
  72. Peng, T. Disaster appropriation and learning evolution mechanism of public organizations: An example of safety production management system. Public Adm. Rev. 2016, 9, 39–54, 183. [Google Scholar]
  73. Hu, X.; Naim, K.; Jia, S.; Zhengwei, Z. Disaster policy and emergency management reforms in China: From Wenchuan earthquake to Jiuzhaigou earthquake. Int. J. Disaster Risk Reduct. 2021, 52, 101964. [Google Scholar] [CrossRef]
  74. Kim, E.; Rhee, M. Learning from Alliance Membership: An Empirical Study of Learning from the Failure of Their Alliance Members, Liability and Environmentally Sustainable Airline. Sustainability 2021, 13, 11794. [Google Scholar] [CrossRef]
  75. Jia, J.; Liang, X.; Ma, G. Political hierarchy and regional economic development: Evidence from a spatial discontinuity in China. J. Public Econ. 2021, 194, 104352. [Google Scholar] [CrossRef]
  76. Kim, E.; Rhee, M. How airlines learn from airline accidents: An empirical study of how attributed errors and performance feedback affect learning from failure. J. Air Transp. Manag. 2017, 58, 135–143. [Google Scholar] [CrossRef]
  77. Wang Rongjuan, W.J. What makes the environmental protection interview system effective?—A qualitative comparative analysis of fuzzy sets based on 29 cases. China Popul. Resour. Environ. 2019, 29, 103–111. [Google Scholar]
  78. Elhorst, J.P. Applied spatial econometrics: Raising the bar. Spat. Econ. Anal. 2010, 5, 9–28. [Google Scholar] [CrossRef]
  79. Xiusheng, T.X.Z. The problem of identifying spatial externalities. Stat. Res. 2013, 30, 94–100. [Google Scholar]
  80. Wen, Z.; Hou, T.; Zhang, L. Comparison and application of moderating and mediating effects. J. Psychol. 2005, 2, 268–274. [Google Scholar]
  81. Lind, J.T.; Mehlum, H. With or without U? The appropriate test for a U-shaped relationship. Oxf. Bull. Econ. Stat. 2010, 72, 109–118. [Google Scholar] [CrossRef] [Green Version]
  82. Musaji, S.; Schulze, W.S.; De Castro, J.O. How long does it take to get to the learning curve? Acad. Manag. J. 2020, 63, 205–223. [Google Scholar] [CrossRef]
  83. Wang, F.-F.; Deng, W.-J.; Cheng, H.; Gao, Q.; Deng, Z.-W.; Deng, H.-C. The Impact of Local Economic Growth Target Setting on the Quality of Public Occupational Health: Evidence From Provincial and City Government Work Reports in China. Front. Public Health 2021, 9, 769672. [Google Scholar] [CrossRef]
  84. Haans, R.F.; Pieters, C.; He, Z.L. Thinking about U: Theorizing and testing U-and inverted U-shaped relationships in strategy research. Strateg. Manag. J. 2016, 37, 1177–1195. [Google Scholar] [CrossRef]
  85. Simonsohn, U. Two lines: A valid alternative to the invalid testing of U-shaped relationships with quadratic regressions. Adv. Methods Pract. Psychol. Sci. 2018, 1, 538–555. [Google Scholar] [CrossRef] [Green Version]
  86. Harrowell, E.; Özerdem, A. The politics of the post-conflict and post-disaster nexus in Nepal. Confl. Secur. Dev. 2018, 18, 181–205. [Google Scholar] [CrossRef]
  87. Tao, P.; Chen, C. Towards a politics of disaster response: Presidential disaster instructions in China, 1998–2012. Disasters 2018, 42, 275–293. [Google Scholar] [CrossRef] [PubMed]
  88. Wenxuan, Y. Sudden crisis events and organizational learning: Insights from Singapore’s response strategy to the New Crown Pneumonia outbreak. Urban Gov. Res. 2020, 5, 74–75, 76–96. [Google Scholar]
  89. Garetti, M.; Taisch, M. Sustainable manufacturing: Trends and research challenges. Prod. Plan. Control. 2012, 23, 83–104. [Google Scholar] [CrossRef]
  90. UNCED. Report of the United Nations Conference on Environment and Development. The Earth Summit. Available online: https://www.un.org/en/conferences/environment/rio1992 (accessed on 15 June 2022).
  91. Kavouras, S.; Mitoula, R. Urban development: Re-thinking city branding. The role of health and safety. Urban Inf. 2020, 289, 8–11. [Google Scholar]
  92. Kavouras, S.; Vardopoulos, I.; Mitoula, R.; Zorpas, A.; Kaldis, P. Occupational Health and Safety Scope Significance in Achieving Sustainability. Sustainability 2022, 14, 2424. [Google Scholar] [CrossRef]
  93. Homsma, G.J.; Van Dyck, C.; De Gilder, D.; Koopman, P.L.; Elfring, T. Learning from error: The influence of error incident characteristics. J. Bus. Res. 2009, 62, 115–122. [Google Scholar] [CrossRef]
  94. Avery, E.J.; Graham, M.; Park, S. Planning makes (closer to) perfect: Exploring United States’ local government officials’ evaluations of crisis management. J. Contingencies Crisis Manag. 2016, 24, 73–81. [Google Scholar] [CrossRef]
  95. Enander, A.; Hede, S.; Lajksjö, Ö. Why Worry? Motivation for Crisis Preparedness Work among Municipal Leaders in S weden. J. Contingencies Crisis Manag. 2015, 23, 1–10. [Google Scholar] [CrossRef]
Figure 1. Model of the spatial spillover effect of crisis learning by local governments.
Sustainability 14 07731 g001
Figure 2. The U-shaped relationship between major accidents and the crisis learning effect of local government.
Sustainability 14 07731 g002
Table 1. Variable codes.
VariablesNameSpecific CodesData Sources
Dependent VariablesCrisis Learning
Effect
YrateThe death rate of 100 million yuan of GDP of safety
Accidents
China Work Safety Yearbook, Provincial Emergency Management Departments, and the
Statistical Bulletin of National Economic and Social Development
LnYdeathLog (the number of safety accident death)
Independent VariablesFrequency of Major AccidentsLnMajornumLog (the number of major accidents)
If a major accident occurred before June, it is summarized in the number of major accidents in the current year; after June, it is summarized in the following year.
CSMAR Database
The Number of
Fatalities in Major Accidents
LnMajordeaLog (the number of fatalities in major accidents)
Moderating VariablesPolitical PressureLnpureLog (the number of policy documents in the field of production safety)North University Fabulous
Control VariablesLevel of Economic DevelopmentLnpgdpLog (per capita GDP)China Statistical Yearbook
Financial RevenueLnincLog (local fiscal revenue)
Financial ExpenditureLnexpLog (local financial expenditure)
Industrial StructureLninduLog (percentage of secondary industry)
Fixed InvestmentLnAssetLog (total social fixed asset investment in the mining sector)
Per Capita WageLnwageLog (the average wage of urban unit workers on duty)
Technical Equipment RateLnequLog (the technical equipment rate of enterprises in the construction industry)
Public Safety ExpenditureLnsafetyLog (local financial public safety expenditure)
Table 2. Moran’s index of the crisis learning effect of local government, 2006–2017.
YearGeographical Adjacency Matrix (W1)Geographical Distance Matrix (W2)Economic Geography Matrix (W3)
20060.479 ***0.319 ***0.260 ***
20070.482 ***0.314 ***0.281 ***
20080.488 ***0.301 ***0.249 ***
20090.511 ***0.334 ***0.210 ***
20100.526 ***0.344 ***0.198 ***
20110.545 ***0.362 ***0.177 *
20120.536 ***0.354 ***0.158 *
20130.215 **0.301 ***0.073 *
20140.0640.107 *0.191 ***
20150.0030.030.116 *
20160.182 *0.177 **0.148 **
20170.125 *0.190 **0.098 *
Note: * indicates p < 0.1, ** indicates p < 0.05, *** indicates p < 0.01.
Table 3. Descriptive statistics of variables.
VariableObsMeanSDMinMax
Yrate3600.22630.21520.00001.2274
LnYdeath3607.52140.76653.13599.1963
LnMajornum360−0.77142.5395−4.60522.6398
LnMajordea3601.15123.8075−4.60526.3457
Lnpure3603.74501.1409−4.60525.8750
Lnpgdp36010.44870.59128.749111.7675
Lninc3607.08871.00993.74369.3344
Lnexp3607.82370.79335.16229.6183
Lnindu3603.81760.21242.94504.0828
LnAsset3605.03571.6489−2.40797.4396
lnwage36010.62090.45529.654411.8130
Lnequ3609.33220.42086.590310.4600
Lnsafety3605.05400.74032.68997.1017
Table 4. Impact of frequency of major accidents on the effectiveness of local crisis learning.
VariablesNon-Spatial OLSNon-Spatial Plain Panel (FE)Space Durbin Model
Model 1Model 2Adjacency MatrixGeographical MatrixEconomic Matrix
Model 3Model 4Model 5
LnMajornum−0.0014 (0.0026)−0.0013 (0.0020)0.0101 *
(0.0049)
0.0136 *
(0.0053)
0.0093
(0.0056)
SLnMajornum0.0014 ***
(0.0003)
0.0011 ***
(0.0003)
0.0026 *
(0.0012)
0.0035 **
(0.0013)
0.0018
(0.0014)
Lnpgdp−0.1550 ***
(0.0196)
−0.395 ***
(0.0604)
−0.356 ***
(0.0482)
−0.350 ***
(0.0559)
−0.381 ***
(0.0543)
Lninc0.0158
(0.0231)
0.192 **
(0.0699)
0.144 **
(0.0535)
0.216 ***
(0.0587)
0.194 **
(0.064)
Lnexp−0.116 ***
(0.0286)
−0.450 ***
(0.0884)
−0.186 **
(0.0671)
−0.333 ***
(0.0784)
−0.272 ***
(0.0788)
Lnindu−0.0148
(0.0274)
0.0103
(0.0827)
−0.0367
(0.0609)
0.0394
(0.0746)
0.1
(0.0745)
LnAsset−0.0108 *
(0.0043)
−0.0004
(0.0081)
0.0123 *
(0.0062)
0.00626
(0.0068)
0.00891
(0.0072)
lnwage−0.104 ***
(0.025)
−0.173 *
(0.0816)
0.0308
(0.0495)
0.0154
(0.0697)
0.0519
(0.078)
Lnequ0.0498 ***
(0.0142)
0.0488 ***
(0.0156)
0.0168
0.0119)
0.0227
0.0134)
0.0423 **
0.0138)
Lnsafety0.0194 *
(0.0084)
0.0292
(0.0187)
0.0467 ***
(0.0136)
0.0562 ***
(0.0152)
0.0580 ***
(0.0147)
w.Yrate 0.619 ***
(0.0495)
0.445 ***
(0.0765)
0.254 **
(0.089)
w.LnMajornum −0.0167 *
(0.0084)
−0.0275 *
(0.0137)
0.0074 *
(0.0157)
Regional
Effect
NoneControlControlControlControl
Time EffectNoneControlControlControlControl
Log-L 511.5879488.1484480.8593
Note: Values in brackets are standard errors; * indicates p < 0.1, ** indicates p < 0.05, *** indicates p < 0.01; w.Yrate and w.LnMajornum denote the spatial lag term of the natural logarithm of the accident fatality rate and the frequency of major accidents for billion GDP, respectively; due to space constraints, the estimated results of the spatial lag term coefficients of each control variable in the spatial Durbin model are not reported in this article.
Table 5. Robustness tests.
VariablesSubstitution of Explanatory VariablesSubstitution of Explanatory VariablesReplacement Estimation Model
Model 6Model 7Model 8Model 9
LnMajornum 0.0182 ***
(0.0051)
0.0273 **
(0.0128)
0.0273
(0.0228)
SLnMajornum 0.0046 ***
(0.0013)
0.0074 ***
(0.0017)
0.0073 **
(0.0034)
LnMajordea−0.0004
(0.0011)
SLnMajordea0.0011 ***
(0.0002)
w.Yrate0.265 **
(0.0871)
0.231 **
(0.0891)
w.LnMajornum 0.0321
(0.0149)
w.LnMajordea−0.0056
(0.0028)
Control variablesControlControlControlControl
Regional effectsControlControlControlControl
Time effectControlControlControlControl
Log-L524.6133514.8987−29.4363−49.6805
Note: Values in brackets are standard errors; ** indicates p < 0.05, *** indicates p < 0.01; w.Yrate, w.LnMajornum, and w.LnMajordea denote the spatial lagged terms of the log of the accident mortality rate of billion GDP, the log of the frequency of major accidents, and the log of the fatalities in major accidents, respectively; limited to space, Model 8–9 only report regression results with a geographical proximity matrix.
Table 6. Moderating effects of political pressure.
VariablesNon-Spatial OLSNon-Spatial General Panel Model (FE)Space Durbin Model
Model 10Model 11Adjacency MatrixGeographical MatrixEconomic Matrix
Model 12Model 13Model 14
LnMajornum0.126 ***
(0.0215)
0.0928 ***
(0.0174)
0.0502 ***
(0.0144)
0.0740 ***
(0.0141)
0.0835 ***
(0.0147)
SLnMajornum0.0290 ***
(0.0057)
0.0204 ***
(0.0046)
0.0113 **
(0.004)
0.0164 ***
(0.0037)
0.0185 ***
(0.0038)
LnMajornum × Lnpure0.0074
(0.0077)
−0.0217 ***
(0.0046)
−0.0109 **
(0.0038)
−0.0155 ***
(0.0037)
−0.0204 ***
(0.0038)
SLnMajornum × Lnpure−0.0075 ***
(0.0015)
−0.0048 ***
(0.0012)
−0.0024 *
(0.0011)
−0.0034 ***
(0.001)
−0.0046 ***
(0.001)
Lnpure0.0074
(0.0077)
0.0116
(0.0067)
0.0071
(0.0067)
0.0049
(0.0056)
0.0141 *
(0.0056)
w. Yrate 0.369 ***
(0.0655)
0.244 **
(0.089)
−0.0121
(0.1024)
w.LnMajornum −0.0272
(0.0341)
−0.102
(0.053)
−0.0159
(0.0472)
w.SLnMajornum −0.0155
(0.0091)
−0.0317 *
(0.0131)
−0.00733
(0.0125)
w.Lnpure −0.0453 ***
(0.0134)
−0.0291
(0.016)
−0.0466 **
(0.0172)
Control variablesControlControlControlControlControl
Regional effectsNoneControlControlControlControl
Time effectNoneControlControlControlControl
Log-L 557.4930527.9089526.3293
Note: Values in parentheses are standard errors; * indicates p < 0.1, ** indicates p < 0.05, *** indicates p < 0.01; w.Yratio and w.Lnlargeaccident denote the spatially lagged term of the natural logarithm of the accident fatality rate and the frequency of major accidents in billion GDP, respectively.
Publisher’s Note: MDPI stays neutral with regard to jurisdictional claims in published maps and institutional affiliations.

