Abstract
During the urbanization process in Jeddah, evidenced by an annual population growth rate of 9.5%, vacant lots have existed in developed residential areas in spite of the housing shortage. This study aimed at investigating the housing shortage problem and suggesting future solutions based on a predictive formula through four tasks: (1) examining the issues induced by population growth; (2) assessing the extent to which articles in the Procedure Manual for Preparation of Residential Land Subdivision (PMPRLS) foster diversity within villa-type neighborhoods; (3) clarifying the extent of the applicability of these articles and the contribution of existing neighborhood patterns to the housing shortage problem; and (4) providing recommendations for developing each kind of villa-type neighborhood to contribute to resolving the housing shortage. The proposed development methods for villa-type neighborhoods were derived from a correlation analysis using PMPRLS-related indicators in all such neighborhoods (103 study sites) in Jeddah and from a predictive regression analysis. This study suggests that each neighborhood class can contribute to resolving the housing shortage problem. In conclusion, diversifying lot areas, population density, and lot widths in current villa-type neighborhoods would have a positive impact on the housing shortage problem.
1. Introduction
1.1. Research Background
The problem of housing shortages is a major issue that has spread globally as urbanization has accelerated since the Industrial Revolution. Over time, this issue has changed to encompass many aspects. In the 1980s, the housing problems in the major cities of Germany, which is now considered to be a developed country, were discussed [1]. Even during this period, the lack of social housing and the imbalance in housing supply due to disparities in poverty and wealth were seen as problems. These characteristics have also been cited as common issues in developing countries, which have urbanized in recent years due to population growth. Several studies have been undertaken in India related to the problem of housing shortages. In Delhi, Abhay [2], while presenting the number of houses built in the recent decade (2001–2011), pointed out that, although the housing supply is stimulated by the housing shortage problem, low-quality housing is widespread. Kumar [3] pointed out that the large number of obsolescent houses is a fundamental problem that leads to housing shortages. He suggested that important measures in solving the housing shortage problem are improving the quality of housing through taxation or incentive polices for vacant houses, and making these houses usable and selling them. That is, although the supply of housing is important, it should be incorporated with the supply of housing to ensure peoples’ quality of life.
In recent years, the problem of housing shortages in developed countries having relatively high urbanization has occurred at the regional level, rather than in entire countries, due to land prices and housing construction costs. The relatively high cost of housing is a major issue in Silicon Valley, USA, and Gabbe [4] examined whether administrative re-zoning planning would be effective. Tian [5] also summarized the relationship between land supply and land prices for four Chinese mega-cities, and pointed out that, even if rental housing is supplied, it does not contribute to addressing the housing shortage problem due to urban land monopolies. Thus, the circumstances regarding housing shortages differ from period to period and from country to country, and solutions must be considered in accordance with these differences.
A major difference regarding the housing supply in Jeddah is that the city has an Islamic culture. Sulf [6] proposed design requirements for housing in Saudi Arabia consistent with Islamic culture, in response to the worsening housing shortage due to population growth, in addition to low-cost housing for middle- and low-income people. Regarding housing development in Jeddah, it is necessary to closely examine how to solve the housing shortage problem associated with rapid population growth in terms of the formation of neighborhoods centered on mosques.
Hegazy [7] also evaluated urban development in Jeddah in terms of sustainable urban management. He criticized Jeddah’s lack of planning tools for managing the total urban planning system and controlling illegal development, and emphasized a more integrated development management system. In this regard, it is deemed timely and appropriate to address the housing supply issue based on Jeddah’s housing planning tool, the Procedure Manual for the Preparation of Residential Land Subdivision (PMPRLS). Mulliner [8] noted that Saudi Arabia is suffering from a housing shortage, and highlighted the gap between consumers’ preferences and practitioners’ preferences in the movement toward providing large quantities of housing on a shorter-term basis. This indicates the importance of diversity in housing attributes. Therefore, it is necessary to evaluate whether housing developed according to the PMPRLS in Jeddah would ensure a diversification of housing attributes.
1.2. Research Area
Jeddah, one of Saudi Arabia’s most traditional and rapidly growing cities, was founded as a fishing settlement 2500 years ago. From 1509 to 1947, Jeddah was walled. However, in 1947, the city wall was removed by the government because of the city’s rapid expansion, which can be attributed to two main factors. The first is population growth, fueled by immigration from across the country, and the second is the importance of the city location as a gate for the two holy cities, Makkah and Madinah. From 1947 to 1987, the annual population growth rate averaged 9.5% [9]. According to the strategic plan issued by the Jeddah Municipality in 2009, Jeddah’s population was estimated to grow by around 2.25 million people between 2007 and 2029 [9].
During the urbanization process that occurred between 1947 and 1980, unplanned settlements arose (Figure 1) because of the lack of adequate housing for low- and middle-income residents [9]. Subsequently, from 1992 to 2007, the increasing gravity of the housing shortage problem in Jeddah led to an increase in the number of houses occupied by two generations (couples living with their parents), which accounted for 80,000 families, and in the number of families (151,600) living in reclaimed houses in unplanned settlements [9]. As declared by Jeddah’s mayor in the strategic plan formulated in 2009, the city faces two main issues. The first is the need for new and adequate housing (approximately 283,000 housing units) to resolve the current housing shortage, and the second entails providing sufficient units to meet the projected housing demand between 2009 and 2029, which is approximately 670,000 units. Two-thirds of these units will be required for low- and middle-income residents. Therefore, in total, around 953,000 new units will be needed in Jeddah up to 2029 [9].
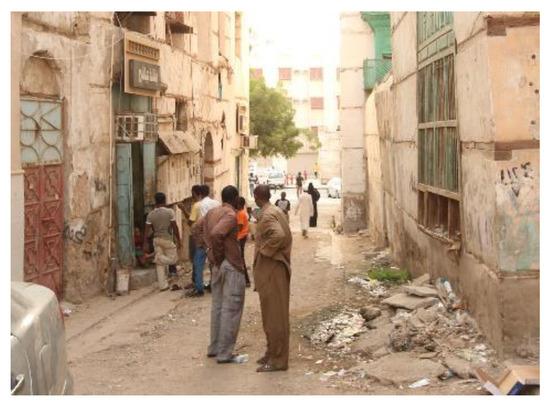
Figure 1.
Unplanned settlement (Source: authors).
In Saudi Arabia, typical sites are characteristically family-oriented detached houses, referred to as villa-type housing (Figure 2). This pattern is reflected in contemporary neighborhoods in Saudi Arabian cities, which are dominated by large numbers of villas as opposed to apartment buildings. For instance, in 2019, in the administrative area of Alqaseem, villas comprised approximately 57.32% of residential buildings. Moreover, in the capital Al-Riyadh, villas comprise approximately 45.71% of residential buildings. However, in Jeddah, villas comprise only around 17% of the residential buildings in the city. In contrast to other administrative areas in Saudi Arabia, in the Makkah area, apartments comprise 63.38% of the total housing units (Figure 3), accounting for the highest proportion of apartment units compared with those in other administrative areas in Saudi Arabia [10]. The population density of villa-type neighborhoods varies between 15 and 70 persons/hectare, according to structural plans formulated for Jeddah. However, the population density in neighborhoods where apartments are dominant varies between 15 and 200 persons/hectare [11] (Table 1). According to the Procedure Manual for Preparation of Residential Land Subdivision (PMPRLS) issued by the Ministry of Municipal and Rural Affair and Housing (MoMaRAaH), the minimum area of a land lot for a villa should be 300 m2 [12].
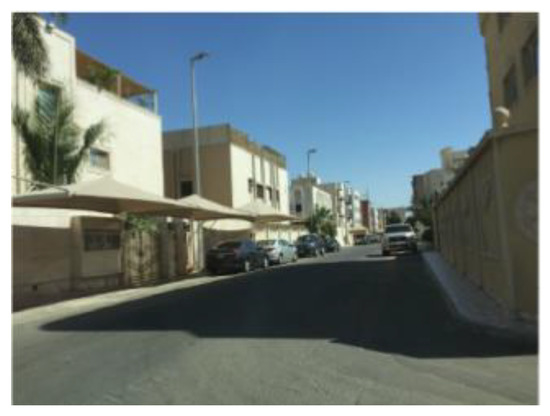
Figure 2.
Villa-type neighborhood (Source: authors).
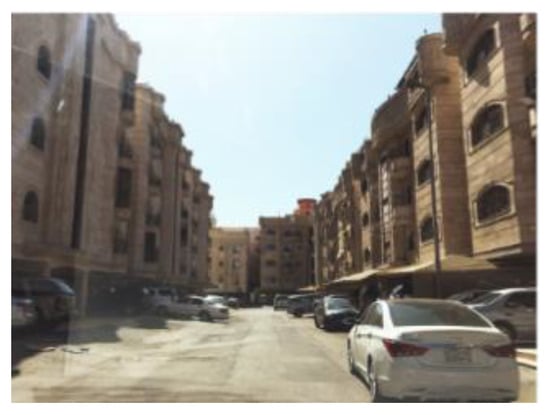
Figure 3.
Apartment-type neighborhood (Source: authors).

Table 1.
Population density characteristics for each type of residential area in each structural plan developed for Jeddah.
1.3. Research Objectives
The above discussion highlights several issues, namely the housing shortage, an increasing population trend, with low- and middle-income residents accounting for two-thirds of the projected housing demand, and the growing trend toward apartment building development and its relation to land lot areas in the city’s growth. Of these considerations, population density in villa-type neighborhoods and legislation on land adjustments are key. Thus, the specific objectives of this study are to identify the housing shortage problem and suggest future solutions based on a predictive formula. To be specific, the following four objectives were established:
- Identify solutions to issues relating to Jeddah’s population growth through a review and analysis of (a) the total housing shortage and projected demand, (b) factors responsible for the housing shortage problem, (c) the local government’s housing policy and strategy, and (d) the actual status of population density within each district in Jeddah (Section 2);
- Analyze articles of the PMPRLS and assess the extent to which they foster diversity in relation to land lot areas, total street length, numbers of villas, population density, and numbers of children’s playgrounds in villa-type neighborhoods (Section 3);
- Clarify the extent to which the articles in the PMPRLS are applicable to existing neighborhoods and the extent to which the patterns of contemporary neighborhoods can be seen as being part of the housing shortage problem (Section 4); and
- Determine the compositional characteristics of the 103 sites by dividing them into groups according to several indicators, which are discussed in the following section on research methods. A further aim was to propose methods of developing each group as an initiative toward resolving the housing shortage problem (Section 5).
1.4. Research Methods
To accomplish the above-mentioned objectives, data were collected from several competent authorities. The methodology was sequentially performed as discussed below.
1.4.1. Issues Relating to the Housing Shortage and Projected Demand
We collected data from the Jeddah Strategic Plan that was issued by the Jeddah Municipality in 2009 in the following areas: the characteristics of each structural plan formulated for Jeddah [11]; the population size from 1992 up to the projected population in 2029 [9]; the extent and types of housing shortages in the city [9]; the ratio of parks to population density in each district in Jeddah [9]; and data from the Jeddah Without Slums Program (JWSP) [9]. We also collected data on financing economics, housing policies [9], and the legal framework. These data were integrated to obtain a wide-angle view of the precise factors that have led to the problem of Jeddah’s housing shortage.
1.4.2. Planned Neighborhood Composition
We sought to formulate the composition of planned neighborhoods on the basis of several articles in the PMPRLS that was enacted by the MoMaRAaH. We analyzed the following main factors:
- The characteristics of elements of a neighborhood, such as the ratio of land use, streets, open spaces, and public land and how they have been combined together [12].
- As Saudi Arabia is an Islamic country where mosques are used five times a day, the mosques in several residential blocks are centrally located within a service area distance of 200 m, as noted in the PMPRLS. Therefore, we conceptualized the elements of a neighborhood by situating them within an area having a radius of 200 m from a centrally positioned mosque.
- We performed two verifications in the following cases: (1) where the total areas of streets (as shown in the PMPRLS) accounted for 20% of the total neighborhood area, and (2) when the minimum street width was 10 m (as shown in the PMPRLS). Subsequently, we determined how these conditions can affect the ratios of other elements, such as the total area of public facilities, the total street length, the number of villas, and population density.
1.4.3. Actual Conditions in Existing Villa-Type Planned Neighborhoods
The regulations of the PMPRLS were formulated considering mosques as the core structures located at the center of groups of residential blocks within catchment areas (service distances) with radiuses of 200 m. After a complete survey of mosques located in villa-type neighborhoods in Jeddah, all mosques, i.e., 103 sites, were identified. Several indicators of the areas surrounding each mosque (within a 200 m radius) were analyzed (Figure 4). Google Earth (Google Earth Version 7.1) and Jeddah AutoCAD (AutoCAD Version 20.0) File [13] were the primary sources used for this analysis to organize housing development characteristics and trends. Several elements were selected with reference to the PMPRLS and analyzed. The elements were spatially subdivided into private spaces (villas, commercial facilities, and office buildings) and public spaces (mosques, elementary schools, streets, and parks). An observational survey of Google Earth aerial photographs was used to determine the presence or absence of housing development and the size and shape of housing sites during an 8-year period from 2008 to 2016, in addition to the presence or absence of development of surrounding facilities and their characteristics. The observational survey was conducted in 2016, and the first year of aerial photography available at that time was 2008. Based on these, the following parameters were quantified.
In the case of private spaces, six parameters were analyzed: (1) numbers of villas in 2008 and 2016; (2) total areas of villas (average value, median value, minimum and maximum values, and the differences between them); (3) the minimum, maximum, and median values of the distance of the setbacks of existing villas and their proportions in relation to the lot length; (4) the number of villas facing 1, 2, 3, and 4 streets; (5) the average land value (per square meter in the Saudi Arabian Riyal (SAR)) [14]; and, finally, (6) the total area occupied by commercial facilities and office buildings.
Nine parameters were established for public space: (1) total street area; (2) total road length; (3) the road width (maximum and minimum values, the difference between them, and the median value); (4) the distance from a mosque to the nearest mosque; (5) the area of land occupied by a mosque; (6) the distance to the nearest elementary school; (7) the number of parks, and the distance to the nearest park and the park lot area; (8) the total area of the vacant lot; and (9) the total area for public facilities, and public parking.
In addition to the above-mentioned factors, two more factors were analyzed:
- The extent to which the PMPRLS is actually applied in villa-type neighborhoods in Jeddah;
- The extent to which existing villa-type neighborhoods can be part of the solution to the existing housing shortage if the same pattern of their development is maintained.
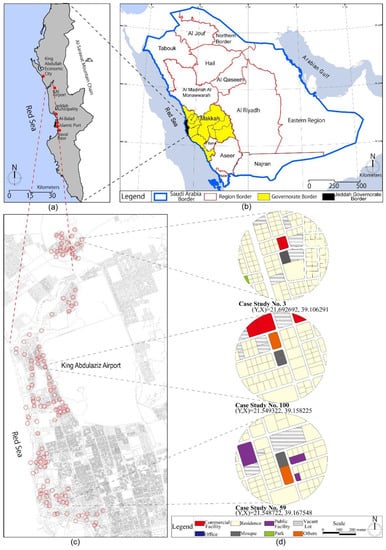
Figure 4.
(a) The boundary of the Jeddah governate and the main landmarks (adapted by Rahif Maddah). (b) The national, regional, and governate boundaries in Saudi Arabia (adapted by Rahif Maddah). (c) The locations of the 103 study sites in Jeddah, shown as red circles [13]. (d) A sample of the study sites, each having a radius of 200 m [13] (adapted by Rahif Maddah).
1.4.4. Typology of Existing Villa-Type Neighborhoods and Proposals
A correlation analysis was conducted to clarify dependent factors in associated neighborhoods and, subsequently, to predict how villa-type neighborhoods evolved during the period 2008–2016. This analysis was performed using the parameters described in Section 1.4.3 and the numerical values of parameters described in Section 4, and by conducting a predictive multiple regression analysis. Contemporary villa-type neighborhoods were subsequently grouped together, and strategies were proposed for each group (Section 5).
1.5. Previous Studies
Several studies have been previously conducted on residential areas in Jeddah at planning scales ranging from architectural to city scales. Abu-Ghazzeh [15] explained the principal values of the Islamic faith and their effect on the structural development at the architectural scale, including in the historical area of Jeddah (Al-Balad). Salama [16] reviewed affordable housing in the city. Attia [17] suggested that the traditional housing technology of Jeddah will be effective in providing guidelines for a sustainable society in the future, since the housing technology has been built on historical experience and is suitable for the conservative Islamic society, and the building materials are also adapted to the climate characteristics. Jambi [18] conducted an online survey to identify factors that influence housing purchases by buyers, noting the importance of the closeness of the property to family members and the infrastructure of the district. The significance of this study is the approach taken to address the issue of the housing shortage, by clarifying the characteristics of the traditional housing style, villa-type housing, and the intentions of housing buyers based on past development trends.
Maddah conducted studies at an urban design scale, for example, on the usage of open space [19] and spatial configurations between residential buildings [20]. A study to evaluate walkability in villa-type neighborhoods in Jeddah was conducted by applying the HPE Walkability Index developed by Hall Planning & Engineering Inc. [21]. Mousalli [22] examined residential locations at a city scale. Al-Otaibi [23] used the market-based approach to evaluate the housing shortage crisis, and Murad [24] focused on commercial areas. Notably, none of the above-mentioned studies applied a multidimensional perspective to explore the housing shortage crisis. Such a perspective can be applied, for example, to the transition of the areas and shapes of residential lots, and to the relationship between land price and public spaces such as streets, parks, and mosques.
2. Housing Policies and Issues in Jeddah
2.1. The Housing Shortage and Projected Demand
In 2009, the Municipality of Jeddah released a strategic plan that revealed problems relating to the housing shortage and projected demand in Jeddah. Figure 5 shows that Jeddah has been experiencing a severe housing shortage since 1992, with a total requirement of 231,600 units, each accommodating an average of four persons per household, needing to be made available by 2009. Moreover, population growth between 2007 and 2009 resulted in an additional deficit of 51,500 units. Furthermore, the projected housing demand during the period 2009–2029 evidences variations every half-decade. On average, 33,500 units are required annually up to 2029 (Figure 5). However, because of the lack of data, we were not able to confirm the occurrence of (a) the shortage in housing units (1992–2009) and (b) the projected demand during the period 2009–2021.
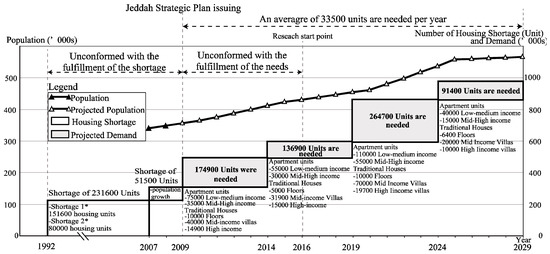
Figure 5.
Population growth in Jeddah, the total housing shortage, and the projected housing demand up to 2029 (* Refers to shortages mentioned in Figure 6).
2.2. The Housing Shortage Problem and Related Factors
Jeddah’s housing shortage is the outcome of a complex web of issues, encompassing the Jeddah without Slums Program (JWSP), in addition to problems relating to financing and economic hurdles, the master plan, the housing policy, and the legal framework, as depicted in Figure 6.
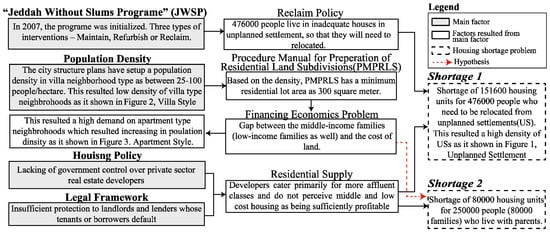

Figure 6.
Housing shortage problem and related factors.
- Jeddah without Slums Program (JWSP)
The JWSP program, which was established in 2007 by royal decree, is aimed at reclaiming unplanned settlements in the city. The results of a survey conducted by the Jeddah Municipality and released in 2007 indicated that there were three categories of buildings in unplanned settlements: those that need to be maintained, refurbished, or reclaimed. The Jeddah Municipality announced that 476,000 people (approximately 151,600 households) would need to be relocated from unplanned settlements because of dangerous housing conditions [9].
- 2.
- Population Density
Jeddah has grown during the implementation of five different master plans formulated during different periods by different planners, each of whom arrived at different population densities for the city’s neighborhoods (Table 1).
- 3.
- Housing Policy
The government lacks control over private sector real estate developers, but, in addition, the developers cater primarily to the more affluent classes and do not perceive middle and low-cost housing projects as being sufficiently profitable.
- 4.
- Legal Framework
The shortage of housing is also linked to the legal framework, which provides insufficient protection to landlords and lenders whose tenants or borrowers default.
- 5.
- Financing Economics Problem
In 2008, the average cost of 100 m2 of raw (undeveloped) land in Jeddah was 2.24 times higher than the average family income, and the cost of 100 m2 of serviced land (land with electricity, roads, and water) was, on average, 19.4 times higher than the average family income [9]. This is one of the main factors accounting for the increased number of two-generation houses (approximately 80,000 households).
2.3. Population Density in Residential Districts
The low population density within Jeddah’s structural plans (Table 1) has resulted in an average lot area of 500–1000 m2 in villa-type neighborhoods. This is a limiting factor with regard to the increasing rate of villas in such neighborhoods compared with apartment-type neighborhoods, as shown in Figure 6 and Figure 7, with households whose incomes are medium-low or low finding it difficult to buy and own villas.
Figure 7 shows the relationship between the change in population density (at four time points) and the percentage of park area from 2007 to 2012 for each district, in terms of the two housing types, Villa type and Apartment type, and Unplanned Settlement. It shows that park area has not increased while population density has increased for 5 years, which is in line with the WHO recommendation of park area per capita. This indicates that the living environment and quality of life is declining and that villa-type housing may also fall below the WHO standard in the future.
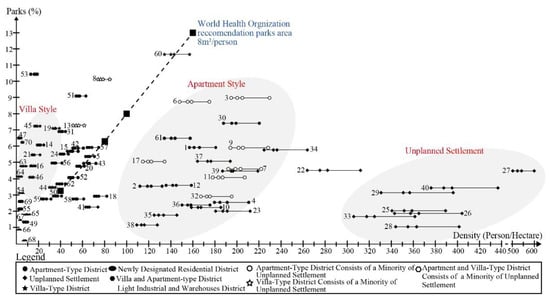

Figure 7.
Population density and park ratio by districts in 2007, 2008, 2009, and 2012 in Jeddah.
3. New Villa-Type Neighborhood Development
3.1. Procedure Manual for Preparing of Residential Land Subdivision (PMPRLS)
During Jeddah’s urbanization process, areas outside the boundaries of each urbanized area afforded attractive investment opportunities for businesses. Consequently, large areas of land have been bought and sold and then subdivided into residential lots to create neighborhoods in line with the PMPRLS.
The PMPRLS comprises several regulations on public spaces, such as streets, parks, mosques, and parking areas, and private spaces, such as residential lot areas, and their dimensions. Regulations relating to public spaces are as follows. First, land allotted for local mosques must have a service distance that does not exceed 200 m. Second, land for elementary and intermediate schools must be provided at a service distance that does not exceed 550 m (the ratio is not mentioned). Third, the total street must not exceed 20% of the total area. Fourth, the maximum total street length based on the average area of the villa lot is shown in Table 2. Fifth, one children’s playground, having a minimum area of 400 m2, should serve 20 villas. Finally, the total area of public facilities, such as parks, the parking areas of amenities, pedestrian corridors, and the central square, should be 13% of the total area.

Table 2.
Average areas of lots and total street length in the New Development Plan for villa-type neighborhoods (according to the Procedure Manual for Preparing of Residential Land Subdivision).
Private space-related regulations are as follows. First, the minimum land lot area for a villa is 300 m2 or, if a lot is subdivided, 200 m2, and the minimum width of a residential lot should be 15 m. As noted in the manual, an average household size of five persons is assumed for calculating the population and population density. Figure 8 shows the composition of the villa-type neighborhood as per the PMPRLS.
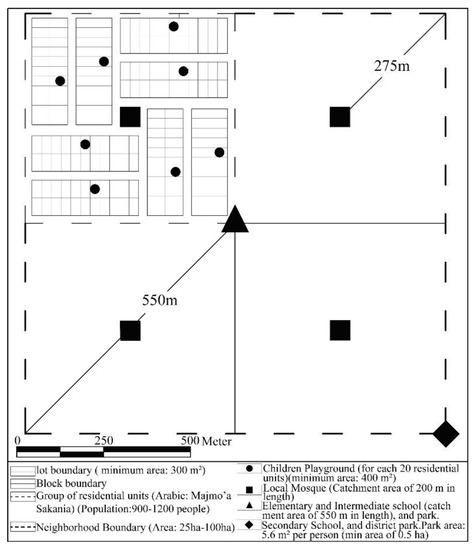
Figure 8.
Conceptual depiction of a neighborhood based on the Procedure Manual for Preparing of Residential Land Subdivision.
3.2. Application of the Procedure Manual in Relation to an Area with a Radius of 200 m
Table 3 shows the total street area, the number of villas, population density, and the number of children’s playgrounds according to the percentage of the total street area (20% of the total area), the total area of public facilities (13% of total area), and the total street length. As noted above, according to the PMPRLS, this area has a radius of 200 m (12.56 ha) from the mosque at its center. By contrast, Table 4 shows the application of the PMPRLS to the above-mentioned land area, with a difference in the street width, i.e., a minimum street width of 10 m, which is mentioned in the PMPRLS.

Table 3.
Applying the Procedure Manual for Preparing of Residential Land Subdivision to an area having a radius of 200 m (12.56 hectare in total area) with a maximum street capacity and variations in villa lot areas.
As shown in Table 3, the MoMaRAaH did not consider any direct correlations between the average villa lot and total street areas and the total area of public facilities, in spite of variations in the number of villas, population density, and the number of children’s playgrounds. Accordingly, as shown in Table 4, the same number of public facilities will apply to an area with 111 persons/hectare as to an area with 13 persons/hectare, although there are variations in the average land areas occupied by villas and streets. The ratio of the total area of public facilities is fixed. This means that 16 persons/hectare (in our case study of 12.56 ha and a total of 192 persons) will receive the same quantity of public facilities as an area with 123 persons/hectare.


Table 4.
Applying the PMPRLS to an area having a radius of 200 m (a total area of 12.56 ha) with streets of a minimum width of 10 m and varied villa lot areas.
Table 4.
Applying the PMPRLS to an area having a radius of 200 m (a total area of 12.56 ha) with streets of a minimum width of 10 m and varied villa lot areas.
| AoVLA (ha) | STA (ha) | PFTA (ha) | TSL (m) | NoV (Unit) | PD (Person/ha) | NoCP (Unit) |
|---|---|---|---|---|---|---|
| 0.03 (300 m2) | 1.63 (13%) | 1.63 (13%) | 1633 | 310 | 123 | 15 |
| 0.04 (400 m2) | 1.51 (12% | 1507 | 236 | 94 | 12 | |
| 0.06 (600 m2) | 1.38 (11% | 1382 | 159 | 63 | 8 | |
| 0.08 (800 m2) | 1.26 (10%) | 1256 | 121 | 48 | 6 | |
| 0.1(1000 m2) | 1.13 (9%) | 1193 | 97 | 39 | 5 | |
| 0.2(2000 m2) | 1.00 (8%) | 1005 | 50 | 20 | 2 | |
| 0.25(2500 m2) | 1.00 (8%) | 942 | 40 | 16 | 2 |
Note: AoVLA: Average of Villa Lot Areas (in hectares), STA: street total area (hectare) = STA= TSL × 0.001 ha (= 10 m street minimum width)/12.56, PFTA: public facilities total area (in hectares) = 12.56 × 0.13, TSL: total of street length (m) = MSTL (Table 2) × 12.56, NoV: number of village s = 12.56 × (1 − STA(changeable) – PFTA (0.13))/AoVLA, PD: population density (people/hectare) = NoV × 5/12.56, NoCP: number of children’s playgrounds = NoV/20.
4. Existing Conditions in Villa-Type Neighborhoods According to the PMPRLS
4.1. Index Analysis
The index analysis was developed using geographic information system (GIS) data obtained from the Jeddah Municipality, and the data were exported to an AutoCAD file. Areas within a 200 m radius (an area of approximately 12.56 ha) for mosques in villa-type neighborhoods (103 in total) were analyzed in Jeddah (Figure 4).
The index was subdivided into private and public spaces. Private spaces comprised elements such as villas, commercial facilities, and office buildings. Public spaces comprised facilities such as a mosque, an elementary school, a street, and parks. The following six parameters were established for analyzing villas: (1) numbers of villas in 2008 and 2016; (2) total areas of villas (average and median values and minimum and maximum values and the differences between them); (3) the minimum, maximum, and median values for the distances of existing villas’ lot frontage and their proportion to the lot length; (4) the number of villas facing 1, 2, 3, and 4 streets; (5) the average land value in the SAR (per square meter); and (6) the total area for commercial facilities and office buildings. Nine parameters were selected to analyze public space: (1) the total area of streets; (2) the total road length; (3) the road width (maximum and minimum values, and the difference between them, and the median value); (4) the distance from a mosque to the nearest mosque; (5) the area of land occupied by the mosque; (6) the distance to the nearest elementary school; (7) the number of parks, and the distance to the nearest park and the park lot area; (8) the total area of the vacant lot; and (9) the total area of public facilities, and public parking.
4.2. The PMPRLS and Actual Condition
A scatterplot was created to analyze and clarify the following issues: (1) the extent to which the PMPRLS is applied, and (2) the typology of villa-type neighborhoods to clarify the extent to which the PMPRLS is applied. The correlation coefficients for several factors relating to the PMPRLS were calculated by performing regression analysis for existing conditions, the results of which are shown in Figure 9, Figure 10, Figure 11 and Figure 12.
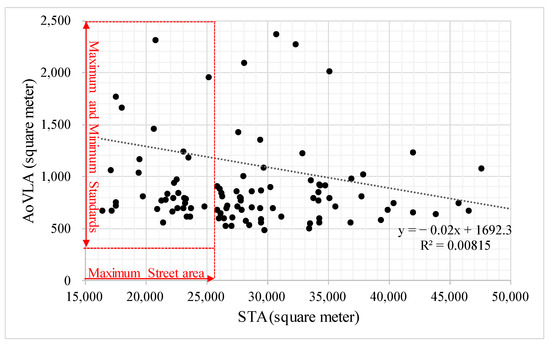
Figure 9.
Street total area and average of land lot area.
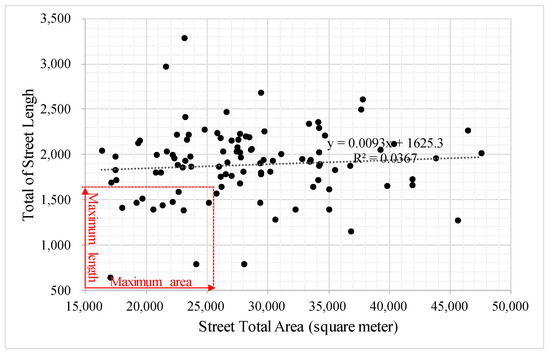
Figure 10.
Street total area and total street length.
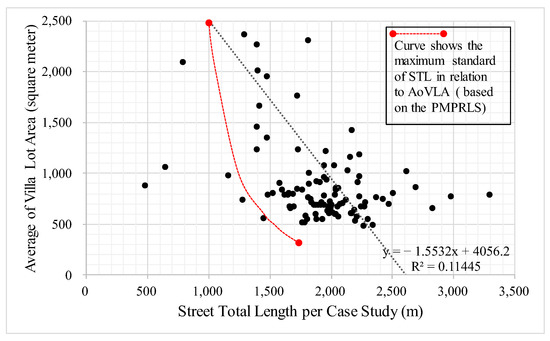
Figure 11.
Total street length and average villa lot area.
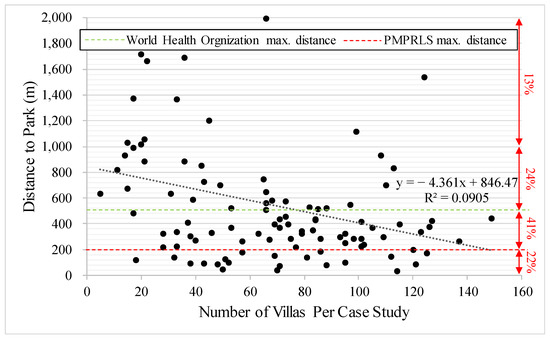
Figure 12.
Number of villas and distance to park.
Figure 9 shows that only 32% of the study sites are within the standard street total area (STA), whereas 68% exceed the maximum standards. Moreover, 73% of the average of villa land lot area (AoVLA) is between 500 and 1000 m2. Moreover, the correlation between the STA and AoVLA was weak for existing conditions, as shown by the value of R, which was 0.00815 (where a perfect correlation has a value of 1).
Figure 10 shows that only 11.5% of the study sites were within the STA and TSL (total street length) standards, with 88.5% of the sites exceeding the maximum standard. Furthermore, the TSL in 77.7% of the study sites was found to be between 1500 and 2500 m. As shown in Table 4, there was a perfect correlation between the AoVLA and the TSL. However, 94% of the study sites exceeded the standards curve (Figure 11).
Figure 12 shows the final PMPRLS factor, which is the correlation between the number of villas and the distance to the nearest park. According to the PMPRLS, one children’s playground must be provided for every 20 villas. However, our results indicated that the number of children’s playgrounds (NoCP) was not applicable in reality (Table 3); therefore, we decided to investigate the distance to the nearest park instead. Two criteria were established: parks within a 200 m distance and those within a 500 m distance according to the distance recommended by the World Health Organization (WHO). In 24% of the sites, the distance to the park was between 500 and 1000 m. It was clarified that only 22% of study sites have a distance to the nearest park of 200 m which is based on the PMPRLS; however, only 41% of study sites met the recommendation of WHO regarding the distance to a park, which is 500 m. In addition, 24% of study sites are far away from parks, having a distance between 500 and 1000 m. Finally, 13% of study sites have a distance of more than 1000 m to the nearest park.
4.3. Contemporary Villa-Type Neighborhoods and the Housing Shortage
As shown in Figure 13, the number of villas in all of the study sites increased but at different rates. This finding indicates the need to examine the extent to which contemporary neighborhoods can respond to the problem of the housing shortage, which amounts to 80,000 units (Figure 6, Shortage 2). To examine this question, we assumed that the occupation pattern for the total vacant area in each site would match the growth pattern. The calculation was performed by determining the total vacant area (m2) and the average lot area of already-built villas in each study site. The following formula was applied for each study, with the results shown in Table 5:
where f denotes the total number of villas that can be added to the total vacant area in the same tendency. TVA denotes the total vacant area (m2), and AVLA denotes the average of villa lot area (m2). f includes a decimal point in the number of villas because AVLA is a projection of future development. TVA is defined as the total area to be built on, excluding roads, within an area of 12.56 ha, which is based on a radius of 200 m centered on each mosque.
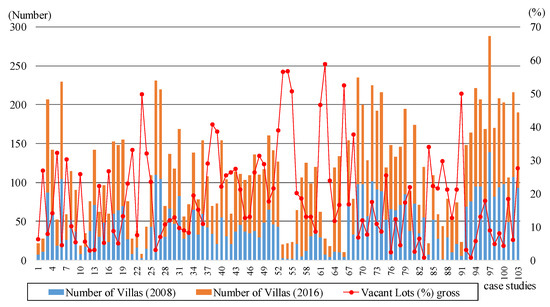
Figure 13.
Numbers of villas in 2008 and 2016, and the ratio of vacant lots.

Table 5.
Number of villas that can be added to a vacant lot area in each case study in a scenario entailing the same growth pattern.
The results of the calculations shown in Table 5 clearly indicate that, within contemporary villa-type neighborhoods, the pattern of full occupation by villas is the same for each case study, with neighborhoods only meeting 3.5% of the total housing shortage (2843 units/80,000 units × 100). Given this finding, in addition to several differences between the case studies relating to aspects such as land price, average lot area, the net of the total vacant lot, and others, it was necessary to clarify the indicators (mentioned above in the index analysis) that demonstrated a strong correlation via correlation analysis. The indicators were then categorized into groups according to the results of the multiple linear regression analysis and scatter plot, as discussed in the following section.
5. Elements of Neighborhoods and Their Correlations
5.1. Correlation Analysis
To contribute to addressing the housing shortage problem, it is necessary to predict the growth possibilities of villa-type neighborhoods starting from the present. This prediction was performed by analyzing the characteristics and composition of contemporary villa-type neighborhoods. In order to understand the correlation between housing development trends, and the site and surrounding facilities over an 8-year period, several factors, such as the number of development sites, site area and proportion of lots, and distance between mosques and highways in 2008 and 2016, along with land prices, a factor also considered to be important in previous studies, were adopted to perform correlation analysis.
The results obtained for the increase in the number of villas within the 8-year period revealed a negative correlation of −0.447 between the land price and the increased number of villas. This result indicates that there was a higher increase ratio for the number of villas in sites where land prices were lower. However, the correlation for lots that ranged in area between 300 and 400 m2 was stronger, with a positive correlation of 0.548. Thus, there was a higher possibility of growth for small villa lots that was strongly related to the possibility of purchasing these lots. In addition, the proportion of the lot’s frontage and depth was more than 2:1 for lots with areas within a range from 300 to 400 m2, with a positive correlation of 0.468 (Table 6).

Table 6.
Correlation analysis among the several factors during an 8-year period.
Furthermore, over the 8-year study period, the number of villas was positively correlated (0.480) with the distance between the mosque and the highway. However, there was a negative correlation (−0.501) for the distance between the mosque and the highway and the average land price, which means that the distance between the highway, and the mosque had the effect of increasing the land price, with greater proximity to the highway corresponding to a higher land price. In addition, there was a positive correlation (0.481) between the average land price and the road area. However, among the sites evidencing growth within the 8-year study period, those with limited street areas and low prices showed a significant increase in the number of villas.
In addition, the results of the analysis showed a positive correlation (0.458) between the increased number of villas in 2016 and the ratio of lots ranging in area between 500 and 600 m2. However, this correlation was lower than the value obtained in 2008 (by 0.037) of 0.495. Furthermore, the analysis revealed a striking relationship between lots that faced one road and the number of villas that increased between 2008 and 2016, indicated by a positive correlation of 0.523. As noted above, between 2008 and 2016, the majority of the new villas were constructed with lots ranging between 300 and 400 m2, and a decreased correlation value was found for lots having areas between 500 and 600 m2. Therefore, it is clear that most of the contemporary lots ranging in size between 500 and 600 m2 were built before 2008.
5.2. Multiple Regression Analysis
To develop a formula for predicting villa development, we conducted a multiple regression analysis with the changing rate of increase in the number of villas over 8 years as the object variable, and 26 criteria as explanatory variables (Table 7). We devised the regression formula through repeated parallel implementation of a stepwise selection method and a forward selection method.

Table 7.
Related criteria for the multiple regression analysis.
The following formula was used to predict villa development according to the increase in the number of villas over 8 years:
Increase in the number of villas over 8 years = 27.724 − 0.02 × (Land price) + 1.296 × (ratio of lots with areas ranging between 300 and 400 m2)
The coefficients were significant at the 0.01 level, and the Variance Inflation Factors (VIFs) among two criteria (the land price and ratio of lots with area ranging between 300 and 400 m2) all had values under 1.068, and thus satisfied the requirement of being under 10. The Durbin–Watson test yielded a value of 1.750, indicating the independence of the criteria (Table 8). The adjusted R-squared value was 0.391, which explained 39.1% of the number of increased villas over 8 years (Table 8). The standardized coefficients of these two criteria were respectively −0.330 and 0.465, so that the ratio of lots with areas ranging between 300 and 400 m2 was evidently of greater significance than the land price (Table 9). These results indicate that, over the 8-year study period, villa development occurred mainly in lower-priced villa lots having areas ranging between 300 and 400 m2. Thus, the optimal area of the lot for villa development considering purchasing ability is between 300 and 400 m2.

Table 8.
Summary of model for predicting the increase in the number of villas as an explanatory variable.

Table 9.
Coefficients for the change rate of the number of villas as an explanatory variable.
The following formula was used to predict the net ratio of vacant lots:
Net ratio of vacant lots = 53.368 + 0.011 × (distance between mosque and park) − 0.015 × (total length of roads) + 0.517 × (ratio of lots with areas ranging between 1000 and 1400 m2)
The coefficients were significant at the 0.01 level, and the VIFs for the three criteria (the distance between a mosque and a park, the total length of roads, and the ratio of lots having areas ranging between 1000 and 1400 m2) were all under 1.154, and thus satisfied the requirement of being under 10. The value obtained for the Durbin–Watson test was 1.821, indicating the independence of the criteria (Table 10). The adjusted R-squared value was 0.281. The standardized coefficient values for these three criteria were respectively 0.243, −0.288, and 0.269, revealing that the three criteria were almost equally significant. To reduce the ratio of vacant lots using the above predictive formula would require developing parks near mosques and not increasing the total length of roads. Moreover, the areas of villa lots ranging between 1000 and 1400 m2 would need to be reduced (Table 11).

Table 10.
Summary of the model used to calculate the net ratio of vacant lots.
Predictors: (constant), distance between mosques and parks, total length of roads, and ratio of lots that range in area between 1000 and 1400 m2.


Table 11.
Coefficients for the net ratio of vacant lots as an explanatory variable.
Table 11.
Coefficients for the net ratio of vacant lots as an explanatory variable.
| Model | Unstandardized Coefficients | Standardized Coefficients | t | Sig. | Collinearity Statistics | |||
|---|---|---|---|---|---|---|---|---|
| B | Std. Error | Beta | Tolerance | VIF | ||||
| 1 | (Constant) | 53.368 | 9.359 | - | 5.703 | 0.000 | - | - |
| Distance between mosque and park | 0.011 | 0.004 | 0.243 | 2.689 | 0.008 | 0.867 | 1.154 | |
| Total length of roads | −0.015 | 0.004 | −0.288 | −3.346 | 0.001 | 0.951 | 1.052 | |
| Ratio of lots ranges between 1000 and 1400 m2 | 0.517 | 0.170 | 0.269 | 3.042 | 0.003 | 0.901 | 1.110 | |
5.3. Groupings and Suggestions
We applied Ward’s method to perform cluster analysis using the standardized scores for six criteria associated with villa development and the net ratio of vacant lots, the ratio of villa lots having areas ranging between 300 and 400 m2, the ratio of villa lots having areas ranging between 1000 and 1400 m2, the average land price, the total area of vacant lots, the distance between a mosque and a park, and the total road length (Figure 14, Figure 15 and Figure 16). The 103 target areas were categorized into six groups (Figure 17). The characteristics and recommendations for reducing the net ratio of vacant lots are presented below.
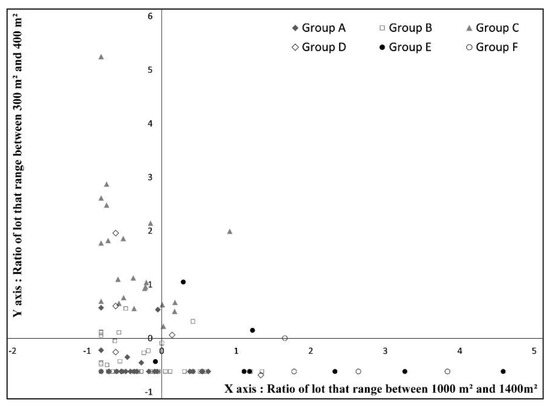
Figure 14.
Scatter diagram (1).
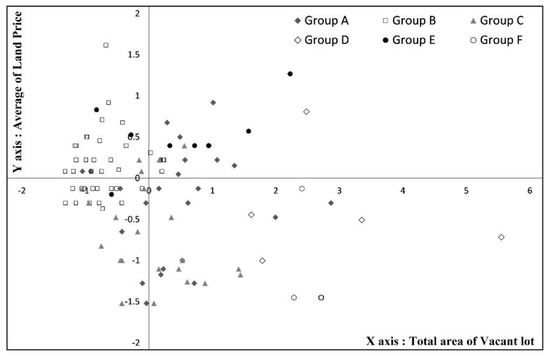
Figure 15.
Scatter diagram (2).
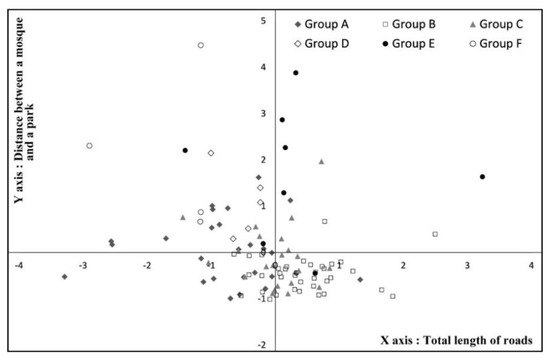
Figure 16.
Scatter diagram (3).
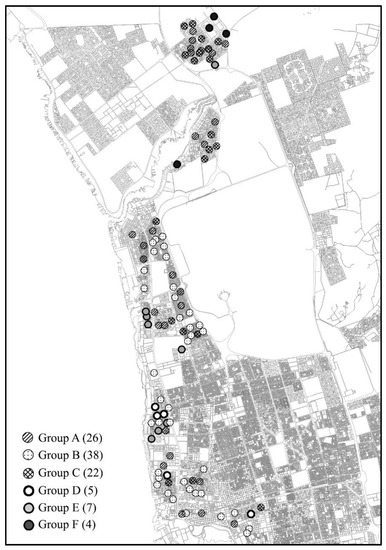
Figure 17.
Locations of the study sites and their groupings.
- Group A (26 sites)
The neighborhoods included in this group evidence the following characteristics: (1) the areas of a few lots range between 300 and 400 m2; (2) the total area of vacant lots is relatively large; (3) land prices are high; and (4) the road lengths are short compared with those of other groups. Because of the relatively large total area of vacant lots, it is necessary to delineate existing lots with areas ranging between 300 and 400 m2 along with increasing road length for improving the street environment and reducing the ratio of vacant lots. In addition, increasing the number of parks to respond to the increase in population density is recommended, thereby increasing the possibility of consumers being able to purchase lots.
- 2.
- Group B (38 sites)
The neighborhoods included in this group share the following characteristics: (1) a certain number of villas have been built in lots with areas ranging between 300 and 400 m2; (2) a few vacant areas are present; (3) the total street length is substantial; and (4) there is a short distance between the mosque and park. As the majority of lots within this group have already been developed, there are no further recommendations or changes needed.
- 3.
- Group C (22 sites)
This group is distinguished by the following characteristics: (1) a large number of lots that range in area between 300 and 400 m2; (2) relatively low average land prices compared with those of other groups; (3) a substantial total street length; and (4) a short distance between mosques and parks. These characteristics indicate that there has been active construction of villas over the last 8 years. Moreover, a clear projection of an increase in villas within lots that range between 300 and 400 m2 in the area can be made for several years into the future.
- 4.
- Group D (5 sites)
This group is characterized by: (1) a few villa lots ranging in area between 300 and 400 m2, and also between 1000 and 1400 m2; (2) a large total area of vacant lots in spite of a low average land price; and (3) a significant distance between a mosque and a park relative to other groups. Our analysis of the locations of the study sites clearly revealed that the locations of lots categorized in this group were not attractive residential sites because of their geographical characteristics. Thus, it is necessary to divide the lots into small-sized lots and to improve the environment by creating parks in these neighborhoods.
- 5.
- Group E (7 sites)
A large number of villa lots ranged in the area between 1000 and 1400 m2. Not only are average land prices high for lots in this group, but there is a considerable distance between mosques and parks. Our analysis revealed a strong trend toward increased villa construction in large-sized lots. Thus, we recommend the development of a method for matching purchase ability through the division of existing villa lots with high land prices and the establishment of parks near the mosques.
- 6.
- Group F (4 sites)
Although the ratio of villa lots having areas ranging between 1000 and 1400 m2 is high, the average land price is low. Nevertheless, vacant lots are evident. However, the total length of roads is very short, and parks are located very far from mosques. Evidently, some of these areas are unsuitable as residential environments. Therefore, special district planning is necessary for this type of neighborhood to increase the length of the roads and reduce the areas of villa lots.
6. Conclusions
Between 2007 and 2029, the estimated population growth of Jeddah, which is one of the most traditional and rapidly growing cities in Saudi Arabia, is expected to be around 2.25 million people. Faced with a serious housing shortage, the government proposed the provision of adequate new houses in response to the projected housing demand. Furthermore, within the SAR, villa-type housing is a historical and prestigious housing type compared with apartment-type housing. However, the proportion of villas is lower in Jeddah compared with these proportions in other cities. According to the PMPRLS, the characteristics of villa-type housing are a low population density and a minimum land lot area of 300 m2. In this situation, we aimed to clarify the characteristics of 103 sites according to the development trend by applying several indicators derived from the articles of the PMPRLS. In light of our analysis and typology, we proposed desirable developmental directions for each type of site.
In Section 2 of this paper, we discussed the extent of and reasons for the housing shortage in the city and projected future needs in relation to population growth. Moreover, we described the population density in relation to the presence of parks in all of the districts in Jeddah. The low population density associated with villa size is an outcome of Jeddah’s ongoing structural planning, and it is clear that middle- and low-income individuals will find it difficult to own villa-type housing. Assaf [25] noted that inadequate labor, availability, material standards, design quality, and design changes have affected affordable housing costs, and that development policies that can improve these conditions are needed to address the housing shortage problem in Saudi Arabia. In addition, this study also noted that urban development in Jeddah, which is sprawling at low densities due to residents’ preference for villa-type housing, does not solve the housing shortage problem, and that the housing costs associated with ensuring the necessary villa size do not lead to housing affordability for middle- and low-income individuals.
In Section 3, we discussed legislation for new residential area development with the PMPRLS, showing how contemporary neighborhoods were created. We also simulated population density, total street area and length, and numbers of parks and villas in relation to this legislation. Evidently, the MoMaRAaH did not consider the direct correlation between the average villa lot area and the total areas of streets and public facilities. The ratio of the total area of public facilities is fixed, even though there are variations in population density related to villa size. As highlighted by Hegazy (2021), there is a lack of planning tools for managing the urban planning system in Jeddah; thus, it is necessary to review the PPMPRLS of Jeddah to consider more diversity in lot areas, population density, street ratio, and park layout. This diversity is an important element of the solution to the housing shortage problem.
In Section 4, we analyzed the extent to which the legislation on new development of residential areas is applied in contemporary neighborhoods. In addition, we clarified the extent to which neighborhoods can respond to the housing shortage problem in terms of the quantity of housing provided. Based on the trend, which was calculated by the number of villas added to the total vacant area in the same development pattern and lot size, only 3.5% of the total shortage of housing problem would be solved. Alqahtany [26], based on the Saudi vision 2030 plan, discussed the problem of shortage of affordable housing in terms of housing cost, population change, etc. It is necessary to develop a solid strategy for the next 10 years to deal with the serious housing shortage problem projected in Jeddah.
A correlation analysis and multiple regression analysis were also presented to identify several factors that were correlated with each other. The results of the multiple regression analysis showed that the increase in the number of villas was related to the ratio of lots with areas ranging between 300 and 400 m2 and the average land price; this means that an optimal size of villa lots for villa development and for reducing land prices is between 300 and 400 m2. Our findings also revealed that the ratio of vacant lots is related to the distance between mosques and parks, the total road length, and the ratio of lots sized between 1000 and 1400 m2. Therefore, future planning should accommodate the construction of parks near mosques and the extension of road length, as opposed to the total area of roads, and also reduce the sizes of villa lots within a range of 1000 and 1400 m2. Finally, all of the contemporary villa-type neighborhoods were categorized into six groups and suggestions were provided for each group with the aim of addressing an aspect of the housing shortage problem using six criteria derived from the multiple regression analysis.
In the PMPRLS, the area of roads, public facilities, etc., is fixed and does not flexibly respond to changes in population density. As a result, the PMPRLS has not been able to introduce flexible lot sizes. The development trend shows that, as housing prices are expected to increase, the current custom of preferring large lot sizes will not solve the housing shortage problem, because middle- and low-income buyers will not be able to afford to purchase houses. It is important to ensure the diversity of housing supply, such as by dividing large lots into smaller ones.
To conclude, we analyzed neighborhoods in Jeddah from economic and policy perspectives, and proposed different recommendations for each group. However, the contents of the recommendations were limited to the total area and length of streets, the minimum area of villa lots, and land prices. Although we proposed improvement measures for each group, we did not simulate the actual quantitative numbers to determine the size of the increase in the number of housing units. Therefore, quantitative support to determine the extent to which the housing shortage can be improved is a subject for future study. Future research also should consider other important factors, such as pedestrianization and its relation to motorization within planned neighborhoods.
Author Contributions
Conceptualization, R.M. and A.D.; methodology, R.M. and J.S.; software, R.M.; validation, R.M., J.S. and A.D.; formal analysis, R.M.; investigation, R.M.; resources, R.M.; data curation, R.M. and J.S.; writing—original draft preparation, R.M.; writing—review and editing, R.M. and J.S.; visualization, R.M. and J.S.; supervision, A.D.; project administration, R.M. All authors have read and agreed to the published version of the manuscript.
Funding
This research received no external funding.
Data Availability Statement
Data sharing not applicable.
Acknowledgments
The authors would like to thank the editors and reviewers for their time on the publication of this paper. The experimental participants and member of The University of Tokyo for their contribution to the study.
Conflicts of Interest
The authors declare no conflict of interest.
References and Notes
- Hass-Klau, C.H.M. The Housing shortage in Germany’s Major Cities. Built Environ. 1982, 8, 60–70. [Google Scholar]
- Abhay, R.K.; Sharma, M. Housing Shortage in a mega city: A spatio-temporal analysis of NCT-Delhi, 2001–2011. GeoJournal 2022. [Google Scholar] [CrossRef]
- Kumar, A. Estimating Rural Housing shortage. Econ. Political Wkly. 2014, 49, 74–79. [Google Scholar]
- Gabbe, C.J. Local regulatory responses during a regional housing shortage: An analysis of rezoning in Silicon Valley. Land Use Policy 2019, 80, 79–87. [Google Scholar] [CrossRef]
- Tian, L. Breaking the land monopoly: Can collective land reform alleviate the housing shortage in China’s mega-cities? Cities 2020, 106, 102878. [Google Scholar] [CrossRef]
- Surf, M.A.; Susilawati, C.; Tringunarsayah, B. Analyzing the Literature for the Link between the Conservative Islamic Culture of Saudi Arabia and the Design of Sustainable Housing. In Proceedings of the 2nd International Conference Socio-Political and Technological Dimensions of Climate Change, Kuala Lumpur, Malaysia, 1 November 2012. [Google Scholar]
- Hegazy, I.; Helmi, M.; Qurnfulah, E.; Naji, A.; Ibrahim, H.S. Assessment of Urban growth of Jeddah: Towards a liveable urban management. Int. J. Low-Carbon Technol. 2021, 16, 1008–1017. [Google Scholar]
- Mulliner, E.; Algrnas, M. Preferences for housing attributes in Saudi Arabia: A comparison between consumers’ and property practitioners’ views. Cities 2018, 83, 152–164. [Google Scholar] [CrossRef]
- Jeddah Strategic Plan; Jeddah Municipality, May 2009.
- General Authority for Statistics. Housing Statistics Bulletin. 2019. Available online: https://www.stats.gov.sa/ar/911-0 (accessed on 8 February 2021).
- Jeddah Municipality. Jeddah Structure Plans. Available online: https://www.jeddah.gov.sa/index.php (accessed on 6 May 2015).
- Ministry of Municipal and Rural Affair and Housing. Procedure Manual for Preparation of Residential Land Subdivision. 2005. Available online: https://www.momra.gov.sa/ar/regulations (accessed on 1 October 2015).
- Jeddah Municipality. Jeddah Autocad Map. 2016.
- Ministry of Justice. Real Estate Indicators of Neighborhoods. 2016. Available online: https://www.moj.gov.sa/ar/opendata/bi/birealestateDistrct/Pages/Yearly.aspx (accessed on 7 May 2015).
- Abu-Ghazzeh, T.M. Built form and religion: Underlying structures of jeddah al-qademah. Tradit. Dwell. Settl. Rev. 1994, 5, 49–59. [Google Scholar]
- Salama, A.M. A lifestyle theories approach for affordable housing research in Saudi Arabia. Emir. J. Eng. 2006, 11, 67–76. [Google Scholar]
- Attia, M. Sustainability Features of Jeddah Traditional Housing. In Sustainable Housing; IntechOpen: London, UK, 2021. [Google Scholar] [CrossRef]
- Jambi, R.; Saci, K. House Pricing Determinants from Buyers Perspective in Jeddah, Saudi Arabia. PalArch’s J. Archaeol. Egypt/Egyptol. 2021, 18, 1001–1006. [Google Scholar]
- Maddah, R.; Deguchi, A. Evaluation and Redefinition of Open Spaces in Neighborhoods of Hot Arid Region: Case of Jeddah City, Kingdom of Saudi Arabia. J. Sustain. Urban. Regen. 2016, 1, 1–11. [Google Scholar]
- Maddah, R.; Song, J.; Deguchi, A. Motorization and Pedestrianization Issues based on Design Standards in Planned Neighborhoods in Jeddah City, Saudi Arabia. Urban Reg. Plan. Rev. 2016, 3, 187–202. [Google Scholar] [CrossRef][Green Version]
- Maddah, R. The measurement of walkability in villa-type neighborhoods: Using HPE’s walkability index: Case of Jeddah City, Saudi Arabia. In Proceedings of the International Conference Virtual City and Territory, Barcelona, Spain, 21 December 2019. [Google Scholar]
- Mousalli, M.S. Residential Location in Jeddah, Saudi Arabia: A Partial Symbolic Representation. J. King Abdulaziz Univ.-Eng. Sci. 1999, 11, 31–49. [Google Scholar]
- Al-Otaibi, A. The Aspiration for Housing in Jeddah—Saudi Arabia. Economics. 2004. Available online: https://www.semanticscholar.org/paper/The-Aspiration-for-Housing-in-Jeddah-Saudi-Arabia-Al-Otaibi/70128f7ea8dfdb4375bbbc4caab2d87ffb573ff1 (accessed on 7 September 2021).
- Murad, A. Creating a GIS application for retail centers in Jeddah city. J. Comput. Science 2011, 7, 902–908. [Google Scholar] [CrossRef][Green Version]
- Assaf, S.A.; Bubshaitr, A.A.; Al-Muwasheer, F. Factors affecting affordable housing cost in Saudi Arabia. Int. J. Hous. Mark. Anal. 2010, 3, 290–307. [Google Scholar] [CrossRef]
- Alqahtany, A. Affordable housing in Saudi Arabia’s vision 2030: New development and new challenges. Int. J. Hous. Mark. Anal. 2020, 14, 243–256. [Google Scholar] [CrossRef]
Publisher’s Note: MDPI stays neutral with regard to jurisdictional claims in published maps and institutional affiliations. |
© 2022 by the authors. Licensee MDPI, Basel, Switzerland. This article is an open access article distributed under the terms and conditions of the Creative Commons Attribution (CC BY) license (https://creativecommons.org/licenses/by/4.0/).