Article

Research on the Characteristics of Infrared Radiation and Energy Evolution Law of Red Sandstone with Different Porosity during Uniaxial Compression

1
School of Resources and Safety Engineering, Central South University, Changsha 410083, China
2
School of Investigation and Surveying Engineering, Changchun Institution of Technology, Changchun 130021, China
*
Authors to whom correspondence should be addressed.
Sustainability 2022, 14(13), 7698; https://doi.org/10.3390/su14137698
Submission received: 4 May 2022 / Revised: 6 June 2022 / Accepted: 22 June 2022 / Published: 24 June 2022

Abstract

:
Infrared radiation thermal imaging technology is proposed for rock mechanics tests. Through the infrared radiation temperature and stress–strain curves of sandstone with different porosity during the process of uniaxial compression loading obtained by an infrared camera and uniaxial compression testing machine, the characteristics of infrared radiation on sandstone are systematically analyzed during uniaxial compression loading. The results show that: (1) The strength of sandstone decreases with the increase of porosity, the infrared thermography of sandstone has obvious characteristics of stage evolution and is closely related to the deformation and failure stage of rock in the process of uniaxial compression; (2) During the rock failure process, infrared thermography is differentiated, and the high-temperature radiation zone can reflect the location, size and shape of rock fractures; (3) During the uniaxial compression loading process, the evolution law of the average infrared radiation temperature (AIRT) is closely related to the porosity and uniaxial compressive of the rock, and it is possible to invert all processes of rock failure. The research results demonstrate that the technique of infrared thermal imaging can be applied to rock mechanics tests, and the evolution law of the infrared radiation characteristics can provide a reference for stability analysis of the underground rock engineering.

1. Introduction

The uniaxial compression loading test is the most commonly used test method to understand the mechanical properties of rock materials and their fracture process, and many mechanical properties of rock materials and stability analysis data of rock mass are obtained from this. Meanwhile, the goaf stability is closely related to the bearing capacity and unstable failure of pillars, which is similar to uniaxial compression. Load transfer effects can induce more severe disasters, such as the cascading pillar failure of multi-pillar and the collapse of the goaf group. Many scholars [1,2,3,4,5,6,7] have studied the change in infrared radiation information in the process of stress on rocks and confirmed that rocks will have obvious infrared radiation changes in the process of force deformation. Studies have shown that the use of infrared thermal imaging technology for infrared detection during the stress process of rock masses, especially before rupture instability, to find the precursor information of its associated infrared radiation and predict the stability of rock masses, is a promising new method [8,9,10,11,12,13,14,15,16,17,18,19].
Luong [20] first applied the infrared thermographic camera with rock and concrete samples under uniaxial and fatigue loadings to detect the initiation and development of micro-cracks. Wu et al. [21] selected the mean IRR temperature as the quantitative index to study the temporal evolution of IRR from loaded rock and to identify the precursors for rock fracturing and failure. Liu et al. [22] systematically studied the infrared characteristics of rock force catastrophes, conducted an in-depth analysis of the infrared radiation precursors of rock rupture, and analyzed the manifestations, temporal and spatial characteristics and formation mechanisms of precursors in detail. Zhang et al. [23] studied the thermal radiation temperature field of porous rock under uniaxial pressure, and the results showed that during the loading process, the compressive stress zone heated up the tensile stress zone cooled, and the abnormal precursor of band heating occurred when the specimen was shear ruptured. Xu et al. [24] applied the infrared thermal imaging detection method to the uniaxial compression test of granite at room temperature, analyzed the infrared radiation characteristics during rock rupture, studied the rock infrared spectral variations during stress and revealed stress-sensitive bands of granite at room temperature. Cai et al. [25] investigated the water saturation effects on the thermal infrared radiation characteristics of rock materials during deformation and fracturing processes. The results indicated factors such as the presence of water, facilitated the release of thermal energy and affected the sensitivities of the heating rates in elastic deformation phase.
These studies revealed the characteristics of infrared thermal radiation during the stress process of rocks, and some people have studied the stress–infrared characteristics of sandstone. However, for room temperature, the law of infrared radiation characteristics of highly brittle sandstone during uniaxial compression loading has been studied less often, especially for the infrared of sandstone with different porosity. In actual engineering, properties of the rock will change under the action of different environmental effects, so the porosity is an important influencing factor that must be considered. In addition, infrared thermal imaging technology has fast measurement speed, high precision, high density, and all-weather work [16]. Microseismic and acoustic emission are the other two commonly used monitoring technology for rock fracture. Microseismic monitoring can obtain the near-real time information. However, microseismic recordings contain a wealth of information beyond event locations, including moment tensors and resonance frequencies [26]. To acoustic emission monitoring, it could classify the tensile and shear cracks according to the dividing lines in AF-RA data. While it is still difficult to determine the failure patterns of rocks under different loading conditions [27]. The research of scholars at home and abroad has shown that it can become an effective tool for rock mechanical damage analysis. Therefore, it is necessary to study the infrared radiation characteristics of sandstone with different porosity to provide a basis for the stability of rock mass engineering in complex underground.
Thus, this paper uses the parallel method of uniaxial compression and infrared detection to compare and analyze the stress–strain curves, infrared thermal image sequences and the distribution and evolution of AIRT on the rock surface of sandstone infrared radiation characteristics of sandstone during uniaxial compression loading.

2. Materials and Test Methods

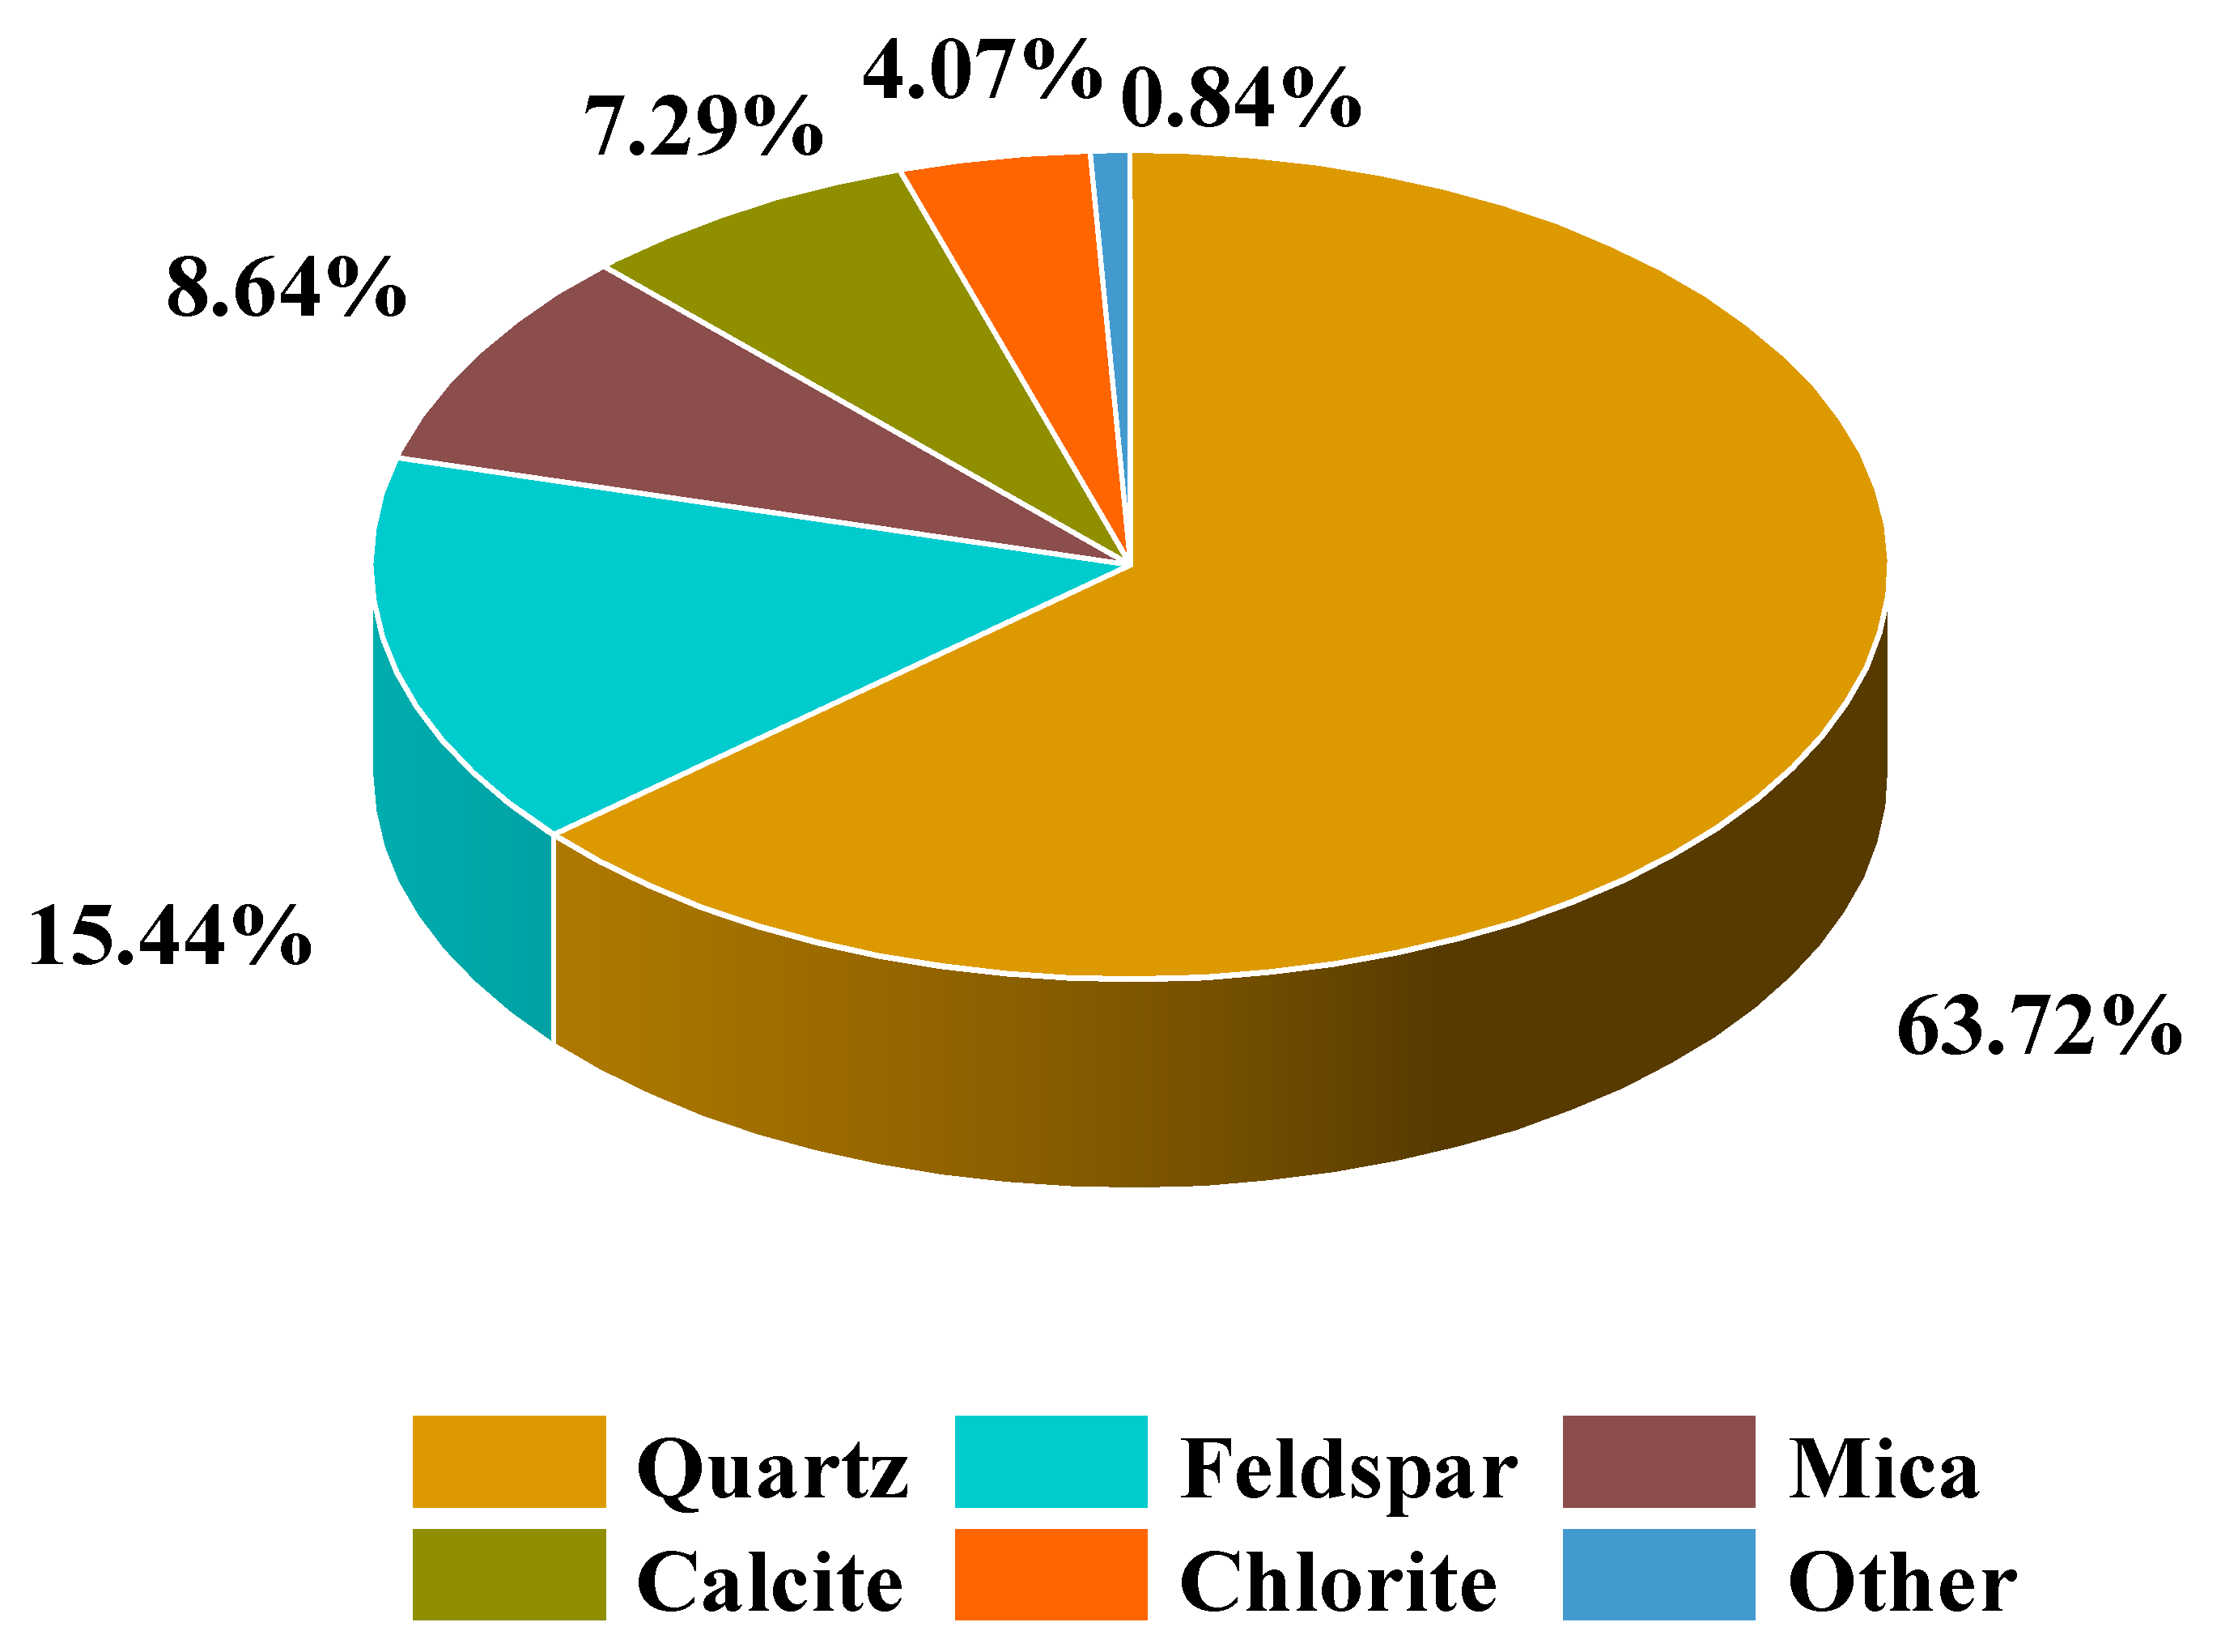
2.1. Specimen Preparation

The red sandstone used for testing is from a hydropower station slope in Hunan province, which was cored from the same block without macroscopic cracks to make results reliable. The mineral compositions of the sandstones were detected by the X-ray diffraction (XRD) technique. They are quartz (63.72%), feldspar (15.44%), mica (8.64%), calcite (7.29%) and chlorite (4.07%). Other mineral compositions are less than 1% by weight (as shown in Figure 1).

2.2. Test Methods

2.2.1. NMR Test

The principle of nuclear magnetic resonance detection technology is that the atomic nucleus is magnetized by a magnetic field and then produces a response to radio frequency, and the response can be reflected by signals that can be measured by the NMR system [28].
Since there is no signal from the rock skeleton, the NMR technology detects the signal of the fluid in the pores of the rocks, so the porosity measured by the NMR technology can truly reflect the actual porosity of the rock.
Before performing the MRI test, the specimen was pretreated with water to ensure that the rock reaches a full state. This test uses vacuum saturation equipment to fully saturate all samples. Additionally, the sample was taken out every two hours for quality testing until the quality no longer increases. Through testing, the red sandstone can reach a fully saturated state after six hours of vacuum saturation.
The AniMR-150 Rock MRI Tester was used for NMR test. The environmental parameters were debugged using the FID sequence, followed by the CPMG sequence for test and calibration. The correlation coefficient reaches 0.999280, a high fitting degree. Then, the test can be processed and obtained the porosity and T2 spectral distribution of the samples.
According to the standards of ISRM [29,30,31], the specimens were processed into cylinders with a diameter of 50 ± 1 mm. The specimens of three porosities were screened out and processed into 60 cylindrical standard test blocks of 50 mm × 100 mm, numbered A1~A20, B1~B20, and C1~C20. Among them, the porosity range of group A specimens is 4.28–4.71%; the porosity range of group B specimens is 4.87–5.39%; and the porosity range of group C specimens is 5.47–6.05%.

2.2.2. Mechanical Tests

Using an Instron 1346 electrohydraulic servo material control machine, the dynamic loading range is 125 kN~1 mN, the static loading range is 250 kN~2 mN, and the axial strain measurement range is 2.5~5 mm. The FLIR SC7000 thermal imaging camera is used for infrared remote sensing detection, thermal sensitivity (NETD) < 0.025 °C, infrared resolution 320 × 256 pixels, pixel spacing 30 μm, image acquisition rate 35 frames/s, wavelength range 7.5~11.5 μm.
The rock sample in the experiment is relatively hard red sandstone, which was tested by the AniMR-150 Rock MRI Tester. The specific steps of the experiment are as follows:
(1)
The rock sample was placed in the laboratory for 24 h so that the temperature of the specimen is consistent with the temperature environment of the laboratory, then mechanical and infrared detection tests were performed.
(2)
During the test, the thermal imaging camera was placed at approximately 1 m from the opposite rock sample (as shown in Figure 2), and loaded in a displacement control mode with a loading rate of 0.15 mm/min. To reduce the influence of the surrounding environment on the infrared radiation of the rock, the doors, windows, and lights were closed during the test to simultaneously reduce the influence of sunlight and lights on the detection effect.
(3)
The parameters of the thermal imaging camera were adjusted and pressed so that the thermal image acquisition frequency was consistent with the frequency of the stress displacement collected by the press, and the loading test was performed to obtain relevant information.

3. Results and Discussion

3.1. Rock Mechanical Properties Change with Porosity

The stress–strain curve of rocks greatly reflects the mechanical properties of rocks [32]. From Table 1, it can be seen that compared with group A, the average porosity of group B have a 12% increase, and the average strength of group B decreased by less than 3%. Meanwhile, compared with group B, the average porosity of group C also have a 12% increase, but the average strength of group C decreased up to 17%. Generally, the strength of the rock decreases with the increase of porosity, and with the same amplitude changes of porosity, the strength changes of the samples can up to six or seven times. In general, the strength of the rock decreases with the increase of porosity, and the weakening effect of the strength with the continuous increase of porosity also increases (as shown in Figure 3).
At the same time, A1, B19 and C17 were taken from three groups of specimens for mechanical analysis (the porosity of selected specimens is typical in the corresponding range), and the stress–strain curve of the rock during loading has obvious stages (as shown in Figure 4). The general law of rock sample failure is as follows: because there are voids (pores and fissures) inside the rock, the stress–strain curve of the rock gap is characterized by downward curvature (upper concave) at the beginning of the loading stage (OA segment); when the void inside the rock is compacted, the curve enters the linear ascending stage (AB segment), and the duration of this stage increases, which indicates that the rock specimen is mainly elastic; when loaded to 80% of the peak stress, the curve begins to bend upwards again, and a slight cracking sound can be heard during the test, which indicates that many microcracks have occurred inside the rock and causing plastic deformation of the rock (BC segment), and the phase is shorter; continue to load, the microcracks inside the rock gradually penetrate and widen, accompanied by small fragments from the rock sample spalling, and the cracking sound is more obvious. When loaded to the peak stress point, the curve rises to the highest point (C), the rock sample is destroyed with a deafening cracking sound, rock fragments catapult outwards, and the stress sharply drops (after the C point). Figure 4 shows that the damage mainly occurred in the middle part of the test piece, the three rock samples were fractured from the middle part, and there were fragments in the test process dropped.

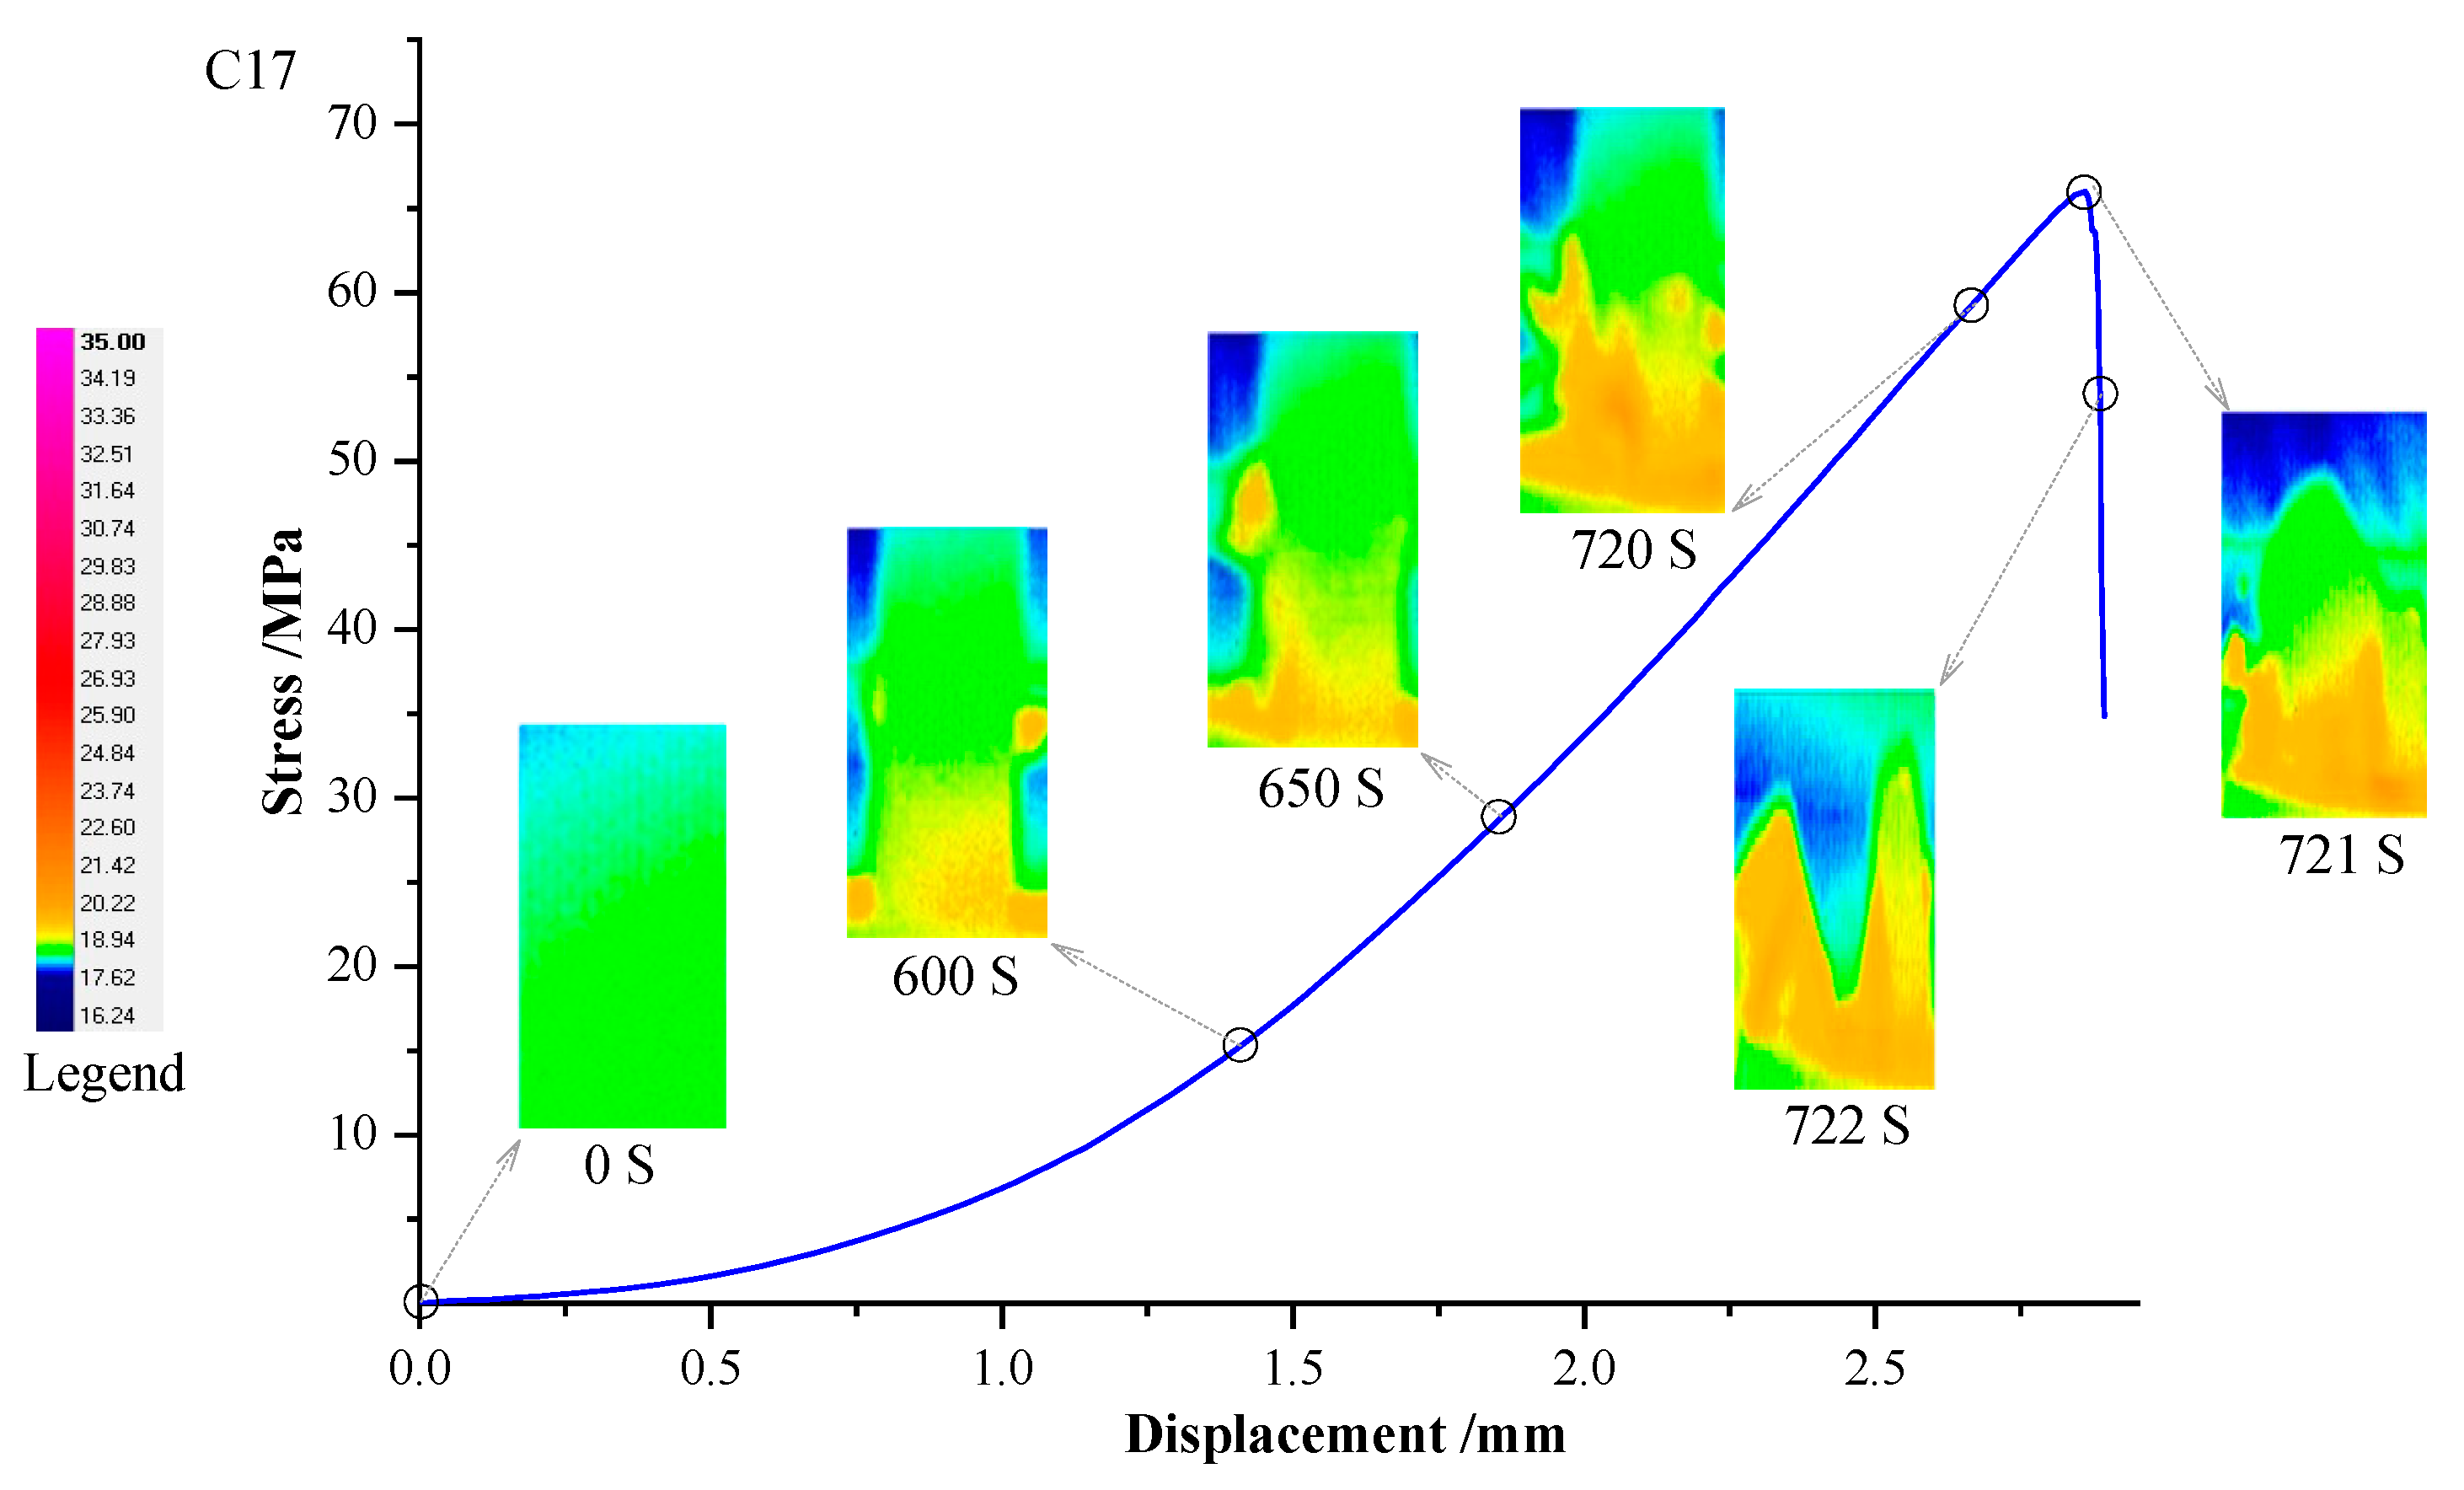
3.2. Infrared Thermal Image Variation Characteristics

The infrared heat obtained by the thermal imaging camera reflects the infrared radiation temperature field on the surface of the rock specimen and the distribution of the infrared radiation intensity on the rock specimen surface [33,34,35]. By observing and analyzing the changes in the infrared thermal image of rocks during the stress process, the specific parts and times of rock failure can be intuitively analyzed, to obtain the critical precursor infrared information of rock rupture. Figure 5, Figure 6 and Figure 7 show the infrared thermal image changes of rock samples A1, B19 and C17 during uniaxial compression.
The changes in the infrared thermal image of specimen A1 in Figure 5 show that the temperature distribution of the rock sample was uniform at 0 s, and the temperature field on the surface of the rock specimen showed an overall basically stable trend from the beginning of loading to 600 s. By 600 s, high-temperature radiation bands began to appear on one side of the specimen, followed by increasingly pronounced high-temperature radiation bands (620 s). When loaded to 950 s (specimen tilt), the temperature sharply increased, and the high-temperature radiation zone was mainly concentrated in the middle and sides of the rock sample, and formed a trough, and violent destruction occurred. At 955 s, the rock formation had broken, part of the bottom remained within the detection range (blue area at the bottom), and other parts had fallen off the test bench; finally, the bottom was also dropped (956 s), a wide range of high-temperature radiation bands gradually disappeared. Summarizing the thermal image changes of rock sample A1 in the uniaxial compression process and the destructive morphology of the rock sample, we find two main characteristics: (1) The specimen destruction during the loading process is basically located where the high-temperature radiation band appears, and the size of the fragments is basically positively correlated with the distribution range of the high-temperature radiation band. The high-temperature radiation band firstly appears on both side of the sample, and as the loading process, the strip area further expands, and extends diagonally and penetrates, eventually forming a z-shaped radiation zone; (2) According to the analysis of the morphology and thermal image map of the rock sample after destruction, the damage during the early loading process is mainly manifested as a small piece falling, and the later stage is manifested as the overall fracture and ejection of large blocks.
The changes in the infrared thermal image of specimen B19 in Figure 6 during the loading process show that the overall temperature distribution of the rock sample at the beginning was uniform 600 s. The temperature field on the surface of the rock specimen showed a steady upward trend; at 600 s, high-temperature radiation bands began to appear in the middle of the specimen; with the loading, the high-temperature radiation belt became increasingly obvious (750 s), a small high-temperature radiation band appeared on both sides of the specimen, and some of the high-temperature radiation band has been detached from the rock sample, which indicates that cracking began and small pieces fell off; when loaded to 800 s (specimen tilt), the temperature sharply increased, the temperature of the middle part of the high-temperature zone reached 35 °C, and the high-temperature radiation zone was mainly concentrated in the rock sample. The middle and flanks have formed a penetration, where the rock sample was violently damaged; at 801 s, the rock sample had broken and began to fall off the test bench, and finally fell in its entirety (802 s), and the high-temperature radiation zone disappeared. In general, while the high-temperature radiation band appears on both sides, a large area of radiation also appears in the middle of the rock sample and extends to the upper and lower ends in parallel to the loading direction, and finally the bands of progression follow the loading diagonally through.
Figure 7 shows the infrared thermal image sequence of specimen C17 during uniaxial compression loading. The thermal image map shows that the overall temperature distribution of the rock sample at the beginning (0 s) was uniform, and the temperature field on the specimen surface was uniform from the beginning of loading to 600 s. There was a steady upward trend when high-temperature radiation bands began to emerge; at 600 s, high-temperature radiation bands began to appear in the middle of the specimen; with the loading, the range of high-temperature radiation bands gradually expanded (650 s), mainly concentrated in the lower and middle parts of the specimen. There was a trend of gradual penetration, where more small high-temperature radiation bands appeared on both sides of the specimen, and expanded outward, which indicates that the rock sample has begun to rupture, accompanied by fragments falling; when loaded to 720 s (specimen tilt), the temperature sharply increased, and the high-temperature radiation zone was mainly concentrated at the bottom, middle and sides of the rock sample, and formed the penetration. At this time the rock sample was violently damaged; at 721 s, the rock sample had broken and began to fall off the test bench; at 722 s, the upper part of the test piece fell off, and the bottom remained. In general, the high-temperature radiation belt first appeared in the middle and lower part of the sample. As the loading progresses, the bands extend further down parallel to the loading direction, eventually showing severe end effects.

3.3. AIRT Evolutionary Characteristics during Loading

The infrared radiation temperature is an important indicator of the intensity of infrared radiation, and each pixel in a thermal image taken by a thermal imaging camera corresponds to a radiation temperature [23,24,25]. To analyze the infrared radiation energy of the specimen as a whole, the average infrared radiation temperature (AIRT) of its surface was used as a statistical measure, the AIRT–time change of each specimen was analyzed, and the relevant AIRT–time curve is plotted. Since the loading method is equal displacement rate loading, the AIRT–time curve has an identical form to the AIRT–displacement curve. In this paper, the infrared evolution of rocks in different deformation and failure stages was analyzed in combination with AIRT–displacement and stress–displacement curves, as shown in Figure 8, Figure 9 and Figure 10.
In Figure 8, Figure 9 and Figure 10, in the OA (microfracture compaction stage) and AB segments (elastic deformation stage), the surface radiation temperature of the rock specimen takes the ambient temperature as the axis and fluctuates in the range of ±0.1 °C, where the temperature rapidly increased in the late AB section and BC section (fracture expansion and development stage); when approaching the peak stress point (near point C in the BC section), the temperature sharply increased; after destruction, the temperature sharply decreased to the ambient temperature (after the C point). The average surface temperature of the three specimens varied in magnitude, A1 had the largest variation (1.6 °C), followed by B19 (0.6 °C) and C17. The temperature change was minimal (0.4 °C).
Analysis of these results shows that the change in average infrared radiation temperature of the rock specimen is closely related to the compression deformation stage of the rock. In the initial and elastic deformation stages, due to the small stress, coupled with the large porosity of the sandstone in this experiment (approximately 5%), the particles are not tightly connected, so the temperature change of the rock surface at this stage is very small. The distribution is uniform, and there is no obvious differentiation. In the late elastic deformation phase and plastic deformation phase, the stress is large and the rock voids are compacted, so the temperature rapidly increases; in addition, due to different forces in different areas of the rock, the temperature changes vary, which is mainly manifested as the phenomenon of differentiation of temperature, with the increase in stress, the differentiation phenomenon becomes increasingly significant, and gradually concentrates on the overall fracture position.
The porosity, strength and temperature variation during uniaxial compression loading of specimens A1, B19 and C17 are shown in Table 2. Comparing the surface temperature changes of the three rock specimens in the uniaxial compression loading process and their porosity and strength, the rock surface temperature changes, and its strength is closely related to the porosity, greater strength corresponds to a smaller porosity and a greater change in surface temperature of the rock during loading (such as A1). Smaller strength and greater porosity correspond to a smaller change in surface temperature during the force action on the rock (such as C17).

3.4. Energy Analysis during Loading

From the thermodynamic considerations, the essence of rock instability and destruction is the drive conversion of energy, i.e., the process of energy accumulation and dissipation. Assuming that there is no heat exchange during the loading process, according to the principle of energy conservation, in the process of uniaxial compression failure, there are only elastic properties and dissipation energy in the rock system. Elastic energy is mainly used to resist deformation, and dissipation can be used for the germination, expansion and development of fissures. The work done by the testing machine on the rock sample is as follows:
W = Fdu = ALK
where A and L are the area and length, respectively; K is the work done by the testing machine on the unit volume material and equivalent to the area below the stress–strain curve. Combining the four stages of the curves, the piecewise functions of energy are fitted and integrated by MATLAB, and the unit is MJ/m3.
Divide the stress–strain curve into four stages (as shown in Figure 11):
(1)
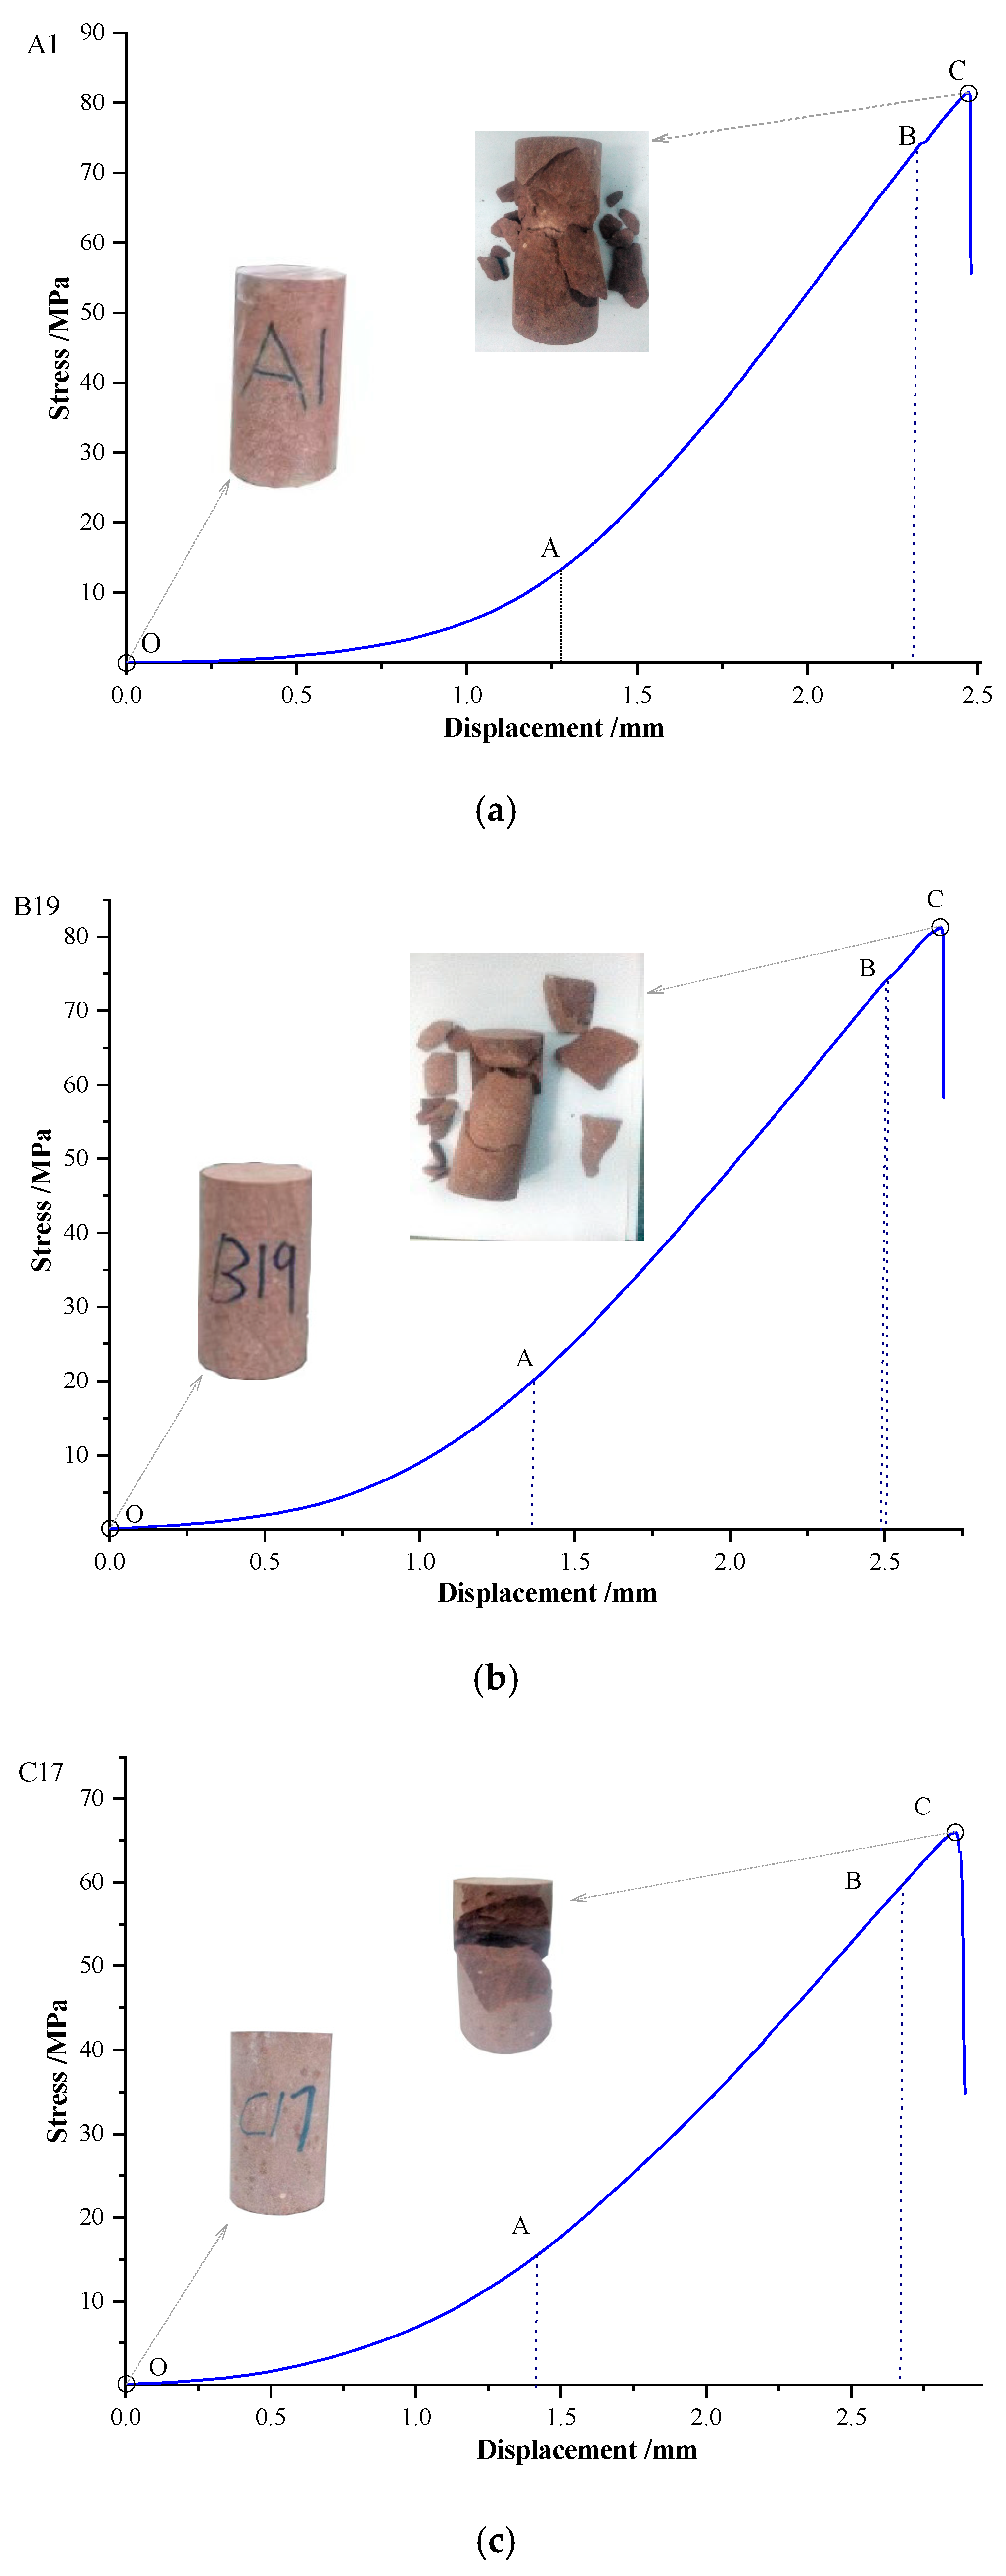
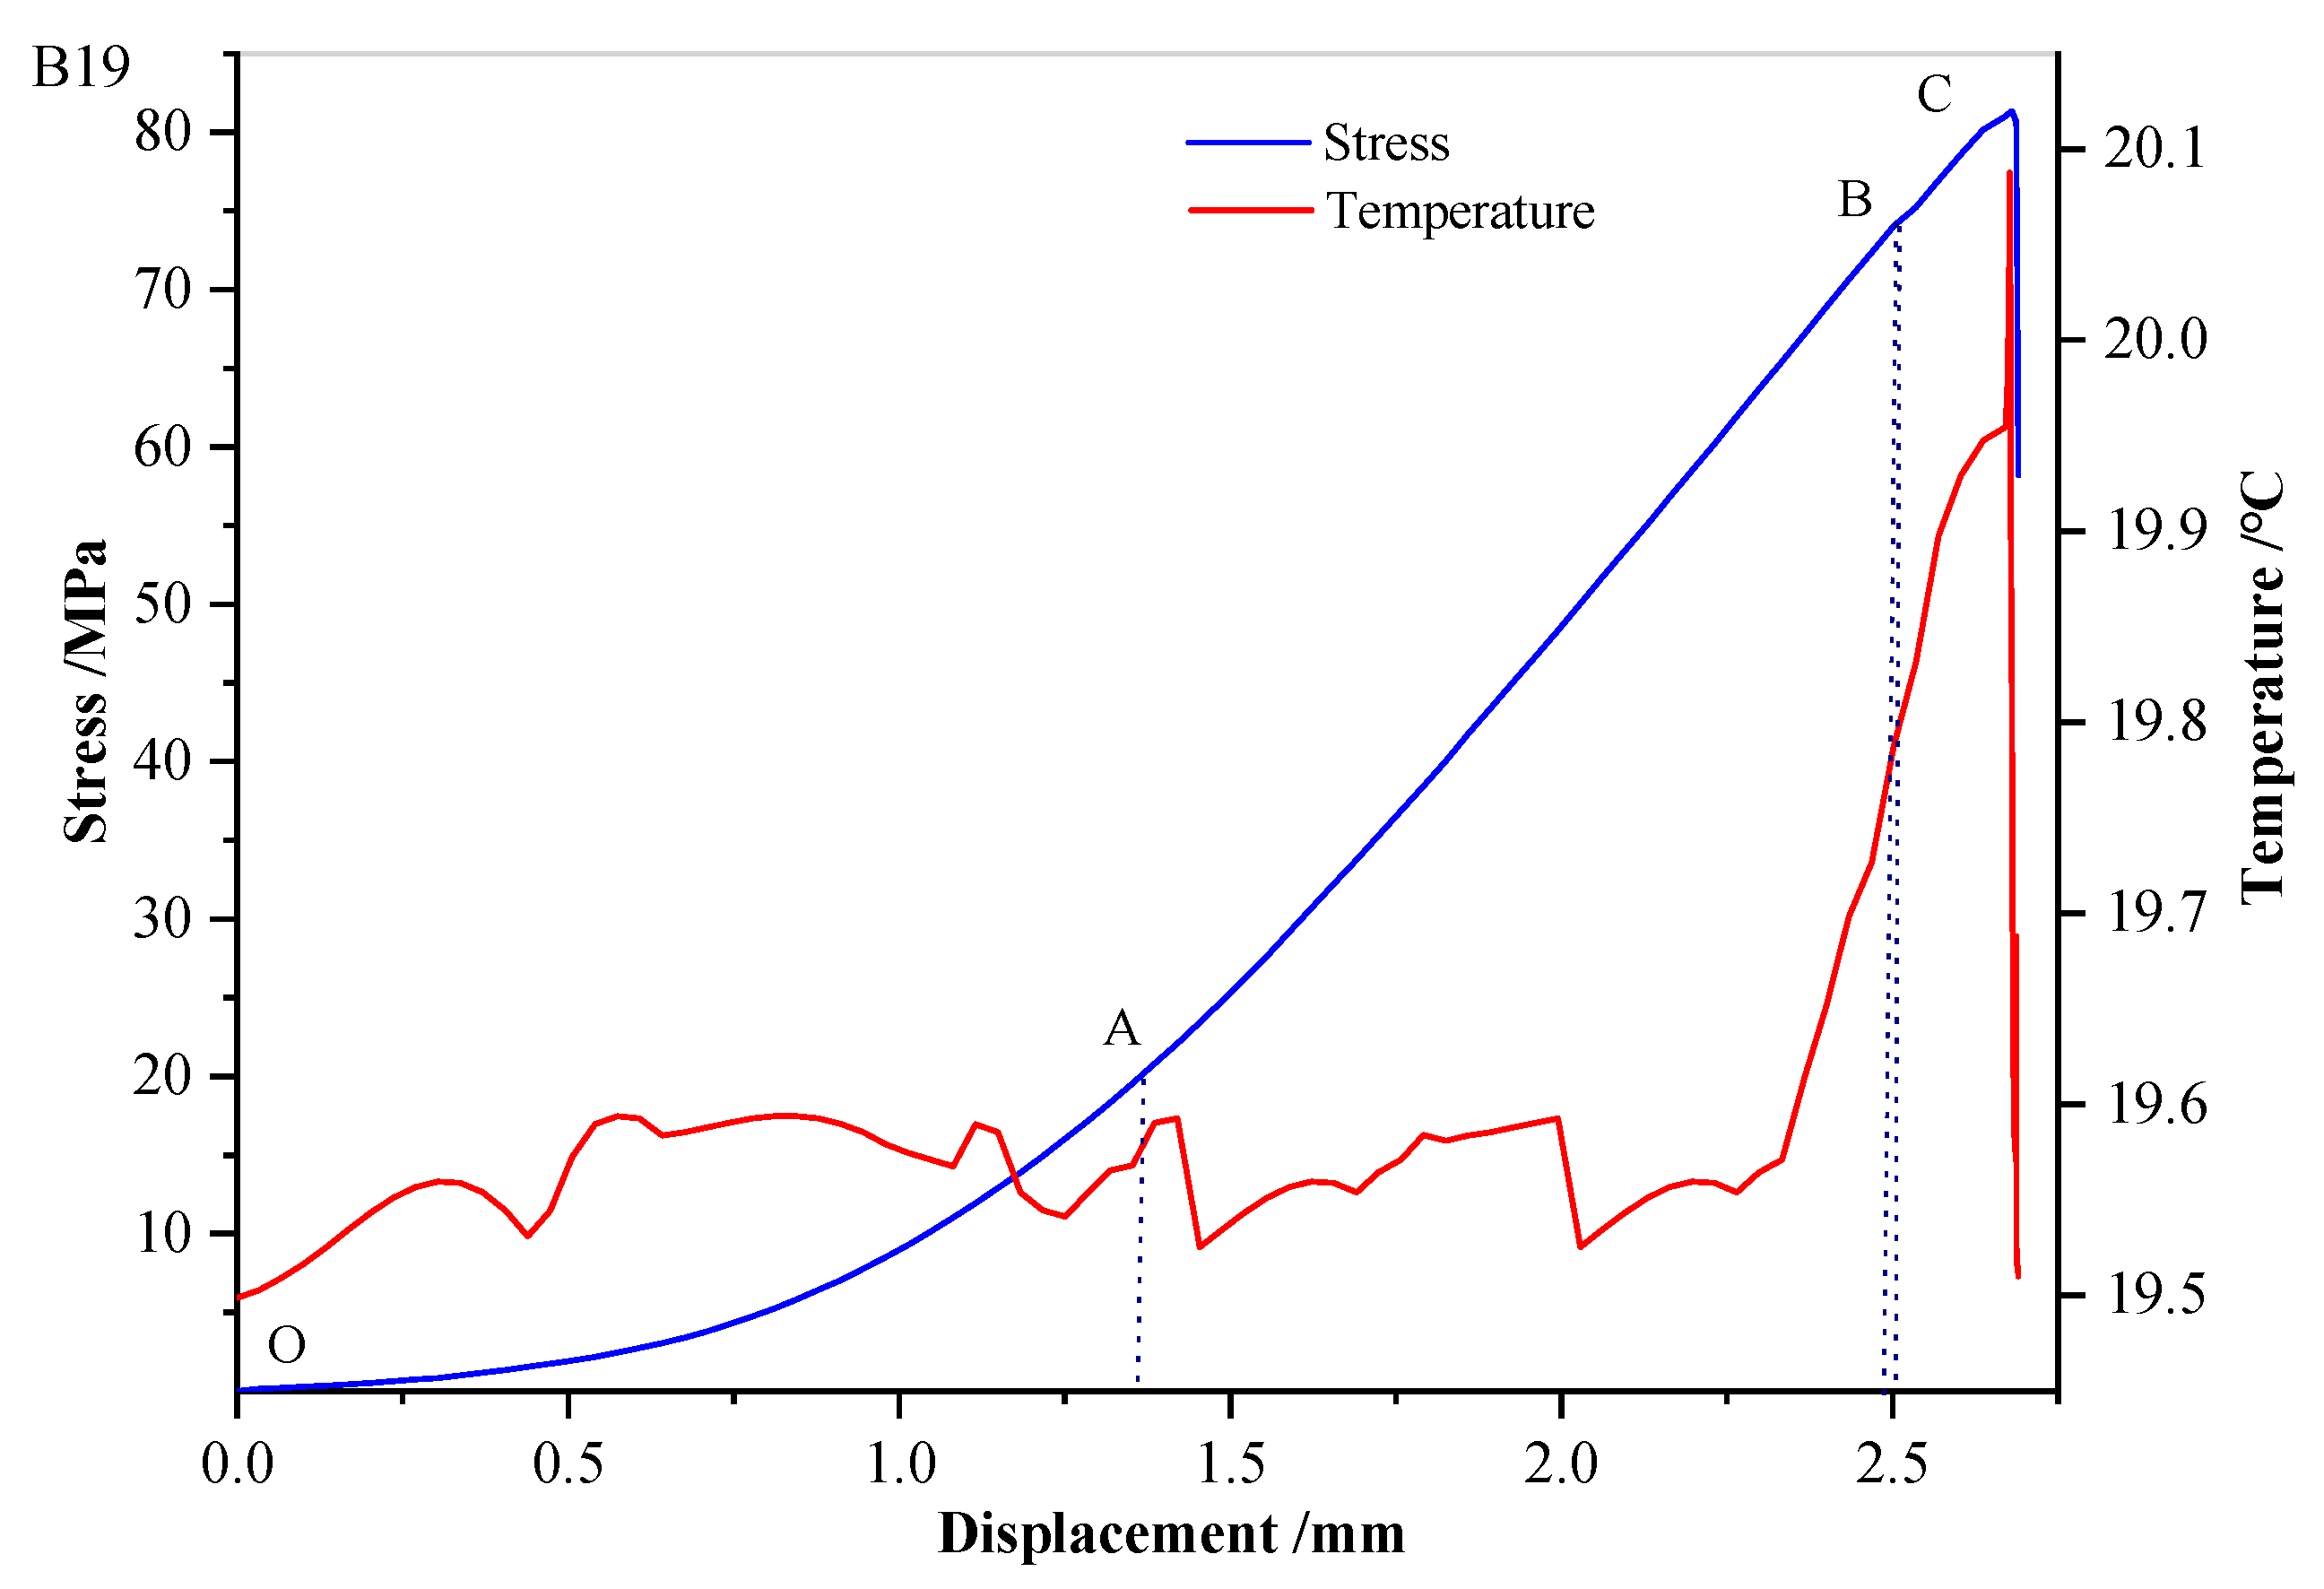
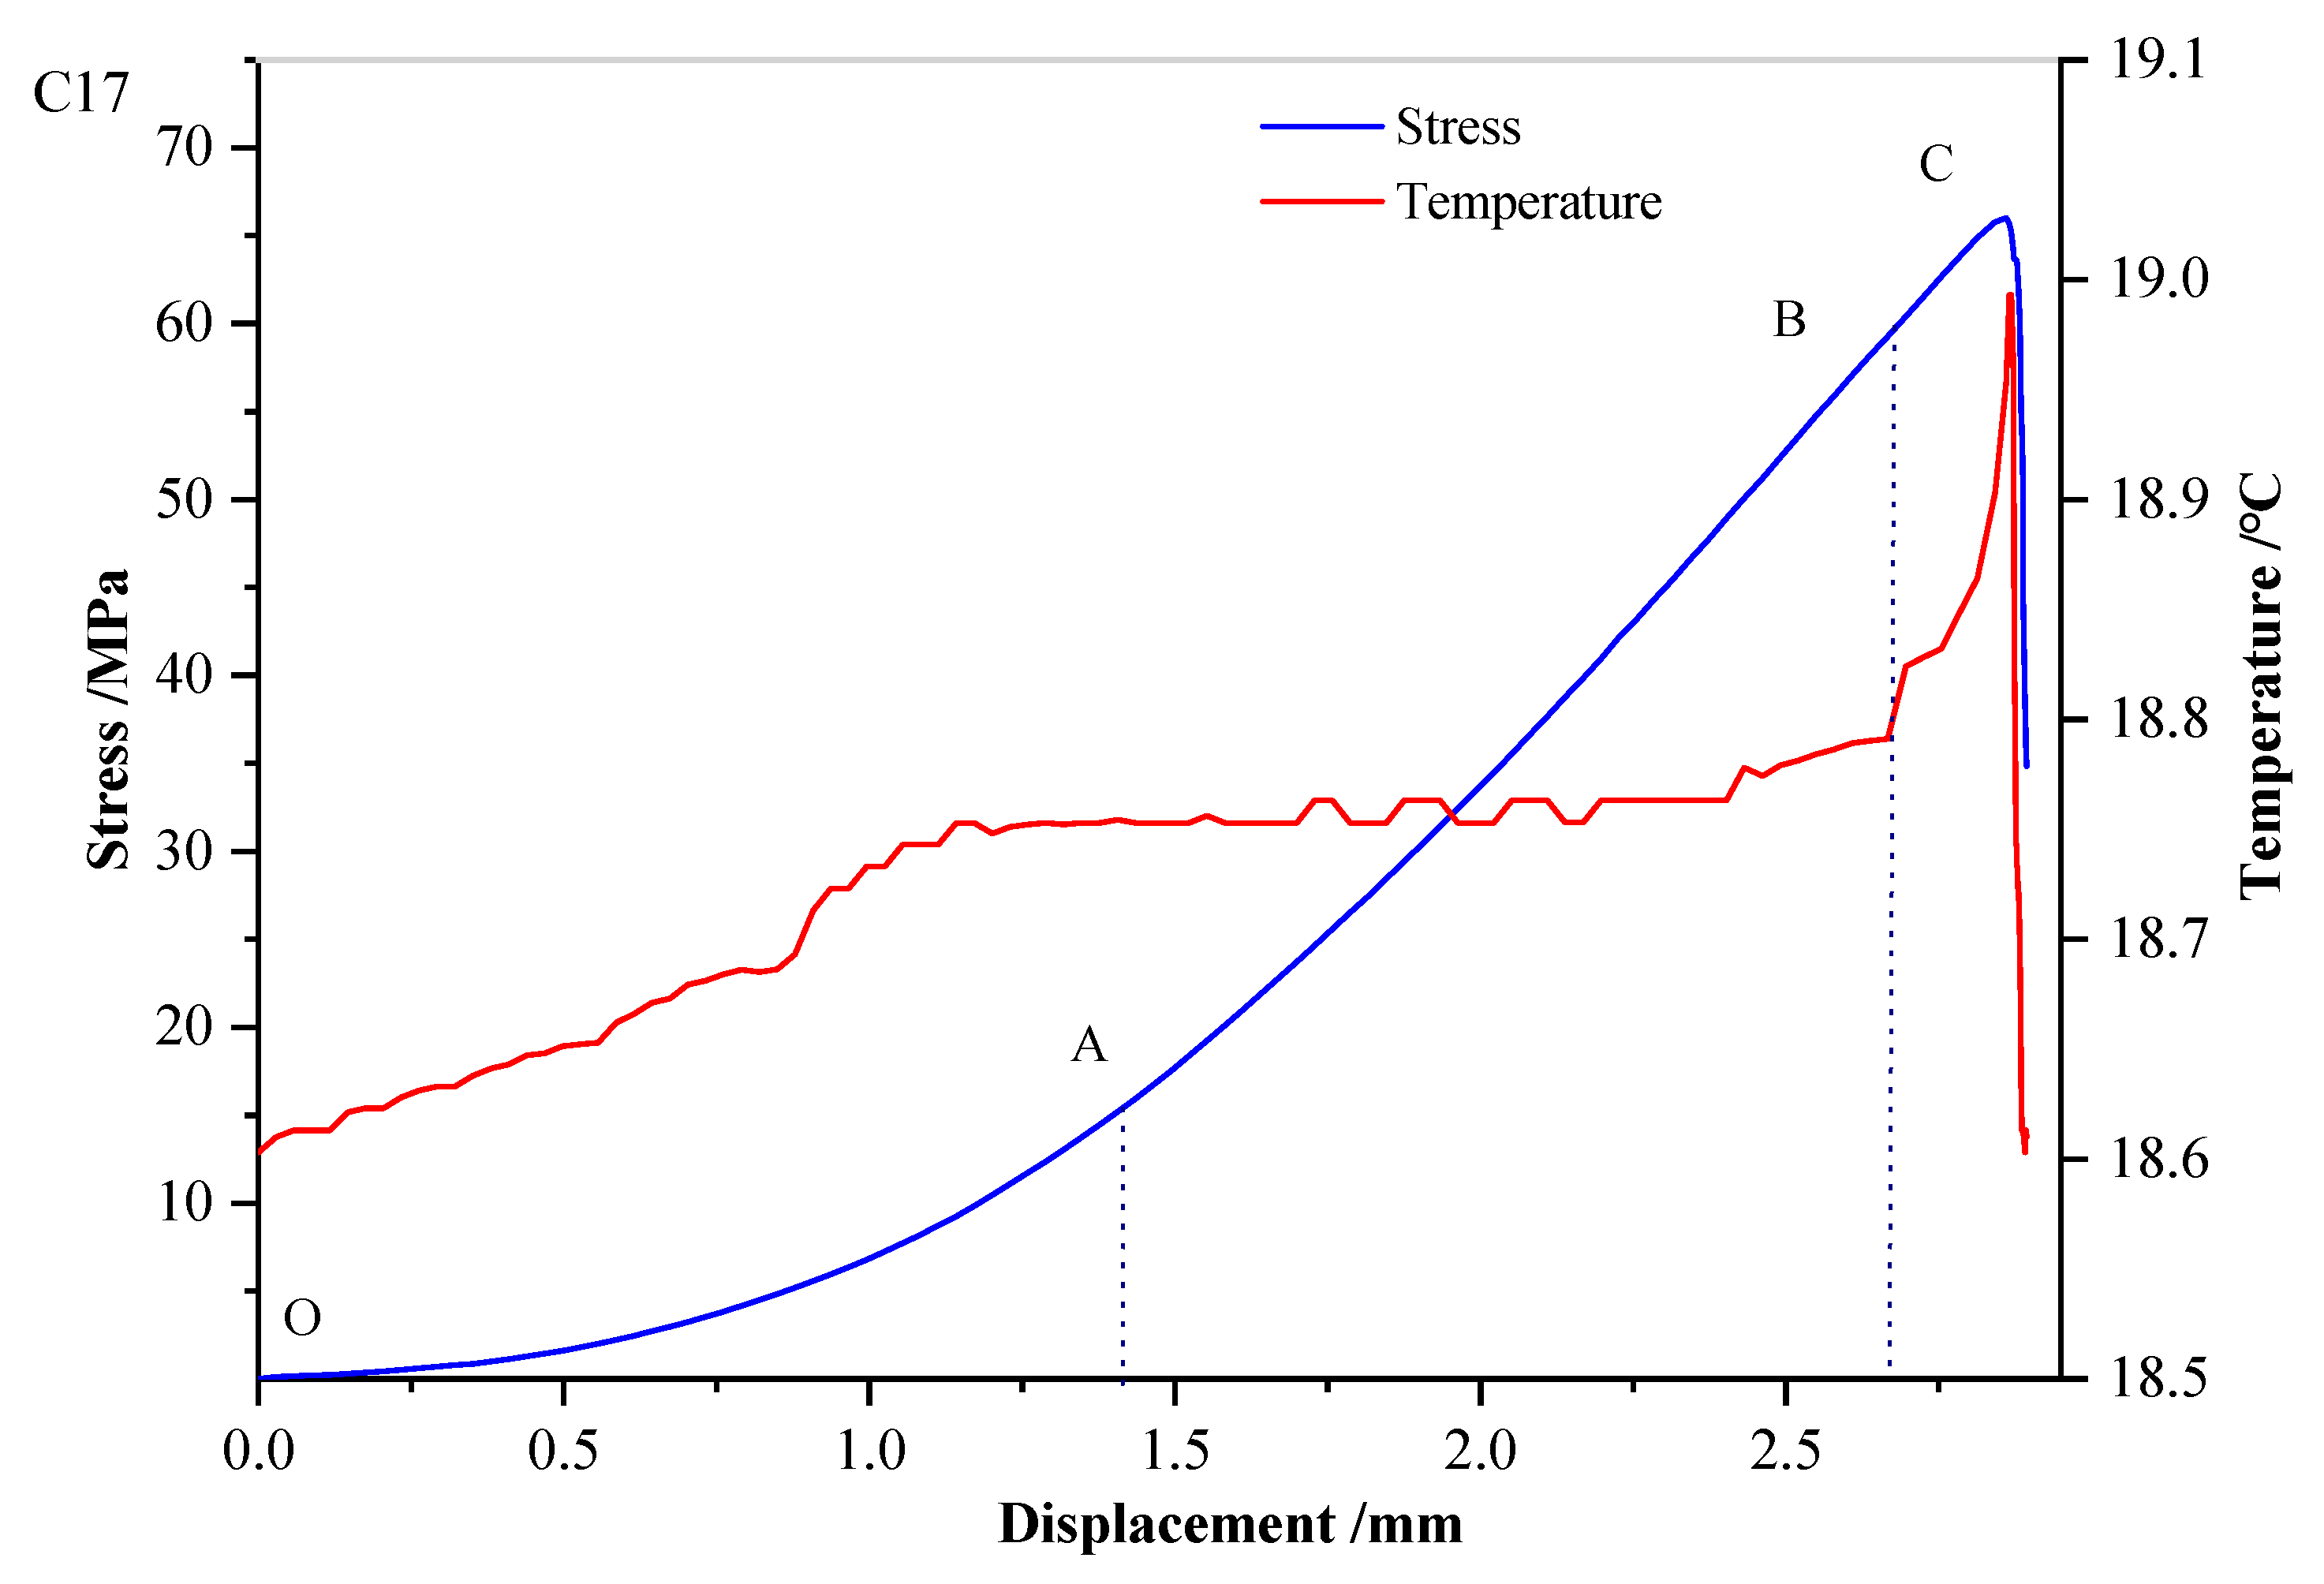
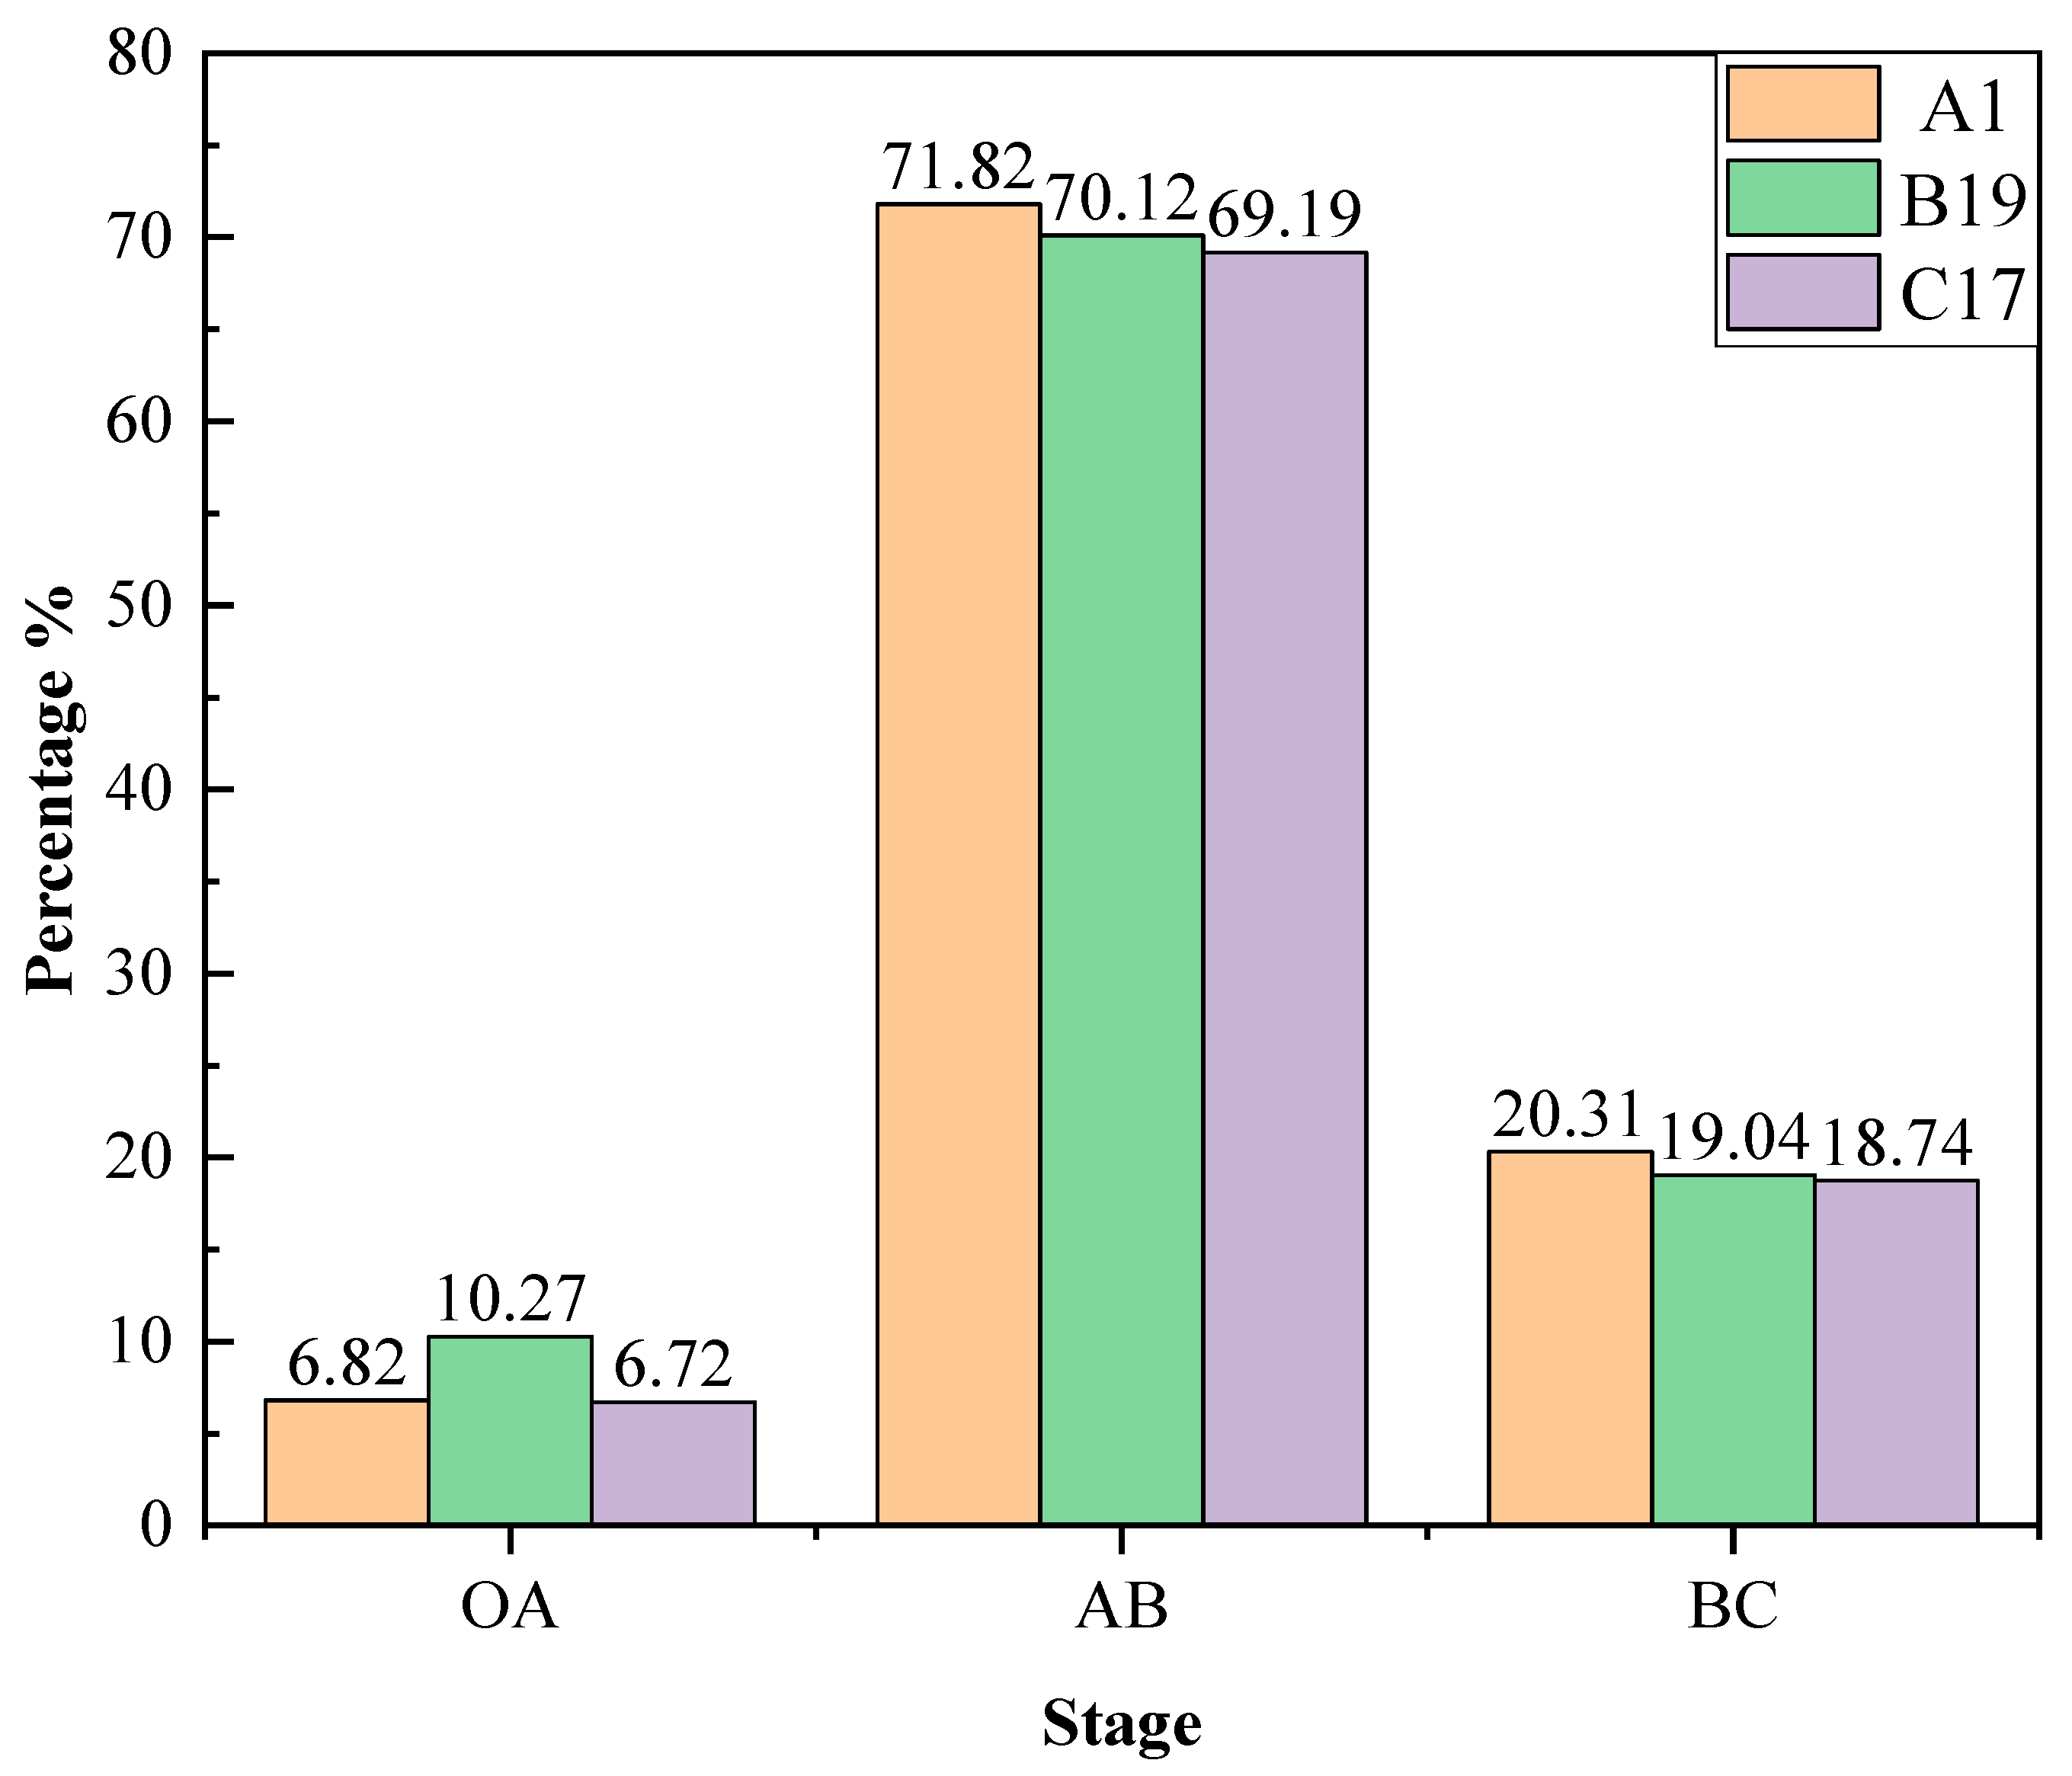
Microfracture compaction stage (OA segment): At this stage, no microcracks are generated, all work done by the testing machine is converted into the elastic energy of the rock sample, and there is basically no energy dissipation. The energy absorbed by the three rock samples was 4.06, 7.67 and 6.72, and the corresponding ratios of the entire process were 6.82%, 10.27% and 6.72%, respectively. The rate is small but slowly increases.
(2)
Elastic deformation stage (AB segment): After point A, the microcrack begins to expand, the curve is close to linear growth, and it is in a stable expansion stage. Most of the work of the testing machine is converted into elastic energy, and a small part is converted into dissipative energy. Combined with the temperature curve, when approaching point B, the temperature of the rock sample has increased, which is confirmed by the local temperature increase on the thermal image map. The energy absorbed by the three rock samples was 42.79, 52.37 and 45.10, respectively, and the corresponding ratios were 71.82%, 70.12% and 69.19%. The energy absorption stage of this rock sample accounts for a large proportion and has a fast rate, which provides an energy basis to destroy the rock sample in the later stage.
(3)
Fracture expansion and development stage (BC stage): With increasing stress, the crack expands macroscopic plastic yielding occurs, and the crack is in the stage of accelerated unstable expansion. Most of the work of the testing machine is converted into dissipative energy, and the rate shows an increasing trend; a small part of the work is converted into elastic energy, but the rate is lower than before. After point B, the temperature curve sharply rises, when it reaches point C, there is a brief stagnation. Currently, on the thermal image map, there is large-scale warming at the place where the fault is about to occur. The energy absorbed by the three rock samples at this stage was 12.10, 14.22 and 12.22, which corresponds to 20.31%, 19.04% and 18.74%, respectively. The rate of energy absorption is reduced compared to the AB stage, but it is still much higher than the OA stage.
(4)
Post–peak destruction phase (after point C): After the elastic energy of the rock sample reaches its peak at point C, due to the further acceleration of crack propagation, the elastic energy is rapidly released. In Figure 8, Figure 9 and Figure 10, this stage has a temperature rise with an angle of almost 90°. The energy absorption process of this short-lived process is negligible, mainly the energy release of the rock sample destruction process. Combined with the thermal image map, the temperature after the destruction of the rock sample returns to room temperature in a very short time.
Combined with the above results, three rock samples have different porosity, and the proportion of energy absorbed by rock specimens at different stages of compression loading is not affected. However, there is a difference in energy absorption in the same period among the three rocks, due to the porosity and strength of the specimens. In general, the strength of the rock decreases with the increase of porosity, the amount of energy absorbed by the rock during different loading and compression periods is positively correlated with porosity and strength. Although specimens A and B have similar strengths, the reduction of porosity decreases the absorbed energy; specimen C has the greatest porosity, while lower intensity results in shorter loading times, but the absorbed energy remains higher than that of specimen A, so the effect of intensity on energy absorption is greater than that of porosity.

4. Conclusions

Based on parallel experiments of uniaxial compression and infrared detection of rocks, this paper deeply analyses the variation characteristics of the surface infrared radiation temperature of rocks during force destruction and the evolution of infrared thermal images. The main conclusions are as follows:
(1)
The infrared thermal image sequence diagram and rock failure morphology of the surface during the uniaxial compression loading process of rock are analyzed, and the evolution law of infrared thermal images during the rock force failure process is mainly manifested as follows: With the increase in stress and compaction of the void, the high temperature radiation belt gradually appears in the thermal image of the rock, gradually concentrates on penetration, and finally produces fracture failure at penetration; the destructive form of the rock and size of the debris are related to the location and area of the high temperature radiation zone.
(2)
The zone also could reflect the shape of rock fractures, the cracks of the rock firstly arise in the inner or marginal part of the middle, develop stepwise under load, and eventually form a penetrating fracture that extends from the upper part of one side to the middle and lower part of the other side. With the increase of rock porosity, the distribution area of internal failure increases with the weakening of energy concentration. However, when the porosity increases further, the crack development area of sample is transferred from the middle and upper part to the middle and lower part, and a large area of blocky distribution cracks appears at the bottom with severe end effect. Further studies of this phenomena will be carried out in the future.
(3)
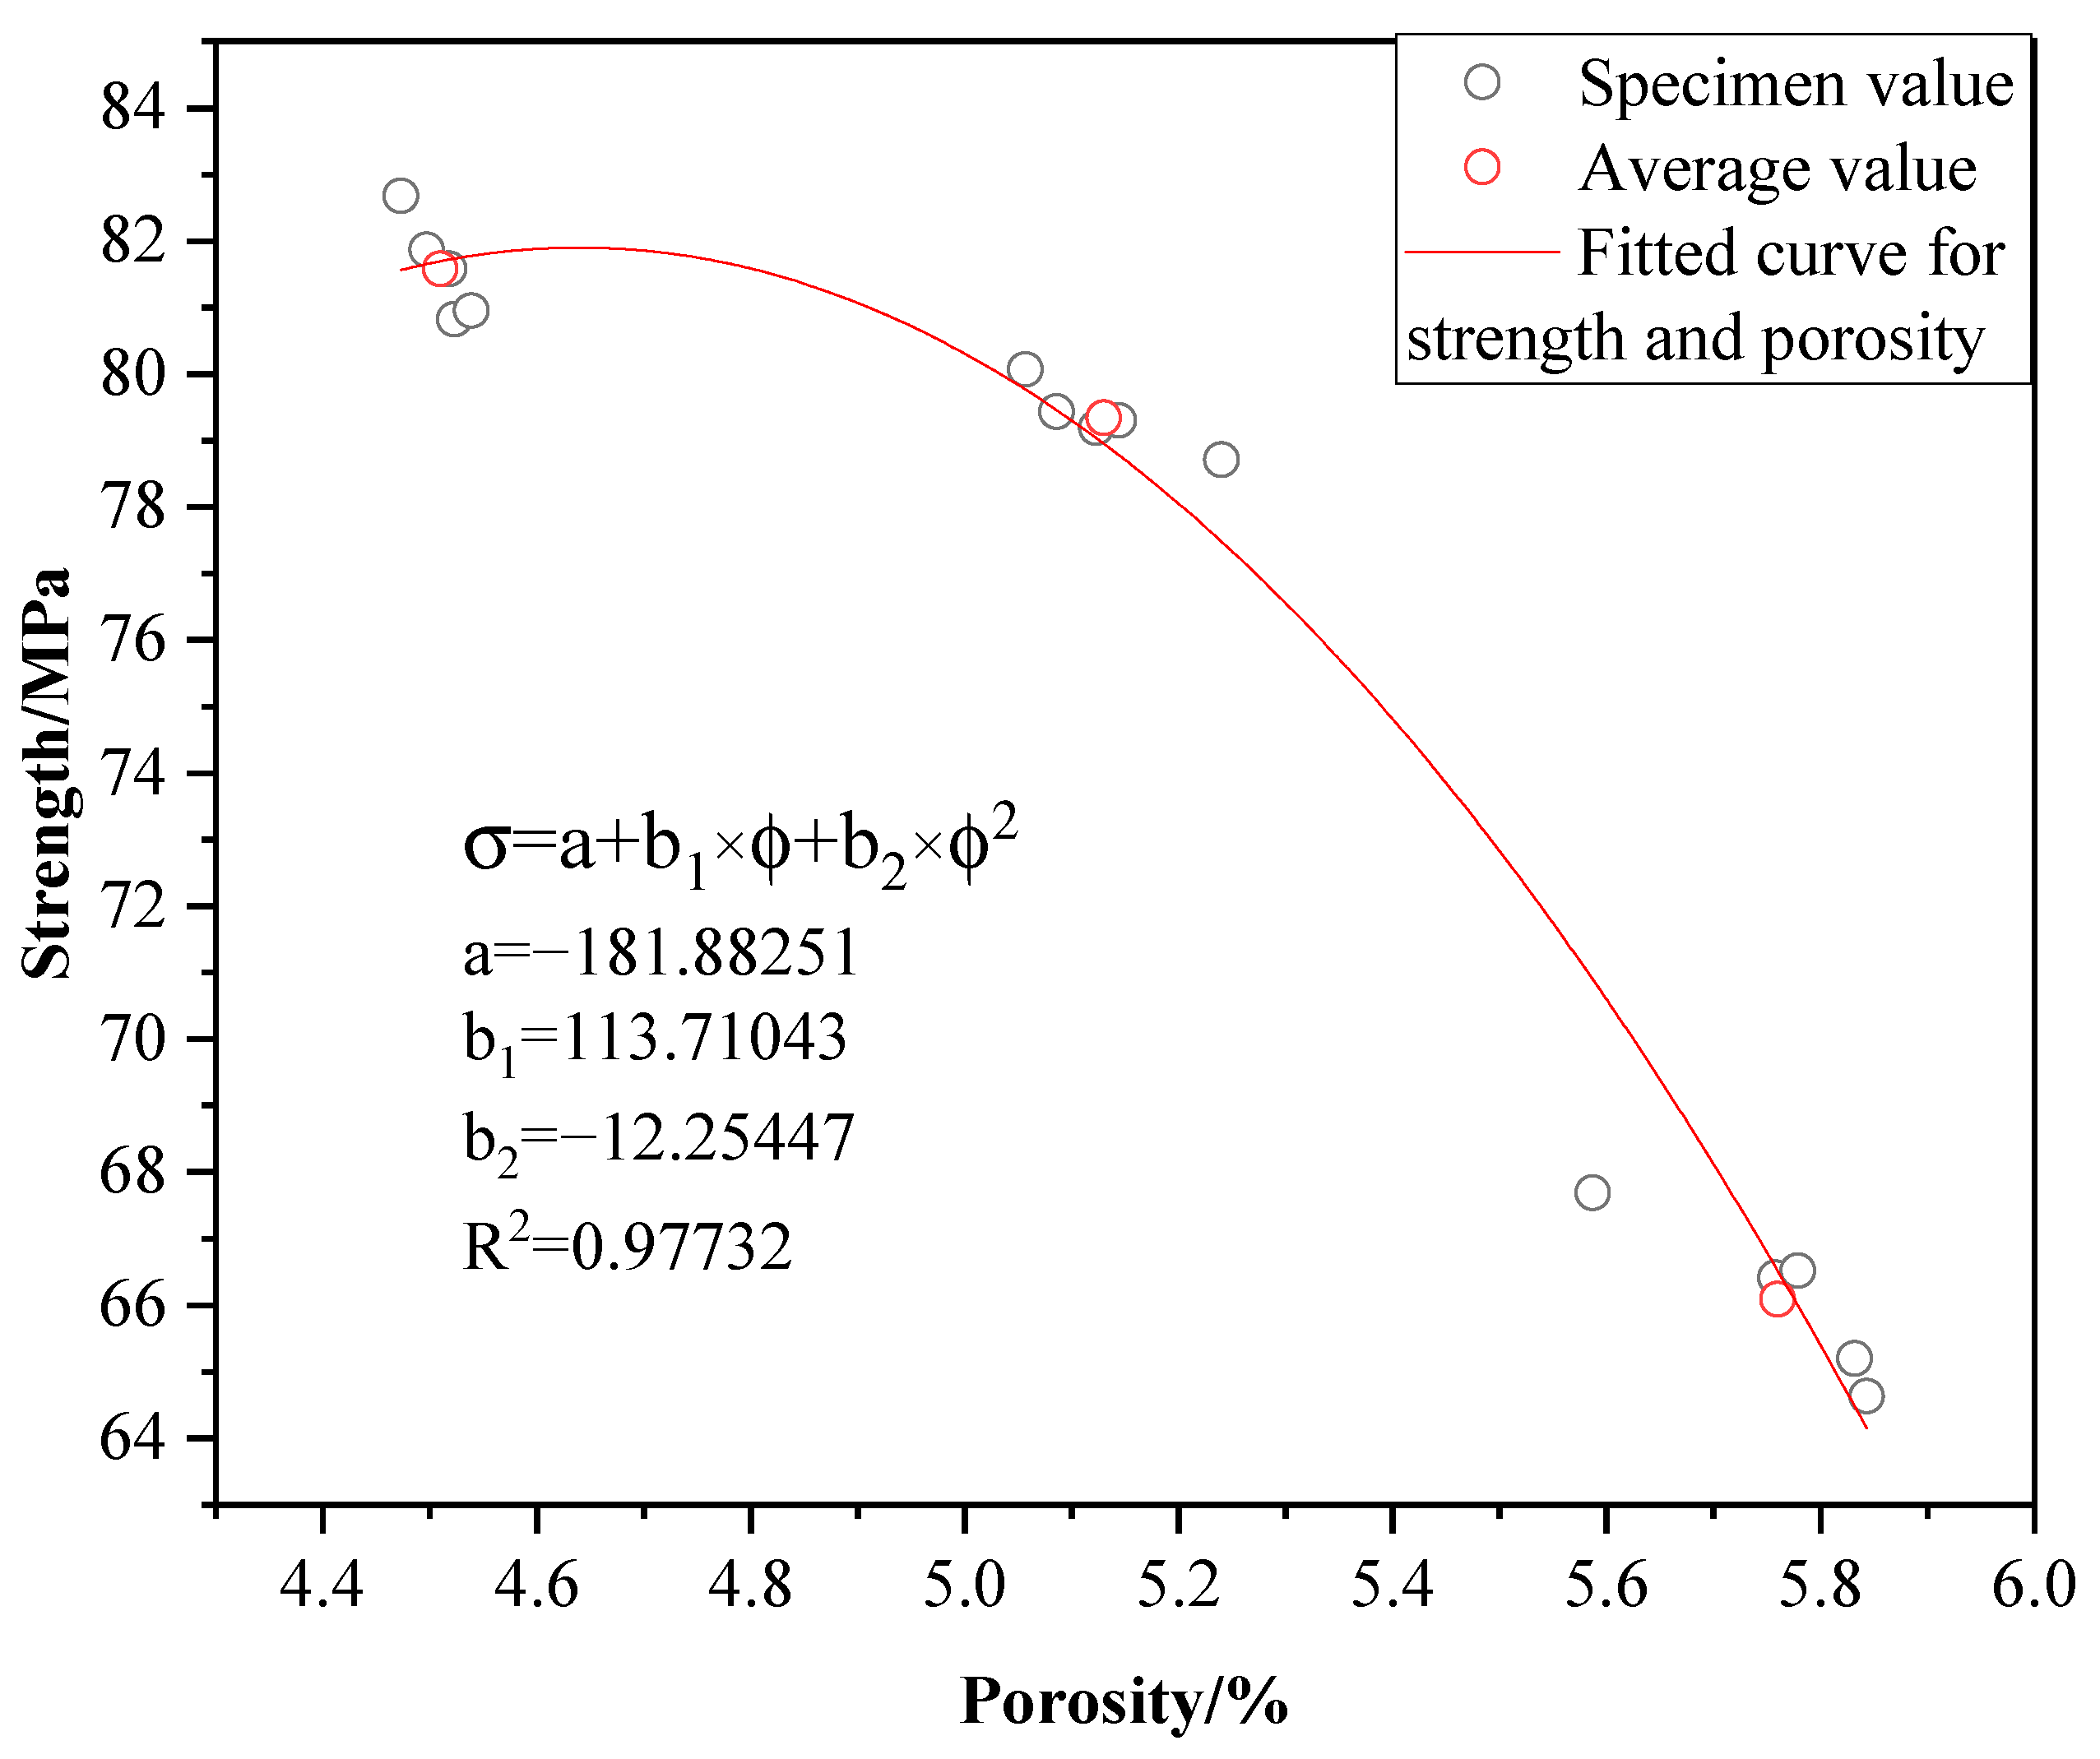
During the uniaxial compression loading process of rock, strength of the sandstone decreases with the increase of porosity. With the same amplitude changes of porosity, the strength changes of the samples can up to six or seven times, showing an exponential relationship. The change in AIRT on its surface and energy evolution has obvious stages, and corresponds to several deformation stages of force damage to rock, especially in the accelerated deformation and failure stages. The AIRT on the rock surface sharply rises and then subsequently sharply falls after the destruction. The AIRT evolutionary characteristics of rock surfaces have very significant directivity and can show the energy evolution of different regions of the samples, which can provide a basis for the analysis of force catastrophes of rock masses.
(4)
Many factors affect the surface infrared radiation temperature during the stress process of the rock, such as the moisture content of the rock, loading method, and loading rate, which affect the infrared thermal image detection effect and accuracy of the rock. Therefore, attention should be given to eliminating interference during the test process. In future test processes, the quantitative relationship between each relevant factor and the infrared radiation temperature on the rock surface should be strengthened, to damage the rock by a force stability analysis of the rock mass using a viable method.

Author Contributions

Conceptualization, Y.L. and Z.P. conceived and designed the experiments; Y.L. and Z.Z. performed the experiments; K.Z. and Z.G. contributed materials and theoretical foundations; Y.L. and Z.Z. wrote the paper. All authors have read and agreed to the published version of the manuscript.

Funding

The authors are grateful for the financial supports from the National Natural Science Foundation of China (No. 52104109), the open sharing fund of the large-scale instruments and equipments of central south university (No. CSUZC202211), and the open fund research project supported by state key labouratory of strata intelligent control and green mining co-founded by Shandong province and the ministry of science and technology (No. SICGM202201).

Institutional Review Board Statement

Not applicable.

Informed Consent Statement

Not applicable.

Data Availability Statement

Not applicable.

Conflicts of Interest

The authors declare no conflict of interest.

References

  1. Ma, L.Q.; Zhang, Y.; Sun, H.; Wang, S.K.; Najeem, A. Experimental study on dependence of infrared radiation on stress for coal fracturing process. J. China Coal Soc. 2017, 42, 140–147. [Google Scholar]
  2. Liqiang, M.A.; Shuokang, W.; Dongsheng, Z. Infrared radiation noise characteristics and its denosing method during coal uniaxial compression loading test. J. Min. Saf. Eng. 2017, 34, 114–120. [Google Scholar]
  3. Zhang, L.; Chen, Y. Evaluation of plant tolerance to environmental dust pollution based on infrared thermography. Acta Ecol. Sin. 2016, 36, 7960–7970. [Google Scholar]
  4. Gu, Z.; Zhou, K. Mechanical properties and infrared analysis of granite under uniaxial cyclic loading. J. Saf. Sci. Tech. 2018, 14, 146–151. [Google Scholar]
  5. Sheinin, V.I.; Blokhin, D.I. Features of thermomechanical effects in rock salt samples under uniaxial compression. J. Min. Sci. 2012, 48, 39–45. [Google Scholar] [CrossRef]
  6. Ma, L.; Zhang, Y.; Cao, K.; Wang, Z. An Experimental Study on Infrared Radiation Characteristics of Sandstone Samples Under Uniaxial Loading. Rock Mech. Rock Eng. 2019, 52, 3493–3500. [Google Scholar] [CrossRef]
  7. Wu, L.; Liu, S.; Wu, Y.; Wang, C. Precursors for rock fracturing and failure—Part II: IRR T-Curve abnormalities. Int. J. Rock Mech. Min. 2006, 43, 483–493. [Google Scholar] [CrossRef]
  8. Wu, L.X.; Liu, S.J.; Wu, Y.; Li, Y. Remote sensing-rock mechanics (I)—Laws of thermal infrared radiation from fracturing of discontinous jointed faults and its meanings for tectonic earthquake omens. Chin. J. Rock Mech. Eng. 2004, 23, 24–30. [Google Scholar]
  9. Liu, S.J.; Wu, L.X.; Zhang, Y.B. Temporal-Spatial Evolution Features of Infrared Thermal Images Before Rock Failure. J. Northeast. Univ. Nat. Sci. 2009, 30, 1034–1038. [Google Scholar]
  10. Ma, L.; Sun, H. Spatial–temporal infrared radiation precursors of coal failure under uniaxial compressive loading. Inffrared Phys. Tech. 2018, 93, 144–153. [Google Scholar] [CrossRef]
  11. Zhou, Z.; Chang, Y.; Cai, X. Experimental study of infrared radiation effects of rock with different loading rates. J. Cent. South Univ Sci. Technol. 2019, 50, 1127–1134. [Google Scholar]
  12. Cao, K.; Ma, L.; Wu, Y.; Spearing, A.S.; Khan, N.M.; Hussain, S.; Rehman, F.U. Statistical damage model for dry and saturated rock under uniaxial loading based on infrared radiation for possible stress prediction. Eng. Fract. Mech. 2022, 260, 108134. [Google Scholar] [CrossRef]
  13. Tang, Y.; Liu, J.; Hao, T.; Li, F.; Zhao, L. Failure mechanics and infrared radiation characteristics of soft coal at various moisture contents. Geomat. Nat. Haz. Risk. 2021, 12, 1371–1385. [Google Scholar] [CrossRef]
  14. Wang, C.; Lu, Z.; Liu, L.; Chuai, X.; Lu, H. Predicting points of the infrared precursor for limestone failure under uniaxial compression. Int. J. Rock Mech. Min. 2016, 88, 34–43. [Google Scholar] [CrossRef]
  15. Ma, L.; Sun, H.; Zhang, Y.; Zhou, T.; Li, K.; Guo, J. Characteristics of infrared radiation of coal specimens under uniaxial loading. Rock Mech. Rock Eng. 2016, 49, 1567–1572. [Google Scholar] [CrossRef]
  16. Wu, X.; Gao, X.; Zhao, K.; Liu, J.; Liu, X. Abnormality of transient infrared temperature field (ITF) in the process of rock failure. Chin. J. Rock Mech. Eng. 2016, 38, 1578–1594. [Google Scholar]
  17. Zhang, Y.; Li, J.; Liu, X.; Tian, B. Infrared radiation portentous characteristics of rock burst in roadway. J. Min. Saf. Eng. 2015, 32, 786–792. [Google Scholar]
  18. Tian, B.; Liu, S.J.; Zhang, Y.B.; Liang, P.; Liu, X.X. Laboratory simulation of temporospatial evolution characteristics of infrared radiation in the process of rockburst in granite tunnel. Rock Soil Mech. 2016, 37, 711–718. [Google Scholar]
  19. Hao, X.; Xin-li, H.; Hui-ming, T.; Rui, Y.; Jun-wei, M. Application of infrared thermal radiation imaging technology to landslide physical model test. Rock Soil Mech. 2017, 38, 291–298. [Google Scholar]
  20. Luong, M.P. Infrared thermovision of damage processes in concrete and rock. Eng. Fract. Mech. 1990, 35, 291–301. [Google Scholar] [CrossRef]
  21. Wu, L.; Liu, S.; Wu, Y.; Wu, H. Changes in infrared radiation with rock deformation. Int. J. Rock Mech. Min. 2002, 39, 825–831. [Google Scholar] [CrossRef]
  22. Shanjun, L.; Lixin, W.; Huanping, W.; Yuhua, W.; Tao, C.; Guohua, L. Quantitative study on the thermal infrared radiation og dark mineral rock in condition of uniaxial loading. Chin. J. Rock Mech. Eng. 2002, 21, 1585–1589. [Google Scholar]
  23. Zhang, Y.B.; Liu, X.X.; Liang, Z.Z.; Li, Z.Z. Experimental study of rockburst precursor of granite tunnel based on multi-physical field parameters. Chin. J. Rock Mech. Eng. 2014, 33, 1347–1357. [Google Scholar]
  24. Xu, Z.; Liu, S.; Wu, L.; Feng, Z. Stress-related thermal infrared spectral variation and sensitive waveband of granite. J. Infrared Millim. Waves 2013, 32, 44–49. [Google Scholar] [CrossRef]
  25. Cai, X.; Zhou, Z.; Tan, L.; Zang, H.; Song, Z. Water saturation effects on thermal infrared radiation features of rock materials during deformation and fracturing. Rock Mech. Rock Eng. 2020, 53, 4839–4856. [Google Scholar] [CrossRef]
  26. Van Der Baan, M.; Eaton, D.; Dusseault, M. Microseismic Monitoring Developments in Hydraulic Fracture Stimulation. In Proceedings of the ISRM International Conference for Effective and Sustainable Hydraulic Fracturing, Brisbane, Australia, 20–22 May 2013. [Google Scholar]
  27. Du, K.; Li, X.; Tao, M.; Wang, S. Experimental study on acoustic emission (AE) characteristics and crack classification during rock fracture in several basic lab tests. Int. J. Rock Mech. Min. 2020, 133, 104411. [Google Scholar] [CrossRef]
  28. Li, J.L.; Zhou, K.P.; Liu, W.J.; Deng, H.W. NMR research on deterioration characteristics of microscopic structure of sandstones in freeze−thaw cycles. Trans. Nonferrous Met. Soc. China 2016, 26, 2997–3003. [Google Scholar] [CrossRef]
  29. Bieniawski, Z.T.; Hawkes, I. Suggested methods for determining tensile strength of rock materials. Int. J. Rock Mech. Min. Sci. Geomech. Abstr. 1978, 15, 99–103. [Google Scholar]
  30. Xia, K.; Yao, W. Dynamic rock tests using split Hopkinson (Kolsky) bar system—A review. J. Rock Mech. Geotech. 2015, 7, 27–59. [Google Scholar] [CrossRef] [Green Version]
  31. Zhou, Z.; Cai, X.; Cao, W.; Li, X.; Xiong, C. Influence of water content on mechanical properties of rock in both saturation and drying processes. Rock Mech. Rock Eng. 2016, 49, 3009–3025. [Google Scholar] [CrossRef]
  32. Liu, S.; Wu, L. Infrared Radiation Effect of Rock Stress; Metallurgical Industry Press: Beijing, China, 2005. [Google Scholar]
  33. Wu, L.; Cui, C.; Geng, N.; Wang, J. Remote sensing rock mechanics (RSRM) and associated experimental studies. Int. J. Rock Mech. Min. 2000, 37, 879–888. [Google Scholar] [CrossRef]
  34. Wu, L.; Liu, S.; Wu, Y. Introduction to Remote Sensing Rock Mechanics: Infrared Remote Sensing for Rock Catastrophe due to Overloaded; Science Press: Beijing, China, 2007. [Google Scholar]
  35. Liu, S.J.; Wu, L.X.; Wang, C.Y.; Ge, D.Q.; Wu, Y.H. Remote sensing-rock mechanics((VIII)—TIR omens of rock fracturing. Chin. J. Rock Mech. Eng. 2004, 23, 1621–1627. [Google Scholar]
Figure 1. Mineral composition of sandstone specimen.
Sustainability 14 07698 g001
Figure 2. Schematic diagram of rock-loaded infrared radiation detection.
Sustainability 14 07698 g002
Figure 3. Strength-porosity fitted curve of specimen set. (σ is strength; φ is porosity; a, b1, b2 are constants).
Sustainability 14 07698 g003
Figure 4. Stress–strain curve of uniaxial compression of rock. (OA: microfracture compaction stage; AB: elastic deformation stage; BC: fracture expansion and development stage; C: destruction point). (a) Stress–strain curve of uniaxial compression of A1 specimen; (b) Stress–strain curve of uniaxial compression of B19 specimen; (c) Stress–strain curve of uniaxial compression of C17 specimen.
Sustainability 14 07698 g004
Figure 5. Typical thermal image sequence during uniaxial compression of the A1 specimen.
Sustainability 14 07698 g005
Figure 6. Typical thermal image sequence during uniaxial compression of the B19 specimen.
Sustainability 14 07698 g006
Figure 7. Typical thermal image sequence during uniaxial compression of C17 specimens.
Sustainability 14 07698 g007
Figure 8. AIRT evolution curve of specimen A1 (OA: microfracture compaction stage; AB: elastic deformation stage; BC: fracture expansion and development stage; C: destruction point).
Sustainability 14 07698 g008
Figure 9. AIRT evolution curve of specimen B19 (OA: microfracture compaction stage; AB: elastic deformation stage; BC: fracture expansion and development stage; C: destruction point).
Sustainability 14 07698 g009
Figure 10. AIRT evolution curve of specimen C17 (OA: microfracture compaction stage; AB: elastic deformation stage; BC: fracture expansion and development stage; C: destruction point).
Sustainability 14 07698 g010
Figure 11. Contrast of energy released at different stages of the rock samples.
Sustainability 14 07698 g011
Table 1. Average porosity and strength of the specimen set.
No.Group AGroup BGroup C
Porosity/%Strength/MPaPorosity/%Strength/MPaPorosity/%Strength/MPa
4.47382.685.05780.075.58767.69
4.49781.875.08679.435.75866.41
4.51881.585.12379.195.77966.52
4.52380.825.14479.305.83265.20
4.53980.955.24078.715.84364.63
Average4.5181.585.1379.345.7666.09
Standard deviation0.0260.7530.0700.4900.1031.201
Table 2. Porosity and strength of the specimen.
No.A1B19C17
porosity/%4.515.135.76
strength/MPa81.5881.3466.09
Temperature change/°C1.600.600.40
Publisher’s Note: MDPI stays neutral with regard to jurisdictional claims in published maps and institutional affiliations.

