
The Impact of COVID-19 on the Choice of Transport Means in Journeys to Work Based on the Selected Example from Poland


Abstract
:1. Introduction
2. Materials and Methods
2.1. Description of Survey
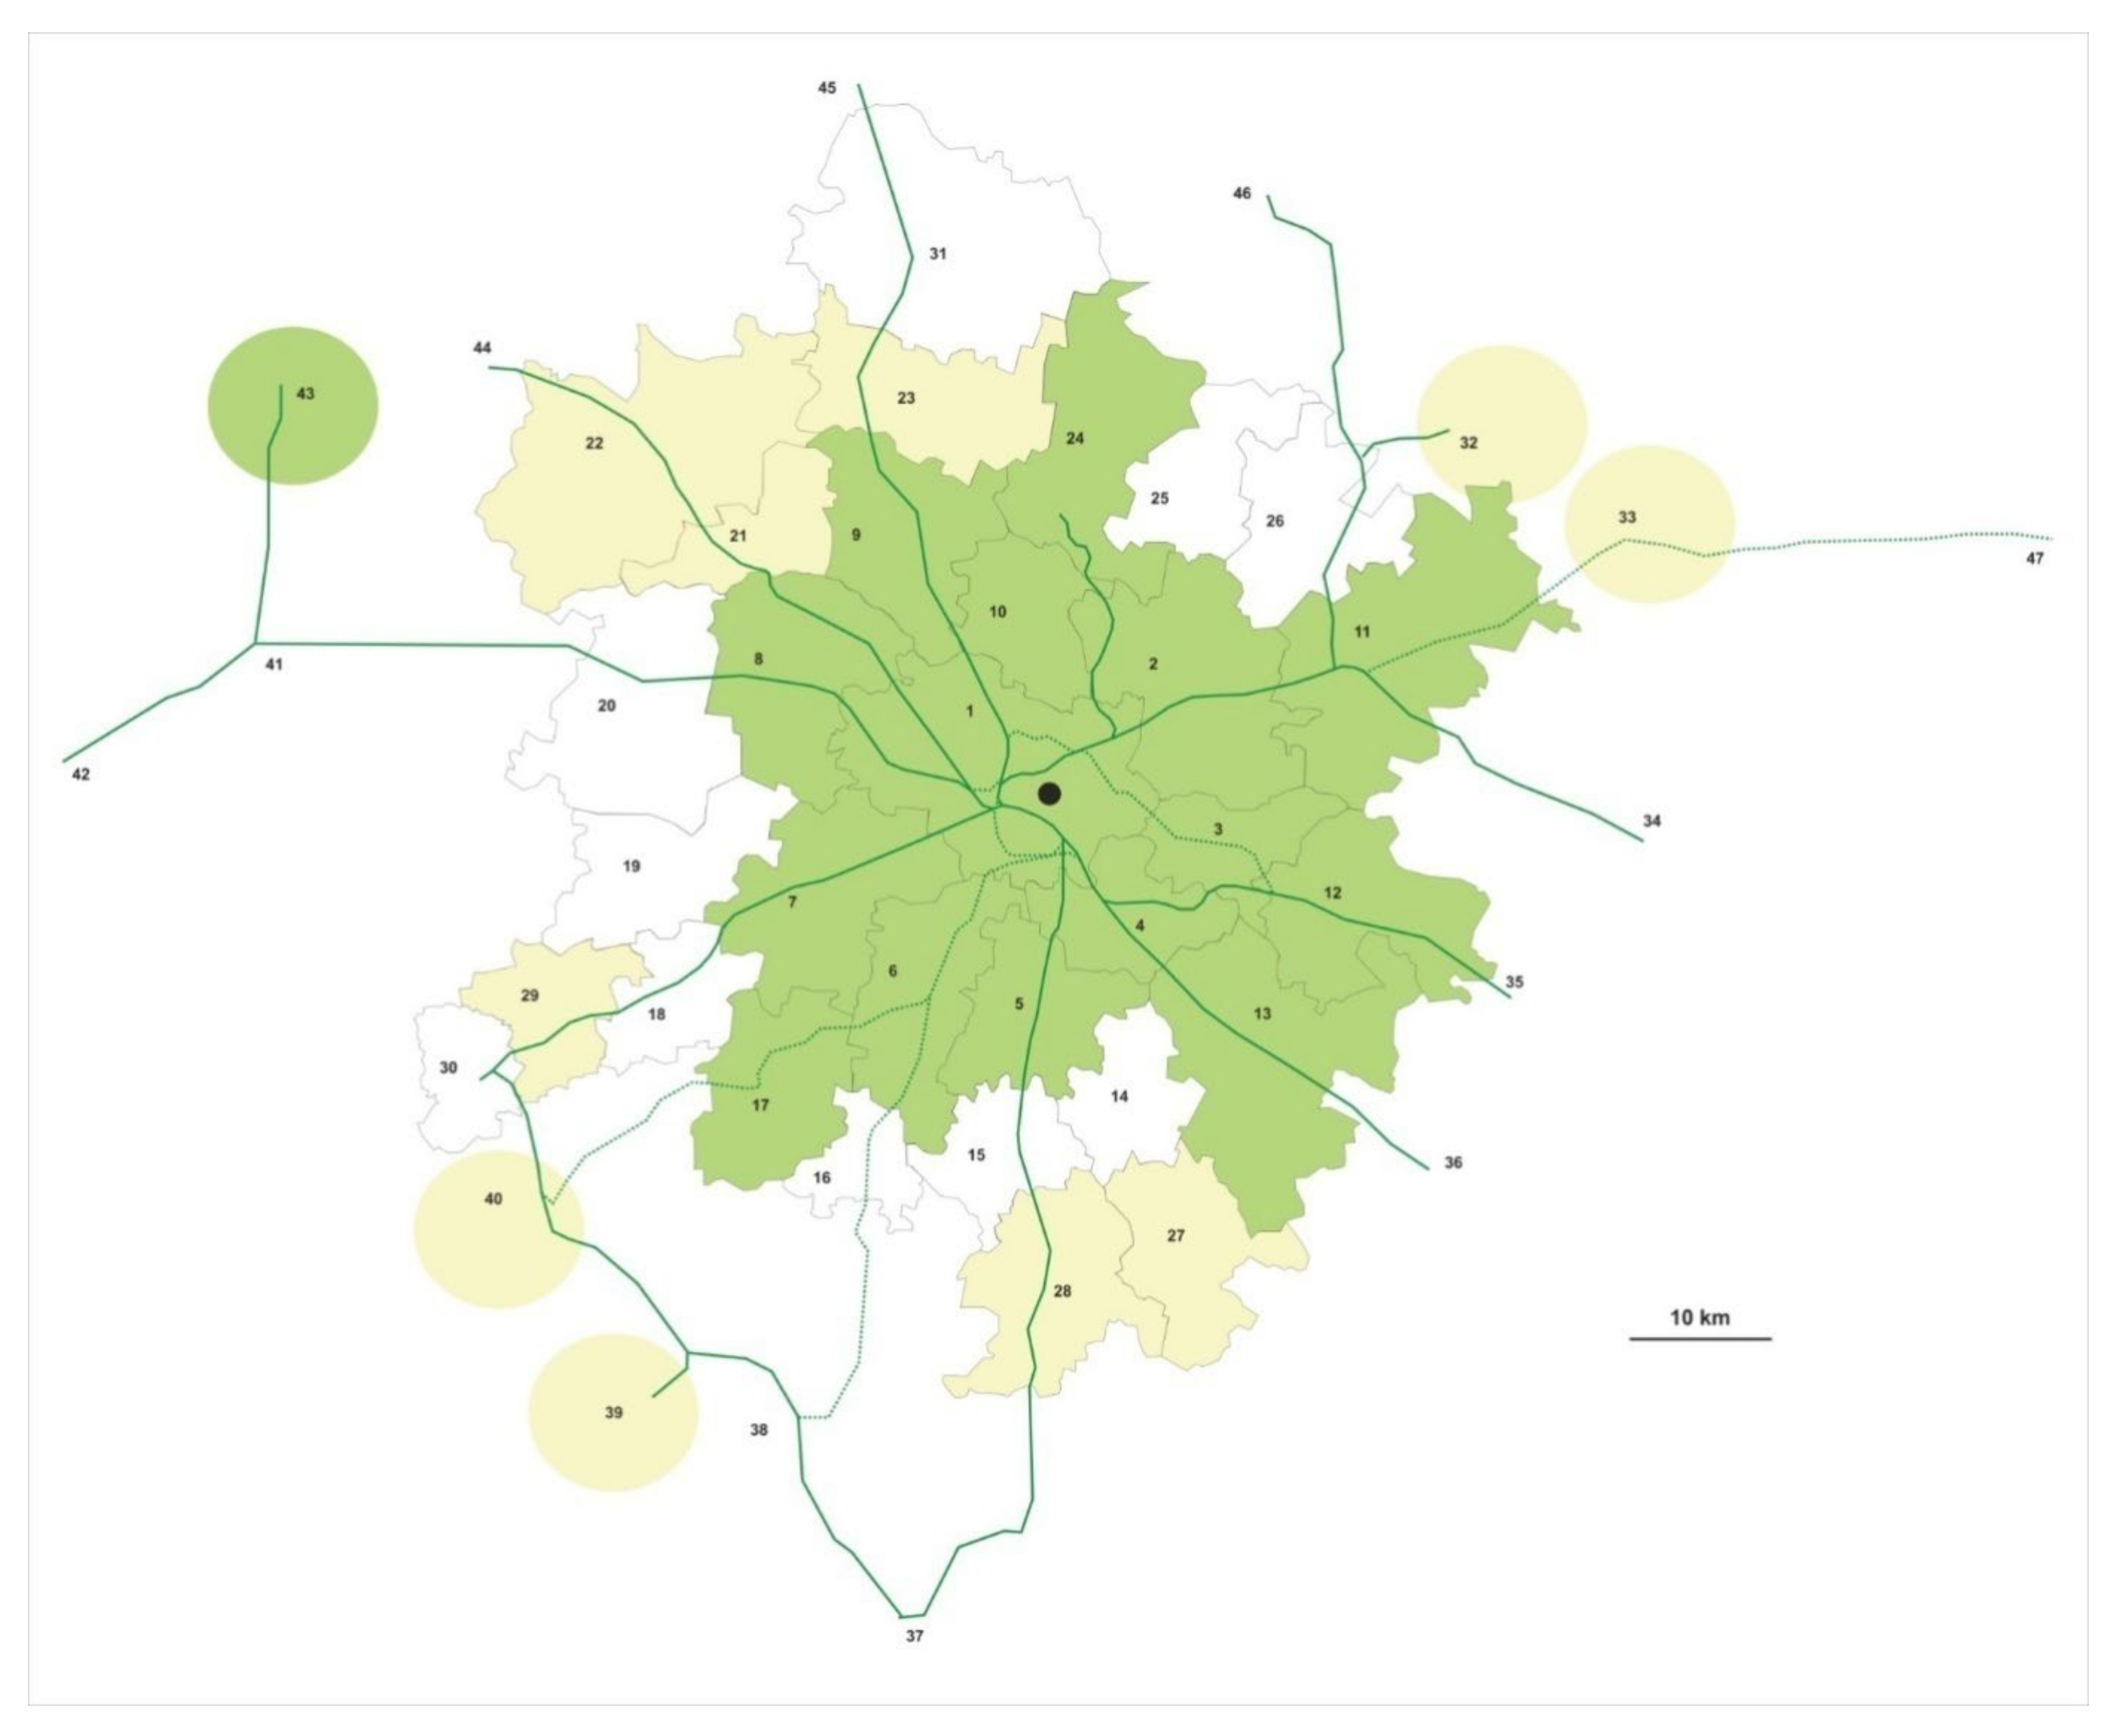
2.2. Area from Which the Employees Journeyed from
3. Results
4. Discussion
5. Conclusions
Author Contributions
Funding
Institutional Review Board Statement
Informed Consent Statement
Data Availability Statement
Conflicts of Interest
References
- Brand, C.; Dons, E.; Anaya-Boig, E.; Avila-Palencia, I.; Clark, A.; de Nazelle, A.; Gascon, M.; Gaupp-Berghausen, M.; Gerike, R.; Götschi, T.; et al. The climate change mitigation effects of daily active travel in cities. Transp. Res. Part D Transp. Environ. 2021, 93, 102764. [Google Scholar] [CrossRef]
- Cucinotta, D.; Vanelli, M. WHO declares COVID-19 a pandemic. Acta Biomed. 2020, 91, 157–160. [Google Scholar] [CrossRef] [PubMed]
- Borkowski, P.; Jażdżewska-Gutta, M.; Szmelter-Jarosz, A. Lockdowned: Everyday mobility changes in response to COVID-19. J. Transp. Geogr. 2020, 90, 102906. [Google Scholar] [CrossRef] [PubMed]
- Brinchi, S.; Carrese, S.; Cipriani, E.; Colombaroni, C.; Crisalli, U.; Fusco, G.; Gemma, A.; Isaenko, N.; Mannini, L.; Patella, S.M.; et al. On Transport Monitoring and Forecasting During COVID-19 Pandemic in Rome. Transp. Telecommun. J. 2020, 21, 275–284. [Google Scholar] [CrossRef]
- Bucsky, P. Modal share changes due to COVID-19: The case of Budapest. Transp. Res. Interdiscip. Perspect. 2020, 8, 100141. [Google Scholar] [CrossRef]
- Eisenmann, C.; Nobis, C.; Kolarova, V.; Lenz, B.; Winkler, C. Transport mode use during the COVID-19 lockdown period in Germany: The car became more important, public transport lost ground. Transp. Policy 2021, 103, 60–67. [Google Scholar] [CrossRef]
- Jenelius, E.; Cebecauer, M. Impacts of COVID-19 on public transport ridership in Sweden: Analysis of ticket validations, sales and passenger counts. Transp. Res. Interdiscip. Perspect. 2020, 8, 100242. [Google Scholar] [CrossRef]
- Molloy, J.; Schatzmann, T.; Schoeman, B.; Tchervenkov, C.; Hintermann, B.; Axhausen, K.W. Observed impacts of the Covid-19 first wave on travel behaviour in Switzerland based on a large GPS panel. Transp. Policy 2021, 104, 43–51. [Google Scholar] [CrossRef]
- Przybylowski, A.; Stelmak, S.; Suchanek, M. Mobility Behaviour in View of the Impact of the COVID-19 Pandemic—Public Transport Users in Gdansk Case Study. Sustainability 2021, 13, 364. [Google Scholar] [CrossRef]
- Zafri, N.; Khan, A.; Jamal, S.; Alam, B. Impacts of the COVID-19 Pandemic on Active Travel Mode Choice in Bangladesh: A Study from the Perspective of Sustainability and New Normal Situation. Sustainability 2021, 13, 6975. [Google Scholar] [CrossRef]
- Macioszek, E.; Kurek, A. Extracting Road Traffic Volume in the City before and during covid-19 through Video Remote Sensing. Remote Sens. 2021, 13, 2329. [Google Scholar] [CrossRef]
- Wielechowski, M.; Czech, K.; Grzęda, Ł. Decline in Mobility: Public Transport in Poland in the time of the COVID-19 Pandemic. Economies 2020, 8, 78. [Google Scholar] [CrossRef]
- Hadjidemetriou, G.M.; Sasidharan, M.; Kouyialis, G.; Parlikad, A.K. The impact of government measures and human mobility trend on COVID-19 related deaths in the UK. Transp. Res. Interdiscip. Perspect. 2020, 6, 100167. [Google Scholar] [CrossRef]
- Pozo, R.F.; Wilby, M.R.; Díaz, J.J.V.; González, A.B.R. Data-driven analysis of the impact of COVID-19 on Madrid’s public transport during each phase of the pandemic. Cities 2022, 127, 103723. [Google Scholar] [CrossRef]
- Shakibaei, S.; de Jong, G.C.; Alpkökin, P.; Rashidi, T.H. Impact of the COVID-19 pandemic on travel behavior in Istanbul: A panel data analysis. Sustain. Cities Soc. 2020, 65, 102619. [Google Scholar] [CrossRef]
- Palak, M. Contemporary Commuting to Work. Soc. Inequalities Econ. Growth 2013, 33, 161–168. Available online: https://cejsh.icm.edu.pl/cejsh/element/bwmeta1.element.desklight-265599c0-1b63-48d3-ba85-07401fc35631?q=bwmeta1.element.desklight-5e031d91-2f96-4ba6-b3ae-ea71fbe32e77;12&qt=CHILDREN-STATELESS (accessed on 6 May 2022).
- Harbering, M.; Schlüter, J. Determinants of transport mode choice in metropolitan areas the case of the metropolitan area of the Valley of Mexico. J. Transp. Geogr. 2020, 87, 102766. [Google Scholar] [CrossRef]
- Brand, C.; Preston, J.M. ‘60–20 emission’—The unequal distribution of greenhouse gas emissions from personal, non-business travel in the UK. Transp. Policy 2010, 17, 9–19. [Google Scholar] [CrossRef]
- Sukhov, A.; Lättman, K.; Olsson, L.E.; Friman, M.; Fujii, S. Assessing travel satisfaction in public transport: A configurational approach. Transp. Res. Part D Transp. Environ. 2021, 93, 102732. [Google Scholar] [CrossRef]
- Kłos-Adamkiewicz, Z.; Gutowski, P. The Outbreak of COVID-19 Pandemic in Relation to Sense of Safety and Mobility Changes in Public Transport Using the Example of Warsaw. Sustainability 2022, 14, 1780. [Google Scholar] [CrossRef]
- De Palma, A.; Vosough, S.; Liao, F. An overview of effects of COVID-19 on mobility and lifestyle: 18 months since the outbreak. Transp. Res. Part A Policy Pract. 2022, 159, 372–397. [Google Scholar] [CrossRef] [PubMed]
- Tennøy, A.; Knapskog, M.; Wolday, F. Walking distances to public transport in smaller and larger Norwegian cities. Transp. Res. Part D Transp. Environ. 2022, 103, 103169. [Google Scholar] [CrossRef]
- Wyszomirska-Góra, M. Psychological Determinants Influencing Everyday Means of Transport Choice. Transp. Miej. I Regionalny 2013, 1, 4–9. Available online: https://bibliotekanauki.pl/articles/192667 (accessed on 6 May 2022).
- Murena, F.; Prati, M.V.; Costagliola, M.A. Real driving emissions of a scooter and a passenger car in Naples city. Transp. Res. Part D Transp. Environ. 2019, 73, 46–55. [Google Scholar] [CrossRef]
- Montero-Lamas, Y.; Orro, A.; Novales, M.; Varela-García, F.-A. Analysis of the Relationship between the Characteristics of the Areas of Influence of Bus Stops and the Decrease in Ridership during COVID-19 Lockdowns. Sustainability 2022, 14, 4248. [Google Scholar] [CrossRef]
- Beck, M.J.; Hensher, D.A.; Nelson, J.D. Public transport trends in Australia during the COVID-19 pandemic: An investigation of the influence of bio-security concerns on trip behaviour. J. Transp. Geogr. 2021, 96, 103167. [Google Scholar] [CrossRef]
- Marra, A.D.; Sun, L.; Corman, F. The impact of COVID-19 pandemic on public transport usage and route choice: Evidences from a long-term tracking study in urban area. Transp. Policy 2021, 116, 258–268. [Google Scholar] [CrossRef] [PubMed]
- Tirachini, A.; Cats, O.; Delft University of Technology. COVID-19 and Public Transportation: Current Assessment, Prospects, and Research Needs. J. Public Transp. 2020, 22, 1. [Google Scholar] [CrossRef]
- Barbieri, D.M.; Lou, B.; Passavanti, M.; Hui, C.; Lessa, D.A.; Maharaj, B.; Banerjee, A.; Wang, F.; Chang, K.; Naik, B.; et al. A survey dataset to evaluate the changes in mobility and transportation due to COVID-19 travel restrictions in Australia, Brazil, China, Ghana, India, Iran, Italy, Norway, South Africa, United States. Data Brief. 2020, 33, 106459. [Google Scholar] [CrossRef]
- Barbarossa, L. The Post Pandemic City: Challenges and Opportunities for a Non-Motorized Urban Environment. An Overview of Italian Cases. Sustainability 2020, 12, 7172. [Google Scholar] [CrossRef]
- Fatmi, M.R. COVID-19 impact on urban mobility. J. Urban Manag. 2020, 9, 270–275. [Google Scholar] [CrossRef]
- Ahangari, S.; Chavis, C.; Jeihani, M. Public Transit Ridership Analysis during the COVID-19 Pandemic. medRxiv. 2020. [Google Scholar] [CrossRef]
- Schaefer, K.J.; Tuitjer, L.; Levin-Keitel, M. Transport disrupted–Substituting public transport by bike or car under Covid 19. Transp. Res. Part A Policy Pract. 2021, 153, 202–217. [Google Scholar] [CrossRef] [PubMed]
- Xu, Y.; Li, J.-P.; Chu, C.-C.; Dinca, G. Impact of COVID-19 on transportation and logistics: A case of China. Econ. Res.-Ekon. Istraz. 2021, 1–19. [Google Scholar] [CrossRef]
- Gkiotsalitis, K.; Cats, O. Public transport planning adaption under the COVID-19 pandemic crisis: Literature review of research needs and directions. Transp. Rev. 2020, 41, 374–392. [Google Scholar] [CrossRef]
- Matiza, T. Post-COVID-19 crisis travel behaviour: Towards mitigating the effects of perceived risk. J. Tour. Futur. 2020, 8, 99–108. [Google Scholar] [CrossRef]
- Bagdatli, M.E.C.; Ipek, F. Transport mode preferences of university students in post-COVID-19 pandemic. Transp. Policy 2022, 118, 20–32. [Google Scholar] [CrossRef] [PubMed]
- Awad-Núñez, S.; Julio, R.; Moya-Gómez, B.; Gomez, J.; González, J.S. Acceptability of sustainable mobility policies under a post-COVID-19 scenario. Evidence from Spain. Transp. Policy 2021, 106, 205–214. [Google Scholar] [CrossRef]
- Basu, R.; Ferreira, J. Sustainable mobility in auto-dominated Metro Boston: Challenges and opportunities post-COVID-19. Transp. Policy 2021, 103, 197–210. [Google Scholar] [CrossRef]
- Abdullah, M.; Dias, C.; Muley, D.; Shahin, M. Exploring the impacts of COVID-19 on travel behavior and mode preferences. Transp. Res. Interdiscip. Perspect. 2020, 8, 100255. [Google Scholar] [CrossRef]
- Vickerman, R. Will Covid-19 put the public back in public transport? A UK perspective. Transp. Policy 2021, 103, 95–102. [Google Scholar] [CrossRef]
- Zhang, R.; Zhang, J. Long-term pathways to deep decarbonization of the transport sector in the post-COVID world. Transp. Policy 2021, 110, 28–36. [Google Scholar] [CrossRef]

| ATU 1 | Distance | Population Size | PTS 2 | |
|---|---|---|---|---|
| No. | Name | (km) | (30.06.2021) | |
| 1. | Wrocław | 0–17.9 | 641,201 | H |
| 2. | Długołęka | 9.3–19.7 | 35,714 | M |
| 3. | Czernica | 10.9–25.9 | 18,240 | L |
| 4. | Siechnice | 8.9–15.1 | 24,775 | H |
| 5. | Żórawina | 12.4–21.2 | 11,569 | M |
| 6. | Kobierzyce | 15.7–24.7 | 22,323 | M |
| 7. | Kąty Wr. | 14.7–28.3 | 26,390 | H |
| 8. | Miękinia | 19.1–27.9 | 18,072 | H |
| 9. | Oborniki Śl. | 20.6–35.8 | 20,349 | H |
| 10. | Wisznia Mł. | 13.8–18.1 | 10,660 | L |
| 11. | Oleśnica | 22.9–43.5 | 51,071 | H |
| 12. | Jelcz Laskowice | 21.4–26.4 | 23,264 | M |
| 13. | Oława | 27.3 | 48,301 | H |
| 17. | Sobótka | 36.3–42.4 | 12,825 | L |
| 24. | Trzebnica | 26.5–44.6 | 24,485 | H |
| 43. | Lubin | 74.7 | 87,982 | H |
| ATU 1 | Mean of Transport Pre-Pandemic (%) | Mean of Transport through-Pandemic (%) | Mean of Transport Post-Pandemic (%) | ||||||||
|---|---|---|---|---|---|---|---|---|---|---|---|
| No. | Name | Number of Employees | PB | T | CM | PB | T | CM | PB | T | CM |
| 1. | Wrocław | 590 | 33.1 | 33.5 | 33.5 | 33.0 | 18.0 | 49.0 | 35.2 | 26.2 | 38.6 |
| 2. | Długołęka | 31 | 7.7 | 12.8 | 79.5 | 7.9 | 7.9 | 84.2 | 10.3 | 10.3 | 79.5 |
| 3. | Czernica | 37 | 2.4 | 12.2 | 85.4 | 2.6 | 5.3 | 92.1 | 2.3 | 9.1 | 88.6 |
| 4. | Siechnice | 21 | 10.3 | 20.7 | 69.0 | 3.7 | 14.8 | 81.5 | 7.1 | 17.9 | 75.0 |
| 5. | Żórawina | 5 | 0.0 | 33.3 | 66.7 | 0.0 | 0.0 | 100.0 | 0.0 | 25.0 | 75.0 |
| 6. | Kobierzyce | 5 | 0.0 | 20.0 | 80.0 | 0.0 | 0.0 | 100.0 | 0.0 | 0.0 | 100.0 |
| 7. | Kąty Wr. | 8 | 0.0 | 0.0 | 100.0 | 0.0 | 0.0 | 100.0 | 10.0 | 0.0 | 90.0 |
| 8. | Miękinia | 12 | 10.5 | 42.1 | 47.4 | 6.7 | 20.0 | 73.3 | 5.9 | 35.3 | 58.8 |
| 9. | Oborniki Śl. | 5 | 16.7 | 50.0 | 33.3 | 16.7 | 33.3 | 50.0 | 16.7 | 50.0 | 33.3 |
| 10. | Wisznia Mł. | 5 | 0.0 | 20.0 | 80.0 | 0.0 | 20.0 | 80.0 | 0.0 | 20.0 | 80.0 |
| 11. | Oleśnica | 14 | 5.9 | 35.3 | 58.8 | 6.7 | 6.7 | 86.7 | 10.0 | 35.0 | 55.0 |
| 12. | Jelcz Laskowice | 6 | 0.0 | 62.5 | 37.5 | 0.0 | 33.3 | 66.7 | 0.0 | 50.0 | 50.0 |
| 13. | Oława | 6 | 0.0 | 42.9 | 57.1 | 0.0 | 25.0 | 75.0 | 0.0 | 25.0 | 75.0 |
| 17. | Sobótka | 5 | 0.0 | 0.0 | 100.0 | 0.0 | 0.0 | 100.0 | 0.0 | 0.0 | 100.0 |
| 24. | Trzebnica | 8 | 11.1 | 44.4 | 44.4 | 20.0 | 30.0 | 50.0 | 20.0 | 40.0 | 40.0 |
| 43. | Lubin | 4 | 28.6 | 57.1 | 14.3 | 28.6 | 42.9 | 28.6 | 16.7 | 50.0 | 33.3 |
| ATU 1 | Trough- and Pre-Pandemic (%) | Post-and Pre- Pandemic (%) | |||||
|---|---|---|---|---|---|---|---|
| No. | Name | PB | T | CM | PB | T | CM |
| 1. | Wrocław | −0.1 | –15.4 | 15.5 | 2.2 | –7.3 | 5.2 |
| 2. | Długołęka | 0.2 | –4.9 | 4.7 | 2.6 | –2.6 | 0.0 |
| 3. | Czernica | 0.2 | –6.9 | 6.7 | –0.2 | –3.1 | 3.3 |
| 4. | Siechnice | –6.6 | –5.9 | 12.5 | –3.2 | –2.8 | 6.0 |
| 5. | Żórawina | 0.0 | –33.3 | 33.3 | 0.0 | –8.3 | 8.3 |
| 6. | Kobierzyce | 0.0 | –20.0 | 20.0 | 0.0 | –20.0 | 20.0 |
| 7. | Kąty Wr. | 0.0 | 0.0 | 0.0 | 10.0 | 0.0 | –10.0 |
| 8. | Miękinia | –3.9 | –22.1 | 26.0 | –4.6 | –6.8 | 11.5 |
| 9. | Oborniki Śl. | 0.0 | –16.7 | 16.7 | 0.0 | 0.0 | 0.0 |
| 10. | Wisznia Mł. | 0.0 | 0.0 | 0.0 | 0.0 | 0.0 | 0.0 |
| 11. | Oleśnica | 0.8 | –28.6 | 27.8 | 4.1 | –0.3 | –3.8 |
| 12. | Jelcz Laskowice | 0.0 | –29.2 | 29.2 | 0.0 | –12.5 | 12.5 |
| 13. | Oława | 0.0 | –17.9 | 17.9 | 0.0 | –17.9 | 17.9 |
| 17. | Sobótka | 0.0 | 0.0 | 0.0 | 0.0 | 0.0 | 0.0 |
| 24. | Trzebnica | 8.9 | –14.4 | 5.6 | 8.9 | –4.4 | –4.4 |
| 43. | Lubin | 0.0 | –14.3 | 14.3 | –11.9 | –7.1 | 19.0 |
| Average changes: | 0.0 | –17.7 | 17.7 | 0.6 | –7.2 | 6.6 | |
| ATU 1 | Name | Percentage of Employees Using Public Transport (%) | ||
|---|---|---|---|---|
| No. | Pre-Pandemic | Through-Pandemic | Post-Pandemic | |
| 12. | Jelcz Laskowice | 62.5 | 33.3 | 50.0 |
| 43. | Lubin | 57.1 | 42.9 | 50.0 |
| 9. | ObornikiŚl. | 50.0 | 33.3 | 50.0 |
| 24. | Trzebnica | 44.4 | 30.0 | 40.0 |
| 13. | Oława | 42.9 | 25.0 | 25.0 |
| 8. | Miękinia | 42.1 | 20.0 | 35.3 |
| 11. | Oleśnica | 35.3 | 6.7 | 35.0 |
| 1. | Wrocław | 33.5 | 18.0 | 26.2 |
| 5. | Żórawina | 33.3 | 0.0 | 25.0 |
| 4. | Siechnice | 20.7 | 14.8 | 17.9 |
| 6. | Kobierzyce | 20.0 | 0.0 | 0.0 |
| 10. | WiszniaMł. | 20.0 | 20.0 | 20.0 |
| 2. | Długołęka | 12.8 | 7.9 | 10.3 |
| 3. | Czernica | 12.2 | 5.3 | 9.1 |
| 7. | KątyWr. | 0.0 | 0.0 | 0.0 |
| 17. | Sobótka | 0.0 | 0.0 | 0.0 |
Publisher’s Note: MDPI stays neutral with regard to jurisdictional claims in published maps and institutional affiliations. |
© 2022 by the authors. Licensee MDPI, Basel, Switzerland. This article is an open access article distributed under the terms and conditions of the Creative Commons Attribution (CC BY) license (https://creativecommons.org/licenses/by/4.0/).
Share and Cite
Szczepanek, W.K.; Kruszyna, M. The Impact of COVID-19 on the Choice of Transport Means in Journeys to Work Based on the Selected Example from Poland. Sustainability 2022, 14, 7619. https://doi.org/10.3390/su14137619
Szczepanek WK, Kruszyna M. The Impact of COVID-19 on the Choice of Transport Means in Journeys to Work Based on the Selected Example from Poland. Sustainability. 2022; 14(13):7619. https://doi.org/10.3390/su14137619
Chicago/Turabian StyleSzczepanek, Wojciech Kazimierz, and Maciej Kruszyna. 2022. "The Impact of COVID-19 on the Choice of Transport Means in Journeys to Work Based on the Selected Example from Poland" Sustainability 14, no. 13: 7619. https://doi.org/10.3390/su14137619
APA StyleSzczepanek, W. K., & Kruszyna, M. (2022). The Impact of COVID-19 on the Choice of Transport Means in Journeys to Work Based on the Selected Example from Poland. Sustainability, 14(13), 7619. https://doi.org/10.3390/su14137619