
Housing Sustainability: The Effects of Speculation and Property Taxes on House Prices within and beyond the Jurisdiction


Abstract
:1. Introduction
2. Literature Review
2.1. Housing Affordability and Sustainability
2.2. Real Estate Taxes and House Prices
2.3. Ontario Non-Resident Speculation Tax (NRST)
3. Method
3.1. Study Area and Data Description
3.2. Dependent Variable
3.3. Empirical Model
4. Results
4.1. Descriptive Statistics
4.2. Policy Intervention Impact
4.3. Difference-in-Difference Analyses
4.4. Geographical Variation of Housing Policies—Mortgage and Property Tax
5. Conclusions
Author Contributions
Funding
Institutional Review Board Statement
Informed Consent Statement
Data Availability Statement
Acknowledgments
Conflicts of Interest
References
- Sterman, J.D. Business Dynamics. System Thinking and Modeling for a Complex World; McGraw-Hill: Boston, MA, USA, 2000. [Google Scholar]
- Herrle, P.; Ley, A. From Local Action to Global Networks: Housing the Urban Poor; Routledge: London, UK, 2016. [Google Scholar] [CrossRef]
- Gilbertson, J.; Grimsley, M.; Green, G.; Group, W. Psychosocial routes from housing investment to health: Evidence from England’s home energy efficiency scheme. Energy Policy 2012, 49, 122–133. [Google Scholar] [CrossRef]
- Sanberg, M. Downsizing of housing: Negotiating sufficiency and spatial norms. J. Macromark. 2018, 38, 154–167. [Google Scholar] [CrossRef]
- Weber, C.; Mathews, H. Quantifying the global and distributional aspects of American household carbon footprint. Ecol. Econ. 2008, 66, 379–391. [Google Scholar] [CrossRef]
- Cohen, M.J. Reforming local public finance to reduce resource consumption: The sustainability case for graduated property taxation. Sustain. Sci. 2018, 14, 289–301. [Google Scholar] [CrossRef]
- Eriksen, M.D.; Lang, B.J. Overview and proposed reforms of the low-income housing tax credit program. Reg. Sci. Urban Econ. 2018, 80, 103379. [Google Scholar] [CrossRef]
- Bai, C.; Li, Q.; Ouyang, M. Property taxes and home prices: A tale of two cities. J. Econ. 2014, 180, 1–15. [Google Scholar] [CrossRef]
- Giertz, S.H.; Ramezani, R.; Beron, K.J. Property tax capitalization, a case study of Dallas County. Reg. Sci. Urban Econ. 2021, 89, 103680. [Google Scholar] [CrossRef]
- Poterba, J.M. Tax Subsidies to Owner-Occupied Housing: An Asset-Market Approach. Q. J. Econ. 1984, 99, 729–752. [Google Scholar] [CrossRef] [Green Version]
- Lima, V. The financialization of rental housing: Evictions and rent regulation. Cities 2020, 105, 102787. [Google Scholar] [CrossRef]
- Agrawal, D.R.; Hoyt, W.H.; Wilson, J.D. Local Policy Choice: Theory and Empirics, CESifo Group Munich, pp. Retrieved from Politics Collection. 2020. Available online: http://search.proquest.com.proxy.lib.uwaterloo.ca/reports/local-policy-choice-theory-e (accessed on 15 January 2021).
- Lyytikäinen, T. Tax competition among local governments: Evidence from a property tax reform in Finland. J. Public Econ. 2012, 96, 584–595. [Google Scholar] [CrossRef]
- Ball, M. Planning Delay and the Responsiveness of English Housing Supply. Urban Stud. 2010, 48, 349–362. [Google Scholar] [CrossRef] [PubMed]
- Meen, G. Regional House Prices and the Ripple Effect: A New Interpretation. Hous. Stud. 1999, 14, 733–753. [Google Scholar] [CrossRef]
- Propheter, G. Capitalization of property tax relief: Some equity implications and relevance to policy design. Public Financ. Manag. 2019, 19, 1–23. [Google Scholar]
- Spencer, G.M.; Vinodrai, T.; Gertler, M.S.; Wolfe, D.A. Do Clusters Make a Difference? Defining and Assessing their Economic Performance. Reg. Stud. 2009, 44, 697–715. [Google Scholar] [CrossRef]
- Glaeser, E.; Gyourko, J. Housing Dynamics; NBER Working Papers 12787; National Bureau of Economic Research Inc.: Cambridge, MO, USA, 2006. [Google Scholar]
- Kilian, L.; Zhou, X. The Propagation of Regional Shocks in Housing Markets: Evidence from Oil Price Shocks in Canada; Federal Reserve Bank of St. Louis: St. Louis, MO, USA, 2018. [Google Scholar]
- Esping-Andersen, G. The Three Worlds of Welfare Capitalism; Polity Press: Cambridge, UK, 1990. [Google Scholar]
- Kemeny, J. Corporatism and Housing Regimes. Hous. Theory Soc. 2006, 23, 1–18. [Google Scholar] [CrossRef]
- Stephens, M. How Housing Systems are Changing and Why: A Critique of Kemeny’s Theory of Housing Regimes. Hous. Theory Soc. 2020, 37, 521–547. [Google Scholar] [CrossRef]
- Galster, G.; Lee, K. Housing affordability: A framing, synthesis of research and policy, and future directions. Int. J. Urban Sci. 2020, 25, 7–58. [Google Scholar] [CrossRef]
- Kamiński, M. The Theoretical Model of Polish Housing Policy between 2002 and 2016. Folia Oeconomica Stetin. 2019, 19, 20–30. [Google Scholar] [CrossRef] [Green Version]
- Villalobos, A. Model Approach to Effective Municipal Housing Affordability Programs. Master’s Thesis, Department of Political Science Texas State University, San Marcos, TX, USA, 2019. Available online: https://digital.library.txstate.edu/bitstream/handle/10877/8188/Villalobos-ARP-Final.pdf?sequence=1&isAllowed=y (accessed on 1 January 2021).
- Cox, W.; He, A. Canada’s Middle-Income Housing Affordability Crisis; Frontier Centre for Public Policy: Winnipeg, MB, Canada, 2016. [Google Scholar]
- Gabbe, C. Changing residential land use regulations to address high housing prices: Evidence from Los Angeles. J. Am. Plan. Assoc. 2019, 85, 1559078. [Google Scholar] [CrossRef]
- Fischer, M.M.; Huber, F.; Pfarrhofer, M.; Staufer-Steinnocher, P. The Dynamic Impact of Monetary Policy on Regional Housing Prices in the United States. Real Estate Econ. 2019, 49, 1039–1068. [Google Scholar] [CrossRef] [Green Version]
- Alexiou, C.; Chan, A.-S.; Vogiazas, S. Homeownership motivaiton, rationality, and housing prices: Evidence from gloom, boom, and bust and boom economies. Int. J. Financ. Econ. 2018, 24, 1–12. [Google Scholar]
- Wetzstein, S. Comparative housing, urban crisis and political economy: An ethnographically based ‘long view’ from Auckland, Singapore and Berlin. Hous. Stud. 2019, 34, 272–297. [Google Scholar] [CrossRef]
- Perry, J. There’s a Global Housing Crisis and Politicians Must do More to Tackle it. 10 June 2015. Available online: https://www.theguardian.com/global-development-professionals-network/2015/jun/10/from-beds-in-sheds-to-super-slums-theres-a-global-housing-crisis-and-politicians-must-do-more-to-tackle-it (accessed on 16 January 2021).
- Choi, J.; Zhu, J.; Goodman, L.; Ganesh, B.; Strochak, S. Millennial Homeowership: Why Is It So Low, and How Can We Increase It? Urban Institute: Washington, DC, USA, 2018. [Google Scholar]
- Hromada, E.; Cermakova, K. Financial Unavailability of Housing in the Chech Republic and Recommendations for its Solution. Int. J. Econ. Sci. 2021, 10, 47–58. [Google Scholar] [CrossRef]
- UN-Habitat. Urbanization and Development: Emerging Futures. World Cities Report; United Nations Human Settlements Programme (UN-Habitat): Nairobi, Kenya, 2016. [Google Scholar]
- Woetzel, R.; Ram, S.; Mischke, J.; Sankhe, S. A Blueprint for Addressing the Global Affordable Housing Challenge; McKinsey Global Institute: Washington, DC, USA, 2014; Available online: https://www.mckinsey.com/featured-insights/urbanization/tackling-the-worlds-affordable-housing-challenge (accessed on 20 February 2021).
- Collinson, R.; Ellen, I.G.; Ludwig, J. Reforming Housing Assistance. Ann. Am. Acad. Political Soc. Sci. 2019, 686, 250–285. [Google Scholar] [CrossRef]
- Pomeroy, S. Challenges and opportunity in financing affordable housing in Canada. In Background Brief Prepared for the Federation of Canadian Municipalities; Focus Consulting Inc.: Ottawa, ON, Canada, 2017. [Google Scholar]
- Okkola, S.; Brunelle, C. The changing determinants of housing affordability in oil-booming agglomerations: A quantile regression investigation from Canada, 1991–2011. Hous. Stud. 2017, 33, 902–937. [Google Scholar] [CrossRef]
- Tan, Y.; Xu, H.; Zhang, X. Sustainable urbanization in China: A comprehensive literature review. Cities 2016, 55, 82–93. [Google Scholar] [CrossRef]
- Macmillan, A.; Davies, M.; Shrubsole, C.; Luxford, N.; May, N.; Chiu, L.F.; Trutnevyte, E.; Bobrova, Y.; Chalabi, Z. Integrated decision-making about housing, energy and wellbeing: A qualitative system dynamics model. Environ. Health 2016, 15, S37. [Google Scholar] [CrossRef] [Green Version]
- APPG. Re-energising the Green Agenda: Report from the Commission of Inquiry into Sustainable Construction and the Green Deal; All Party Group for Excellence in the Built Environment; UK House of Commons: London, UK, 2013. [Google Scholar]
- Branco, R.; Alves, S. Urban rehabilitation, governance, and housing affordability: Lessons from Portugal. Urban Res. Pract. 2018, 13, 157–179. [Google Scholar] [CrossRef]
- Hulchanski, J.D. The concept of housing affordability—6 contemporary uses of the housing expenditure-to-income ratio. Hous. Stud. 1995, 10, 471–491. [Google Scholar] [CrossRef]
- Slack, E. Sustainable Development and Municipalities: Getting the Prices Right. Can. Public Policy 2016, 42, S73–S78. [Google Scholar] [CrossRef]
- Raslanas, S.; Zavadskas, E.K.; Kaklauskas, A. Land value tax in the context of sustainable urban development and assessment. Part i-policy analysis and conceptual model for the taxation system on real property. Int. J. Strat. Prop. Manag. 2010, 14, 73–86. [Google Scholar] [CrossRef] [Green Version]
- Bednář, O.; Čečrdlová, A.; Kadeřábková, B.; Řežábek, P. Energy Prices Impact on Inflationary Spiral. Energies 2022, 15, 3443. [Google Scholar] [CrossRef]
- Benjamin, J.D.; Coulson, N.E.; Yang, S.X. Real estate transfer taxes and property values: The Philadelphia story. J. Real Estate Financ. Econ. 1993, 7, 151–157. [Google Scholar] [CrossRef]
- Dachis, B.; Duranton, G.; Turner, M.A. The effects of land transfer taxes on real estate markets: Evidence from a natural experiment in Toronto. J. Econ. Geogr. 2011, 12, 327–354. [Google Scholar] [CrossRef] [Green Version]
- Fritzsche, C.; Vandrei, L. The German Real Estate Transfer Tax: Evidence for Single-Family Home Transactions. Reg. Sci. Urban Econ. 2019, 74, 131–143. [Google Scholar] [CrossRef] [Green Version]
- Oates, W.E. The Effects of Property Taxes and Local Public Spending on Property Values: An Empirical Study of Tax Capitalization and the Tiebout Hypothesis. J. Political Econ. 1969, 77, 957–971. [Google Scholar] [CrossRef]
- Tiebout, C.M. A Pure Theory of Local Expenditures. J. Political Econ. 1956, 64, 416–424. [Google Scholar] [CrossRef]
- Best, M.C.; Kleven, H.J. Housing Market Responses to Transaction Taxes: Evidence from Notches and Stimulus in the U.K. Rev. Econ. Stud. 2017, 85, 157–193. [Google Scholar] [CrossRef]
- Hoyt, W.H.; Biehl, A.M.; Coomes, P.A. Tax Limits and Housing Markets: Some Evidence at the State Level. Real Estate Econ. 2010, 39, 97–132. [Google Scholar] [CrossRef]
- Lundborg, P.; Skedinger, P. Transaction Taxes in a Search Model of the Housing Market. J. Urban Econ. 1999, 45, 385–399. [Google Scholar] [CrossRef]
- Wei, S.-Y.; Chu, N.-Y.; Hsu, T.-C.; Hou, C.-C. Effect of government policy on the risk of real estate investment—The case of Taiwan’s luxury tax. Int. J. Organ. Innov. 2019, 12, 10–23. [Google Scholar]
- Liberati, D.; Loberto, M. Taxation and housing markets with search frictions. J. Hous. Econ. 2019, 46, 101632. [Google Scholar] [CrossRef] [Green Version]
- Oliviero, T.; Sacchi, A.; Scognamiglio, A.; Zazzaro, A. House prices and immovable property tax: Evidence from OECD countries. Metroeconomica 2019, 70, 776–792. [Google Scholar] [CrossRef]
- Kopczuk, W.; Munroe, D. Mansion Tax: The Effect of Transfer Taxes on the Residential Real Estate Market. Am. Econ. J. Econ. Policy 2014, 7, 214–257. [Google Scholar] [CrossRef] [Green Version]
- Yu, C.-M.; Chen, P.-F. House Prices, Mortgage Rate, and Policy: Megadata Analysis in Taipei. Sustainability 2018, 10, 926. [Google Scholar] [CrossRef] [Green Version]
- Ling, D.C. Real Estate Values, Federal Income Taxation, and the Importance of Local Market Conditions. Real Estate Econ. 1992, 20, 125–139. [Google Scholar] [CrossRef]
- Manganelli, B.; Morano, P.; Rosato, P.; De Paola, P. The Effect of Taxation on Investment Demand in the Real Estate Market: The Italian Experience. Buildings 2020, 10, 115. [Google Scholar] [CrossRef]
- Cebula, R. Are property taxes capitalized into housing prices in Savannah, Georgia? An investigation of the market mechanism. J. Hous. Res. 2009, 18, 63–75. [Google Scholar] [CrossRef]
- Rosen, H.S.; Fullerton, D.J. A note on local tax rates, public benefit levels, and property values. J. Political Econ. 1977, 85, 433–440. [Google Scholar] [CrossRef]
- Tsoodle, L.J.; Turner, T.M. Property Taxes and Residential Rents. Real Estate Econ. 2008, 36, 63–80. [Google Scholar] [CrossRef]
- Murray, C.K. A Housing Supply Absorption Rate Equation. J. Real Estate Financ. Econ. 2021, 64, 228–246. [Google Scholar] [CrossRef]
- Berkovec, J.; Fullerton, D. A general equilibrium model of housing, taxes, and portfolio choice. J. Political Econ. 1992, 100, 390–429. [Google Scholar] [CrossRef]
- Chambers, M.; Garriga, C.; Schlagenhauf, D.E. Housing policy and the progressivity of income taxation. J. Monet. Econ. 2009, 56, 1116–1134. [Google Scholar] [CrossRef]
- Li, W.; Yu, E.G. Real estate taxes and home value: Evidence from TCJA. Rev. Econ. Dyn. 2021, 43, 125–151. [Google Scholar] [CrossRef]
- Krolage, C. The effect of real estate purchase subsidies on property prices. Int. Tax Public Financ. 2022, 1–32. [Google Scholar] [CrossRef]
- Chatterjee, S.; Eyigungor, B. A Quantitative Analysis of the U.S. Housing and Mortgage Markets and the Foreclosure Crisis. Rev. Econ. Dyn. 2015, 18, 165–184. [Google Scholar] [CrossRef] [Green Version]
- Hilber, C.A.L. The Economic Implications of House Price Capitalization: A Synthesis. Real Estate Econ. 2015, 45, 301–339. [Google Scholar] [CrossRef] [Green Version]
- Sommer, K.; Sullivan, P. Implications of US tax policy for house prices, rents, and homeownership. Am. Econ. Rev. Vol. 2018, 108, 241–274. [Google Scholar] [CrossRef] [Green Version]
- Ricks, J.S. Mortgage subsidies, homeownership, and marriage: Effects of the VA loan program. Reg. Sci. Urban Econ. 2021, 87, 103650. [Google Scholar] [CrossRef]
- Brueckner, J.; Kim, H. Urban Sprawl and the Property Tax. Int. Tax Public Financ. 2003, 10, 5–23. [Google Scholar] [CrossRef]
- Han, J.; Cui, L.; Yu, H. Pricing the value of the chance to gain admission to an elite senior high school in Beijing: The effect of the LDHSE policy on resale housing prices. Cities 2021, 115, 103238. [Google Scholar] [CrossRef]
- Lin, S.-H.; Hsieh, J.-C. Is property taxation useful for the regulation of residential market? Reflections on Taiwanese experience. Neth. J. Hous. Built Environ. 2020, 36, 303–324. [Google Scholar] [CrossRef]
- Bimonte, S.; Stabile, A. The impact of the introduction of Italian property tax on urban development: A regional regression model. Hous. Stud. 2019, 35, 163–188. [Google Scholar] [CrossRef]
- Li, J.; Xu, Y. Evaluating restrictive measures containing housing prices in China: A data envelopment analysis approach. Urban Stud. 2015, 53, 2654–2669. [Google Scholar] [CrossRef]
- He, L.-Y.; Wen, X.-C. Population growth, interest rate, and housing tax in the transitional China. Phys. A Stat. Mech. Appl. 2017, 469, 305–312. [Google Scholar] [CrossRef] [Green Version]
- Mo, K. An Empirical Analysis of the Impact of Real Estate Tax System on Housing Price in Hong Kong. Mod. Econ. 2019, 10, 72–85. [Google Scholar] [CrossRef] [Green Version]
- BC. Property Transfer Tax. 1 December 2020. Available online: https://www2.gov.bc.ca/gov/content/taxes/property-taxes/property-transfer-tax/additional-property-transfer-tax (accessed on 15 February 2021).
- OMF. Non-Resident Speculation Tax. 1 January 2021. Available online: https://www.fin.gov.on.ca/en/bulletins/nrst/ (accessed on 12 March 2021).
- Kaklauskas, A.; Lepkova, N.; Raslanas, S.; Vetloviene, I.; Milevicius, V.; Sepliakov, J. COVID-19 and Green Housing: A Review of Relevant Literature. Energies 2021, 14, 2072. [Google Scholar] [CrossRef]
- CER. Provincial & Territorial Energy Information. 2017. Available online: https://www.cer-rec.gc.ca/nrg/ntgrtd/mrkt/nrgsstmprfls/index-eng.html (accessed on 1 December 2020).
- Joy, M.; Vogel, R.K. Toronto’s governance crisis: A global city under pressure. Cities 2015, 49, 35–52. [Google Scholar] [CrossRef]
- Zhang, Y.; Jin, H.; Xiao, Y.; Gao, Y. What are the Effects of Demographic Structures on Housing Consumption?: Evidence from 31 Provinces in China. Math. Probl. Eng. 2020, 2020, 6974276. [Google Scholar] [CrossRef] [Green Version]
- Nistor, A.; Reianu, D. Determinants of housing prices: Evidence from Ontario cities, 2001–2011. Int. J. Hous. Mark. Anal. 2018, 11, 541–556. [Google Scholar] [CrossRef]
- Moutinho, L.; Hutcheson, G. The SAGE Dictionary of Quantitative Management Research; SAGE Publications Ltd.: Thousand Oaks, CA, USA, 2011. [Google Scholar] [CrossRef]
- Eerola, E.; Harjunen, O.; Lyytikäinen, T.; Saarimaa, T. Revisting the effects of housing transfer taxes. J. Urban Econ. 2021, 124, 103367. [Google Scholar] [CrossRef]
- Marcato, G.; Nanda, A. Asymmetric Patterns of Demand-Supply Mismatch in Real Estate. J. Real Estate Financ. Econ. 2021, 64, 440–472. [Google Scholar] [CrossRef]
- Siegel, S.N.; Castellan, J., Jr. Nonparametric Statistics for the Behavioral Sciences, 2nd ed.; McGraw-Hill: New York, NY, USA, 1987. [Google Scholar]
- Granger, C.W.J. Investigating Causal Relations by Econometric Models and Cross-spectral Methods. Econometrica 1969, 37, 424–438. [Google Scholar] [CrossRef]
- Barreca, A.; Curto, R.; Rolando, D. Housing vulnerability and property prices: Spatial analysis in the Turin Real Estate Market. Sustainability 2018, 10, 3068. [Google Scholar] [CrossRef] [Green Version]
- Wilkins, A.S. To Lag or Not to Lag? Re-Evaluating the Use of Lagged Dependent Variables in Regression Analysis. Politi. Sci. Res. Methods 2017, 6, 393–411. [Google Scholar] [CrossRef]
- Chasco, C.; Le Gallo, J.; López, F.A. A scan test for spatial groupwise heteroscedasticity in cross-sectional models with an application on houses prices in Madrid. Reg. Sci. Urban Econ. 2018, 68, 226–238. [Google Scholar] [CrossRef] [Green Version]
- Mirrlees, J. Tax by Design: The Mirrlees Review; Oxford University Press: Oxford, UK, 2011. [Google Scholar]
- Mian, A.; Sufi, A. Credit Supply and Housing Speculation. Rev. Financ. Stud. 2021, 35, 680–719. [Google Scholar] [CrossRef]
- Čermáková, K.; Hromada, E. Change in the Affordability of Owner-Occupied Housing in the Context of Rising Energy Prices. Energies 2022, 15, 1281. [Google Scholar] [CrossRef]
- Mach, L.; Bedrunka, K.; Kuczuk, A.; Szewczuk-Stępień, M. Effect of Structural Funds on Housing Market Sustainability Development—Correlation, Regression and Wavelet Coherence Analysis. Risks 2021, 9, 182. [Google Scholar] [CrossRef]
- Akbari, A.; Krystyniak, K. Government real estate interventions and the stock market. Int. Rev. Financ. Anal. 2021, 75, 101742. [Google Scholar] [CrossRef]
- Moralı, O.; Yılmaz, N. An Analysis of Spatial Dependence in Real Estate Prices. J. Real Estate Financ. Econ. 2020, 64, 93–115. [Google Scholar] [CrossRef]
- Zhang, Y.; Sun, Y.; Stengos, T. Spatial Dependence in the Residential Canadian Housing Market. J. Real Estate Financ. Econ. 2018, 58, 223–263. [Google Scholar] [CrossRef]


| CMA | House Price—CREA Boundary | Region |
|---|---|---|
| Toronto | City of Toronto | GGH |
| Guelph | Guelph and District | GGH |
| Hamilton | Hamilton–Burlington | GGH |
| KWC | Kitchener–Waterloo and Cambridge | GGH |
| St. Catherine Niagara | Niagara Falls and Fort Erie | GGH |
| London | London and St. Thomas | Non-GGH |
| Windsor | Windsor-Essex | Non-GGH |
| Ottawa (Ontario part) | Ottawa—Ontario | Non-GGH |
| Kingston | Kingston | Non-GGH |
| Domain | Variables | Period/Frequency |
|---|---|---|
| National Policy | Mortgage Rate (5Y-Var.) | January 2011–December 2021 (Monthly) |
| Regional Policy | NRST | Yes/No (1, 0) |
| Local Policy | Property Tax Rate | January 2011–December 2021 (Annual) |
| Market Outcome | Average Price | January 2011–December 2021 (Monthly) |
| Units Sold | January 2011–December 2021 (Monthly) | |
| Supply Side | Units Created | January 2011–December 2021 (Monthly) |
| Absorption Rate (New Units) | January 2011–December 2021 (Monthly) | |
| Vacancy Rate | January 2011–December 2021 (Annual) | |
| Demand Side | Unemployment Rate | January 2011–December 2021 (Monthly) |
| Population (15+ × 1000) | January 2011–December 2021 (Monthly) |
| Variables | DF | t Value | Pr > |t| | St. Estimate | t Value | Pr > |t| | St. Estimate |
|---|---|---|---|---|---|---|---|
| Dependent Variables | Average House Price | Units Sold | |||||
| Intercept | 1 | 20.76 | <0.0001 | 0 | 6.55 | <0.0001 | 0 |
| Independent Variables | |||||||
| Mortgage Rate | 1 | −18.14 | <0.0001 | −0.33393 | −2.91 | 0.0037 | −0.05532 |
| NRST Tax | 1 | 12.47 | <0.0001 | 0.31012 | −2.06 | 0.0398 | −0.03814 |
| Property Tax Rate | 1 | −5.52 | <0.0001 | −0.13753 | −6.40 | <0.0001 | −0.15285 |
| Units Sold/Average Price | 1 | 2.33 | 0.0201 | 0.07385 | 2.33 | 0.0201 | 0.06196 |
| Units Created | 1 | 1.54 | 0.1241 | 0.06229 | 5.38 | <0.0001 | 0.19727 |
| Absorption Rate | 1 | 1.99 | 0.0469 | 0.03637 | 4.14 | <0.0001 | 0.06901 |
| Vacancy Rate | 1 | −6.54 | <0.0001 | −0.12946 | 2.56 | 0.0104 | 0.04722 |
| Unemployment Rate | 1 | −0.24 | 0.8100 | −0.00481 | −1.38 | 0.1676 | −0.02531 |
| Population | 1 | 6.66 | <0.0001 | 0.32153 | 11.78 | <0.0001 | 0.50194 |
| Dependent Variable | Average House Price | Units Sold | |||||
| F Value | 311.38 | 396.28 | |||||
| Pr > F | <0.0001 | <0.0001 | |||||
| Root MSE | 105,071 | 443.1225 | |||||
| Dependent Mean | 434,023 | 936.18 | |||||
| Coeff Var (R-MSE/D-Mean) | 24.2085 | 47.3329 | |||||
| R-Square | 0.7040 | 0.7517 | |||||
| Adj R-Sq | 0.7018 | 0.7498 | |||||
| Observation Used | 1188 | 1188 | |||||
| Variable | Mean | Std Dev | Minimum | Maximum | N |
|---|---|---|---|---|---|
| NRST-Tax | 0.3787879 | 0.4852895 | 0 | 1.0000000 | 1188 |
| Mortgage Rate (5Y) | 2.0668182 | 0.4715543 | 0.8500000 | 2.7500000 | 1188 |
| Units Sold | 936.1826599 | 885.9169593 | 66.0000000 | 5090.00 | 1188 |
| Average Price | 434,023.29 | 192,405.68 | 143,149.26 | 1,123,076.53 | 1188 |
| Total Units Created | 590.9452862 | 1072.10 | 3.0000000 | 6796.00 | 1188 |
| Absorption Rate | 49.5047097 | 20.0489838 | 0 | 92.1428571 | 1188 |
| Property Tax Rate | 1.1692095 | 0.2384062 | 0.5948453 | 1.8200000 | 1188 |
| Vacancy Rate | 2.5767677 | 1.2305158 | 0.6000000 | 8.3000000 | 1188 |
| Unemployment Rate | 6.9237374 | 1.9343720 | 1.8000000 | 16.7000000 | 1188 |
| Population | 932.2348485 | 1500.86 | 119.2000000 | 5599.60 | 1188 |
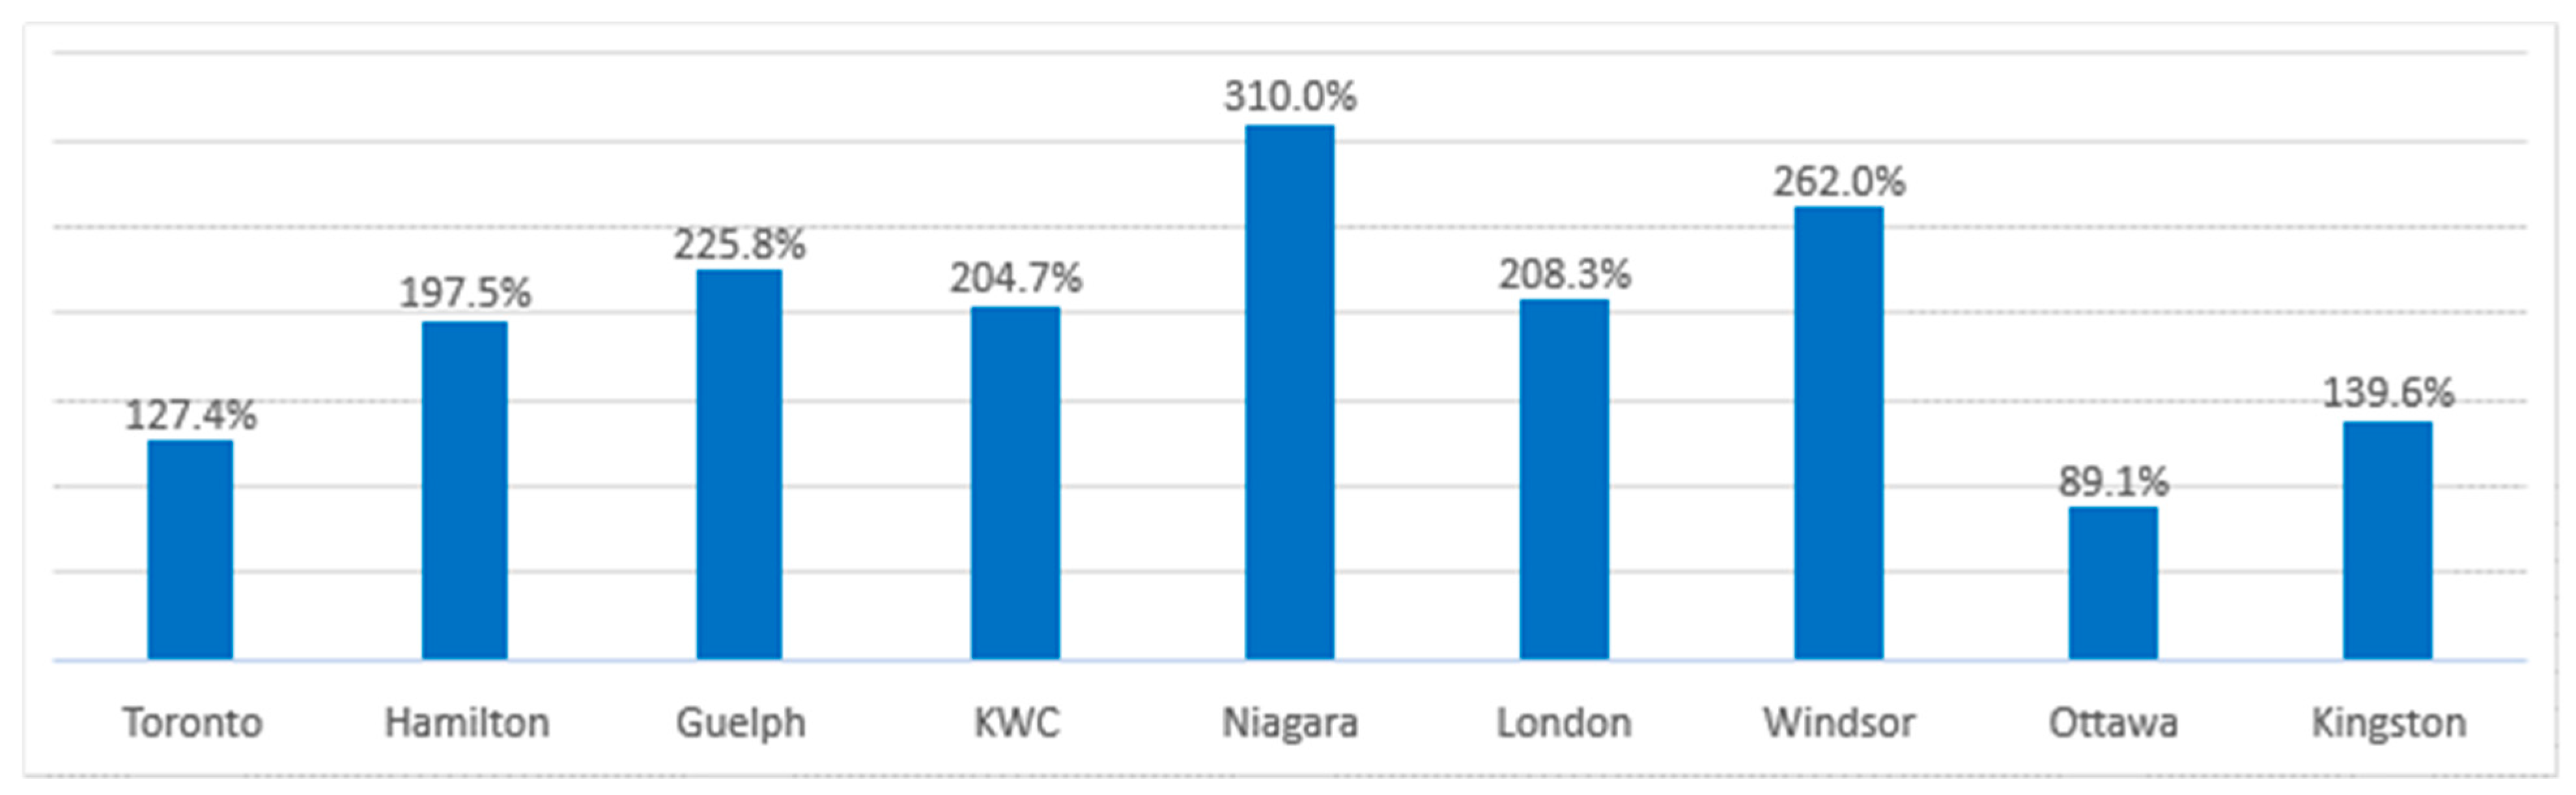
| Average Price Change | Toronto | Hamilton | Guelph | KWC | Niagara | London | Windsor | Ottawa | Kingston |
|---|---|---|---|---|---|---|---|---|---|
| GGH | Non-GGH | ||||||||
| Cumulative 2011 to 2021 | 127.4% | 197.5% | 225.8% | 204.7% | 310.0% | 208.3% | 262.0% | 89.1% | 139.6% |
| YOY 2011 to 2021 | 7.92% | 10.66% | 11.91% | 10.98% | 14.34% | 11.25% | 12.95% | 6.22% | 8.60% |
| YOY 2018 to 2021 | 7.29% | 13.33% | 16.55% | 15.34% | 18.87% | 19.02% | 21.57% | 10.89% | 14.14% |
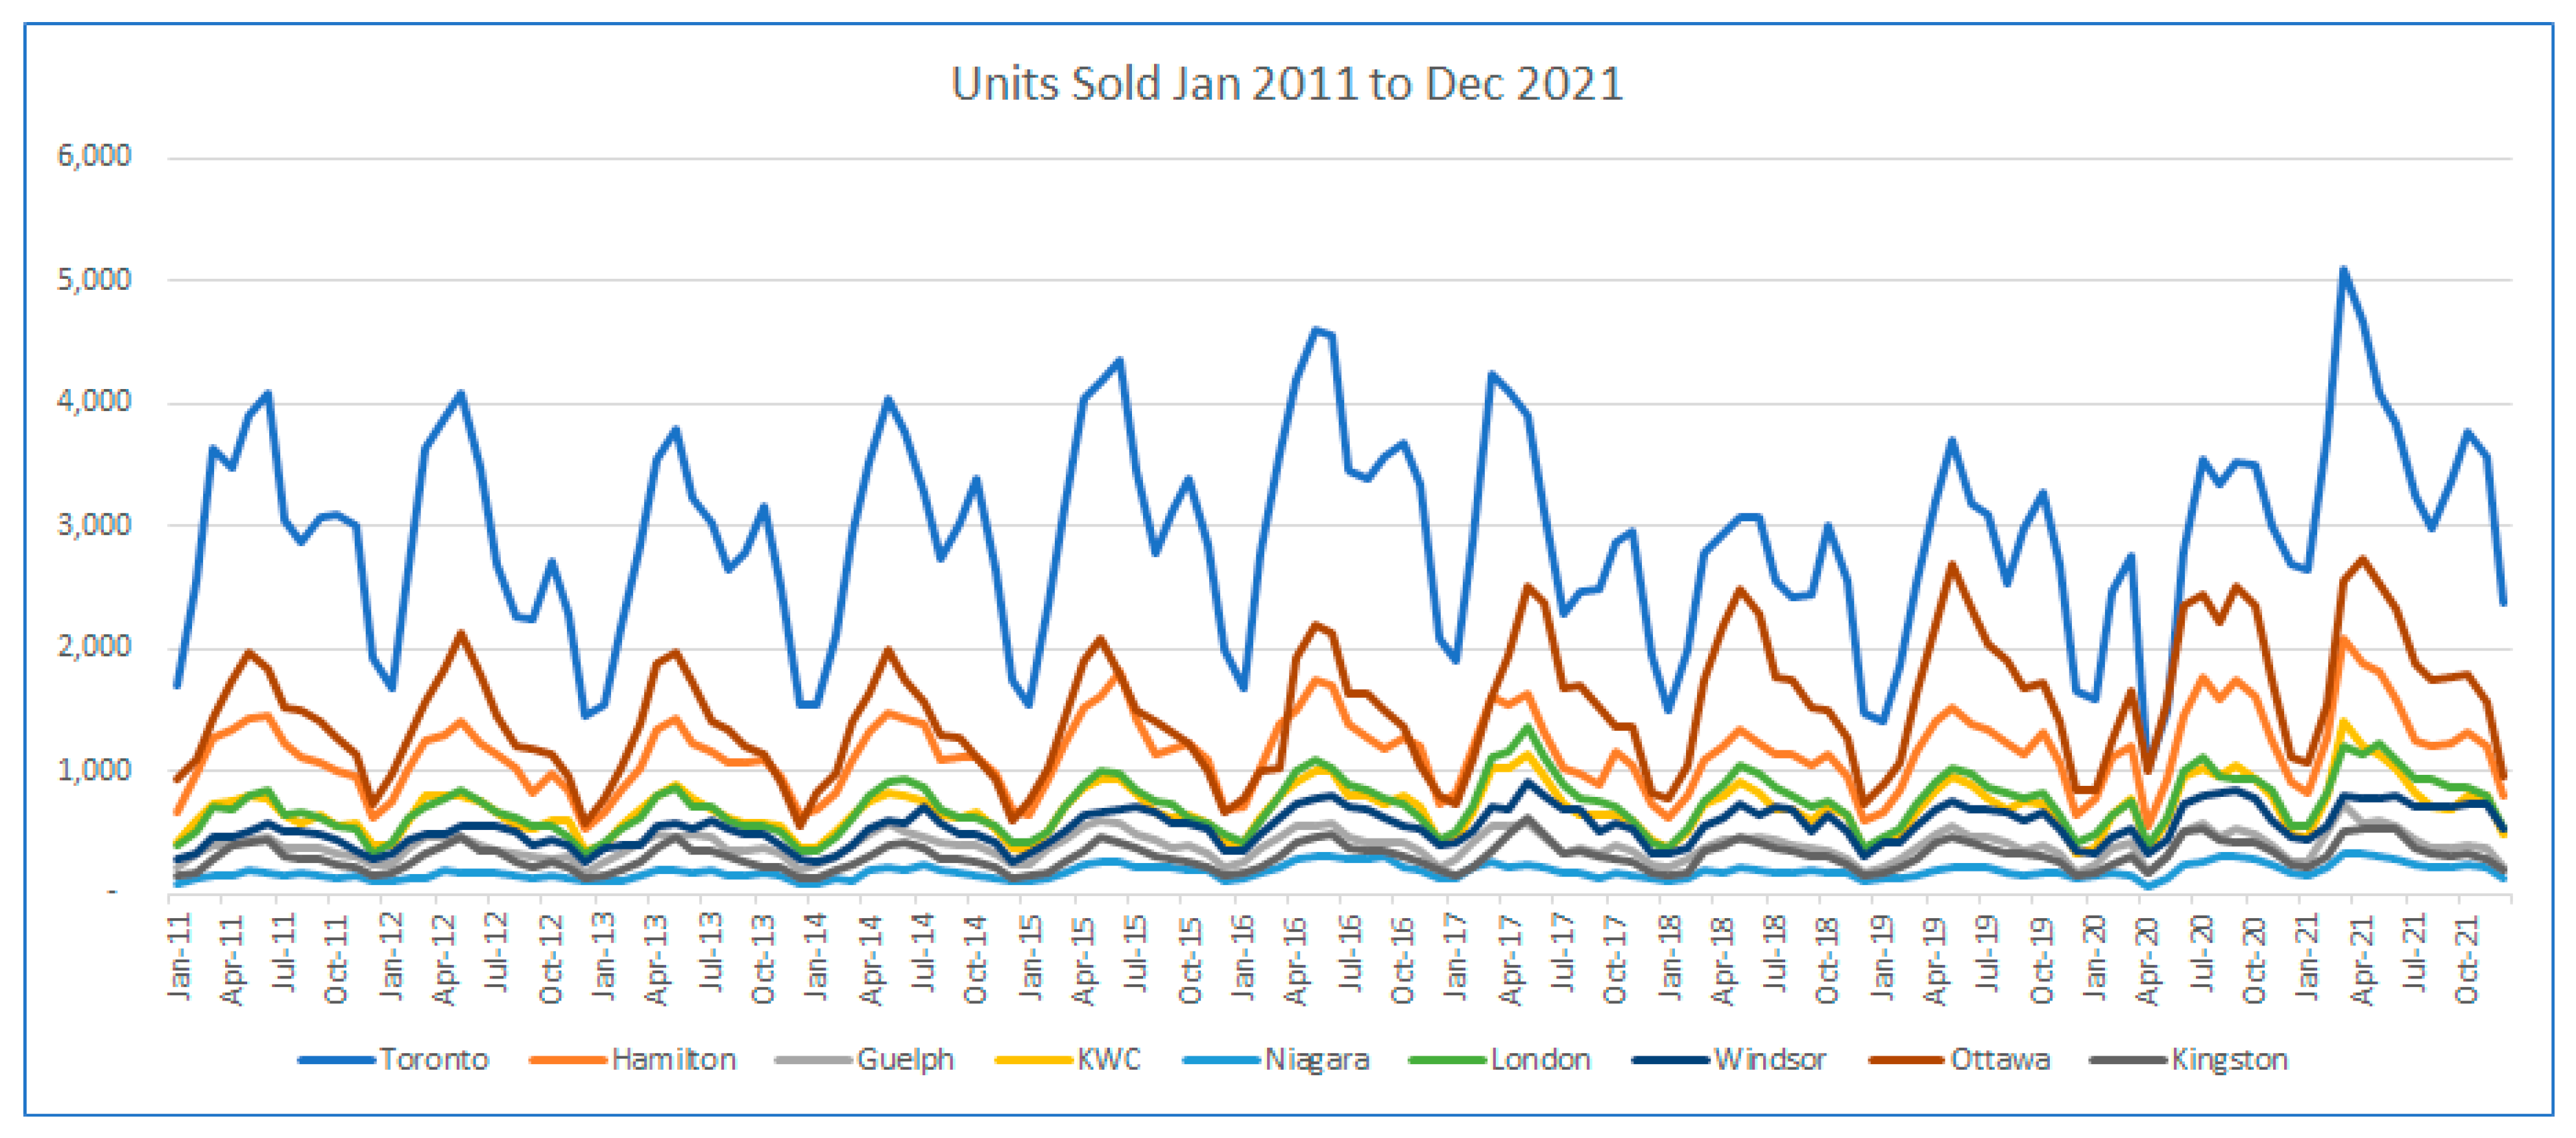
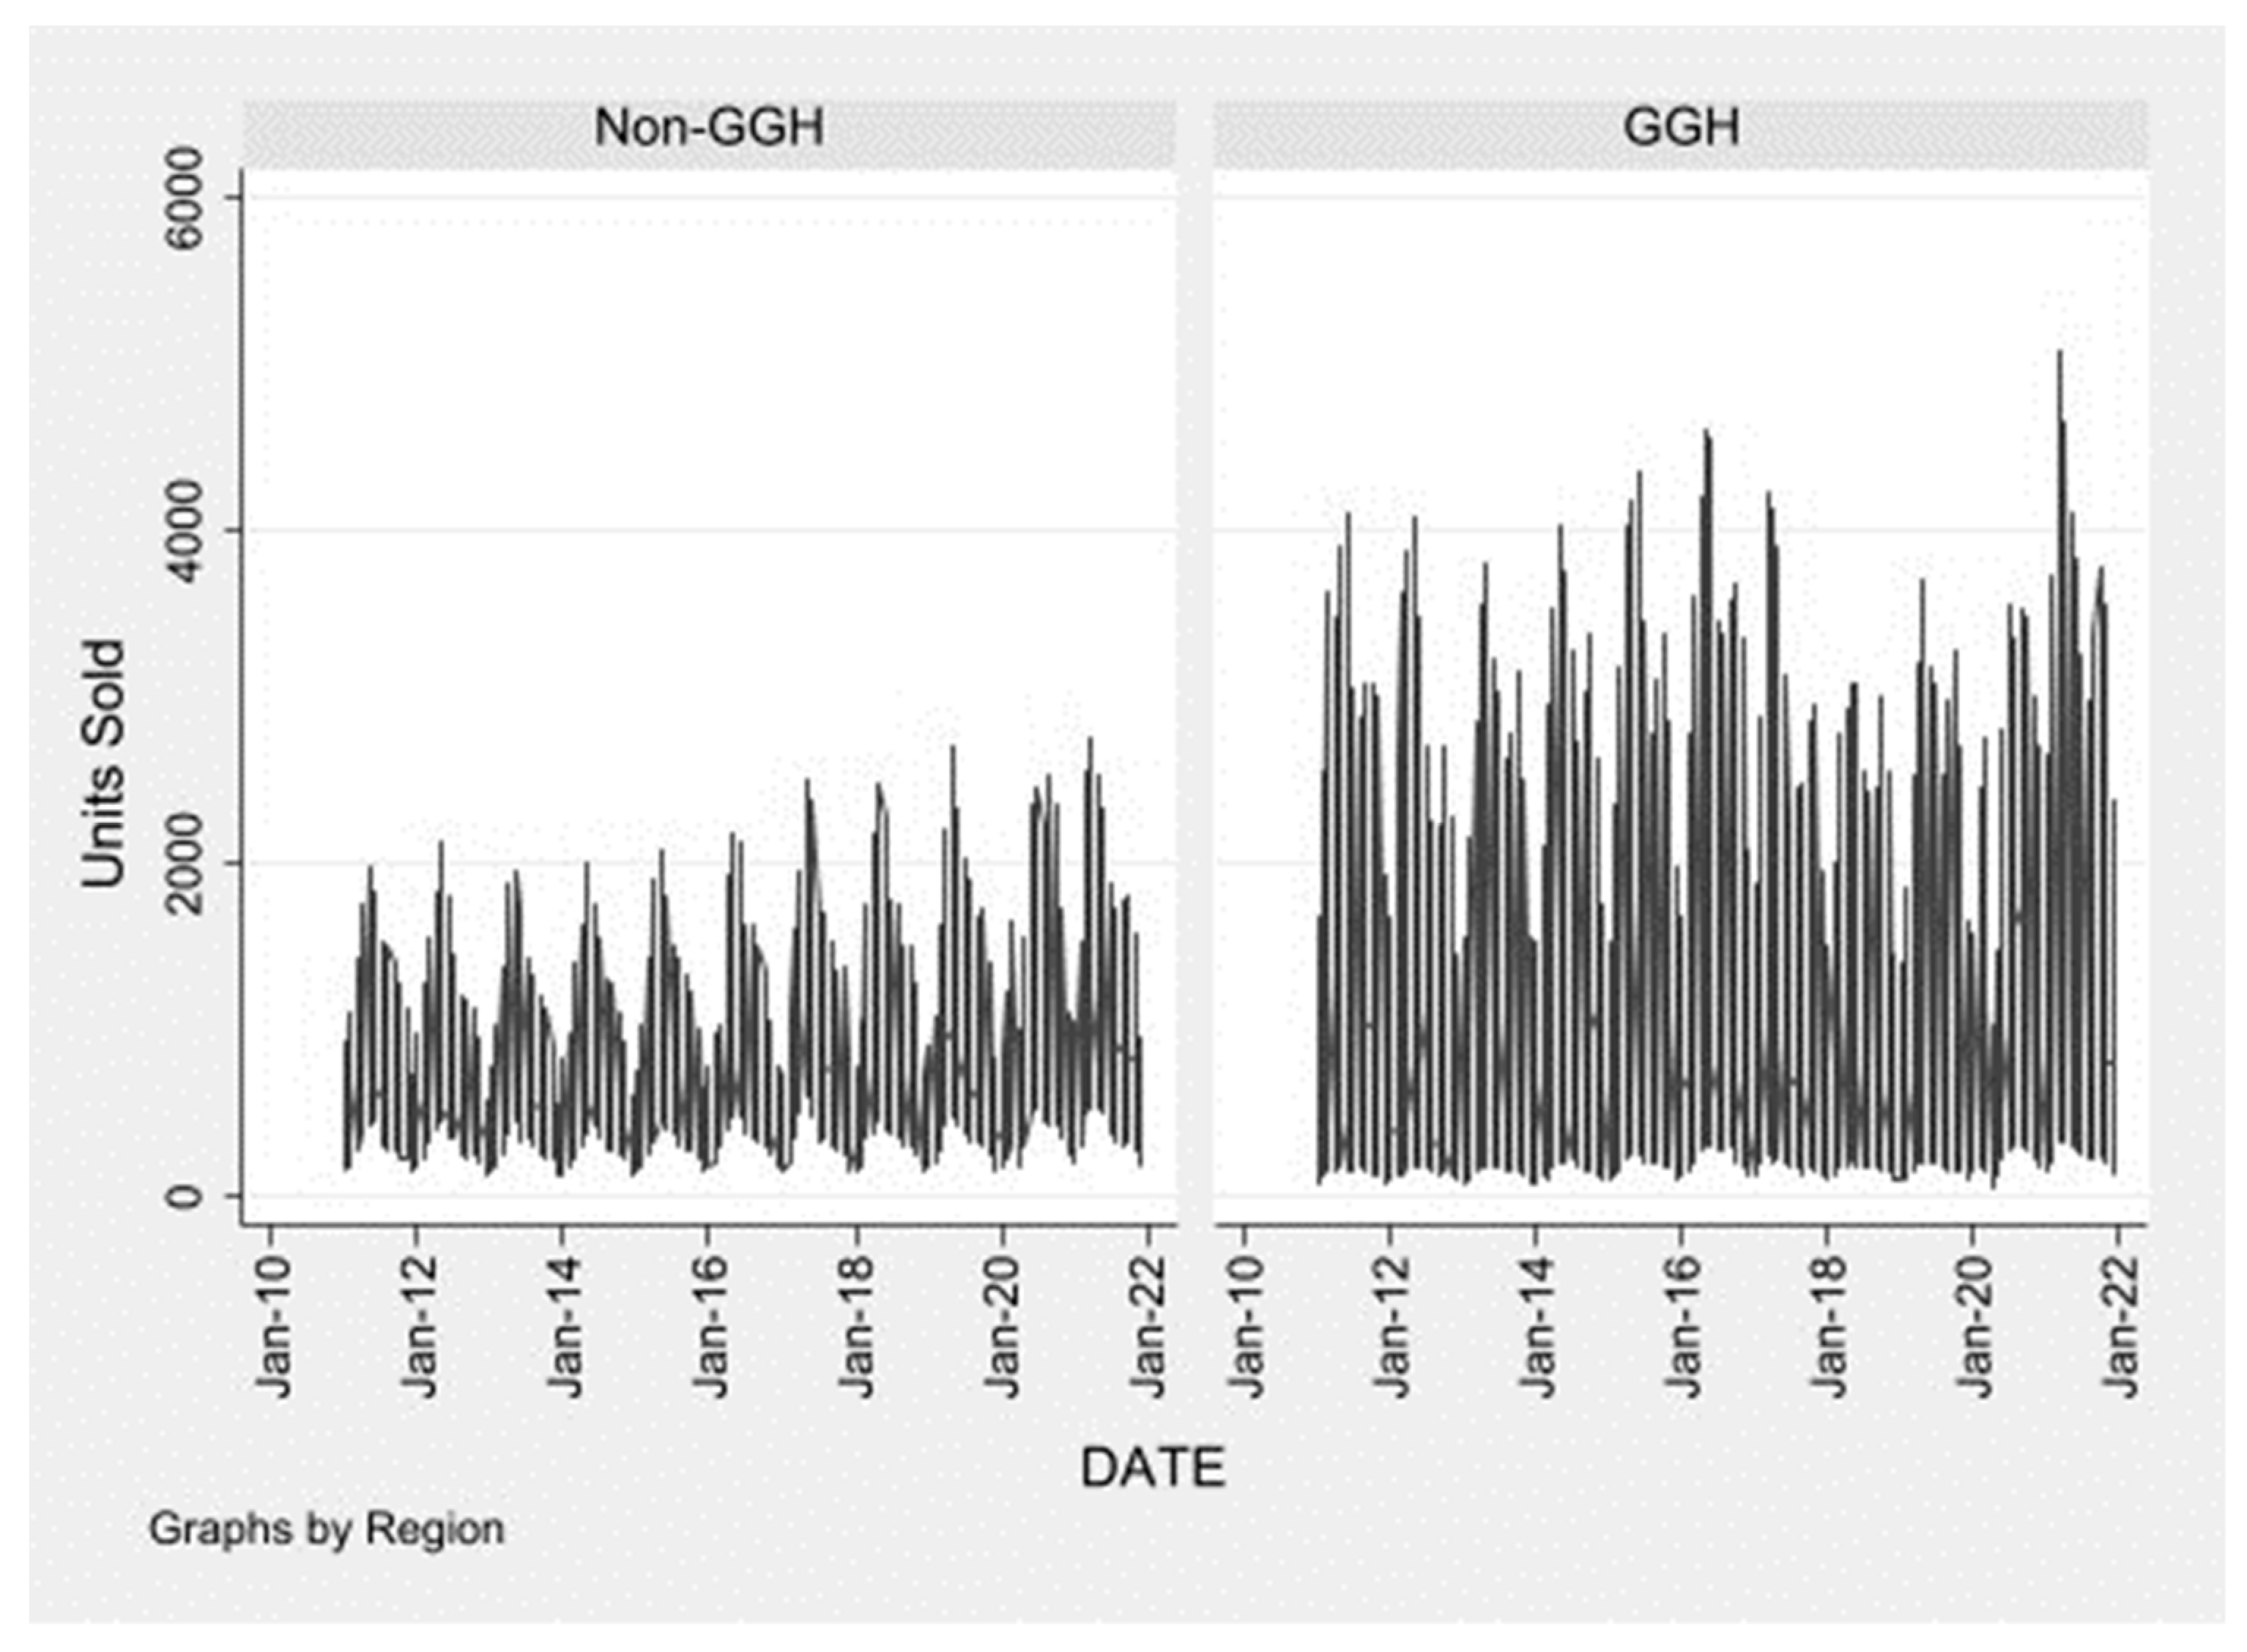
| Toronto | Hamilton | Guelph | KWC | Niagara | London | Windsor | Ottawa | Kingston | |
|---|---|---|---|---|---|---|---|---|---|
| Average Units Sold (Month) | GGH | Non-GGH | |||||||
| September 2012 to April 2017 | 2992 | 1137 | 395 | 666 | 179 | 683 | 517 | 1306 | 283 |
| May 2017 to December 2021 | 2841 | 1183 | 391 | 733 | 192 | 795 | 608 | 1722 | 335 |
| Change | −5% | 4% | −1% | 10% | 7% | 16% | 18% | 32% | 18% |
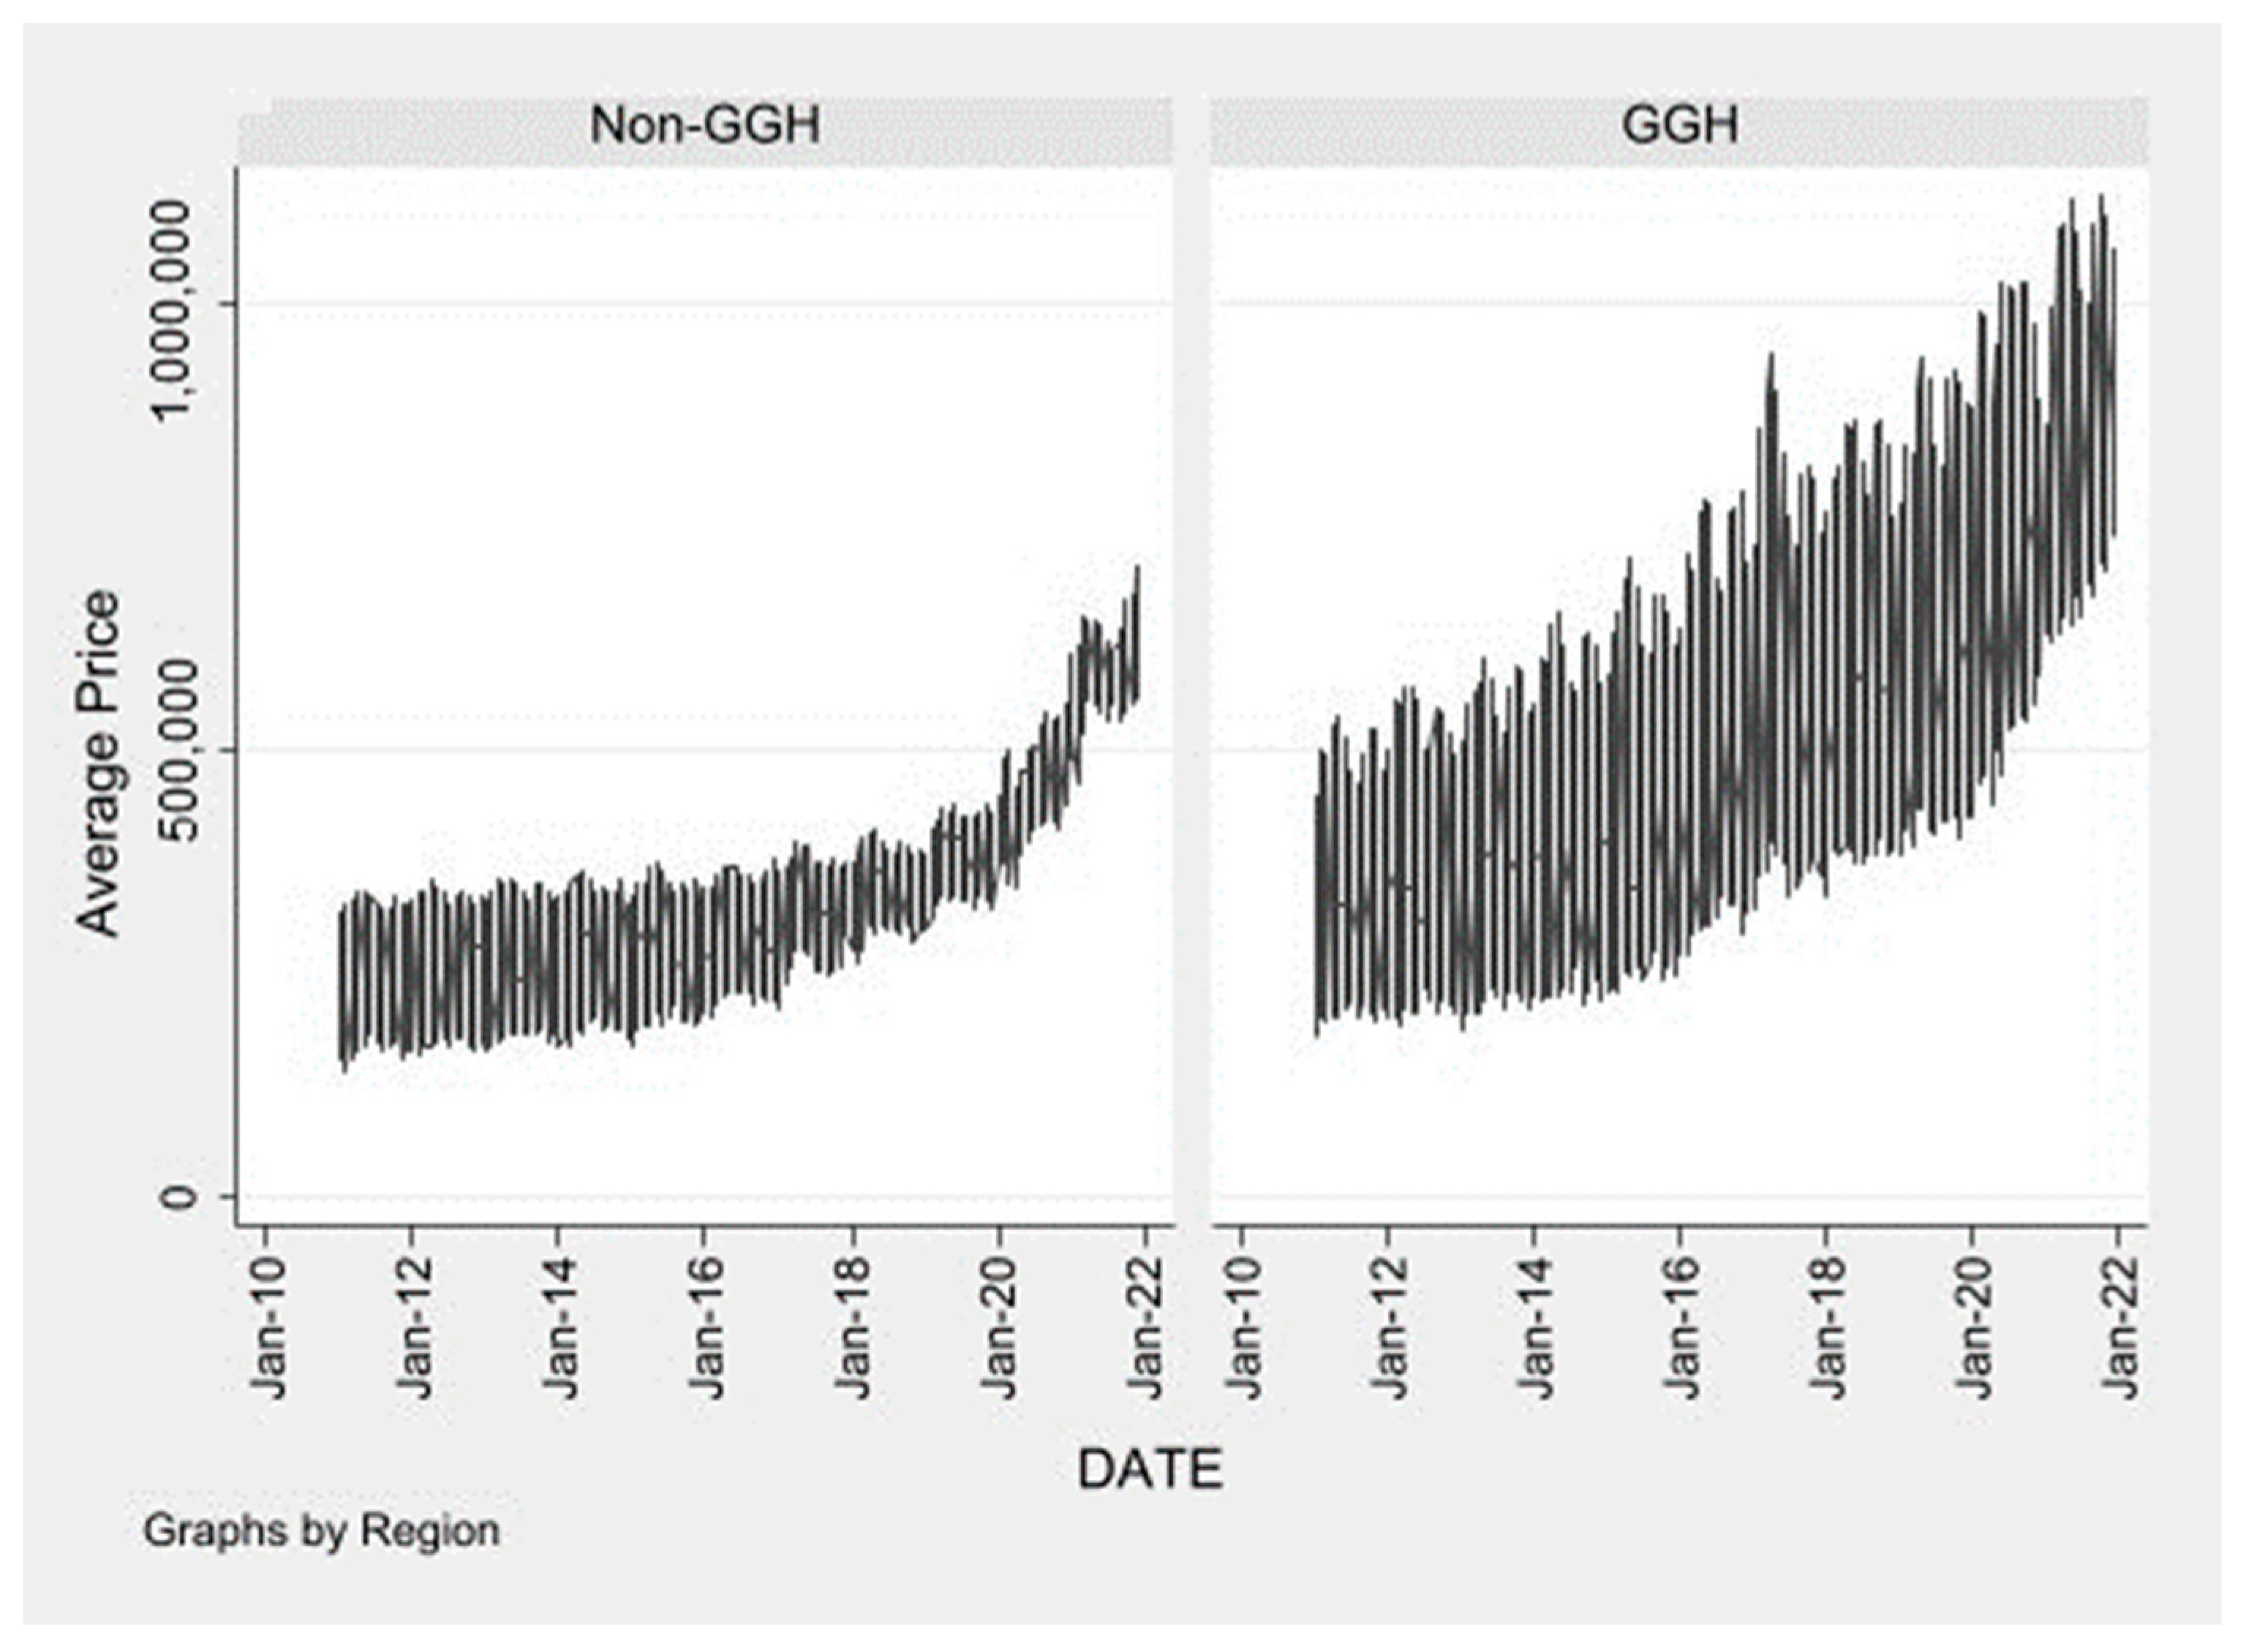
| Average Price | |||||||||
| January 2014 to April 2017 | 646,332 | 416,319 | 436,289 | 350,617 | 255,885 | 261,942 | 197,367 | 352,869 | 294,359 |
| May 2017 to December 2021 | 913,780 | 656,046 | 682,109 | 573,252 | 474,333 | 455,463 | 370,390 | 470,924 | 431,095 |
| Change | 41% | 58% | 56% | 63% | 85% | 74% | 88% | 33% | 46% |
| GGH Region | Non-GGH Region | ||||||||
|---|---|---|---|---|---|---|---|---|---|
| Period/Months | −3, +3 | −6, +6 | −12, +12 | −56, +56 | −3, +3 | −6, +6 | −12, +12 | −40, +40 | |
| N (0/1) | 15/20 | 30/35 | 60/65 | 281/284 | 12/16 | 24/28 | 48/52 | 224/228 | |
| DF | 1 | 1 | 1 | 1 | 1 | 1 | 1 | 1 | |
| Units Sold | |||||||||
| Z | −0.5167 | −0.3356 | 1.0971 | −0.3608 | −1.7876 | −2.1661 | 0.1483 | −3.0738 | |
| Χ2 | 0.2844 | 0.1171 | 1.2090 | 0.1304 | 3.2789 | 4.7316 | 0.0230 | 9.4505 | |
| Pr > Χ2 | 0.5938 | 0.7322 | 0.2715 | 0.7181 | 0.0702 | 0.0296 | 0.8794 | 0.0021 | |
| Avg Price | |||||||||
| Z | −0.5833 | −1.0988 | −2.115 | −14.383 | −1.1374 | −1.6245 | −3.239 | −15.358 | |
| Χ2 | 0.3600 | 1.2218 | 4.4734 | 206.8732 | 1.3470 | 2.6688 | 10.5150 | 235.8951 | |
| Pr > Χ2 | 0.5485 | 0.2690 | 0.0344 | <0.0001 | 0.2458 | 0.1023 | 0.0012 | <0.0001 | |
| Dependent Variable | Coefficient | Std. Err. | t | p > t | 95% Conf. | Interval |
|---|---|---|---|---|---|---|
| Average price | 91,853.120 | 19,422.480 | 4.730 | 0.001 | 47,064.810 | 136,641.400 |
| Units sold | −131.038 | 73.151 | −1.790 | 0.111 | −299.724 | 37.648 |
| Units created | 40.510 | 101.641 | 0.400 | 0.701 | −193.875 | 274.896 |
| Absorption rate | −12.307 | 9.551 | −1.290 | 0.234 | −34.331 | 9.716 |
| Vacancy rate | 0.987 | 0.474 | 2.080 | 0.071 | −0.107 | 2.081 |
| CMAs | Toronto | Hamilton | Guelph | KWC | Niagara | London | Windsor | Ottawa | Kingston | |
|---|---|---|---|---|---|---|---|---|---|---|
| Region | GGH Region | Non-GGH Region | ||||||||
| Mortgage | p | 0.2533 | <0.0001 | <0.0001 | <0.0001 | <0.0001 | <0.0001 | 0.0008 | <0.0001 | <0.0001 |
| t | −1.15 | −9.90 | −12.44 | −8.94 | −10.16 | −7.88 | −3.43 | −6.32 | −9.06 | |
| Property Tax | p | 0.1695 | 0.0770 | 0.0356 | 0.0029 | 0.0109 | 0.0007 | <0.0001 | <0.0001 | <0.0001 |
| t | −1.38 | 1.78 | 2.12 | 3.04 | 2.59 | 3.46 | 5.28 | 5.47 | 4.32 | |
| Units Sold | p | <0.0001 | <0.0001 | 0.0001 | 0.0073 | 0.2379 | 0.3203 | <0.0001 | 0.0002 | 0.0728 |
| t | 10.33 | 4.36 | 3.99 | 2.73 | 1.19 | 1.00 | 4.08 | 3.86 | 1.81 | |
| Units Created | p | 0.2611 | 0.7281 | 0.0548 | 0.2295 | 0.5833 | 0.7831 | 0.9843 | 0.6795 | 0.4844 |
| t | −1.13 | 0.35 | −1.94 | −1.21 | −0.55 | −0.28 | 0.02 | −0.41 | 0.70 | |
| Absorption Rate | p | 0.2571 | 0.0031 | 0.0001 | 0.0897 | 0.1410 | 0.5674 | <0.0001 | 0.0058 | 0.3506 |
| t | 1.14 | 3.02 | 4.01 | 1.71 | 1.48 | 0.57 | 5.68 | 2.81 | −0.94 | |
| Vacancy Rate | p | 0.7740 | 0.0470 | <0.0001 | 0.2146 | 0.0036 | 0.1314 | 0.0014 | <0.0001 | 0.4039 |
| t | −0.29 | −2.01 | 6.65 | 1.25 | 2.97 | 1.52 | 3.26 | 6.73 | 0.84 | |
| Unemployment Rate | p | 0.7362 | 0.4212 | 0.0027 | 0.6242 | 0.0014 | 0.0667 | <0.0001 | 0.4316 | 0.1829 |
| t | −0.34 | 0.81 | −3.06 | −0.49 | 3.27 | 1.85 | −4.58 | −0.79 | −1.34 | |
| Population | p | <0.0001 | <0.0001 | <0.0001 | <0.0001 | <0.0001 | <0.0001 | <0.0001 | <0.0001 | <0.0001 |
| t | 10.78 | 14.47 | 17.42 | 22.03 | 16.87 | 21.54 | 9.12 | 10.57 | 20.10 | |
Publisher’s Note: MDPI stays neutral with regard to jurisdictional claims in published maps and institutional affiliations. |
© 2022 by the authors. Licensee MDPI, Basel, Switzerland. This article is an open access article distributed under the terms and conditions of the Creative Commons Attribution (CC BY) license (https://creativecommons.org/licenses/by/4.0/).
Share and Cite
Rauf, M.A.; Weber, O. Housing Sustainability: The Effects of Speculation and Property Taxes on House Prices within and beyond the Jurisdiction. Sustainability 2022, 14, 7496. https://doi.org/10.3390/su14127496
Rauf MA, Weber O. Housing Sustainability: The Effects of Speculation and Property Taxes on House Prices within and beyond the Jurisdiction. Sustainability. 2022; 14(12):7496. https://doi.org/10.3390/su14127496
Chicago/Turabian StyleRauf, Muhammad Adil, and Olaf Weber. 2022. "Housing Sustainability: The Effects of Speculation and Property Taxes on House Prices within and beyond the Jurisdiction" Sustainability 14, no. 12: 7496. https://doi.org/10.3390/su14127496
APA StyleRauf, M. A., & Weber, O. (2022). Housing Sustainability: The Effects of Speculation and Property Taxes on House Prices within and beyond the Jurisdiction. Sustainability, 14(12), 7496. https://doi.org/10.3390/su14127496