Article

The Evolution of Ecological Space in an Urban Agglomeration Based on a Suitability Evaluation and Cellular Automata Simulation

School of Architecture and Art, Central South University, Changsha 410017, China
*
Author to whom correspondence should be addressed.
Sustainability 2022, 14(12), 7455; https://doi.org/10.3390/su14127455
Submission received: 25 April 2022 / Revised: 15 June 2022 / Accepted: 15 June 2022 / Published: 18 June 2022
(This article belongs to the Special Issue Urban Planning and Sustainable Land Use)

Abstract

:
Changing and reconstructing the ecological space of urban agglomerations is inevitable for ecological conservation and a scientific problem that needs urgent attention from geography, ecology, and urban and rural planning. Using ArcGIS and other software for data processing, this study established a spatial attribute database, constructed a land use conversion matrix of the Changsha-Zhuzhou-Xiangtan (CZX) urban agglomeration’s ecological space, and quantitatively analyzed the main changes in ecological land. Using a trained cellular automata model with predicted land use in 2035 as the threshold value, the simulation research was presented by creating two simulation scenarios for the spatial distribution of land use by 2035 in the “Green Heart” area of the CZX urban agglomeration. The simulation results were compared, and the constraining role of land use suitability evaluation on ecological space evolution was analyzed. This study found that the total area of ecological space in the Green Heart area saw a rapid reduction, and it predicted that, by 2035, the total area of the CZX Green Heart area will have decreased. Comparing the two simulation scenarios proved the hypothesis that zoning ecological space reconstruction based on a land suitability evaluation can effectively protect ecological space and ensure ecological network functions are harnessed.

1. Introduction

The requirements for economic growth and urban diversity have exerted an impact on increasing pollution and declining environmental quality [1]. As metropolitan regions and urban agglomerations emerge and the spatial patterns evolve, the multi-level correlation and local impact of rapid urbanization have already become one of the most prominent issues in sustainable development worldwide. A series of development and construction activities has contributed to greater erosion of the ecological space. Every metropolitan region or urban agglomeration is confronted with the conflict between ecological conservation and resource development [2,3]. It is a major challenge posed to countries around the world to protect the ecological space between and around cities, rationally optimize the ecological space of urban agglomerations, and build a favorable regional ecological security pattern [4].
Ecological space provides urban and rural ecosystem services, and is indispensable to ensure urban and rural ecological security and improve the quality of people’s life [5]. Since the 1980s, clear, unified conclusions or research methods have not been achieved in research on ecological land as the most basic material carrier of ecological space elements. Other countries’ ecological land categorizations tend to regard land as a whole and emphasize the natural attributes of land [6]. Many scholars have subsequently studied the connotations of regional ecological land from various perspectives [7,8,9,10,11]. Drawing on the concept and classification standards of Long et al. [11], this study defined regional ecological space as land space, excluding artificially hardened surfaces, with self-adjustment and recovery capabilities, to which other ecosystem services can provide direct or indirect environmental regulation and biological support, including arable land, woodland, grassland, and waterbodies.
Since ecological land is the core foundation that supports ecological space, there must be a guide through effective planning approaches. The protection and control of ecological space has also become the key to national land space planning. There have been attempts at this in major cities across the world from the 19th century to date. For example, in 1876, Frederick Law Olmsted designed the “Emerald Necklace”, an urban park and open-space system, which was the first example of resolving urban issues by establishing a way to connect parkways and park green spaces [12,13]. To prevent urban sprawl from erosion to rural and suburban ecological land, the “Green Belt Policy” [14] was launched in the Greater London Plan; actions to protect the “Green Heart” in the Netherlands were proposed in five national spatial plans towards the disorderly expanding Randstad [15]; the urban agglomerations in the Pearl River Delta in Guangdong, China have effective connections to more than 200 forest parks, nature reserves, scenic spots, country parks, etc. through the established greenways [16].
From the perspectives of landscape ecology and geography, most of the current researches on ecological land used geographic information systems (GIS) and remote sensing (RS) to analyze the laws of ecological land change and proposed plans and strategies towards ecological land optimization; in addition, starting from the ecological security pattern, these researches investigated the relationship between ecological security and ecosystem services [17,18]. In recent years, many scholars have begun to use qualitative and quantitative methods, comprehensive models, etc. [19] to investigate the evaluation of ecological land use suitability and ecological service value. Land use suitability evaluation, also known as land ecological suitability evaluation, was first proposed by Ian McHarg who defined land suitability as “the inherent suitability of the land for some specific, persistent uses. This land is determined by such characteristics as hydrology, geography, topography, geology, biology, sociology, etc. [20].” From a variety of methods for land suitability analysis, McHarg’s overlay analysis is the most widely used. The sophisticated and popular geographic information system (GIS) has effectively overcome such issues as opacity of multi-map overlay drawings and limited weight of elements and breadth of evaluation factors [21]. Some scholars have based green space classifications and green space system layouts on land-use suitability evaluations, and investigated the temporal and spatial changes in ecological land at different scales from the perspective of data reconstruction [22]. Additionally, with the rapid development of computer technology, it will become a new research trend to use mathematical methods such as CA, ant colony algorithm, grey system theory and Agent for scenario simulations and evaluations of ecological land [23,24,25].
As for the research on ecological land in China, the existing studies mainly concentrated on the economically developed coastal areas, such as the Beijing-Tianjin-Hebei region [26], Tianjin Binhai New Area [27], and the city of Shenzhen [28]. In contrast, other regional ecological spaces, such as inland urban agglomerations, have received limited attention from scholars. The Green Heart project in the Changsha-Zhuzhou-Xiangtan (CZX) urban agglomeration is currently the only large-scale Green Heart area in an urban agglomeration in Chinas; with an area three times that of the Green Heart area in the Randstad urban agglomeration in the Netherlands (approximately 150 km2), it is the largest urban agglomeration in the world [29]. Over the years, the rapid expansion of construction land in Changsha, Zhuzhou, and Xiangtan has posed major threats to the ecological environment in the Green Heart area, where the ecological land has been invaded continuously. The protection plans for the Green Heart area developed by the government departments to protect its ecological environment are human-oriented land management schemes using primarily qualitative analytical methods. These protection plans are thus too subjective to fully reflect the objective laws of conversion between ecological land and construction land, making them less relevant and effective in protecting the ecological land in the Green Heart area. It is urgent for us to update the original planning techniques. Therefore, in addition to the conventional qualitative analytical methods, more objective quantitative analytical methods were introduced. Specifically, GIS was applied for spatial overlay analysis of remote sensing image data in different years, with a summary of the characteristics about the changing quantity and space of ecological land in the Green Heart area. Meanwhile, using an ecological land conversion matrix, the study analyzed the main direction of flow of ecological land in the CZX Green Heart area. Based on a land-use suitability evaluation as well as using the cellular automata (CA) model for simulation prediction of ecological space change characteristics of the CZX Green Heart area in 2035 under the different scenarios, the study also leveraged a comprehensive comparison and evaluation of the simulation results to investigate the key factors affecting the ecological land change in the Green Heart area. In this way, more relevant and feasible ecological space protection measures can be developed to provide a strong guarantee for the sustainable development and ecological land protection of the CZX urban agglomeration.

2. Study Area Overview and Data Sources

2.1. Study Area Overview

The concept for the CZX urban agglomeration Green Heart area was formally proposed in 2003. As shown in Figure 1, the Overall Plan for the Ecological Green Heart Area of the Changsha-Zhuzhou-Xiangtan Urban Agglomeration formulated in 2010 stated that the project would encompass 17 towns and townships, 4 sub-district offices, 124 administrative villages (neighborhood committees), and 638 settlements across the urban agglomeration’s three cities, covering a total area of 522.87 km2. The Green Heart area has a subtropical monsoon climate, with hot summers and cold winters, and four distinct seasons. It contains many rivers and lakes and thus has abundant water resources. However, due to poor overall circulation and uneven rainfall distribution, floods, and droughts frequently occur in summer [30].

2.2. Data Sources

Land-use data for the CZX urban agglomeration for the five years of 1980, 1990, 2000, 2010, and 2017 published by the Geographical Information Monitoring Cloud Platform were used as the research data, with a resolution of 500 m × 500 m.
China’s national land-use data product released by the Geographical Information Monitoring Cloud Platform uses Landsat TM/ETM/OLI remote sensing images as the main data source. After image fusion, geometric correction, image enhancement and stitching, the national land-use types are divided into six first-order categories, 25 s-order categories, and some third-order categories (as shown in Table 1). With a relatively mature classification system, this data product has been approved by Chinese competent authorities and widely used by local government agencies. To maintain a scientific and consistent study, the land-use classification standard of the platform was applied in the present study instead of using a new classification standard.

3. Methodology

3.1. Research Approach

Figure 2 shows the research approach of this study. The first step was to collect relevant data from field inspections, use ArcGIS software to process them, establish a spatial attribute database, and use 500 m × 500 m grids as the basic units to evaluate land suitability. The second step involved using ArcGIS software tools (Esri Corporation, Redlands, CA, USA) to conduct an overlay analysis of five-year ecological spatial thematic maps. More specifically, a series of dynamic evolution conversion matrices of ecological space for four periods (including 1980–1990, 1990–2000, 2000–2010, and 2010–2017) were constructed. Third, the threshold values predicted by a trained CA model was used to simulate the spatial distribution of land use in the Green Heart area in 2035. After that, this study established different simulation scenarios, compared the simulation results, and analyzed the constraining effect of land suitability evaluation on the evolution of ecological space.

3.2. Ecological Land Use Conversion Matrix

A land-use conversion matrix was used to describe quantitatively the circulation state of a system in system analysis. Moreover, a land-use matrix can be used to directly reflect the trends and quantities of land circulated in a specific period. Based on its principles and methods, a series of ecological land conversion matrices that reflect regional ecological changes were established, including a conversion-in matrix and a conversion-out matrix. The conversion-in matrix represents the conversion from non-ecological land to ecological land, reflecting an increase and the source of ecological land. The conversion-out matrix represents the conversion from ecological land to non-ecological land, reflecting a decrease in and the direction of the flow of ecological land. This is calculated as follows:
A i j = [ A 11 A 1 n A n 1 A nn ]
where n is the total number of ecological land types, i and j are the pre-conversion and post-conversion land categories, respectively, and Aij is the area of converted land.

3.3. Dynamic Measurement of Ecological Space

The total area and dynamic measurement of ecological space are the main indicators for measuring the characteristics of ecological space. The dynamic measurement of ecological space (Rd) refers to the speed of change of ecological space in a certain period and is used to describe the dynamic change of ecological space [31]. The calculation formula is as follows:
R d = ( U b U a ) ÷ U a × 1 T × 100 %
where Ua and Ub are the total areas (km2) of ecological space at the beginning and end of the study period (T), respectively.

3.4. Evaluating Land Suitability

The following principles were adopted for the indicators of this evaluation process: (1) factors with a dominant role; (2) factors with obvious differences and critical values; (3) relatively stable evaluation factors; (4) measurable factors; and (5) relatively independent factors. This study used an expert scoring method to determine the importance of comparison and preliminary scoring of different indicators and then employed the analytic hierarchy process software (YAAHP) to construct an index system and evaluation index judgment matrix. After that, the weights of the evaluation factors were subsequently obtained through the consistency test. Data standardization and uniform value ranges revealed that the estimated values used for the assumed factors were dimensionless. The evaluation values were 0–10. The higher the evaluation value, the better the suitability and the greater the benefit to development and construction.
Referring to the stipulations in the Food and Agriculture Organization’s A Framework for Land Evaluation [32], a land-use evaluation was carried out on all aspects of the evaluation units based on the suitability of land use, the strength of restrictions, and the locational benefits to obtain an overall score for each grid. After data processing, the final evaluation results were determined. For each delineated spatial unit, the standardized score for each factor was multiplied by the weight, and was added together to determine the corresponding overall evaluation value.
K = i   =   1 n   x i a i
where K represents the comprehensive score of each evaluation unit, i represents the i-th evaluation factor, xi is the value of the i-th factor, and ai represents the weight of the i-th factor.
In this study, the main influencing factors were divided into terrain, transportation, urban and rural construction, and land use obstruction factors. For terrain factors, the three most representative indicators, namely the slope, elevation, and water system, were selected. Generally, the greater the slope and the higher the elevation, the poorer the land-use suitability and the lower the score [33]. Different slopes have different water and heat conditions and physical and chemical soil properties due to different solar irradiance and sunshine hours. As a result of different incident angles of the sun, hillside slopes receive different solar radiation; thus, their temperature and other ecological factors are constantly changing. Altitude is one of the most relevant factors for changes in mountain topography. The transportation factors were divided into two categories: external transportation and internal transportation. Internal transportation is an important locational benefit, whereas external transportation determines the isolation effect. Accordingly, the two categories were separated. Urban and rural construction factors mainly consider the impact of current construction on the land and inherent locational benefits [33].
These factors consider the impact of different land-use types and current construction intensity. The closer the current centralized construction land is to concentrated construction land and the higher the construction intensity, the better the construction conditions and the higher the score. The land-use obstruction factors were divided into the ecological conservation indicator and the natural and human resources impact indicator. Natural and human resources include many important natural and human landscapes, such as nature reserves, forest parks, and scenic spots, which have good economic attractiveness and development advantages. However, if they are too close, it impacts and undermines related resources. The ecological conservation indicator refers to the ecological sensitivity of different vegetation zones in the Green Heart area and divides them into low-sensitivity areas, ordinary-sensitivity areas, moderate-sensitivity areas, high-sensitivity areas, and extremely high-sensitivity areas [34]. The greater the ecological sensitivity, the more fragile the ecological environment, and the worse the construction conditions, and vice versa.

3.5. Cellular Automata Model

3.5.1. Operating Principle

The CA model is a network dynamics model proposed by Von Neumann in the 1940s to simulate discrete network interactions and causal relationships in time and space through simple local operations. It is also a type of parallel computing model [35]. The standard CA model determines the conversion of the state of the central cell based on the state of its neighboring cells, which is expressed in the following mathematical formula [36]:
S t + 1 ( x , y ) = f ( S t ( x , y ) , N )
The entire cell space is the distribution of state set S at time t in a one-dimensional space. In the above formula, S t + 1 represents the state of the cell at the next moment, S t the state of the cell at time t, N the overall state of the cells neighboring the target point, and f the conversion rule function. Not only does the expansion of land use depend on the expansion of the state, but it also controls the simulation process by adding some constraints to the CA model, thereby producing a sustainable and reasonable layout of land-use expansion.
Based on the suitability evaluation results, the range of alternative construction land was determined, and a CA model was constructed by taking the total amounts of actual construction land in 2018 and 2019 as the threshold values for the expansion of land in the two simulations before and after those dates. Taking the grid covering current construction land as the initial state, several rounds of cell state change iterations (state change from non-construction land to construction land) were performed until the total amount of construction land reached the total construction scale in the specific year, at which point the simulation ended.
The details of how the CA model works at different stages and the logical decision rules are illustrated below as well as in Figure 3 and Figure 4.
Step 1 used the 3 × 3 Moore model as the cellular neighborhood model and obtained all non-prohibited grid attribute tables with five attribute values as the T0 state of the land boundary.
Step 2 input the T0 state into the recursive function of the CA model and calculated the new evaluation value of each non-construction land grid based on the conversion rule, replacing the original evaluation value in the T0 state. The conversion rules are as follows:
v a l u e n e w = 0.4 r i d v a l u e r i d t y p e r i d + 0.6 v a l u e b e f o r e
The new suitability evaluation value of the central grid was calculated as the sum of the products of value and type of the surrounding adjacent grids and its own original suitability evaluation value.
Step 3 adjusted the internal parameter v of the CA and selected different growth rates (non-construction land grids were sorted, from large to small in order of their new evaluation values, the percentage was set, and the part of the grid with larger evaluation values became construction land, that is, the type value in the T0 state was changed from 0 to 1).
Step 4 recursed once to arrive at the land boundary growth result in the TT1 state.
Step 5 counted the total number of construction land grids and determined whether the upper limit of construction land for the preset period had been reached. When it was reached, the process proceeded to the next step; otherwise, it returned to Step 2 and input T1 to continue the recursion.
Step 6 output land-use boundary growth result Tn, where n is the number of recursions, both the value and type changed, and finally, land-use growth results under different growth rates were obtained.

3.5.2. Parameter Optimization

In the CA model, the iteration velocity parameter v was adjusted to obtain multiple sets of results. Under the models with different parameters, the number of cell transitions from non-construction land to construction land had a strong positive correlation with the average land suitability evaluation value of the cell set with the same number of changes. This demonstrated that the higher the average land suitability evaluation value, the more frequent cell state changes. As shown in Figure 5, the effect of the experimental data using 4 sets of different iteration velocity parameters was significantly lower than six and eight sets of parameters. Therefore, in order to obtain a better simulation result, this study decided to use the inflection point value of the accuracy evaluation result in the experiment of eight sets of iteration velocity parameters, as the optimal parameter value.

4. Results

4.1. Land-Use Suitability Evaluation Results

The second-order land suitability evaluation factors given in Table 2 above were used in the GIS database with Euclidean distance and then reclassified. Subsequently, all elements were unified into standardized value ranges according to the evaluation criteria to obtain single-factor evaluation results for all the factors (Figure 6). Finally, the normalized score of each factor was multiplied by its previously obtained weight and added together to obtain the final overall evaluation result. As shown in Table 3 and Figure 7, based on the overall suitability evaluation results, the overall score for the CZX Green Heart area was 0.1043–0.5514, which can be divided into five intervals. The total area of land with scores of 0.1043–0.1367 was 91.08 km2, accounting for 17.42% of the total area; 188.10 km2 of land had scores of 0.1367–0.1465, accounting for 35.98% of the total; 169.62 km2 of land had scores of 0.1465–0.1537, accounting for 32.44% of the total; 48.06 km2 of land had scores of 0.1537–0.1727, accounting for 9.19% of the total; and 26.02 km2 of land had scores of 0.1727–0.5514, accounting for 4.98% of the total land area.

4.2. Summary of Current Land-Use Conversion Characteristics

Table 4, Table 5 and Table 6 show that between 1980 and 2017, the conversion-in area of ecological space in the study area was only 0.76 km2, the conversion-out area of ecological space was 49.81 km2, and the mutual conversion area of ecological space was 9.64 km2. The conversion-out area of ecological space was far greater than the conversion-in area; thus, the total area of ecological space continuously shrank.
The trend shown in Table 4 and Table 5 and Figure 8 indicates that the total area of ecological space in the study area decreased annually by 1.84 km2, decreasing by 49.81 km2 between 1980 and 2017 in total. This change can be divided into two stages. The period from 1980 to 2000 was a period of slow reduction. During this period, the total area of ecological space decreased relatively slowly, with a total reduction of 6.97 km2, an average annual decrease of less than 0.35 km2. The period from 2000 to 2017 was a period of rapid reduction. During this period, the total area of ecological space declined by 46.82 km2, with an average annual rate of 2.75 km2, nearly eight-fold higher than that of the previous 20 years. With regard to dynamic measurement, the degree of change increased sharply from 2000, and it was highest after 2010, reaching −0.5174%. The reduction in ecological land was concentrated in the Xiangjiang River area, mainly for new urban construction land and township construction land.
From 1980 to 2017, there were notable differences in the conversion to non-ecological uses of the various land-use types, although most of the land was used as urban and rural construction land after conversion. Arable land and forestland were the main land-use types to be converted, followed by grassland and water bodies, with 26.22 km2 of forestland and 22.08 km2 of arable land converted (Figure 9), accounting for 52.65% and 44.33% of the total converted land, respectively. The study results indicate that the conversion of ecological space to construction land is highly common, mainly for urban development and transportation infrastructure.
There are three main reasons for this. One is intensive human activities in the CZX metropolitan area. To meet human working and living requirements, the size of the central urban area has expanded continuously, which has inevitably led to the conversion of ecological space into urban and rural construction land. Between 2000 and 2010, the integration process of the three cities of the CZX agglomeration continued to develop, greatly affecting the Green Heart area. From 2010 to 2017, due to the government’s policies to further encourage the integrated development of the three cities, their integration gathered pace. Governments at all levels in the three cities seized the development opportunities and accelerated the development trend for their own benefit. The Green Heart area, located in the center of the three cities of Changsha, Zhuzhou, and Xiangtan, which occupies a large area of land, has become a bonus area of the integrated development process. Second, the local economic benefits derived from construction land are far greater than those from ecological land, especially forestland. As the Chinese state has strengthened efforts to protect arable land, forestland has become the primary choice for conversion to construction land, which is a fundamental reason why forestland is the most converted land type. Third, policies to guide and protect the Green Heart area conflict with the urban master planning of the three municipal governments. In this study, the GIS software was applied for stitching, overlay, and comparison of Green Heart planning [37] and the construction land plan in the urban master planning of Changsha, Zhuzhou, and Xiangtan [38,39,40]. It revealed many inconsistencies between the Green Heart planning and the urban master planning, leaving much of the ecological land in the Green Heart area occupied for construction (as shown in Figure 10). This was mainly because the protection plans for the CZX Green Heart area were prepared by the Hunan Provincial People’s Government, who aimed to take account of the coordinated development of the CZX urban agglomeration as a whole, regarding the Green Heart area as the ecological isolation area of the urban agglomeration while keeping up with the trajectory of ecological conservation; the main objective for the local governments was development-oriented, as local governments treated the Green Heart area as a backup area for urban development and construction. Meanwhile, most of the construction land arranged by the three cities within the Green Heart conflicts with the protection plans for the Green Heart area, making it difficult to obtain the approval of the government at a higher level (the provincial government). As a result, many construction projects never started.

4.3. Simulation Accuracy Analysis

For a comprehensive research, this study combined the point-by-point comparison method and Kappa coefficient for calculation to verify the accuracy of the simulation experiment. The point-by-point comparison method focuses on the consistency of each cell scale, whereas the overall morphological method pays more attention to the consistency of the overall layout. From the comparison results, the point-by-point comparison accuracy simulated in the model experiment reached 89.1%, and the Kappa coefficient was 0.59, which indicates that the model achieved good results. Table 7 shows the confusion matrix for the evaluation of the simulation accuracy. In addition, the Moran’s I index, which reflects the overall shape of the city, was calculated, and the value was 0.477 in 2019, the value of actual urban land in 2018 was 0.479, and the value of the simulated urban land in 2018 was 0.481. This indicates that the overall form produced by the simulation was highly similar to the actual form.

4.4. Simulation Prediction of Future Development

Based on the number and pattern of ecological green land in the CZX urban agglomeration in 2017, this study fitted the construction land data over the years to predict construction land in 2035. It used the trained CA model to obtain the predicted value of the land in 2035 as the threshold and simulated the spatial distribution of land use in the Green Heart area in 2035, creating two simulation scenarios to obtain the corresponding spatial evolution patterns. Then, the land use simulation results were compared under the two scenarios to verify whether the zoning reconstruction strategy based on the suitability evaluation results could play a protective role in the development of ecological space. Scenario 1: No constraints were set. Under the condition of no control, the guiding and controlling role of the government was minimized. Under this scenario, the only constraints were terrain factors, whereas the market and capital were dominant factors in urban development, and economic development was the only driving force of expansion. Scenario 2: The coupling suitability evaluation results were used as constraints. From the perspective of ecological conservation, the CZX Green Heart area was divided into the following five zones: prohibited construction, strictly limited construction, generally restricted construction, basically suitable for construction, and suitable for construction [41] (Table 8 and Figure 11). Based on the zoning in the model, this study then increased corresponding constraints and predicted the future development of land use.
Based on the conversion matrix of land-use types in the Green Heart area from 1980 to 2017 (Table 4), a conversion probability matrix of land-use types was calculated for 1980–2017, and a land-use conversion matrix was calculated for 2017–2035 based on the areas of land-use types in 2017 (Table 9).
Figure 12 and Table 10 show that the total area of ecological space in the CZX Green Heart area will decrease by 2035 under Scenario 1 and Scenario 2, with reductions of 136.22 km2 and 114.44 km2, respectively. This includes decreases of 36.33 km2 (Scenario 1) and 30.77 km2 (Scenario 2) of forestland; a decrease of 0.11 km2 of grassland under both scenarios; decreases of 96.78 km2 and 81 km2 of arable land; and decreases of 3 km2 and 2.56 km2 of waterbodies. Evaluating from the land-use conversion matrix (Table 11) and the results of Simulation Scenario 1, by 2035, nearly 7 km2 of arable land and more than 30 km2 of forestland will have been converted to other ecological space, which indicates that occupation pressures on forest spaces will remain high. The main areas where ecological space is occupied are distributed through the west of the Green Heart area and east of the Xiang River. Ecological spaces in Zhuzhou and Xiangtan, in contrast, will not change significantly. According to the analysis of the dynamic measurement of single land uses (Table 12), under the two scenarios from 2017 to 2035, the dynamic measurement of forestland under Scenario 1 is most negative, reaching −0.75%, followed by water bodies, reaching −0.61%. Under Scenario 2, the dynamic measurement of water bodies is most negative, reaching −0.52%, followed by grassland, at −0.13%.
In terms of the pattern of ecological space, it does not change greatly compared with 2017. Forestland still accounts for the majority and is relatively concentrated. Comparing the two simulation prediction scenarios showed that the reduction in the area of ecological space after setting ecological reconstruction constraints in Scenario 2 was much smaller than that in Scenario 1, with the change in forestland kept to within approximately 3 km2 and the change in arable land within 1.5 km2. Therefore, zoning of ecological space reconstruction based on the land suitability evaluation can effectively protect ecological space and ensure that ecological network functions are harnessed effectively. There is an overall increase in the area of construction land; under Scenario 1, the main areas at risk of urbanization in the CZX urban agglomeration are concentrated in the suburbs of Changsha, Zhuzhou, and Xiangtan, as well as the junctions of the three cities, with each city cluster becoming increasingly integrated. There is a notable trend of urban integration caused by the rapid expansion of city clusters in all directions along major transportation arteries [4]. Scenario 2 is better at maintaining the connectivity of natural ecosystems, preventing disorderly urban sprawl, and shaping a positive pattern of urban-rural development.

5. Discussion

5.1. Characteristics of Ecological Land Change

Between 1980 and 2017, the area of land converted from ecological space to non-ecological space in the CZX Green Heart area was much larger than the growth in ecological space, reaching 49.81 km2. Between 2000 and 2017, there was a rapid reduction in ecological space, totaling 46.82 km2, giving an average annual rate of more than 2.75 km2, nearly eight-fold higher than the previous 20 years. In terms of actual land use after 2000, urban expansion was the main reason for reduced ecological land. With regard to dynamic measurement, the degree of change increased sharply from 2000, and it was highest after 2010, reaching −0.5174%. In terms of land type, the area of converted forestland was the largest, reaching 26.22 km2, whereas the area of converted arable land was 22.08 km2, accounting for 52.65% and 44.33% of all converted land, respectively.
By 2035, the total area of ecological space in the CZX Green Heart area is predicted to decrease under both Scenario 1 and Scenario 2. The reduction in the area of ecological space is much smaller under Scenario 2 than that under Scenario 1. The change in forestland is kept within approximately 3 km2, and the change in arable land is kept within 1.5 km2. Therefore, the zoning of ecological space reconstruction based on the land suitability evaluation can effectively protect ecological space and ensure that ecological network functions are harnessed effectively.

5.2. Ecological Space Protection Strategy

Previous studies have shown that excessive fragmentation of patches of ecological space is a cause of the deterioration in the overall ecological environment. The elements of ecological space vary in the Green Heart area. While establishing the entire Green Heart space system, these elements must be integrated into a complete system to improve the complex ecosystem, ensure the ecological security of the urban agglomeration, and promote the transformation of industrial ecology. From its inception since 1970s, the Dutch defragmentation program (Meerjarenprogramma Ontsnippering, MJPO) has laid a solid foundation for the construction of a nature network. This policy also set quantitative growth targets and proposed the elimination of obstacles to the connectivity from transport infrastructure to habitat over the years. In 1990, the Dutch government launched the National Ecological Network program to connect individual ecological units into a continuous and complete ecological space subject to zoning control [42]. Although zoning control was also adopted for Amsterdamse Bos, or the Amsterdam Forest, which lies in two municipalities, the Amsterdam Forest was zoned based on a combination of considerations, including the distribution of people residing in the cities and surrounding areas, recreational needs, use intensity, and surveys of background natural resources [43]. The Randstad area has seen constant changes in its urban development structure in the five spatial plans, developing from the initial concept of a single “Green Heart” to a delta “blue-green network”, and finally a mature urban network and open space system. At the same time, the core concept of “Green Heart” also follows the requirements of the higher-level planning [44]. Therefore, the approach to protection of the “Green Heart” area in the Randstad is shifting from “absolute protection” to a central open space based on the Green Heart. Similarly, “absolute protection” does not meet the development needs of the CZX urban agglomeration. The present study was directed towards finding a balance between regional development and Green Heart protection.
In view of the above experiences, the study took the perspective of ecological conservation, and based on the comprehensive score results of the suitability evaluation, zoned the CZX ecological Green Heart area for spatial control. This offered the Green Heart area greater room for development and adjustment while protecting its ecological space. In addition, the following guidelines were proposed for the spatial planning of metropolitan regions or urban agglomerations:
(1) Focus on the network construction of ecological spatial planning. With reference to the experience of establishing a regional ecological network system, create connections for elements within the ecological space, provide habitats for wild animals and plants, and consider policies for restoration of habitat fragmentation due to infrastructure, with an emphasis on ecological connections between urban agglomerations.
(2) Focus on spatial differences and diversity. Depending on the characteristics and the nature of different spaces, set development strategies and goals, improve the natural and cultural quality of the spaces, meet different usage requirements, and promote the quality of life for urban residents.
(3) Encourage cooperation among non-governmental organizations and engagement from the public. The prospect of regional development is related to the whole population, involving different authorities and individual participants. Healthy and orderly development in the region can be achieved in the future only with concerted efforts.
(4) Strictly implement policies of ecological conservation and reasonably delineate redlines for ecological conservation. Redlines for ecological conservation refer to the areas with special important ecological functions whose protection must be strictly enforced. The delineation of redlines for ecological conservation is a rigid demand for maintaining ecological security, an important measure to improve ecosystem service functions and build a complete ecological security pattern, and an essential guarantee to contain the destruction of the ecological environment [45].

6. Conclusions

Using ArcGIS and other software for data processing, this study established a spatial attribute database for suitability evaluation, and quantitatively analyzed the main changes in ecological land in Changsha-Zhuzhou-Xiangtan (CZX) Green Heart area by constructing a land use conversion matrix of the ecological space. On this basis, a trained cellular automata (CA) model was used to simulate and predict the spatial distribution of land use by 2035 in the ecological “Green Heart” area under different scenarios. The simulation results were compared, analyzing the constraining role of land use suitability evaluation on ecological space evolution. To sum up, the study had the following findings:
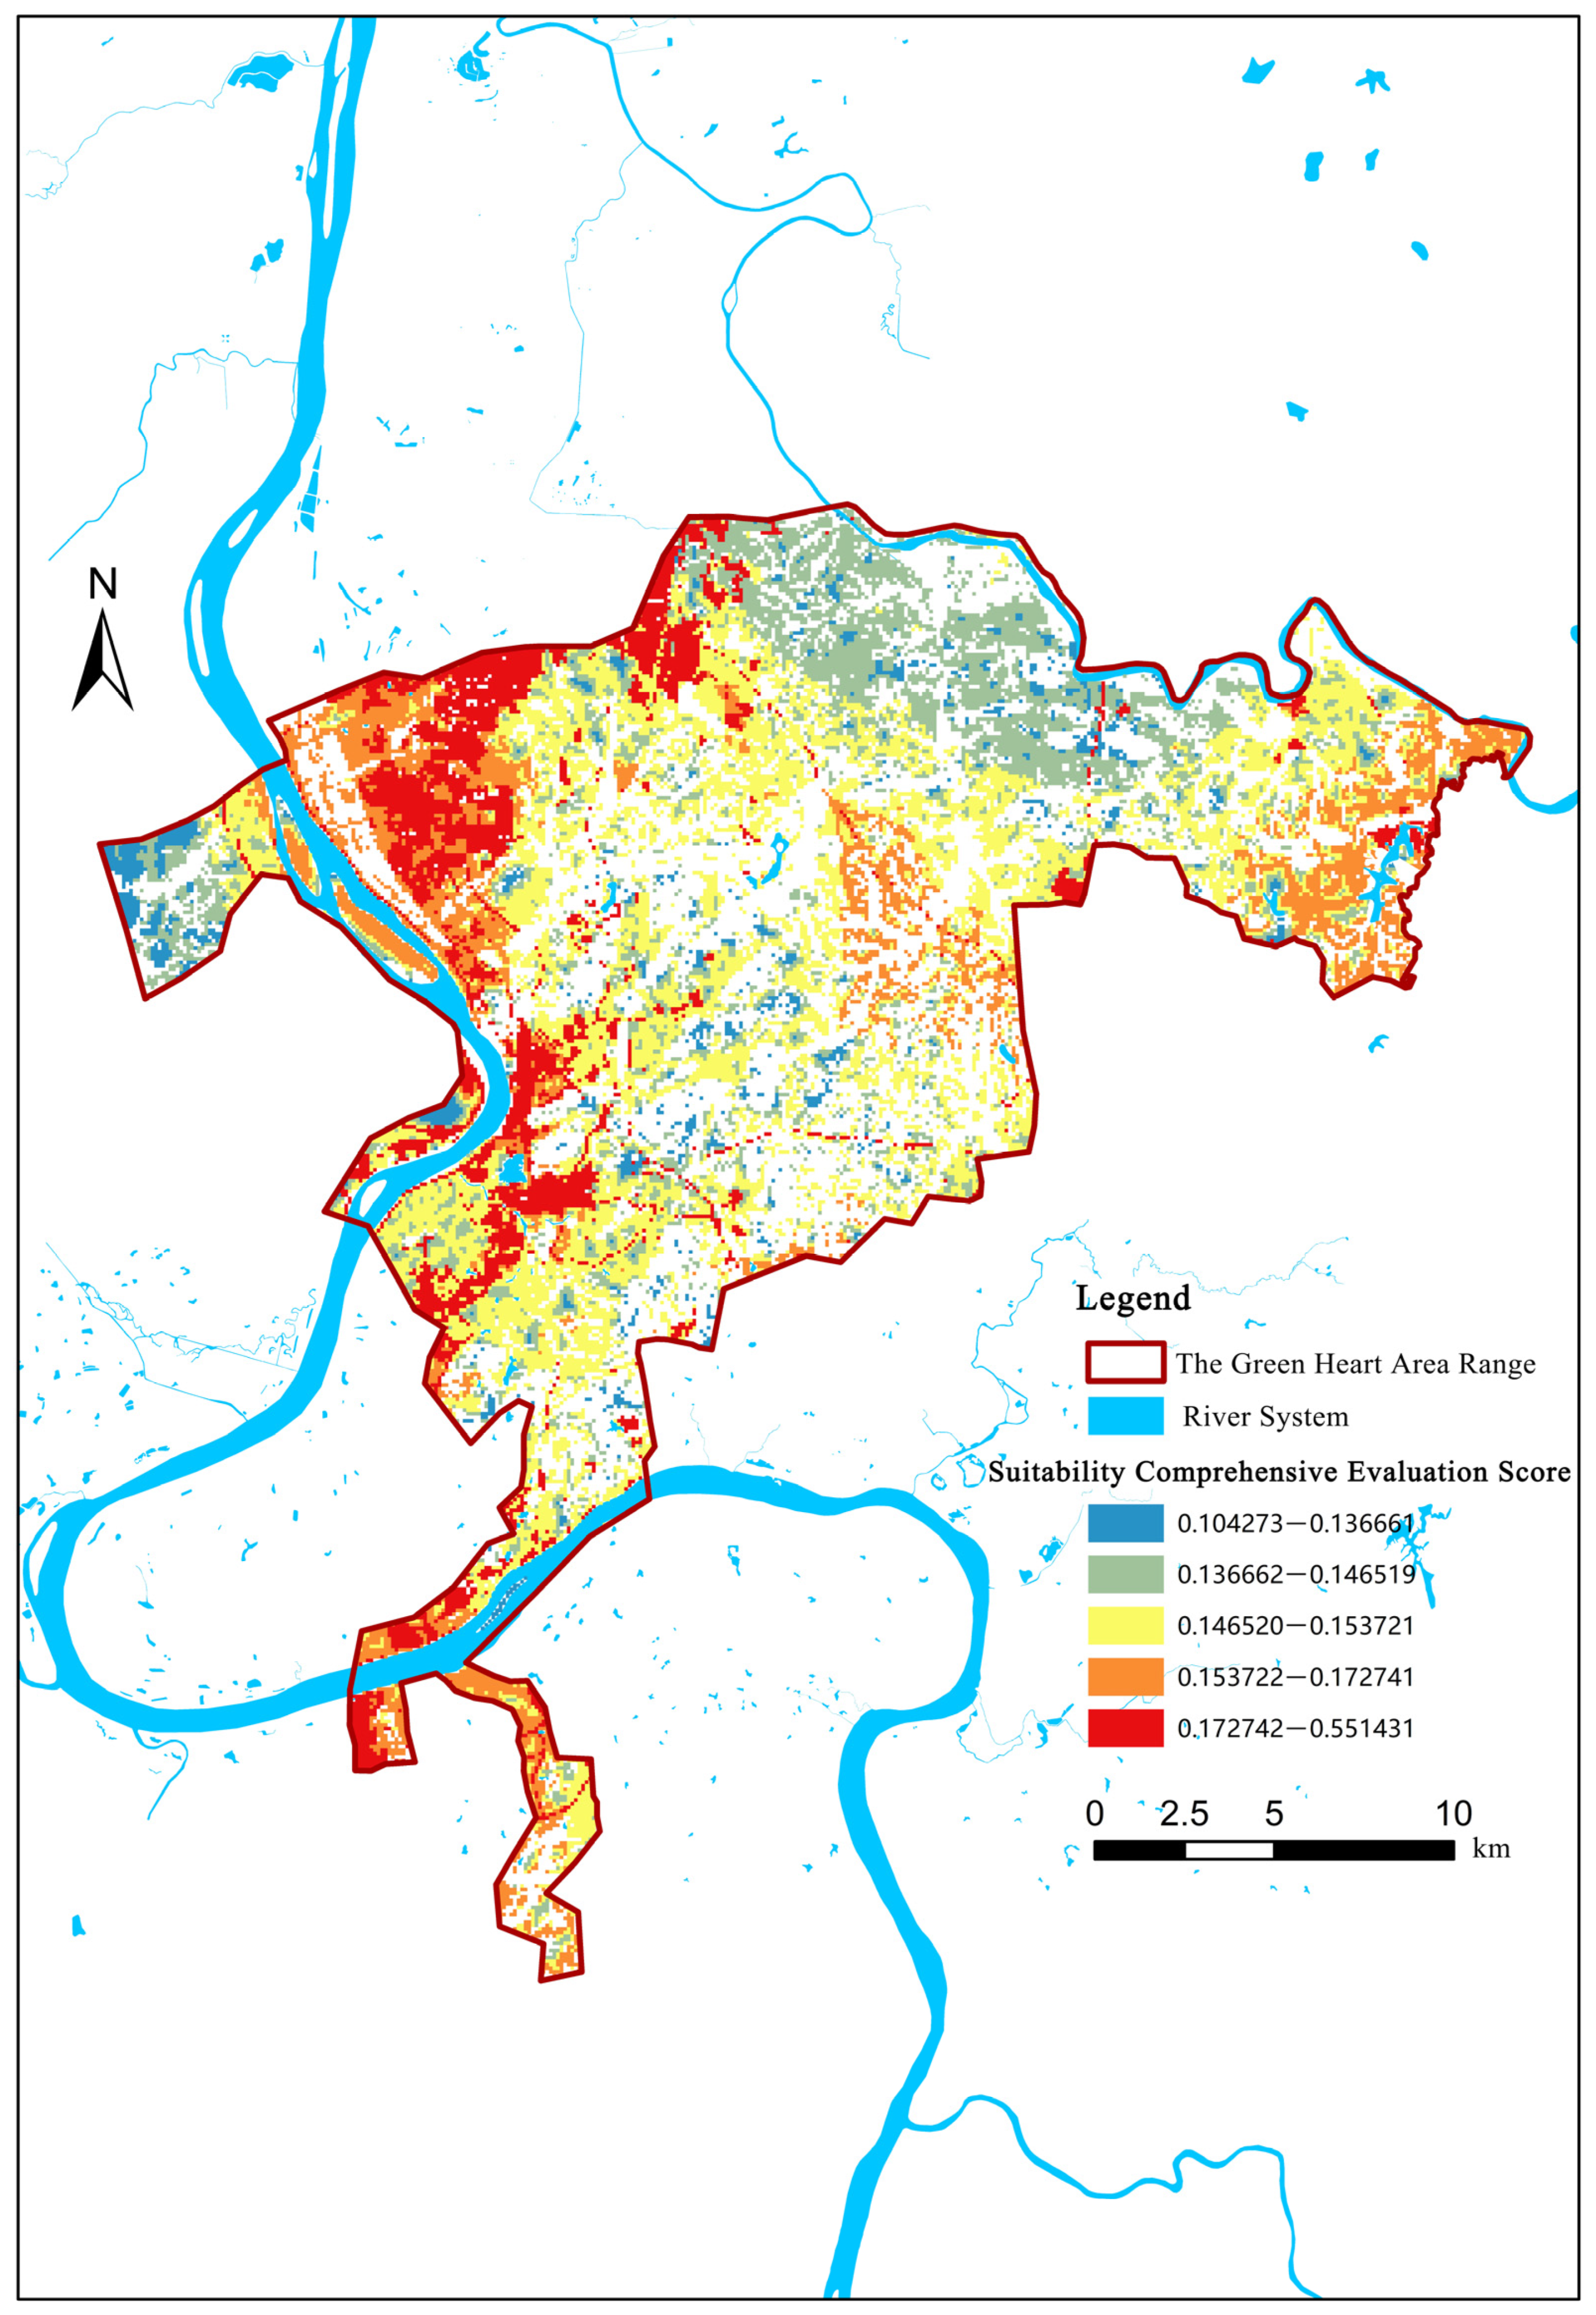
1. For the suitability evaluation, four categories and seven sub-categories of land-use suitability factors were selected, and an index evaluation system was constructed with a combination of the analytic hierarchy process and evaluation. Based on the land-use evaluation, a final comprehensive evaluation result was obtained using weighted indicators, which allowed this study to divide the CZX Green Heart area into five categories: prohibited construction, strictly limited construction, generally restricted construction, basically suitable for construction, and suitable for construction zones. This provides a reliable method for regulating the use of ecological space in urban agglomerations.
2. The land-use conversion matrix quantitatively reflected the main characteristics of land use changes in the CZX urban agglomeration’s ecological space. It was a useful tool for summarizing the main driving factors of ecological land change, thereby further investigating the degree to which the driving factors impacted and damaged the local ecological environment.
3. The comparison of the two results predicted by the trained CA model produced sound results. On the one hand, the CA model combined the data obtained at the local small scale with the neighborhood conversion rules, and it used computers to simulate the dynamic characteristics of the system at a large scale [46]; on the other hand, the CA model effectively simulated and revealed ecological processes through the given special conditions; in addition, its data structure facilitated high integration with systems such as GIS [47].
However, with limited access to data resources and simulation techniques, the present study has shortcomings and requires improvements. This study used different software to separate GIS and CA model, generating potential errors in data conversion between software. Based on GIS with programming function, future research can further develop models to reduce errors in an integrated study. The CA model also has some limitations, including the following: (1) it uses cellular automata for iteration, which consumes much computing time and is impacted by the size of the surrounding neighborhood, especially when the object of study is on a large scale; (2) the temporal and spatial resolution in an ecological spatial pattern analysis has a great influence on the results, so the simulation results are highly dependent on the resolution; (3) the main principle of the CA model is a cell learning the state of the adjacent cells, from which the entire region is deduced, so the focus is more on the interaction between cells in a spatial neighborhood and less on the influence of macroscopic factors on spatial processes [25]. In order to solve the above issues, attempts can be made to improve the cellular automata. On the one hand, its termination conditions can be defined to reduce the number of iterations of the cellular automata and improve its operating efficiency. On the other hand, more accurate multi-level vector data can be used; the construction of a spatial unit system that is hierarchical, nested, and recursive for multi-level urban planning would allow the multi-level spatial control and conduction effects to be applied to the vector cells at different levels to realize the linkage control of land conversion simulation in the whole process and in all aspects [48].
Therefore, besides further in-depth discussions on the socio-economic driving factors affecting ecological space changes, the future study will continue to use updated simulation techniques to analyze the impact of ecological space reconstruction on regional ecological functions, especially the ecological effects of ecological space reconstruction. More typical regions will be selected for comparative simulation experiments, so as to increase the scientific and practical significance of the relevant findings.

Author Contributions

Conceptualization, Y.C. and B.Z.; Data curation, Y.C.; Formal analysis, R.L.; Funding acquisition, R.L.; Investigation, Y.C. and B.Z.; Methodology, Y.C. and B.Z.; Project administration, R.L.; Resources, Y.C.; Software, Y.C. and R.L.; Supervision, B.Z. and R.L.; Validation, Y.C.; Visualization, Y.C.; Writing—original draft, Y.C.; Writing—review & editing, R.L. All authors have read and agreed to the published version of the manuscript.

Funding

This research was funded by National Nature Science Foundation of China, grant number 52008397. The APC was funded by National Nature Science Foundation of China, grant number 52008397.

Institutional Review Board Statement

Not applicable.

Informed Consent Statement

Not applicable.

Data Availability Statement

Not applicable.

Conflicts of Interest

The authors declare no conflict of interest.

References

  1. Cervero, R.; Murakami, J. Rail and Property Development in Hong Kong: Experiences and Extensions. Urban Stud. 2009, 46, 19–43. [Google Scholar] [CrossRef]
  2. Taylor, P.J.; Derudder, B. World City Network: A Global Urban Analysis, 2nd ed.; Routledge: London, UK, 2016. [Google Scholar]
  3. Foley, J.A.; Defries, R.; Asner, G.P.; Barford, C.; Bonan, G.; Carpenter, S.R.; Chapin, F.S.; Coe, M.T.; Daily, G.C.; Gibbs, H.K.; et al. Global consequences of land use. Science 2005, 309, 570–574. [Google Scholar] [CrossRef] [PubMed] [Green Version]
  4. Li, Z.H.; Yu, Y.; Chen, L.; Gan, J.J. Study on ecological space optimization of Chang Zhu Tan urban agglomeration. Cent. South Univ. For. Technol. 2019, 13, 33–39. [Google Scholar]
  5. Wang, F.Y.; Wang, K.Y.; Chen, T.; Li, P. Research progress and Prospect of urban ecological space. Prog. Geogr. 2017, 36, 207–218. [Google Scholar]
  6. Tan, Y.Z.; Zhao, Y.; Cao, Y.; He, J. Research Progress on regional ecological land classification in China. China Land Sci. 2016, 30, 28–36. [Google Scholar]
  7. Ngom, R.; Gosselin, P.; Blais, C. Reduction of disparities in access to green spaces: Their geographic insertion and recreational functions matter. Appl. Geogr. 2016, 66, 35–51. [Google Scholar] [CrossRef]
  8. Neuenschwander, N.; Hayek, U.W.; Grêt-Regamey, A. Integrating an urban green space typology into procedural 3D visualization for collaborative planning. Comput. Environ. Urban Syst. 2014, 48, 99–110. [Google Scholar] [CrossRef]
  9. Nutsford, D.; Pearson, A.L.; Kingham, S.; Reitsma, F. Residential exposure to visible blue space (but not green space) associated with lower psychological distress in a capital city. Health Place 2016, 39, 70–78. [Google Scholar] [CrossRef]
  10. Yu, F.; Li, X.B.; Zhang, L.J.; Xu, W.H.; Fu, R.; Wang, H. Study of ecological land in China: Conception, classification, and spatial-temporal pattern. Acta Ecol. Sin. 2015, 35, 4931–4943. [Google Scholar]
  11. Long, H.L.; Liu, Y.Q.; Li, T.T.; Wang, J.; Liu, A.X. A primary study on ecological land use classification. Ecol. Environ. Sci. 2015, 24, 1–7. [Google Scholar]
  12. Erickson, D.L. The Relationship of Historic City Form and Contemporary Greenway Implementation: A Comparison of Milwaukee, Wisconsin (USA) and Ottawa, Ontario (Canada). Landsc. Urban Plan. 2004, 68, 199–221. [Google Scholar] [CrossRef]
  13. Charles, E.L. Greenways for America; The Johns Hopkins University Press: Baltimore, MD, USA, 1995; pp. 1–10. [Google Scholar]
  14. Amati, M.; Yokohari, M. Temporal changes and local variations in the functions of London’s green belt. J. Landsc. Urban Plan. 2004, 75, 125–142. [Google Scholar] [CrossRef]
  15. Kühn, M. Greenbelt and Green Heart: Separating and Integrating Landscapes in European City Regions. Landsc. Urban Plan. 2003, 64, 19–27. [Google Scholar] [CrossRef]
  16. Wu, Z.L. The international experience and enlightenment of urban eco-function zone planning: In reference to the Greater London and the Randstad. Int. Urban Plan. 2015, 30, 95–100. [Google Scholar]
  17. Chen, S.; Liu, Y.X.; Peng, L.H. Dynamics of urban ecological space evolution and policy responses: A case study of Nanjing City. Acta Ecol. Sin. 2008, 28, 2270–2278. [Google Scholar]
  18. Guan, X.K.; Zhang, F.R.; Wang, X.L.; Zhao, F.H.; Jiang, G.H. Study on spatial evolution and layout optimization of ecological land in Beijing. Areal Res. Dev. 2013, 32, 119–124. [Google Scholar]
  19. Yu, B.B. Ecological effects of new-type urbanization in China. Renew. Sustain. Energy Rev. 2021, 135, 110239. [Google Scholar] [CrossRef]
  20. Mcharg, I.L. Design with Nature, Garden City; Doubleday: New York, NY, USA, 1969. [Google Scholar]
  21. Lathrop, R.G., Jr.; Bognar, J.A. Applying GIS and landscape ecological principles to evaluate land conservation alternatives. Landsc. Urban Plan. 1998, 41, 27–41. [Google Scholar] [CrossRef]
  22. An, G.Q.; Qin, X.M.; Xu, X.X.; Chen, L.F.; Xu, W.H.; Xu, Y.Y. Ecological land use change and evaluation of driving factors in Shandong province. Chin. J. Agric. Resour. Reg. Plan. 2020, 41, 45–54. [Google Scholar]
  23. Tao, Y.H.; Wang, H.J.; Zhang, B.; Zeng, H.R.; Sun, J. Cellular automata modeling and urban expansion simulation based on agent and artificial neural network. Geogr. Geo-Inf. Sci. 2022, 38, 79–85. [Google Scholar]
  24. Xing, R.S. Simulation of Ecological Spatial Layout Change and Habitat Quality Assessment Based on ANN CA Markov Model—A Case Study of Wanzhou District; Chongqing Technology and Business University: Chongqing, China, 2020. [Google Scholar]
  25. Chen, Y.L. Study on Ecological Spatial Change and Reconstruction of Chang Zhu Tan Urban Agglomeration; Hunan Normal University: Changsha, China, 2018. [Google Scholar]
  26. Wang, S.H.; Huang, L.; Xu, X.L.; Li, J.H. Temporal and spatial differentiation of ecological space and ecological carrying state of mega urban agglomeration. Acta Geogr. Sin. 2022, 77, 164–181. [Google Scholar]
  27. Ma, Z.X.; Du, J.M.; Sun, Y.L.; Wang, Z.L. Study on ecological land use evaluation in Tianjin Binhai New Area. Areal Res. Dev. 2016, 35, 109–112. [Google Scholar]
  28. Chen, L.X.; Hong, W.Y.; Ao, Z.H. Discussion on comprehensive and fine management of ecological space in Shenzhen. Planners 2018, 34, 46–51. [Google Scholar]
  29. Zhang, X.C.; Long, D.; Bian, F. The protection of “Green Heart” in Randstad: The construction of regional coordination and the innovation of spatial planning. Int. Urban Plan. 2015, 30, 57–65. [Google Scholar]
  30. Zhu, Y.Y. Study on Ecological Compensation in the Green Heart Area of Chang Zhu Tan Urban Agglomeration—Taking Ecological Public Welfare Forest as an Example; Hunan Normal University: Changsha, China, 2015. [Google Scholar]
  31. Wang, H.M. Study on the Evolution of Ecological Land Use Pattern in the Core Area of Chang Zhu Tan; Hunan University of Technology: Zhuzhou, China, 2016. [Google Scholar]
  32. Food and Agriculture Organization of the United Nations. FESLM: An International Framework for Evaluating Sustainable Land Management. 1993. Available online: https://www.doc88.com/p-6961965229433.html?r=1 (accessed on 17 February 2022).
  33. Chen, Y.P.; Zheng, B.H.; Wang, H. Study on the evolution and reconstruction of green core ecological space of Urban Agglomeration Based on the suitability of land and space development. Resour. Environ. Yangtze Basin 2022, 31, 551–562. [Google Scholar]
  34. Huang, X.Y.; Zhao, X.M.; Guo, X.; Jiang, Y.F.; Lai, X.H. The natural ecological spatial management zoning based on ecosystem service function and ecological sensitivity. Acta Ecol. Sin. 2020, 40, 1065–1076. [Google Scholar]
  35. Von Neumann, J. The general and logical theory of automata. In Systems Research for Behavioral Sciencesystems Research; Routledge: New York, NY, USA, 2017; pp. 97–107. [Google Scholar]
  36. Li, X.; Anthony, G.O.Y. Modelling sustainable urban development by the integration of constrained cellular automata and GIS. Int. J. Geogr. Inf. Sci. 2000, 14, 131–152. [Google Scholar] [CrossRef]
  37. Master Planning for Ecological Green Heart Area of Changsha Zhuzhou Xiangtan Urban Agglomeration. 2021. Available online: https://www.hunan.gov.cn/ (accessed on 21 February 2022).
  38. Master Planning for Changsha City. 2021. Available online: http://zygh.changsha.gov.cn/ (accessed on 21 February 2022).
  39. Master Planning for Zhuzhou City. 2021. Available online: http://gtzyj.zhuzhou.gov.cn/ (accessed on 21 February 2022).
  40. Master Planning for Xiangtan City. 2021. Available online: http://zygh.xiangtan.gov.cn/ (accessed on 21 February 2022).
  41. Gu, C.L.; Ma, T.; Yuan, X.H.; Zhang, X.M.; Wang, X. Ecological protection and development of green land in the Chang Zhu Tan urban agglomeration. Resour. Environ. Yangtze Basin 2010, 19, 1124–1131. [Google Scholar]
  42. Hootsmans, M.; Kampf, H.; Bos, P. Ecological Networks: Experiences in the Netherlands: “A Joint Responsibility for Connectivity”; Ministry of Agriculture, Nature and Food Quality: The Hague, The Netherlands, 2004.
  43. Liu, M.X. Research on the Planning of Mega Urban Green Space; South China University of Technology: Guangzhou, China, 2018. [Google Scholar]
  44. Deng, H.T. A Study on Green Heart Urban Open Space in the Randstad Region, The Netherlands; Southeast University: Nanjing, China, 2019. [Google Scholar]
  45. Hu, M.S.; Ye, C.S.; Lu, L. Study on ecological space and ecological protection red line delimitation in Nanchang City. Ecol. Environ. Sci. 2021, 30, 631–643. [Google Scholar]
  46. Wu, J.G. Landscape Ecology: Pattern, Process, Scale and Hierarchy; Higher Education Press: Beijing, China, 2000. [Google Scholar]
  47. Zhang, X.F.; Cui, H.W. Spatio-temporal analysis and modeling based on the integration of GIS and CA model. Image Graph. 2000, 5A, 1012–1018. [Google Scholar]
  48. Sun, Y.Z.; Yang, J.; Song, S.Y.; Zhu, J.; Dai, J.J. Multi-level vector cellular automata modeling and land use change simulation. Acta Geogr. Sin. 2020, 75, 2164–2178. [Google Scholar]
Figure 1. Map of the Green Heart Area.
Sustainability 14 07455 g001
Figure 2. Research Process.
Sustainability 14 07455 g002
Figure 3. Technology Road Map of Cellular Automata Model Simulation.
Sustainability 14 07455 g003
Figure 4. Flow Chart of the Cellular Automata Model Simulation Process.
Sustainability 14 07455 g004
Figure 5. Comparison of Model under Different Parameters.
Sustainability 14 07455 g005
Figure 6. Analysis of factors for evaluating land suitability in the CZX Green Heart area.
Sustainability 14 07455 g006
Figure 7. Ecological space suitability results for the CZX Green Heart area.
Sustainability 14 07455 g007
Figure 8. Change in ecological space of the CZX Green Heart area 1980–2017.
Sustainability 14 07455 g008
Figure 9. Map of the conversion of ecological space in the CZX Green Heart area 1980–2017.
Sustainability 14 07455 g009
Figure 10. Comparison of Conflicts between Master Planning of Changsha, Zhuzhou, and Xiangtan and Planned Range of Green Heart [37,38,39,40].
Sustainability 14 07455 g010
Figure 11. Map of ecological space reconstruction in the CZX Green Heart area [33].
Sustainability 14 07455 g011
Figure 12. Comparison of ecological space simulation results for the Green Heart area in 2035. (a) Scenario 1 simulation prediction. (b) Scenario 2 simulation prediction.
Sustainability 14 07455 g012
Table 1. Land use categories (http://www.dsac.cn/DataProduct/Detail/200804, accessed on 12 February 2022).
First-Order
Categories
Second-Order
Categories
No.NameNo.Name
1Arable land11Paddy field
12Dryland
2Forestland21Woodland
22Shrubland
23Sparse woodland
24Other woodland
3Grassland31High-coverage grassland
32Moderate-coverage grassland
33Low-coverage grassland
4Waterbody41Canal
42Lake
43Reservoir
44Permanent glacier
45Tidal flat
46Flood land
5Urban and rural, industrial and mining, residential land51Urban land
52Rural settlement
53Other construction land
6Unused land61Sandy land
62Desert
63Saline-alkaline land
64Marshland
65Bare land
66Exposed rock
67Other
Table 2. Statistical table of land adaptability evaluation factors in the Green Heart area.
First-Order FactorWeightSecond-Order FactorWeightClassification StandardsNormalized Value Range
Terrain factors0.3068Slope indicator0.16550–2°10
2–7°7
7–15°4
15–25°1
>25°0
Elevation indicator0.091135–55 m10
55–75 m7
75–100 m4
100–150 m1
>150 m and <35 m0
Water system indicator0.0501<50 m0
50–100 m7
100–500 m10
500–1000 m4
>1000 m1
Transportation factors0.1752External transportation indicator0.0584<100 m0
100–200 m1
200–500 m4
500–1000 m10
>1000 m7
Internal transportation indicator0.1168<200 m10
200–500 m7
500–1000 m4
1000–2000 m1
>2000 m0
Urban-rural construction factor0.1346Current construction area impact indicator0.1346<100 m10
100–200 m7
200–500 m4
500–1000 m1
>1000 m0
Land use obstruction factors0.3835Ecological conservation index0.2876low-sensitivity area10
ordinary-sensitivity area7
moderate-sensitivity area4
high-sensitivity area1
extremely high-sensitivity area0
Natural and human resources impact indicator0.0959<100 m0
100–300 m4
300–500 m7
500–1000 m10
>1000 m1
Table 3. Land area of the various score ranges from the evaluation of land suitability for the CZX Green Heart area.
Score RangeArea (km2)Percentage
0.1043–0.136791.0817.42%
0.1367–0.1465188.1035.98%
0.1465–0.1537169.6232.44%
0.1537–0.172748.049.19%
0.1727–0.551426.024.98%
Total522.87100.00%
Table 4. Land conversion matrix in the CZX Green Heart area 1980–2017 (unit: km2).
1980Grass-LandUrban and Rural Construction LandArable LandForest-LandWater-BodyUnused Land2017 Total
2017
Grassland4.50 0.04 4.54
Urban and rural construction land0.5080022.0826.221.00 57.81
Arable land 0.01160.931.950.79 163.70
Forestland0.54 3.14262.910.060.75267.39
Waterbody 2.290.8124.09 27.20
Unused land 1.251.00 2.25
1980 total5.548.01189.44293.1825.950.75522.87
Table 5. Land conversion in the CZX Green Heart area 1980–2017 (unit: km2).
Initial CategoriesConversion
Categories
Grass-LandUrban and Rural Construction LandArable LandForestlandWater BodyUnused Land
Grassland 0.5000.5400
Urban and rural construction land0 0.010.2500
Arable land022.08 2.892.291.25
Forestland0.0426.221.95 0.811.00
Waterbody01.000.790.06 0
Unused land0000.750
Table 6. Total area, change, and dynamic measurement of ecological space in the CZX Green Heart area 1980–2017.
YearTotal Area (km2)Change in Area (km2)Dynamic Measurement (%)
1980514.11
1990511.12−2.99−0.0581
2000507.14−3.98−0.0779
2010489.63−17.50−0.3451
2017464.30−25.33−0.5174
Table 7. Confusion matrix for evaluating simulation accuracy.
2018 Simulation2019 Simulation
Not ConvertedConvertedPrecisionNot ConvertedConvertedPrecision
ActualNot converted137512891.5%127516188.8%
land useConverted9849183.3%9855885.0%
Total accuracy 89.1% 87.6%
Kappa 0.59 0.56
Table 8. Reconstruction and Zoning of Land in the CZX Green Heart Area.
Score RangeZoning Classification
0.1043–0.1367Prohibited construction
0.1367–0.1465Strictly limited construction
0.1465–0.1537Generally restricted construction
0.1537–0.1727Basically suitable for construction
0.1727–0.5514Suitable for construction
Table 9. Land-use conversion probability matrix for the CZX Green Heart area 2017–2035.
Land Use Type2017
GrasslandUrban and Rural Construction LandArable LandForestlandWaterUnused Land
1980Grassland0.813
Urban and rural construction land0.090.9980.1170.0890.039
Arable land 0.0020.8490.0080.031
Forestland0.097 0.0170.8970.0021
Water 0.0120.0030.929
Unused land 0.0050.003
Table 10. Comparison of predicted ecological space in the CZX Green Heart area (2017 and 2035).
YearForestlandGrasslandWaterbodyArable Land
2017267.394.5427.20163.70
2035 Scenario 1231.064.4324.20156.92
2035 Scenario 2264.324.4324.64162.33
Table 11. Land-use conversion matrix for the CZX Green Heart area 2017–2035 (unit: km2).
Land Use Type2035
GrasslandUrban and Rural Construction LandArable LandForestlandWater
2017Grassland3.69
Arable land 0.33138.981.315.07
Forestland25.94 4.55239.850.53
Water 0.330.0825.27
Table 12. Dynamic measurements of ecological space change in the CZX Green Heart area under the two scenarios (2017–2035).
Land USE typeScenario 1 Dynamic MeasurementScenario 2
Grassland−0.0013−0.0013
Arable land−0.0023−0.0005
Forestland−0.0075−0.0006
Waterbody−0.0061−0.0052
Publisher’s Note: MDPI stays neutral with regard to jurisdictional claims in published maps and institutional affiliations.

