
Input–Output Efficiency of Chinese Power Generation Enterprises and Its Improvement Direction-Based on Three-Stage DEA Model


Abstract
:1. Introduction
2. Research Methods and Data Description
2.1. Research Methods
2.2. Variable Selection
- (1)
- Input variables selection
- (2)
- Output variables selection
- (3)
- Environmental variables Selection
3. Empirical Results and Analysis
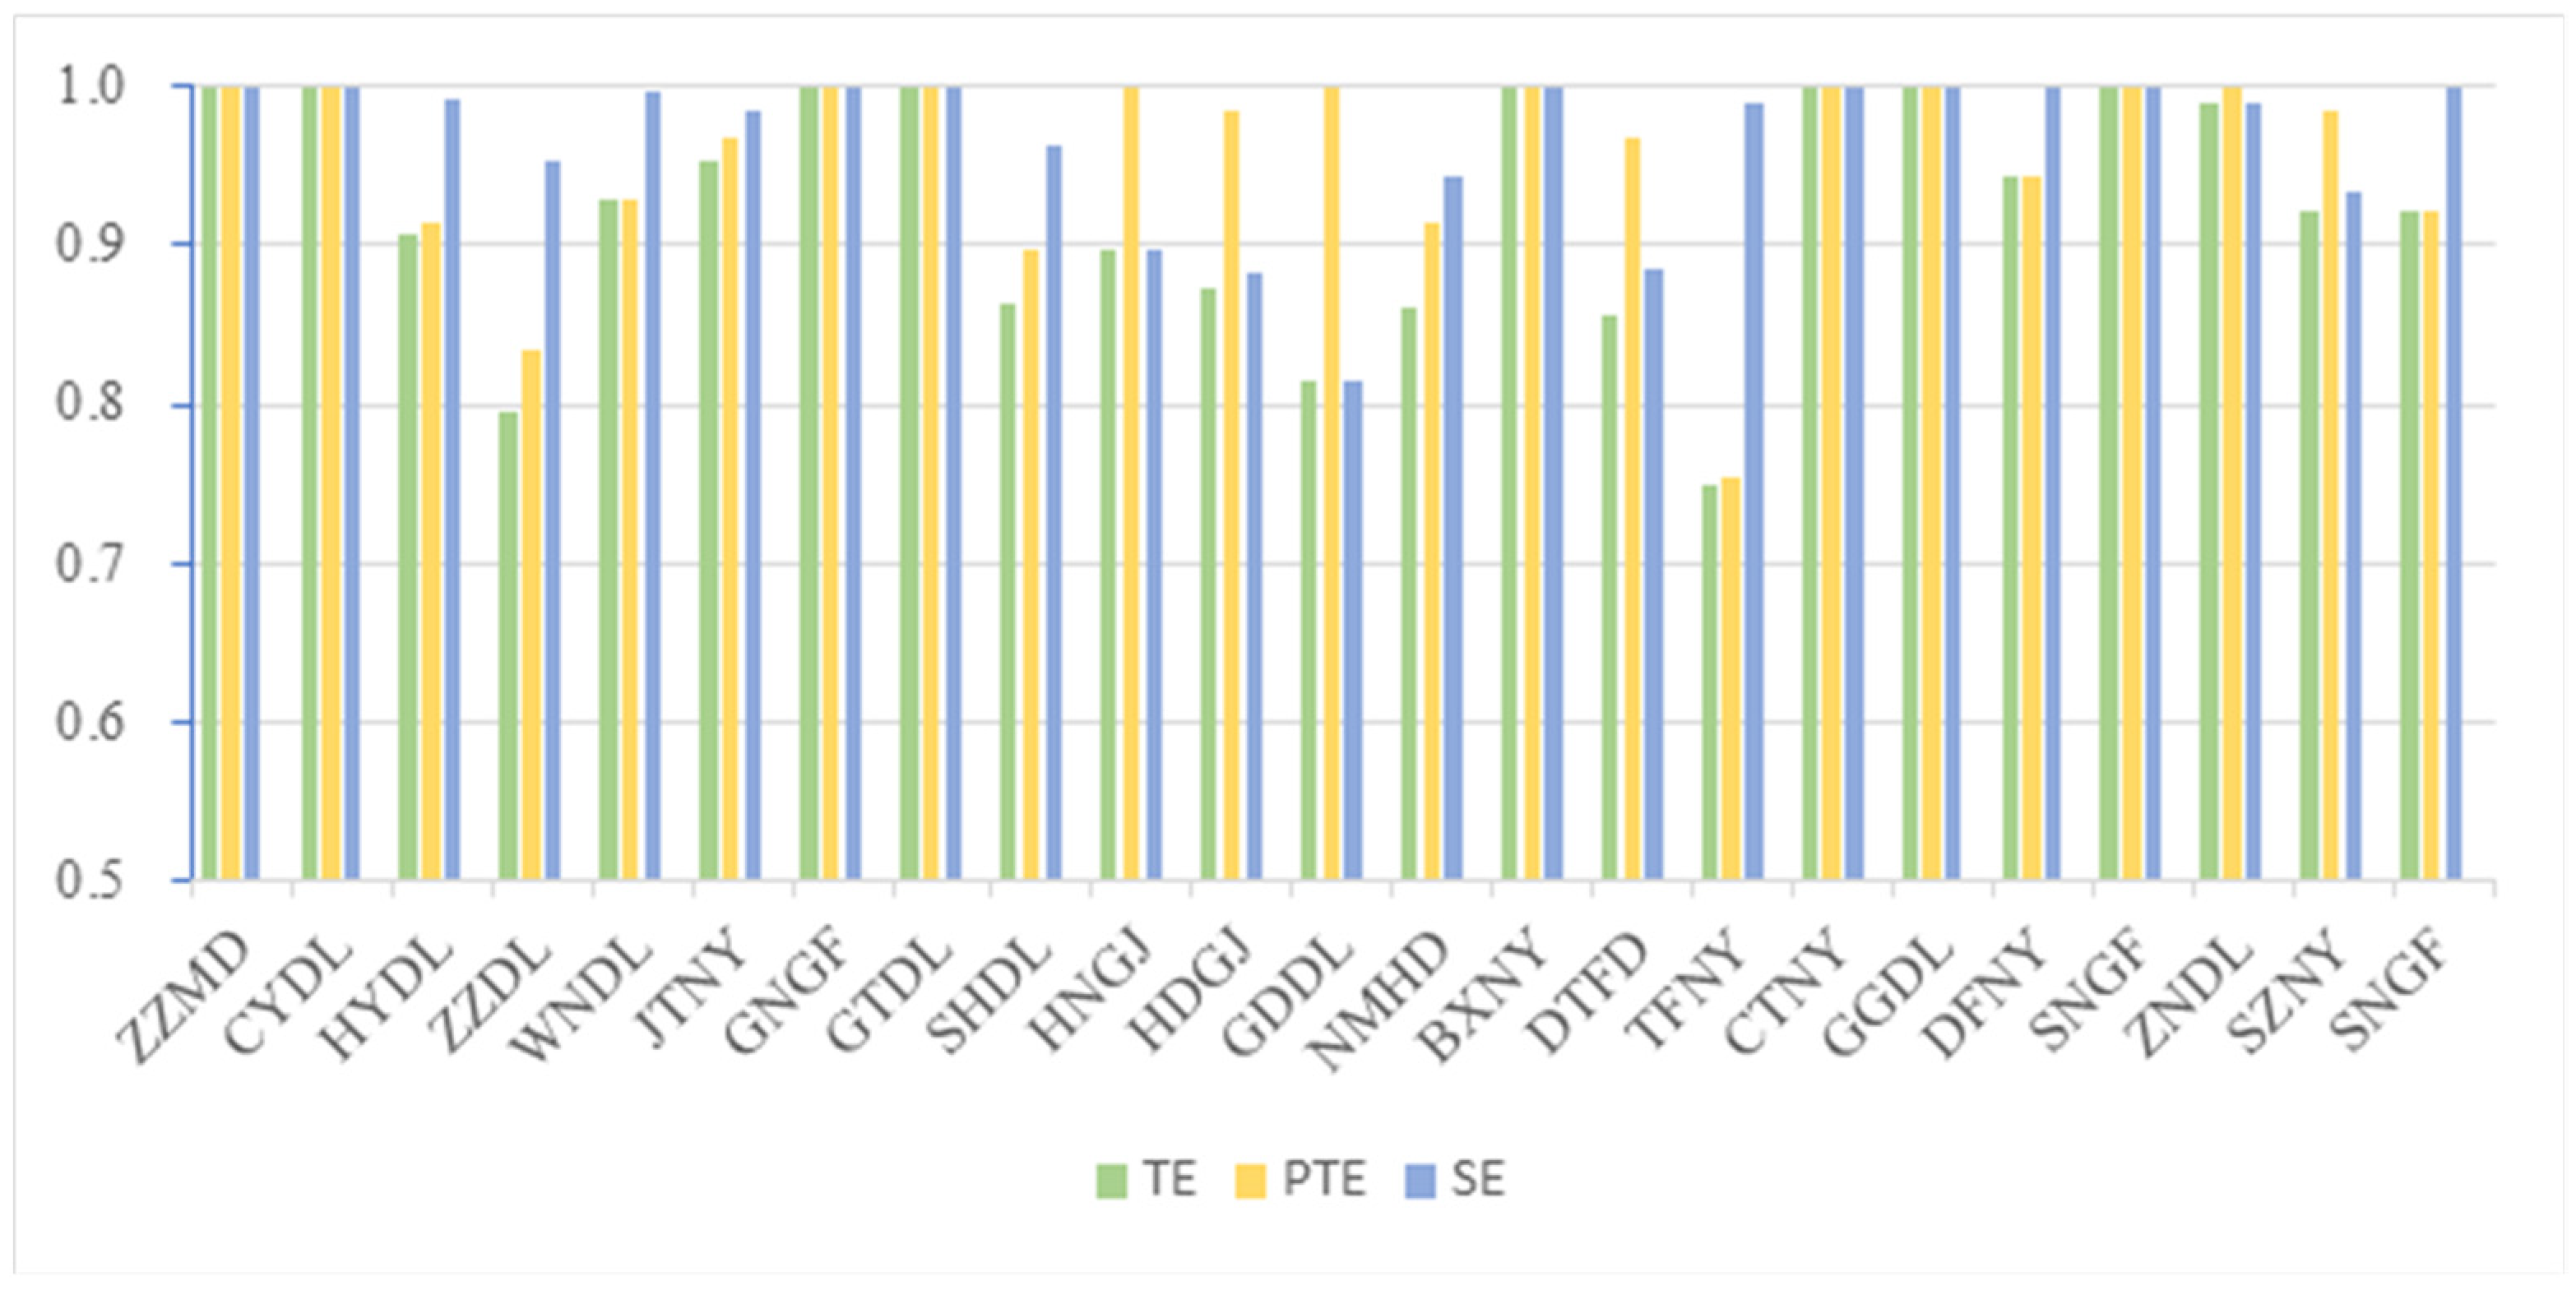
3.1. The First Stage: DEA Result Analysis
3.2. The Second Stage: SFA Regression Analysis
- (1)
- IPO time
- (2)
- Government subsidies:
- (3)
- Regional per capita GDP
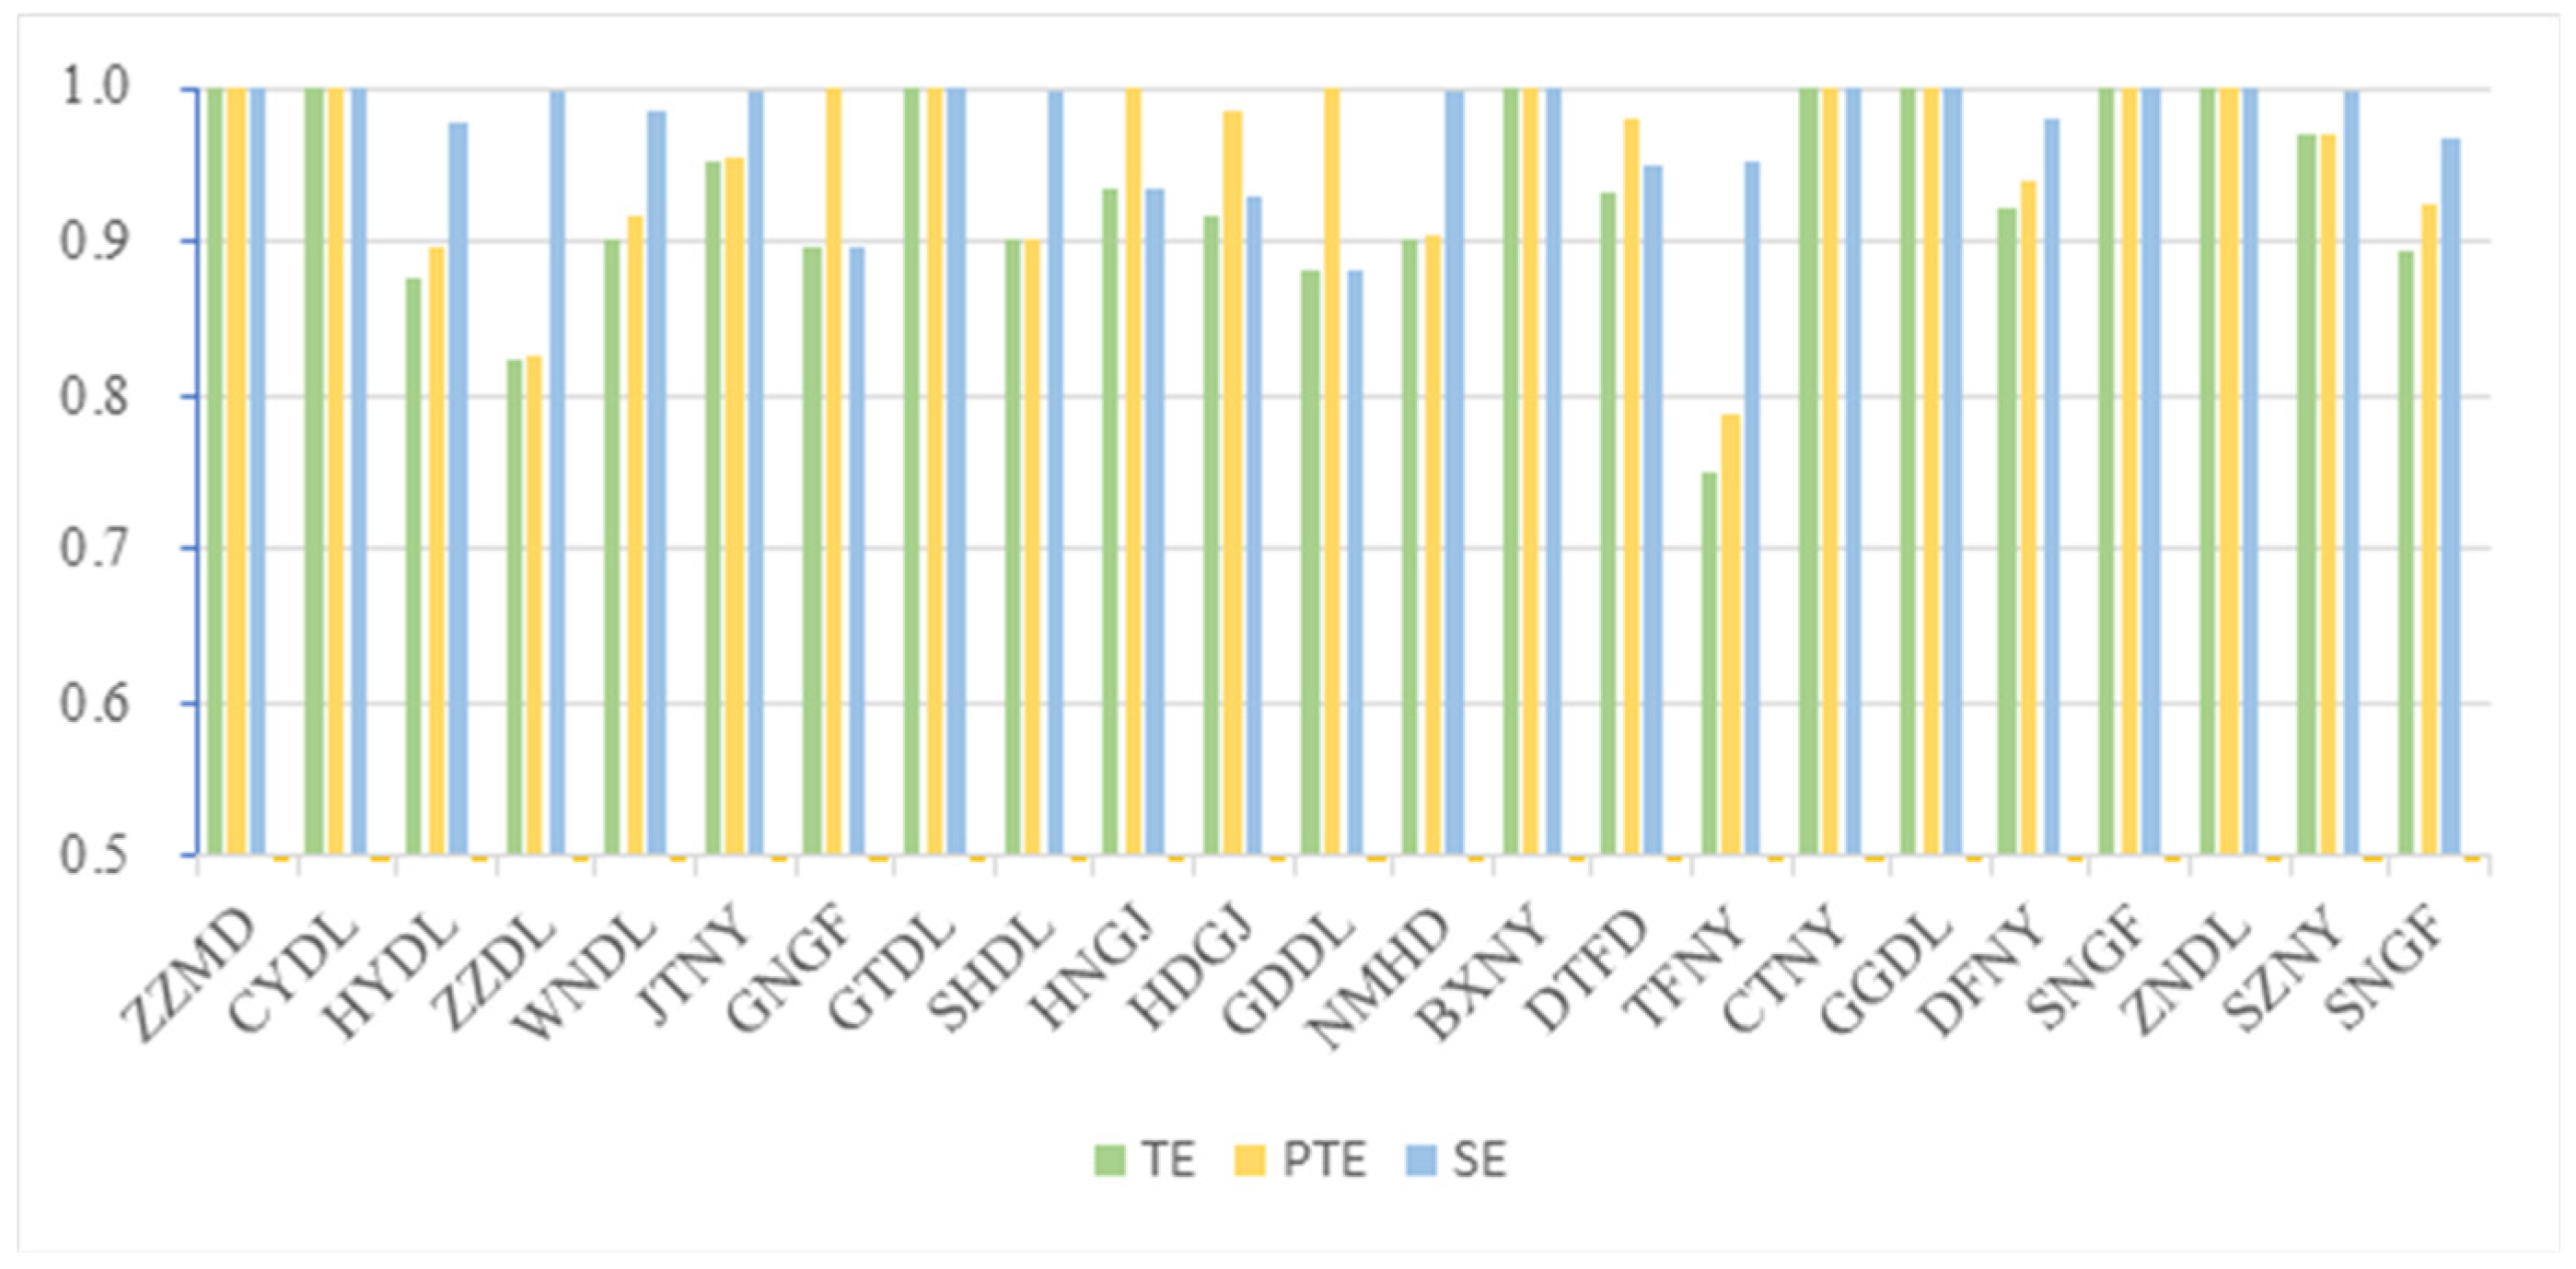
3.3. The Third Stage: DEA Result Analysis
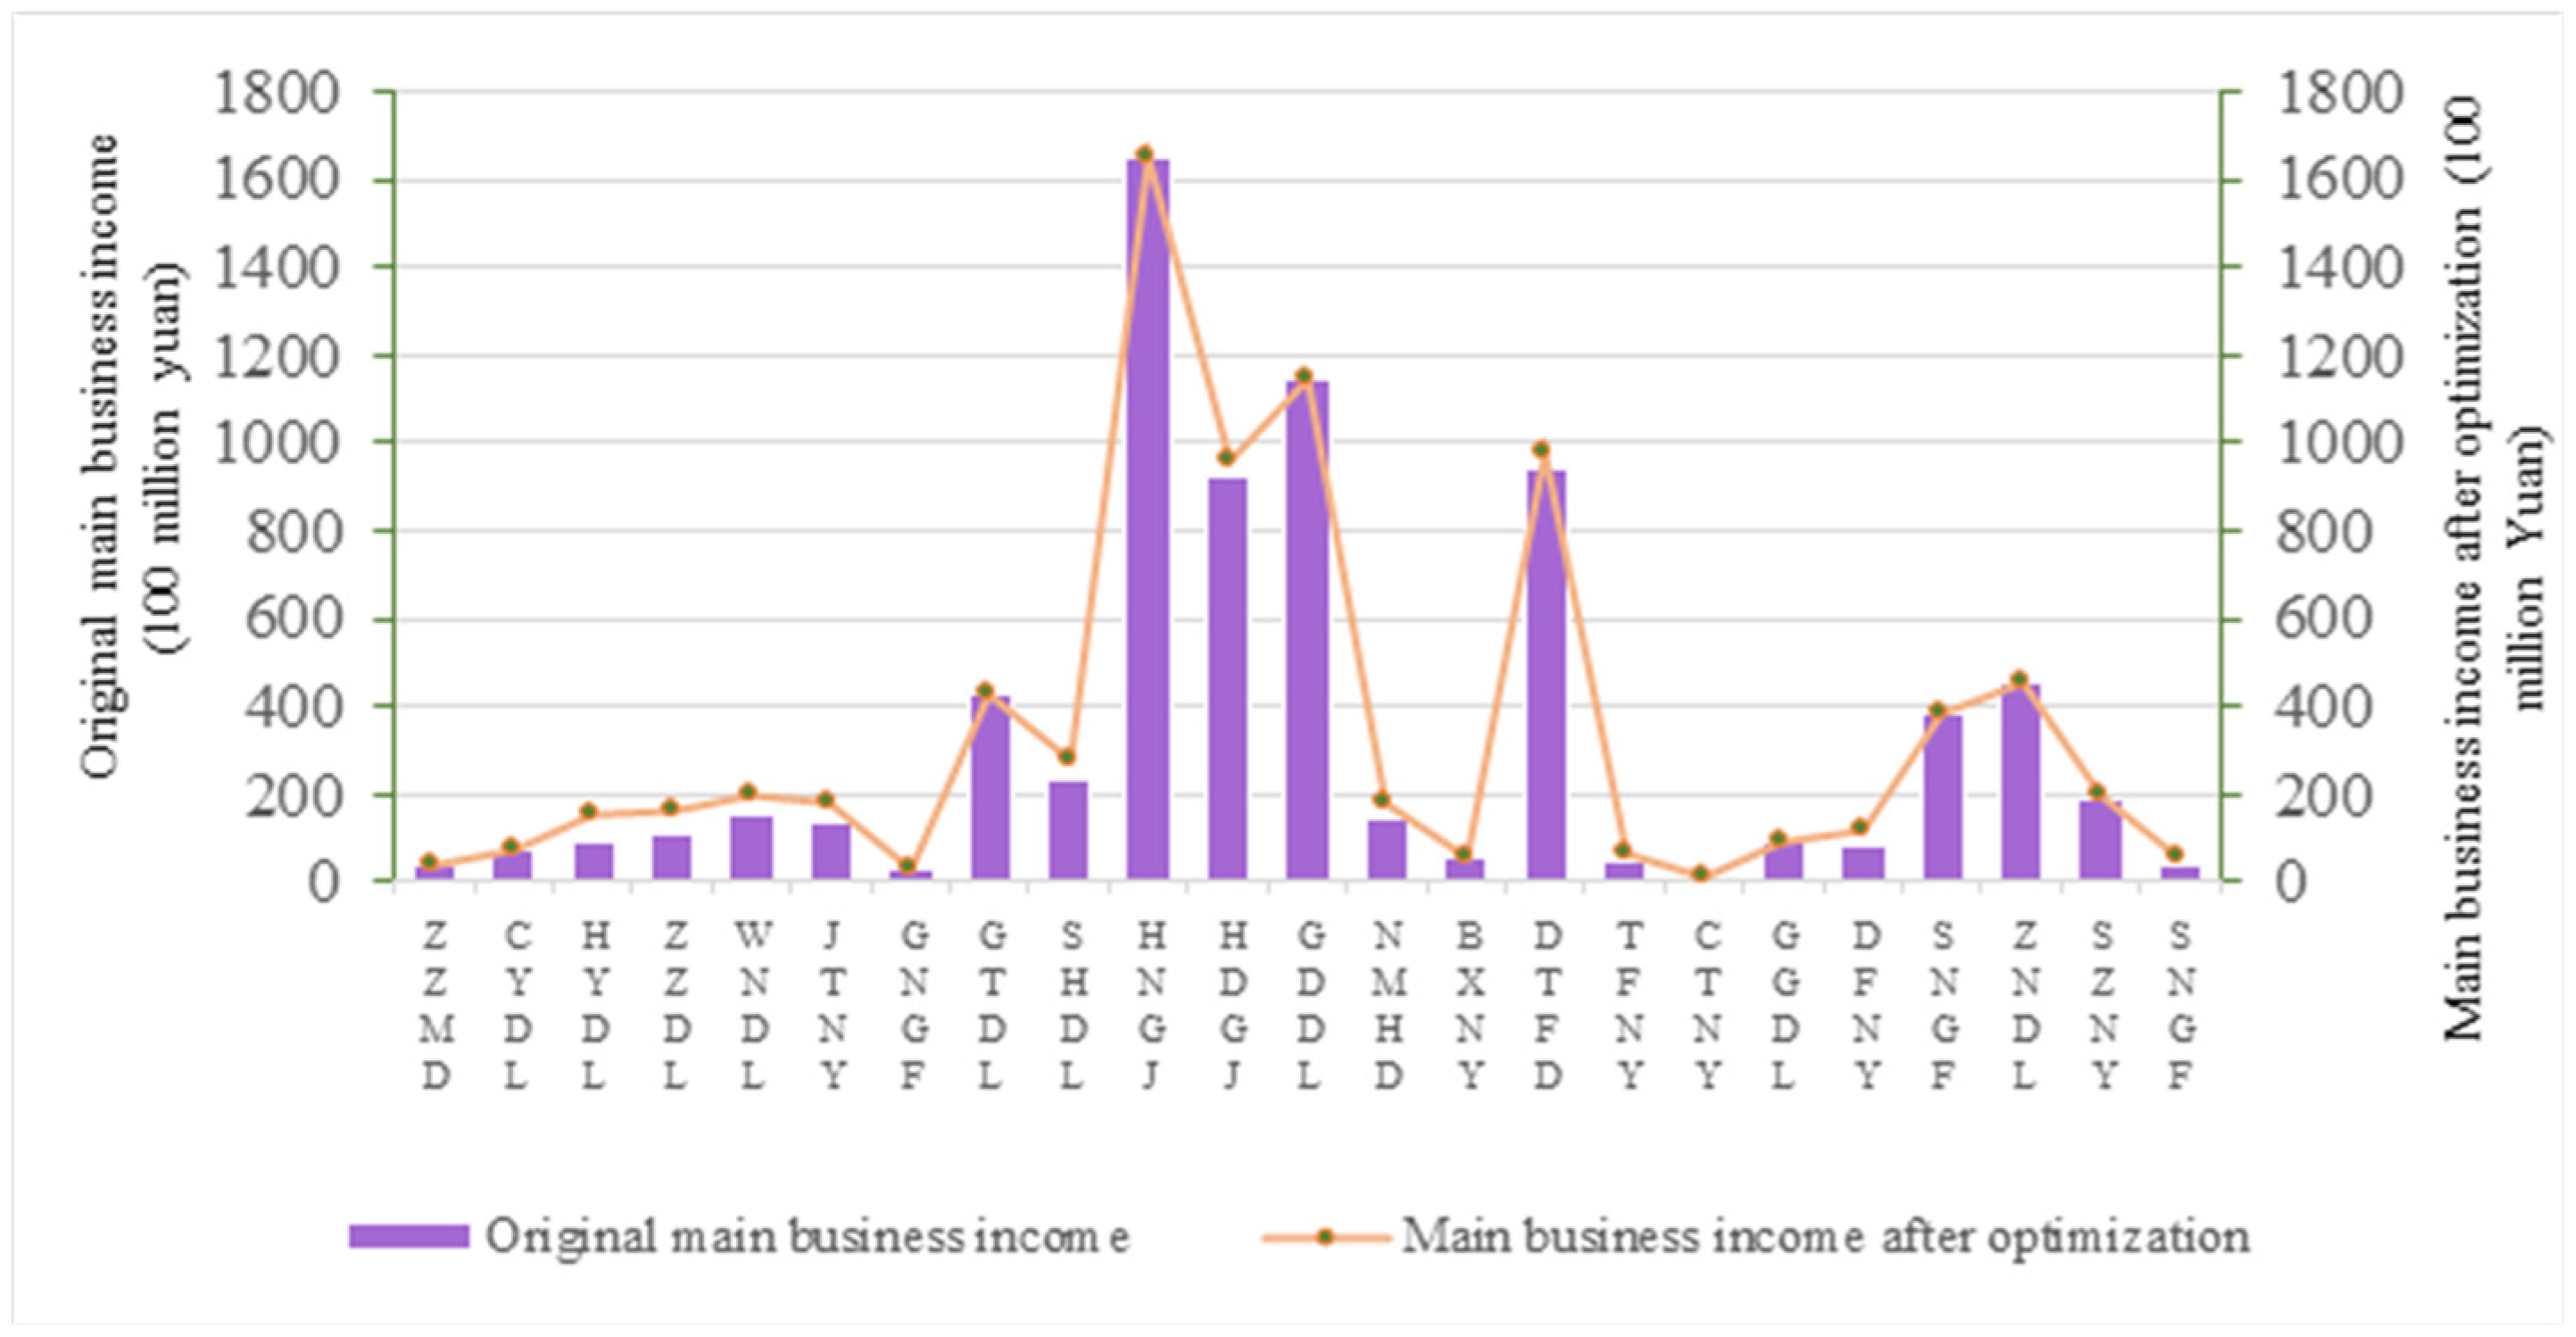
4. China Power Generation Company Main Business Income Optimization
5. Recommendations and Policy Implications
5.1. Recommendations
5.2. Policy Implications
Author Contributions
Funding
Institutional Review Board Statement
Informed Consent Statement
Data Availability Statement
Conflicts of Interest
References
- Wu, L.; Wang, L. Research on energy consumption and energy efficiency fluctuation and its Influencing factors in China. Urban Environ. Stud. 2019, 3, 55–71. [Google Scholar]
- Kleit, A.N.; Terrell, D. Measuring potential efficiency gains from deregulation of electricity generation: A Bayesian approach. Rev. Econ. Stat. 2001, 83, 523–530. [Google Scholar] [CrossRef]
- Hattori, T.; Tsutsui, M. Economic impact of regulatory reforms in the electricity supply industry: A panel data analysis for OECD countries. Energy Policy 2004, 32, 823–832. [Google Scholar] [CrossRef]
- Pombo, C.; Taborda, R. Performance and efficiency in Colombia’s power distribution system: Effects of the 1994 reform. Energy Econ. 2006, 28, 339–369. [Google Scholar] [CrossRef]
- Korhonen, P.J.; Luptacik, M. Eco-efficiency analysis of power plants: An extension of data envelopment analysis. Eur. J. Oper. Res. 2004, 154, 437–446. [Google Scholar] [CrossRef]
- Hattori, T. Relative performance of US and Japanese electricity distribution: An application of stochastic frontier analysis. J. Product. Anal. 2002, 18, 269–284. [Google Scholar] [CrossRef]
- Cote, D.O. Firm efficiency and ownership structure: The case of US electric utilities using panel data. Ann. Public Coop. Econ. 1989, 60, 431–450. [Google Scholar] [CrossRef]
- Goto, M.; Tsutsui, M. Comparison of productive and cost efficiencies among Japanese and US electric utilities. Omega 1998, 26, 177–194. [Google Scholar] [CrossRef]
- Abbott, M. The productivity and efficiency of the Australian electricity supply industry. Energy Econ. 2006, 28, 444–454. [Google Scholar] [CrossRef]
- Du, M.; Liu, Y.; Wang, B.; Lee, M.; Zhang, N. The sources of regulated productivity in Chinese power plants: An estimation of the restricted cost function combined with DEA approach. Energy Econ. 2021, 100, 105318. [Google Scholar] [CrossRef]
- Khodadadipour, M.; Hadi-Vencheh, A.; Behzadi, M.; Rostamy-Malkhalifeh, M. Undesirable factors in stochastic DEA cross-efficiency evaluation: An application to thermal power plant energy efficiency. Econ. Anal. Policy 2021, 69, 613–628. [Google Scholar] [CrossRef]
- Ma, C. DEA Model Construction and Investment Efficiency Analysis of Overseas Electric Power Market in Clean Energy. E3S Web Conf. 2021, 267, 01008. [Google Scholar] [CrossRef]
- Liu, F.; Yu, M.; Li, X.; Liu, J.; Yu, X. Research on Evaluation of Input and Output of Physical Assets of Power Grid Enterprises Based on DEA Theory. E3S Web Conf. 2021, 253, 03062. [Google Scholar] [CrossRef]
- Guo, Y.; Yu, Y.; Ren, H.; Xu, L. Scenario-based DEA assessment of energy-saving technological combinations in aluminum industry. J. Clean. Prod. 2020, 260, 121010. [Google Scholar] [CrossRef]
- Tsolas, I.E. Benchmarking engineering, procurement and construction (EPC) power plant projects by means of series two-stage DEA. Electricity 2020, 1, 1–11. [Google Scholar] [CrossRef]
- Farhudi, T.; Jannati Oskuee, M.R.; Najafi Ravadanegh, S. Multi-objective modelling of day ahead scheduling of MMG-based distribution networks accompanied by DEA considering economics, emissions and power quality. Int. J. Ambient. Energy 2020, 41, 588–599. [Google Scholar] [CrossRef]
- Shin, K.J.; Managi, S. Liberalization of a retail electricity market: Consumer satisfaction and household switching behavior in Japan. Energy Policy 2017, 110, 675–685. [Google Scholar] [CrossRef]
- Palacios, S.; Saavedra, E. Alternative policies for the liberalization of retail electricity markets in Chile. Util. Policy 2017, 49, 72–92. [Google Scholar] [CrossRef]
- Ma, L.; Zhang, X.; Wei, Z.; Xue, S.; Yang, S.; Tu, J. Enlightenment of Power Sales Side Market Liberalization in France. South. Power Syst. Technol. 2015, 9, 9–12. [Google Scholar]
- Charles, V.; Aparicio, J.; Zhu, J. The curse of dimensionality of decision-making units: A simple approach to increase the discriminatory power of data envelopment analysis. Eur. J. Oper. Res. 2019, 279, 929–940. [Google Scholar] [CrossRef]
- Rezaee, M.J.; Dadkhah, M. A hybrid approach based on inverse neural network to determine optimal level of energy consumption in electrical power generation. Comput. Ind. Eng. 2019, 134, 52–63. [Google Scholar] [CrossRef]
- Kottas, A.T.; Bozoudis, M.N.; Madas, M.A. Turbofan aero-engine efficiency evaluation: An integrated approach using VSBM two-stage network DEA. Omega 2020, 92, 102167. [Google Scholar] [CrossRef]
- Ren, J.; Li, S. Performance Evaluation of Planting Insurance Premium Subsidies in China-Based on the dynamic DEA and the three stage DEA. In Proceedings of the 7th Annual Meeting of Risk Analysis Council of China Association for Disaster Prevention (RAC-2016), Changsha, China, 4–6 November 2016; pp. 583–588. [Google Scholar]
- Sueyoshi, T.; Yuan, Y. Returns to damage under undesirable congestion and damages to return under desirable congestion measured by DEA environmental assessment with multiplier restriction: Economic and energy planning for social sustainability in China. Energy Econ. 2016, 56, 288–309. [Google Scholar] [CrossRef]
- Vlontzos, G.; Niavis, S.; Manos, B. A DEA approach for estimating the agricultural energy and environmental efficiency of EU countries. Renew. Sustain. Energy Rev. 2014, 40, 91–96. [Google Scholar] [CrossRef]
- Ignatius, J.; Ghasemi, M.-R.; Zhang, F.; Emrouznejad, A.; Hatami-Marbini, A. Carbon efficiency evaluation: An analytical framework using fuzzy DEA. Eur. J. Oper. Res. 2016, 253, 428–440. [Google Scholar] [CrossRef]
- Yang, J.; Yang, C.; Wang, X.; Cheng, M.; Shang, J. Efficiency Measurement and Factor Analysis of China’s Solar Photovoltaic Power Generation Considering Regional Differences Based on a FAHP–DEA Model. Energies 2020, 13, 1936. [Google Scholar] [CrossRef] [Green Version]
- Sun, J.; Ruze, N.; Zhang, J.; Zhao, H.; Shen, B. Evaluating the investment efficiency of China’s provincial power grid enterprises under new electricity market reform: Empirical evidence based on three-stage DEA model. Energies 2019, 12, 3524. [Google Scholar] [CrossRef] [Green Version]
- Xin-gang, Z.; Zhen, W. The technical efficiency of China’s wind power list enterprises: An estimation based on DEA method and micro-data. Renew. Energy 2019, 133, 470–479. [Google Scholar] [CrossRef]
- Wu, J.; Xia, P.; Zhu, Q.; Chu, J. Measuring environmental efficiency of thermoelectric power plants: A common equilibrium efficient frontier DEA approach with fixed-sum undesirable output. Ann. Oper. Res. 2019, 275, 731–749. [Google Scholar] [CrossRef]
- Liu, J.; Li, H.; Bai, H.; Lu, W.; Yuan, L. Research on Operational Efficiency Evaluation of Provincial Power Grid Enterprise Based on DEA. IOP Conf. Ser. Mater. Sci. Eng. 2018, 452, 032117. [Google Scholar] [CrossRef]
- Sun, H.; Tariq, G.; Chen, H.; Zhu, J.; Liu, Y.; Wu, C. Allocation of carbon emission quotas to Chinese power enterprises. Energy Procedia 2018, 152, 115–124. [Google Scholar] [CrossRef]
- Zhao, Q.; Zhang, C.; Dai, Q.; Liang, H. A slack-based DEA method for the performance evaluation and improvement of ultra-high voltage projects. Procedia Comput. Sci. 2018, 139, 236–241. [Google Scholar] [CrossRef]
- Jin, Y.; Yang, F.; Liu, J. Research on PM2. 5 emission reduction path of China‘s electric power industry based on DEA model. Proc. IOP Conf. Ser. Earth Environ. Sci. 2018, 121, 032028. [Google Scholar] [CrossRef] [Green Version]
- Zhang, J.; Li, Y. Research on the Efficiency of Beijing Tianjin Hebei Logistics Industry Based on Three Stage DEA Model. Proc. IOP Conf. Ser. Earth Environ. Sci. 2021, 791, 012071. [Google Scholar] [CrossRef]
- He, Q.; Tian, C.; Gao, K. Analysis on the Environmental Governance Efficiency of Local Governments in China and Its Influencing Factors. Int. J. Econ. Financ. Manag. Sci. 2020, 8, 9. [Google Scholar] [CrossRef]
- Li, C.; Pan, K. Research on financing efficiency of big data industry based on three stage DEA-Taking Guizhou Province as an example. In Proceedings of the 2nd International Forum on Management, Education and Information Technology Application (IFMEITA 2017), Shenzhen, China, 16–17 October 2017; pp. 438–442. [Google Scholar]
- Huang, D.; Dong, Y.; Liu, B.; Zhao, B. Regional energy efficiency analysis in China based on three-stage DEA model. Resour. Sci. 2012, 34, 688–695. [Google Scholar]
- Jiang, H.; Zhao, B. Measurement and deconstruction of regional energy efficiency in China under carbon emission constraints: Based on three-stage DEA method. Price Theory Pract. 2015, 37, 103–105. [Google Scholar] [CrossRef]
- Xu, Z.; Lv, B.; Dai, Y. Evaluation of regional energy efficiency in China based on three-stage DEA model. China Min. 2013, 22, 44–48. [Google Scholar]
- Xiang, Z.; Chen, X.; Lian, Y. Quantifying the vulnerability of surface water environment in humid areas base on DEA method. Water Resour. Manag. 2016, 30, 5101–5112. [Google Scholar] [CrossRef]
- Mai, Y.; Sun, F.; Shi, L.; Ma, Z. Evaluation of industrial water resources utilization efficiency in China based on DEA. Resour. Environ. Arid. Area 2014, 28, 42–47. [Google Scholar] [CrossRef]

| Variable Selection | The Index Name | Variable Explanation | |
|---|---|---|---|
| input variables | capital | capital investment | Net fixed Assets as of 2019 main business cost in 2019/100 million Yuan |
| labor | labor force | Number of staff at year-end | |
| output variables | economic output | company income | Main business income in 2019/100 million yuan |
| environment variables | Time factor | IPO time | The company’s IPO time |
| government favor factor | government subsidies | Government subsidy received in 2019/million yuan | |
| economic level | GDP per capita | GDP per capita/Yuan |
| Abbreviations | Meaning |
|---|---|
| ZZMD | Zhengzhou Coal Industry & Electric Power Co., Ltd. |
| CYDL | Chn Energy Changyuan Electric Power Co., Ltd. |
| HYDL | Datang Huayin Electric Power Co., Ltd. |
| ZZDL | Jinkong Power Co., Ltd. |
| WNDL | An Hui Wenergy Company Limited |
| JTNY | Jointo Energy Investment Co., Ltd. |
| GNGF | Jiangxi Ganneng Co., Ltd. |
| GTDL | SDIC Huajing Power Holdings Co., Ltd. |
| SHDL | Shanghai Electric Power Co., Ltd. |
| HNGJ | HUANENG Power Intl Inc. |
| HDGJ | Huadian Power International Co., Ltd. |
| NMHD | Inner Mongolia MengDian HuaNeng Thermal Power Co., Ltd. |
| BXNY | Guangdong Baolihua New Energy Stock Co., Ltd. |
| DTFD | Datang International Power Generation Co., Ltd. |
| TFNY | Xinjiang Tianfu Energy Co., Ltd. |
| CTNY | Sichuan Chuantou Energy Co., Ltd. |
| GGDL | Guangxi Guiguan Electric Power Co., Ltd. |
| DFNY | Spic Dongfang New Energy Corporation |
| SNGF | Shenergy Company Limited |
| ZNDL | Zhejiang Zheneng Electric Power Co., Ltd. |
| SZNY | Shenzhen Energy Group Co., Ltd. |
| SNGF | Guangdong Shaoneng Group Co., Ltd. |
| GDDL | GD Power Development Co., Ltd. |
| NUM | Company Code | Abbreviations | TE | PTE | SE | Economies of Scale |
|---|---|---|---|---|---|---|
| 1 | 600121.SH | ZZMD | 1 | 1 | 1 | - |
| 2 | 000966.SZ | CYDL | 1 | 1 | 1 | - |
| 3 | 600744.SH | HYDL | 0.908 | 0.915 | 0.993 | drs |
| 4 | 000767.SZ | ZZDL | 0.795 | 0.834 | 0.953 | drs |
| 5 | 000543.SZ | WNDL | 0.928 | 0.93 | 0.997 | drs |
| 6 | 000600.SZ | JTNY | 0.953 | 0.968 | 0.985 | drs |
| 7 | 000899.SZ | GNGF | 1 | 1 | 1 | - |
| 8 | 600886.SH | GTDL | 1 | 1 | 1 | - |
| 9 | 600021.SH | SHDL | 0.864 | 0.898 | 0.962 | drs |
| 10 | 600011.SH | HNGJ | 0.898 | 1 | 0.898 | drs |
| 11 | 600027.SH | HDGJ | 0.872 | 0.986 | 0.884 | drs |
| 12 | 600795.SH | GDDL | 0.814 | 1 | 0.814 | drs |
| 13 | 600863.SH | NMHD | 0.862 | 0.915 | 0.943 | drs |
| 14 | 000690.SZ | BXNY | 1 | 1 | 1 | - |
| 15 | 601991.SH | DTFD | 0.857 | 0.968 | 0.886 | drs |
| 16 | 600509.SH | TFNY | 0.749 | 0.755 | 0.991 | drs |
| 17 | 600674.SH | CTNY | 1 | 1 | 1 | - |
| 18 | 600236.SH | GGDL | 1 | 1 | 1 | - |
| 19 | 000958.SZ | DFNY | 0.944 | 0.944 | 0.999 | drs |
| 20 | 600642.SH | SNGF | 1 | 1 | 1 | - |
| 21 | 600023.SH | ZNDL | 0.989 | 1 | 0.989 | drs |
| 22 | 000027.SZ | SZNY | 0.921 | 0.986 | 0.934 | drs |
| 23 | 000601.SZ | SNGF | 0.921 | 0.922 | 1 | - |
| Net Fixed Assets | Main Business Cost | The Number of Employees | |
|---|---|---|---|
| Constant term | −1082.6841 ** (−2.4386853) | −747.47938 *** (−9.1154557) | 20,940.899 *** (20,954.919) |
| IPO time | 0.53973791 ** (2.4353150) | 0.37270907 *** (8.9603324) | −10.543803 *** (−160.27821) |
| government subsidies | −0.0062000297 (−0.82476162) | −0.021766491 * (−2.0639441) | −0.96711902 (−0.22244207) |
| GDP per capita | 0.23741416 *** (6.5123111) | 0.18409552 *** (7.0133093) | 8.3347062 *** (8.6160345) |
| sigma-squared | 385.1755 ** (3.5825997) | 106.83754 *** (95.626135) | 5,046,620.2 *** (5,046,620.2) |
| gamma | 0.97881507 *** (57.612574) | 0.9999 *** (1868.2126) | 0.9999 *** (261,265.73) |
| NUM | Company Code | Abbreviations | TE | PTE | SE | Economies of Scale |
|---|---|---|---|---|---|---|
| 1 | 600121.SH | ZZMD | 1 | 1 | 1 | - |
| 2 | 000966.SZ | CYDL | 1 | 1 | 1 | irs |
| 3 | 600744.SH | HYDL | 0.877 | 0.898 | 0.977 | irs |
| 4 | 000767.SZ | ZZDL | 0.823 | 0.826 | 0.997 | irs |
| 5 | 000543.SZ | WNDL | 0.902 | 0.917 | 0.984 | irs |
| 6 | 000600.SZ | JTNY | 0.952 | 0.954 | 0.998 | irs |
| 7 | 000899.SZ | GNGF | 0.897 | 1 | 0.897 | - |
| 8 | 600886.SH | GTDL | 1 | 1 | 1 | irs |
| 9 | 600021.SH | SHDL | 0.901 | 0.901 | 0.999 | drs |
| 10 | 600011.SH | HNGJ | 0.934 | 1 | 0.934 | drs |
| 11 | 600027.SH | HDGJ | 0.917 | 0.986 | 0.93 | drs |
| 12 | 600795.SH | GDDL | 0.882 | 1 | 0.882 | irs |
| 13 | 600863.SH | NMHD | 0.902 | 0.904 | 0.998 | - |
| 14 | 000690.SZ | BXNY | 1 | 1 | 1 | drs |
| 15 | 601991.SH | DTFD | 0.933 | 0.981 | 0.951 | irs |
| 16 | 600509.SH | TFNY | 0.75 | 0.787 | 0.953 | - |
| 17 | 600674.SH | CTNY | 1 | 1 | 1 | - |
| 18 | 600236.SH | GGDL | 1 | 1 | 1 | irs |
| 19 | 000958.SZ | DFNY | 0.922 | 0.941 | 0.98 | - |
| 20 | 600642.SH | SNGF | 1 | 1 | 1 | - |
| 21 | 600023.SH | ZNDL | 1 | 1 | 1 | irs |
| 22 | 000027.SZ | SZNY | 0.97 | 0.97 | 0.999 | irs |
| 23 | 000601.SZ | SNGF | 0.893 | 0.924 | 0.967 | irs |
| Abbreviations | Original Main Business Income | Main Business Income after Optimization |
|---|---|---|
| ZZMD | 34.56 | 34.56 |
| CYDL | 71.61 | 71.61 |
| HYDL | 87.84 | 95.86 |
| ZZDL | 108.95 | 129.65 |
| WNDL | 157.07 | 168.71 |
| JTNY | 138.71 | 143.08 |
| GNGF | 26.29 | 26.29 |
| GTDL | 424.33 | 424.33 |
| SHDL | 231.17 | 256.76 |
| HNGJ | 1651.6 | 1651.6 |
| HDGJ | 924.72 | 935.56 |
| GDDL | 1144.83 | 1144.83 |
| NMHD | 144.45 | 157.47 |
| BXNY | 56.27 | 56.27 |
| DTFD | 942.52 | 972.84 |
| TFNY | 48.11 | 63.43 |
| CTNY | 8.16 | 8.16 |
| GGDL | 89.94 | 89.94 |
| DFNY | 84.1 | 88.96 |
| SNGF | 387.33 | 387.33 |
| ZNDL | 452.45 | 452.45 |
| SZNY | 185.96 | 188.55 |
| SNGF | 42.04 | 45.59 |
Publisher’s Note: MDPI stays neutral with regard to jurisdictional claims in published maps and institutional affiliations. |
© 2022 by the authors. Licensee MDPI, Basel, Switzerland. This article is an open access article distributed under the terms and conditions of the Creative Commons Attribution (CC BY) license (https://creativecommons.org/licenses/by/4.0/).
Share and Cite
Zhao, W.; Qiu, Y.; Lu, W.; Yuan, P. Input–Output Efficiency of Chinese Power Generation Enterprises and Its Improvement Direction-Based on Three-Stage DEA Model. Sustainability 2022, 14, 7421. https://doi.org/10.3390/su14127421
Zhao W, Qiu Y, Lu W, Yuan P. Input–Output Efficiency of Chinese Power Generation Enterprises and Its Improvement Direction-Based on Three-Stage DEA Model. Sustainability. 2022; 14(12):7421. https://doi.org/10.3390/su14127421
Chicago/Turabian StyleZhao, Wenhui, Ye Qiu, Wei Lu, and Puyu Yuan. 2022. "Input–Output Efficiency of Chinese Power Generation Enterprises and Its Improvement Direction-Based on Three-Stage DEA Model" Sustainability 14, no. 12: 7421. https://doi.org/10.3390/su14127421
APA StyleZhao, W., Qiu, Y., Lu, W., & Yuan, P. (2022). Input–Output Efficiency of Chinese Power Generation Enterprises and Its Improvement Direction-Based on Three-Stage DEA Model. Sustainability, 14(12), 7421. https://doi.org/10.3390/su14127421