Abstract
This paper uses the three-stage DEA method to measure the input–output efficiency of China’s 23 listed power generation companies (mainly thermal power generation) in 2019, and uses the SFA regression model to eliminate environmental elements and random disturbances. The results show that in a non-homogeneous environment, the scale efficiencies of most power generation companies are greater than or equal to their pure technical efficiencies. These companies should first improve management and technical levels, and then optimize the scale of investment. Furthermore, after removing environmental variables, half of the companies should turn to increasing economies of scale instead of diminishing economies of scale. It can be seen that environmental factors, such as the degree of regional development and IPO time, have reduced the economies of scale of enterprises, so they should strengthen the communication between different regions, and the government should provide assistance to companies that are listed late.
1. Introduction
At present, with the progress of science and technology, industrial production and human life put forward new requirements on the output and quality of electric energy. At present, China’s ecological civilization construction is in the critical period of linking the past with the future, in the crucial period of meeting the needs of the people for a better living environment, and in the window period of having the conditions and ability to solve prominent ecological environment problems, which is the “superposition of the three phases” period. China has a huge demand for energy, and energy consumption is an important component of China’s social consumption. Energy consumption, energy efficiency, and economic and social development mirror each other and present a common development trend [1]. Because the energy and power industry is very important to national security, it plays an important role in all countries around the world, especially in China. The energy and electric power industry is a public utility and a monopoly industry of natural resources. Many power generation enterprises have the property of state-owned assets, but the marketization degree, management level, and efficiency of different power generation enterprises are uneven. With the transformation of China’s economic development mode, economic development has entered a new normal, and it has begun to focus on innovation efficiency and quality. In particular, the second round of electricity market reform, which started in 2015, has a greater impact on China’s power enterprises. In spot mode, it is necessary to quote according to variable cost to ensure marginal benefit, and it is also necessary to reduce fixed cost, so as to realize profit without loss. Electricity quantity and profit are subject to the level of cost. Obviously, the cost is closely related to the input–output efficiency of the enterprise itself, which directly determines the development of the enterprise. Therefore, in the background of China’s new era, it is necessary to study the input–output efficiency of power generation enterprises. As China is the biggest developing country, its energy and environmental development model has important reference value to other developing countries. Its experience can enhance the efficiency of the power generation industry’s input and output for the rest of the developing countries. In order to achieve the goal of double carbon in the world, China’s power for the ecological environment of human beings must be examined. Thus, it is of great significance to improve the input–output efficiency of power generation enterprises.
Many studies have been conducted on the input–output efficiency of energy and electric power industry. Kleit and Terrell [2] estimated the production efficiency and economies of scale of 78 natural gas power plants in the United States in 1996 by using a Bayesian SFA model. Korhonen and Tsutsui [3] studied the input–output efficiency of 24 power generation enterprises by taking the undesired output pollutants as an input. Pombo and Taborda [4] used the Malmquist index method to measure the input–output efficiency changes in 12 power distribution companies in Colombia from 1985 to 2001. Hattori and Luptacik [5] used the SFA model to measure the production efficiency of distribution companies in the United States and Japan. Tsutsui [6] calculated the impact of electricity prices on the technical efficiency of the power distribution industry by using the annual data of 19 OECD countries. Cote [7] used the stochastic cost frontier model to study the production data of privately owned, associated, and municipal power enterprises and made a block measurement. Goto and Tsutsui [8] used the DEA model to study the cost, configuration, and technical efficiency of several electric power companies in the United States and Japan. Abbott [9] used the Malmquist index method to study the changes in input–output efficiency in various regions of Australia. Du et al. [10] divided the American electric power industry into three parts: power generation, power supply, and comprehensive, and calculated them by an SFA model. Hadi et al. [11] used the DEA model to measure the input–output efficiency of Japanese steam power generation enterprises, and studied the reasons for its change with the GMM method. Ma [12] studied the fuel use efficiency of American thermal power enterprises. Yu et al. [13] studied the changes in the number of employees and wages of power generation enterprises in the process of market reform in the United States. Guo et al. [14] measured the changes in allocative efficiency and production efficiency of the British power supply industry before and after the reform of the power supply industry. Tsolas [15] calculated the input–output efficiency of 2275 samples of power distribution and transmission enterprises in Sweden. Tohid et al. [16] studied and introduced Russia’s electricity market operation mode of “complete separation of generation, transmission, distribution, and sale.” Kong and Managi [17], Sebastian and Eduardo [18], and Li et al. [19], respectively, studied the liberalization of electricity sales markets in Japan and Chile. Charles et al. [20] and Rezaee et al. [21] analyzed the changes in electricity prices in Turkey and other EU countries after the liberalization of the electricity market. Kottas et al. [22] conducted an in-depth study on the influence of New Zealand’s perfect competition mode on distribution quality. In genereal, research on the input–output efficiency of the energy and electric power industry has been widely concerning for scholars, but there is little research on the input–output efficiency of Chinese power generation enterprises [23].
The principle of the data envelopment analysis (DEA) method is simple and its conclusion has practical significance, which has been used in various industries. For example, many foreign scholars have used the DEA model to study the operating efficiencies of multiple industries. Sueyoshi and Yuan [24] analyzed the damage compensation under ideal and undesirable congestion conditions by using the DEA model. Niavis and Vlontzos [25] evaluated the agricultural energy and environmental efficiency of European countries with the DEA method. Ignatius [26] evaluated carbon utilization efficiency in Europe by using the fuzzy DEA model. Yang et al. [27] proposed that the DEA method can effectively evaluate the production model with multiple inputs and outputs without relying on a specific function framework, so it has practical reference significance for the analysis of energy efficiency. In recent years, domestic scholars have used the DEA model more and more frequently. The following take the energy industry as an example. Sun et al. [28], Zhao and Wei [29], and Wu et al. [30], respectively, introduced the applications of the SSBM-DEA model, the traditional DEA model, and the DEA-BCC model to the efficiency analysis of the domestic energy industry, and evaluated the energy efficiency of the industry and manufacturing industry in a holistic way. Liu et al. [31] optimized the traditional DEA model and used the optimized model to calculate the industrial energy efficiencies of 30 provinces. The traditional DEA model is the default in homogenous environmental conditions to measure input and output efficiencies, but in real production environments, the SFA Tobit regression model is considered, combined with the DEA model, respectively, in two new stages, and the three stages of the DEA method are used to evaluate energy enterprises’ real technical levels and scale economies. Sun et al. [32] analyzed the scientific and technological innovation rate of a specific region by using the two-stage DEA method and taking the output of innovative, high-tech products as an output factor. Zhao et al. [33] evaluated port operation performance and analyzed the influencing factors by using the two-stage DEA method. Jin et al. [34] used the three-stage DEA model to homogenize the operating environment of 36 domestic insurance companies and evaluate the capital utilization efficiencies of the insurance companies in a homogeneous environment. By the end of the past century, a three-stage DEA analysis had been applied in air treatment [35,36,37], energy production [38,39,40], water conservancy [41,42], and other fields, contributing to the improvement of operational efficiency in all walks of life. Therefore, it is reasonable and effective to use the DEA model to analyze the input–output efficiency of Chinese power generation companies.
The research aim of this paper is to understand the situations of power generation enterprises after the most recent round of power market reform in China. The supply-side reform has an important impact on these enterprises, so it presents some new characteristics that have not been studied before. Secondly, this paper innovatively gives the theoretical output optimization scheme of power generation enterprises, which can provide the impetus for the development of power generation companies and help them tap their own development potentials. Finally, this paper can provide experience of the optimization of output value in more industries and provide a new idea for optimization. At the same time, this paper also puts forward relevant suggestions at the end of the article.
The rest of the article is structured as follows: Section 2 is a theoretical introduction to the three-stage DEA method; Section 3 performs an empirical study on the collected data; in the Section 4, the output optimization scheme of power generation enterprises is discussed; finally, the recommendations and policy implications of this paper are given in Section 5.
2. Research Methods and Data Description
2.1. Research Methods
This paper chooses the three-stage DEA method to evaluate the input–output efficiency of major power generation enterprises in China.
Stage 1: Traditional DEA model
In the first stage, a BCC model with variable returns to scale is used to calculate. The variable weight coefficients of input–output elements of DMU (decision making unit) were selected as variables, and the BCC model was used to calculate the generating frontier, then analyze the deviation degree between each decision unit and the production frontier, and give the input–output efficiency as an inverse performance evaluation. There are two optimization types of the BCC model: input-oriented and output-oriented. The former focuses on optimizing the inputs of DMU and basically does not change the outputs, while the latter—vice versa. Based on the principle of environmental friendliness and practical feasibility, input-oriented optimization is selected as the optimization type.
The mathematical expression of the BCC model is shown in Equation (1).
In the formula; j = 1, 2, …, n is the DMU; X, Y are the input factors and output factors, respectively, and , , and are the judgment variables. If = 1, = this DEA evaluation is valid; if = 1, ≠ 0, or , then this DEA evaluation is weakly valid; if , then this DEA evaluation is invalid. The BBC model outputs three kinds of efficiencies: comprehensive technical efficiency (TE), pure technical efficiency (PTE), and scale efficiency (SE), and satisfies TE = SE × PTE.
Stage 2: SFA regression model
The first stage is a DEA efficiency evaluation in a non-homogeneous environment. The evaluation results are affected by management inefficiency, environmental factors, and random disturbance, and cannot reflect the essential attributes of each decision making unit. Therefore, environmental homogenization is required in the second stage, in which the SFA regression model is used to eliminate the influencing factors. The steps are as follows.
① Environmental factors assumption
In the formula, is the relaxation variable of the input n of the DMU i; is the ith environment variable; is the solve-for parameter of ; sum Management inefficiency and random disturbance argument get mixed error term argument . Assume and are independent and unrelated, and satisfy .
② Separate management inefficiencies
In the formula; , .
③ Calculate the random error term
Stage 3: DEA model in homogeneous environment
In this stage, the homogeneous inputs obtained in the second stage are input into the BCC model used in the first stage to obtain the input–output efficiency of DMU under real conditions. By comparing the efficiency values of the first stage and the third stage, the influence of environmental variables on the efficiency value can be obtained.
2.2. Variable Selection
In view of the availability and completeness of data, this paper mainly selects the data of listed companies in the Shanghai and Shenzhen stock markets. Because listed companies are supervised by the Securities Regulatory Commission, exchanges, and ordinary investors, information disclosure is relatively sufficient, and many key indicators related to the production efficiency of the power generation industry can be obtained. According to the classification standard for the industry classification of listed companies, if a specific business of a listed company accounts for 30% or more of the total revenue and profit, or a specific business accounts for more than 50% of the total revenue, it shall be classified according to the specific business. This article selects power generation companies that have a number of power generation businesses, and account for over 50% of the total thermal power businesses. Therefore, this article selects the power generation companies that are thermal power companies. At the same time, according to the companyies’ total revenue and enterprise scales, this article selects 23 power generation companies to give a better representation.
- (1)
- Input variables selection
According to the theory of macroeconomics, this paper selects the net value of fixed assets, the cost of the main business, and the number of employees as input variables: ① Net value of fixed assets and cost of main business. In this paper, the net fixed assets and main business costs of 23 major power generation companies in China in 2019 are selected as the capital input data. The data are from the annual reports of companies in Shanghai and Shenzhen stock exchanges in 2019. ② The number of employees. In this paper, the number of employees in 23 major power generation companies in China at the end of 2019 is selected as the labor input, and the data are also from the annual reports of companies in Shanghai and Shenzhen stock exchanges in 2019.
- (2)
- Output variables selection
The types of output are divided into expected output and unexpected output. This paper only evaluates the input–output efficiency of power generation companies, so the main business income and sales gross margin in the 2019 annual report of each company are selected as output variables. Taking 2010 as the base period, this paper calculates the actual main business income of each power generation company through the total production index of the power generation company.
- (3)
- Environmental variables Selection
By selecting appropriate environmental variables and eliminating them in the second stage, the input–output efficiency of each power generation company can be compared in a nearly homogeneous environment. This paper considers the influence of the time factor, the government favor factor, and the regional economic development level on the operating efficiency of power generation companies. Among them, the time factor considers the IPO time of each company as an environmental variable, which can reflect its operating time. The government’s preference factor considers the amount of government subsidy as an environmental variable, and the amount of government subsidy obtained can reflect to some extent the fit degree of the industrial structure and capacity mode of the power generation company with the government policy concept. In terms of regional economic development level, the per capita GDP of the province where the company is located in 2019 is considered as an environmental variable. The power generation company input–output index system is shown in Table 1.

Table 1.
Power generation company input–output index system.
3. Empirical Results and Analysis
To help readers understand the names of power generation companies mentioned in the article, abbreviations for each power generation company are shown in Table 2.
Table 2.
Notes for abbreviations of power generation companies.
3.1. The First Stage: DEA Result Analysis
In the first stage, the variables are input as shown in Table 1 into the input-oriented BBC model. In a non-homogeneous environment, DEAP2.1 software was used to evaluate the input–output efficiency of 23 major power generation companies in China in 2019, as shown in Table 3, and the histogram of DEA results in the first stage is shown in Figure 1. DRS and IRS in economies of scale represent decreasing economies of scale and increasing economies of scale, respectively. The former means that the increase in output is less than the increase in production factors, which equals poor economies of scale, and the latter—vice versa.
Table 3.
Input–Output Efficiencies of 23 Major Power Generation Companies in China (Phase I).
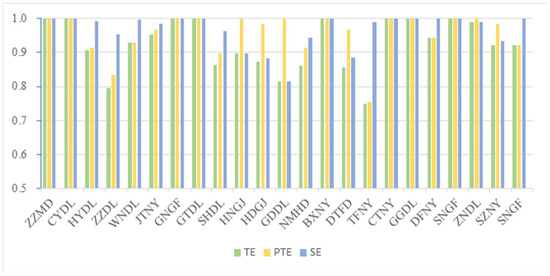
Figure 1.
Histogram of DEA results in the first stage.
On the whole, the average TE of 23 power generation companies is 0.925, the average PTE is 0.957, and the average scale efficiency is 0.966. In addition to ZZDL and TFNY, the comprehensive efficiency of the remaining 21 power generation companies is greater than 0.8, which is close to the production frontier. At the same time, the economies of scale in production frontier are diminishing scale, and it can be seen that in the current environment, the investment of a unit of output is less than one unit—namely, the scale efficiency is low. Our initial guess is that environmental factors led to this result; this article will continue to research this problem in the second and third stage. Individually, TE of ZZMD, CYDL, GNGF, GTDL, BXNY, CTNY, GGDL, and SNGF are all 1, which are at the forefront of production. Economies of scale are equal ratios of output to input. Some companies are not at the forefront of production and have PTEs less than scale efficiencies; HYDL, for example, has a SE of 0.993, and its comprehensive efficiency deviates from the forefront of production, because its PTE is only 0.915. For such enterprises, the management and technical levels should be improved first to effectively improve their TEs. Some companies are not at the forefront of production and have PTEs greater than scale efficiencies; HDGJ, for example, has a PTE of 0.986, while its SE is only 0.884. Such enterprises have low economy of scale, so they should first improve their equipment configuration per unit scale and study the problem of scale configuration before expanding their scale, which would be conducive to improving economy of scale.
In the first stage, the influence of environmental factors has not been removed, and the assessment is in a non-homogeneous environment, which cannot reflect the real management, technical levels, and economy of scale of the power generation companies. This paper will make further calculations on this basis.
3.2. The Second Stage: SFA Regression Analysis
In the second stage, the regional per capita GDP, government subsidy, and IPO time were taken as independent variables, and the relaxation variables of the three input variables, fixed asset net value, main business cost, and number of employees, were taken as dependent variables. Frontier4.1 software was used to perform the SFA regression calculation. All the calculated results passed the LR unilateral test, that is, were significant at the test level of 5%. Table 4 lists the SFA regression results of 23 major domestic power generation companies in 2019, with T values in brackets.
Table 4.
SFA regression results.
- (1)
- IPO time
IPO time: The t values of the influence of market years on the three input variables are significant at the 5% test level. The later the IPO time, the later the listing, which will increase the redundancy of net fixed assets. It is reasonable to guess that the late listed companies will face greater competitive pressure, so they need to make corresponding preparations, such as increasing the production scale, so sometimes economies of scale cannot be taken into account. At the same time, when the IPO time increases, the waste of the main business costs will increase accordingly. Finally, the increase in IPO time will reduce the redundancy of the number of employees. It is possible that the companies that go public later tend to be established later, so their management and operation modes will be relatively new. Such management and operation modes will emphasize the efficiency of staff hiring and effectively reduce the redundancy of staff numbers.
- (2)
- Government subsidies:
The t value of test results of government subsidies to the net value of fixed assets and the influence of the number of employees was not significant, but in the main business costs, it was significant under a 10% inspection level, and its impact on main business cost slack variable is negative. To a certain extent, it can be seen that more government subsidies will tend to be more in line with the production mode of government policy, by being able to produce energy more efficiently and in a more environmentally friendly way, and waste less operating costs.
- (3)
- Regional per capita GDP
The influence of regional per capita GDP on the relaxation variables of the three input variables is significant at the 1% test level. It can be seen that the higher the regional per capita GDP is, the higher the fixed asset net value, main business cost, and redundancy of the number of employees will be. High GDP per capita tends to represent a higher level of economic development in the region, higher regional land prices, and higher transaction costs; this tend to attract the employment of a more foreign population at the same time, which may make a power generation company’s net value of fixed assets and operating cost more wasteful. Additionally, in order to meet the employment needs of the population, the companies may provide too many jobs, and there will be redundancies in the number of employees.
To sum up, the impact of environmental factors and random disturbances on input variables is objective, so the efficiency analysis in a non-homogeneous environment is not objective enough. In the third stage, after eliminating the influencing factors, this paper will evaluate the efficiencies of 23 power generation companies in a homogeneous environment, so as to show the real management and technical levels of power generation companies and economies of scale.
3.3. The Third Stage: DEA Result Analysis
In this stage, after excluding the influences of regional per capita GDP, IPO time, government subsidy, other environmental factors, and random disturbance on the model, input variables and original output variables of each power generation company in a homogeneous environment were imported into the BBC model. DEAP2.1 software was used again to evaluate the input–output efficiency of 23 major power generation companies in 2019, as shown in Table 5. The histogram of DEA results in the third stage is shown in Figure 2.
Table 5.
Input–output efficiency of 23 Major Power Generation Companies in China (Phase III).
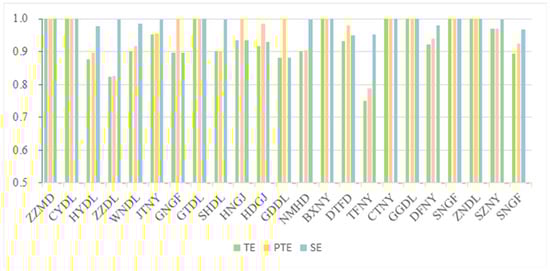
Figure 2.
Histogram of DEA results in the third stage.
On the whole, the average TE of the 23 power generation companies was 0.933, higher than the average TE of the first stage, while the average PTE was 0.956 and the average SE was 0.976. Compared with the first stage, the average PTE was almost the same, while the average SE increased in the third stage. It is reasonable to guess that environmental factors restrict the economies of scale of power generation companies. This is realistic, because the expansion of production scale is often accompanied by environmental resistance, such as land prices and transaction costs that are influenced by regional economic development, which hinder the economy of scale. In terms of economies of scale, except for HNGJ, HDGJ, SHDL, and BXNY, the output of one unit of input of the other power generation companies is greater than or equal to one unit, which can reflect their economies of scale. Obviously, environmental factors inhibit the economies of scale of most companies. Individually, ZZMD, CYDL, GTDL, BXNY, CTNY, GGDL, and SNGF are all at the forefront of production, regardless of whether environmental factors are considered. As for HYDL, WNDL, JTNY, GNGF, DFNY, and SNGF, after adjusting their environmental factors, all of their efficiencies declined, probably because these companies are benefiting from the environmental dividend. Their previous efficiency is closely related to favorable environment and good luck, but they are not as efficient as before in this stage. The government subsidy intensity is defined as the ratio of the government subsidy amount to the main business cost, and according to the following analysis, the efficiencies of ZZDL, SHDL, HNGJ, GDDL, NMHD, DTFD, SZNY all increased after excluding environmental factors. Obviously, environmental variables inhibit their operating efficiencies. HNGJ and GDDL are less influenced by government subsidies, and also have reduced production efficiencies to a certain extent. SHDL and DTFD were listed in 2003 and 2006, respectively, and listed later. Among them, DTFD’s income is little affected by government subsidies. It can be preliminarily inferred that the company is not closely connected with the development strategy of the government, while Shanghai Electric Power is heavily subsidized by the government. It is preliminarily inferred that the company’s IPO time is late; it gained the government’s support for the new company. Still, the company’s management system and development strategy need to be improved.
4. China Power Generation Company Main Business Income Optimization
The DEA analysis mentioned above is input-oriented. In order to study the optimization of main business incomes of Chinese power generation enterprises and consider the objectivity of environmental variables, raw data are selected in this section for an output-oriented DEA analysis. The data of main business income before and after optimization are shown in Table 6, and the histogram line chart is shown in Figure 3. It can be seen that most power generation companies still have optimization margins. The reasons for the existence of optimization margins have been analyzed in the previous section. This model can optimize the input redundancy of power generation companies, improve their operating efficiencies, move them closer to the forefront of production, and then promote the optimization of industrial structures, enhance the vitality of the industry, and help to achieve carbon neutrality and carbon peak.
Table 6.
Revenue optimization results of 23 major power generation companies in China.
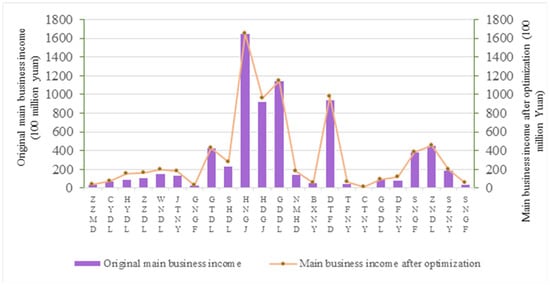
Figure 3.
Optimization results of main business income of power generation companies.
To help power generation companies achieve the desired revenue optimization, this paper will put forward suggestions for China’s major power generation companies in the next section.
5. Recommendations and Policy Implications
5.1. Recommendations
The empirical results of this paper can help each power generation company to have a clearer understanding of the factors affecting its own operating efficiency, and help each power generation company to improve its operating efficiency in a more targeted way. Relevant suggestions will also be given in this paper.
(1) China’s power generation companies are mostly incumbents, limited by the traditional system and corporate culture; they easily miss out on the best promotion opportunities for innovative businesses and products. Therefore, it is suggested that power generation companies with low scale efficiency carry out innovative energy business strategies, such as implementing integrated energy services, developing energy service businesses (by relying on the accumulated user stickiness advantage of incumbents), and improving their economies of scale. These are recommended so that we can promote the integration of power generation and innovative energy service elements, as well as release the synergistic effect of power generation and innovative energy business.
(2) At present, the management system of most power generation companies in China is old, which leads to low pure technical efficiency. For these companies, first of all, they should make the division of labor clearer, establish more scientific company rules and regulations, and formulate corresponding reward and punishment mechanisms to build dynamic company cultures. Secondly, the business process should be straightened out, the budget should be rationally arranged, and the process control should be strengthened. The financial management should be transformed from the result control form of cost entry and capital payment to the process control form of business execution. Power companies must adhere to an economic and reasonable supply distribution. This is recommended in order to ensure the power supply can meet the company’s development requirements, and to reduce the supply cost as far as possible—for example, creating an intelligent warehouse management system would improve the supply distribution efficiency and pure technical efficiency.
(3) For the impact of the operating environment on the efficiency of power generation companies, the following suggestions are given. First of all, the generating capacity of power generation companies is related to the asset scale of industrial enterprises in the region. The government can introduce more industrial companies to promote the operation vitality of power generation companies. Second, GDP per capita has a positive correlation with employees’ wages. If GDP per capita is low, it may lead to a talent shortage, so local governments should implement targeted talent introduction policies. If power generation companies play a significant role in driving local industrial enterprises, the government can set up special recruitment fairs to attract talent. In addition, special research grants, housing subsidies, and academic education subsidies can be formulated to attract talent in certain industries. Finally, the government should set up a three-dimensional assessment mechanism for power generation companies, classify local power generation companies according to their operating efficiencies, and issue corresponding government subsidies accordingly. Additionally, it should give extra subsidies for companies that are listed late, so as to promote benign competition among power generation companies and improve operating efficiency.
5.2. Policy Implications
(1) In the future, coal will be replaced by new energy power generation, and because the products of the various power generation enterprises are very similar, there will be a vicious competition between the companies of each generation; therefore, the power generation enterprises should concentrate on technology development and technology innovation. New technology can achieve cleaner power, and reduce energy waste in the power generation process, further improving the investment and energy efficiencies, as well as the rate of return on investment and competitiveness.
(2) Each power generation enterprise should properly consider the technical transformation of energy storage, improve regulatory performance, turn to the auxiliary service of the operation service system, vigorously develop distributed energy projects, actively participate in the development and construction of photovoltaic projects, steadily expand overseas power projects, take steps towards carbon reduction and carbon resources, and gradually complete the transformation of the enterprise.
(3) China has launched a national carbon trading market worth 100 billion yuan. As a result, power generation companies will experience an evolutionary process. They shall conduct good enterprise internal training and internal institution construction preparation work, such as that on sustainable development, as well as improve the efficiency of thermal power generating units and renewable energy, such as hydrogen active layout.
Author Contributions
Conceptualization, W.Z.; methodology, Y.Q.; validation, W.Z.; formal analysis, W.L.; investigation, Y.Q.; resources, P.Y.; data curation, W.Z.; writing—original draft preparation, Y.Q.; writing—review and editing, W.Z.; visualization, Y.Q.; supervision, W.L.; project administration, W.L.; funding acquisition, P.Y. All authors have read and agreed to the published version of the manuscript.
Funding
This research was funded by the National Natural Science Foundation of China, the Ministry of Education of the Humanities and Social Science project and the Scientific Research Project of Liaoning Provincial Department of Education, grant numbers 20BJL036, 18YJAZH138, and LG201912.
Institutional Review Board Statement
Not applicable.
Informed Consent Statement
Not applicable.
Data Availability Statement
Not applicable.
Conflicts of Interest
The authors declare no conflict of interest.
References
- Wu, L.; Wang, L. Research on energy consumption and energy efficiency fluctuation and its Influencing factors in China. Urban Environ. Stud. 2019, 3, 55–71. [Google Scholar]
- Kleit, A.N.; Terrell, D. Measuring potential efficiency gains from deregulation of electricity generation: A Bayesian approach. Rev. Econ. Stat. 2001, 83, 523–530. [Google Scholar] [CrossRef]
- Hattori, T.; Tsutsui, M. Economic impact of regulatory reforms in the electricity supply industry: A panel data analysis for OECD countries. Energy Policy 2004, 32, 823–832. [Google Scholar] [CrossRef]
- Pombo, C.; Taborda, R. Performance and efficiency in Colombia’s power distribution system: Effects of the 1994 reform. Energy Econ. 2006, 28, 339–369. [Google Scholar] [CrossRef]
- Korhonen, P.J.; Luptacik, M. Eco-efficiency analysis of power plants: An extension of data envelopment analysis. Eur. J. Oper. Res. 2004, 154, 437–446. [Google Scholar] [CrossRef]
- Hattori, T. Relative performance of US and Japanese electricity distribution: An application of stochastic frontier analysis. J. Product. Anal. 2002, 18, 269–284. [Google Scholar] [CrossRef]
- Cote, D.O. Firm efficiency and ownership structure: The case of US electric utilities using panel data. Ann. Public Coop. Econ. 1989, 60, 431–450. [Google Scholar] [CrossRef]
- Goto, M.; Tsutsui, M. Comparison of productive and cost efficiencies among Japanese and US electric utilities. Omega 1998, 26, 177–194. [Google Scholar] [CrossRef]
- Abbott, M. The productivity and efficiency of the Australian electricity supply industry. Energy Econ. 2006, 28, 444–454. [Google Scholar] [CrossRef]
- Du, M.; Liu, Y.; Wang, B.; Lee, M.; Zhang, N. The sources of regulated productivity in Chinese power plants: An estimation of the restricted cost function combined with DEA approach. Energy Econ. 2021, 100, 105318. [Google Scholar] [CrossRef]
- Khodadadipour, M.; Hadi-Vencheh, A.; Behzadi, M.; Rostamy-Malkhalifeh, M. Undesirable factors in stochastic DEA cross-efficiency evaluation: An application to thermal power plant energy efficiency. Econ. Anal. Policy 2021, 69, 613–628. [Google Scholar] [CrossRef]
- Ma, C. DEA Model Construction and Investment Efficiency Analysis of Overseas Electric Power Market in Clean Energy. E3S Web Conf. 2021, 267, 01008. [Google Scholar] [CrossRef]
- Liu, F.; Yu, M.; Li, X.; Liu, J.; Yu, X. Research on Evaluation of Input and Output of Physical Assets of Power Grid Enterprises Based on DEA Theory. E3S Web Conf. 2021, 253, 03062. [Google Scholar] [CrossRef]
- Guo, Y.; Yu, Y.; Ren, H.; Xu, L. Scenario-based DEA assessment of energy-saving technological combinations in aluminum industry. J. Clean. Prod. 2020, 260, 121010. [Google Scholar] [CrossRef]
- Tsolas, I.E. Benchmarking engineering, procurement and construction (EPC) power plant projects by means of series two-stage DEA. Electricity 2020, 1, 1–11. [Google Scholar] [CrossRef]
- Farhudi, T.; Jannati Oskuee, M.R.; Najafi Ravadanegh, S. Multi-objective modelling of day ahead scheduling of MMG-based distribution networks accompanied by DEA considering economics, emissions and power quality. Int. J. Ambient. Energy 2020, 41, 588–599. [Google Scholar] [CrossRef]
- Shin, K.J.; Managi, S. Liberalization of a retail electricity market: Consumer satisfaction and household switching behavior in Japan. Energy Policy 2017, 110, 675–685. [Google Scholar] [CrossRef]
- Palacios, S.; Saavedra, E. Alternative policies for the liberalization of retail electricity markets in Chile. Util. Policy 2017, 49, 72–92. [Google Scholar] [CrossRef]
- Ma, L.; Zhang, X.; Wei, Z.; Xue, S.; Yang, S.; Tu, J. Enlightenment of Power Sales Side Market Liberalization in France. South. Power Syst. Technol. 2015, 9, 9–12. [Google Scholar]
- Charles, V.; Aparicio, J.; Zhu, J. The curse of dimensionality of decision-making units: A simple approach to increase the discriminatory power of data envelopment analysis. Eur. J. Oper. Res. 2019, 279, 929–940. [Google Scholar] [CrossRef]
- Rezaee, M.J.; Dadkhah, M. A hybrid approach based on inverse neural network to determine optimal level of energy consumption in electrical power generation. Comput. Ind. Eng. 2019, 134, 52–63. [Google Scholar] [CrossRef]
- Kottas, A.T.; Bozoudis, M.N.; Madas, M.A. Turbofan aero-engine efficiency evaluation: An integrated approach using VSBM two-stage network DEA. Omega 2020, 92, 102167. [Google Scholar] [CrossRef]
- Ren, J.; Li, S. Performance Evaluation of Planting Insurance Premium Subsidies in China-Based on the dynamic DEA and the three stage DEA. In Proceedings of the 7th Annual Meeting of Risk Analysis Council of China Association for Disaster Prevention (RAC-2016), Changsha, China, 4–6 November 2016; pp. 583–588. [Google Scholar]
- Sueyoshi, T.; Yuan, Y. Returns to damage under undesirable congestion and damages to return under desirable congestion measured by DEA environmental assessment with multiplier restriction: Economic and energy planning for social sustainability in China. Energy Econ. 2016, 56, 288–309. [Google Scholar] [CrossRef]
- Vlontzos, G.; Niavis, S.; Manos, B. A DEA approach for estimating the agricultural energy and environmental efficiency of EU countries. Renew. Sustain. Energy Rev. 2014, 40, 91–96. [Google Scholar] [CrossRef]
- Ignatius, J.; Ghasemi, M.-R.; Zhang, F.; Emrouznejad, A.; Hatami-Marbini, A. Carbon efficiency evaluation: An analytical framework using fuzzy DEA. Eur. J. Oper. Res. 2016, 253, 428–440. [Google Scholar] [CrossRef]
- Yang, J.; Yang, C.; Wang, X.; Cheng, M.; Shang, J. Efficiency Measurement and Factor Analysis of China’s Solar Photovoltaic Power Generation Considering Regional Differences Based on a FAHP–DEA Model. Energies 2020, 13, 1936. [Google Scholar] [CrossRef] [Green Version]
- Sun, J.; Ruze, N.; Zhang, J.; Zhao, H.; Shen, B. Evaluating the investment efficiency of China’s provincial power grid enterprises under new electricity market reform: Empirical evidence based on three-stage DEA model. Energies 2019, 12, 3524. [Google Scholar] [CrossRef] [Green Version]
- Xin-gang, Z.; Zhen, W. The technical efficiency of China’s wind power list enterprises: An estimation based on DEA method and micro-data. Renew. Energy 2019, 133, 470–479. [Google Scholar] [CrossRef]
- Wu, J.; Xia, P.; Zhu, Q.; Chu, J. Measuring environmental efficiency of thermoelectric power plants: A common equilibrium efficient frontier DEA approach with fixed-sum undesirable output. Ann. Oper. Res. 2019, 275, 731–749. [Google Scholar] [CrossRef]
- Liu, J.; Li, H.; Bai, H.; Lu, W.; Yuan, L. Research on Operational Efficiency Evaluation of Provincial Power Grid Enterprise Based on DEA. IOP Conf. Ser. Mater. Sci. Eng. 2018, 452, 032117. [Google Scholar] [CrossRef]
- Sun, H.; Tariq, G.; Chen, H.; Zhu, J.; Liu, Y.; Wu, C. Allocation of carbon emission quotas to Chinese power enterprises. Energy Procedia 2018, 152, 115–124. [Google Scholar] [CrossRef]
- Zhao, Q.; Zhang, C.; Dai, Q.; Liang, H. A slack-based DEA method for the performance evaluation and improvement of ultra-high voltage projects. Procedia Comput. Sci. 2018, 139, 236–241. [Google Scholar] [CrossRef]
- Jin, Y.; Yang, F.; Liu, J. Research on PM2. 5 emission reduction path of China‘s electric power industry based on DEA model. Proc. IOP Conf. Ser. Earth Environ. Sci. 2018, 121, 032028. [Google Scholar] [CrossRef] [Green Version]
- Zhang, J.; Li, Y. Research on the Efficiency of Beijing Tianjin Hebei Logistics Industry Based on Three Stage DEA Model. Proc. IOP Conf. Ser. Earth Environ. Sci. 2021, 791, 012071. [Google Scholar] [CrossRef]
- He, Q.; Tian, C.; Gao, K. Analysis on the Environmental Governance Efficiency of Local Governments in China and Its Influencing Factors. Int. J. Econ. Financ. Manag. Sci. 2020, 8, 9. [Google Scholar] [CrossRef]
- Li, C.; Pan, K. Research on financing efficiency of big data industry based on three stage DEA-Taking Guizhou Province as an example. In Proceedings of the 2nd International Forum on Management, Education and Information Technology Application (IFMEITA 2017), Shenzhen, China, 16–17 October 2017; pp. 438–442. [Google Scholar]
- Huang, D.; Dong, Y.; Liu, B.; Zhao, B. Regional energy efficiency analysis in China based on three-stage DEA model. Resour. Sci. 2012, 34, 688–695. [Google Scholar]
- Jiang, H.; Zhao, B. Measurement and deconstruction of regional energy efficiency in China under carbon emission constraints: Based on three-stage DEA method. Price Theory Pract. 2015, 37, 103–105. [Google Scholar] [CrossRef]
- Xu, Z.; Lv, B.; Dai, Y. Evaluation of regional energy efficiency in China based on three-stage DEA model. China Min. 2013, 22, 44–48. [Google Scholar]
- Xiang, Z.; Chen, X.; Lian, Y. Quantifying the vulnerability of surface water environment in humid areas base on DEA method. Water Resour. Manag. 2016, 30, 5101–5112. [Google Scholar] [CrossRef]
- Mai, Y.; Sun, F.; Shi, L.; Ma, Z. Evaluation of industrial water resources utilization efficiency in China based on DEA. Resour. Environ. Arid. Area 2014, 28, 42–47. [Google Scholar] [CrossRef]
Publisher’s Note: MDPI stays neutral with regard to jurisdictional claims in published maps and institutional affiliations. |
© 2022 by the authors. Licensee MDPI, Basel, Switzerland. This article is an open access article distributed under the terms and conditions of the Creative Commons Attribution (CC BY) license (https://creativecommons.org/licenses/by/4.0/).