Article

Improving the Material and Financial Circularity of the Plastic Packaging Value Chain in The Netherlands: Challenges, Opportunities, and Implications

by
Salih Çevikarslan
1,2,*,
Carsten Gelhard
1 and
Jörg Henseler
1,3
1
Chair of Product-Market Relations, Department of Design, Production and Management, University of Twente, 7522 NB Enschede, The Netherlands
2
Erasmus University College, Erasmus University Rotterdam, 3025 Rotterdam, The Netherlands
3
Nova Information Management School, Universidade Nova de Lisboa, Campus de Campolide, 1070-312 Lisbon, Portugal
*
Author to whom correspondence should be addressed.
Sustainability 2022, 14(12), 7404; https://doi.org/10.3390/su14127404
Submission received: 27 March 2022 / Revised: 6 June 2022 / Accepted: 9 June 2022 / Published: 16 June 2022

Abstract

:
This article outlines a bespoke process for uncovering crucial economic and social considerations in the quest to convert the Dutch plastic packaging system from a linear to a circular economy. Using a serious game tool as part of a qualitative research method, we developed, prioritized, and elaborated on various conceivable and effective policies that would create a circular plastic packaging value chain in The Netherlands. A key aim of this study was to fill a gap in the predominantly technical-focused research in this area by offering a holistic overview of how a circular economy impacts key industry stakeholders and their business models, as well as highlight system-level consequences of these policies, were they to be adopted. We used simulation and statistical analyses to explore the effects of these policies on the material and financial circularity of the Dutch plastic packaging value chain. The results reflect that one of the policies—establishing a center of excellence —would benefit the Dutch plastic packaging system the most.

1. Introduction

Plastic use is expected to quadruple by 2050, and demand for plastic packaging is thus also expected to increase at a similar substantial rate [1]. With sustainability at the forefront of environmental agendas, and the European Union (EU) imposing strict measures to extend the product life of plastic packaging, it is a crucial time to review how this industry in The Netherlands can transform from a linear to a circular economy.
In the wider context, the linear ‘take-make-dispose’ model of production is on the way out. This model of extracting resources or manufacturing materials, and turning them into product, which is then discarded as waste by the consumer, has long been viewed as detrimental to the environment. In its place, the EU and the United Nations (UN) are calling for the circular economy model to become the standard around the globe. Within the context of this study, the circular economy is defined as a concept to advance the sustainability and competitiveness of value chains, decoupling economic growth from resource consumption and waste generation [2]. This model promotes a circular ‘make-use-return’ of resources so that there is much less waste in what we consume and produce. By extending the forward value chain through a reverse value chain, the circular economy eventually replaces the assumption of disposal with the assumption of extended usability.
On the surface, these circular economic transformations will have significant positive implications for plastic packaging systems. For example, while the linear packaging system causes eye-watering amounts of material, energy, and labor to be wasted, the circular packaging system could abolish this waste by optimizing the systems of reduce, reuse, remake, and recycle.
Recycling can be defined as retaining secondary raw materials from a post-consumer product. Plastics recycling can be done through mechanical processes, which is the most common method [3], or chemical processes [4]. Mechanical recycling refers to operations that aim to recover plastics waste via mechanical processes such as sorting, washing, grinding, and regranulation [5]. The efficiency of the system depends on the technology and there is a significant loss in the process [6]. Additionally, the recycled plastics usually have lower quality and functionality than virgin materials, because the recycling process degrades and contaminates plastic compounds. This is called downcycling [7,8]. That is why most mechanically recycled plastics can only be used in lower-value applications such as pipes and benches [6]. Mechanical recycling is however the most widely used method of recycling as it is economically viable for many different plastic types [9]. Still, the cost of mechanically recycled plastics is often similar to or slightly higher than that of virgin plastics [10]. In the case of upcyling of plastic waste, the materials are transformed into new materials or products of higher quality. They might have higher artistic or environmental value. Chemical processes for recycling transform large plastic polymers into smaller monomers and oligomers which can be used as the building blocks of virgin plastics. Such chemical processes are methanolysis, hydrolysis, solvolysis, glycolysis, and pyrolysis [5]. The polymers are heated to high temperatures with catalysts, such as water or methanol [7]. One route for chemical recycling involves controlled biodegradation through which many polyesters can be efficiently transformed into monomers by enzymic hydrolysis [10]. Chemical recycling can produce higher quality recyclates than mechanical recycling. However, it is more energy-intensive and hence not yet economically feasible on a large scale [7,10,11,12]. This situation may change in time as fossil fuel resources become scarcer, and the costs of non-renewable and recyclable plastics are recognized [10]. At this point, we would like to emphasize that there is some persistent and promising research on recycling technologies and hence some limitations of the recycling methods that we discussed in this paper may no longer apply in the near future.
However, there is currently a mismatch between the technical qualities of recycled plastics and the qualities demanded by the plastic packaging industry, which is a cited obstacle to the transition towards a circular economy [13]. Fortunately, there are solutions. For example, the packaging industry could enhance the polymeric purity of recycled plastics and their applicability via design-for-recycling measures [14]. Or the net plastic packaging recycling rates could be increased through more intensive collection and mechanical recovery of plastics from mixed municipal solid residual waste (MSRW) [15,16]. In addition, a purer form of recycled plastic could be generated using improved separation technologies at sorting and recycling facilities [17,18].
With these potential solutions making the notion of higher circularity in the Dutch plastic packaging system highly possible, this study will look at the implications this would have on the key industry stakeholders: the plastic packaging producer, the brand owner that uses plastic packaging, the waste collection company, the post-separation company, the plastic waste sorting company, the recycling company, and the incinerator company.
Our key aim is to look at solutions to minimize value loss due to post-consumer plastic packaging waste (PPW), so that a circular economic structure would be viable for all PPW stakeholders. However, rather than focusing on the technical perspective, we will look at the virtually undiscussed socio-economic impacts a circular economy would have on these stakeholders, which in turn will provide a holistic overview of how such a move would affect the Dutch plastic packaging system as a whole. In this regard, the research questions of this study are:
  • What are the most feasible and efficient policies that would create a more circular plastic packaging value chain in The Netherlands?
  • What are the effects of these policies on the business models of key industry stakeholders and the material and financial circularity of the Dutch plastic packaging value chain?
To answer these research questions, we researched the current plastic packaging value chain in The Netherlands, analysing the status quo through a literature review. Then we organized a focus group session with experts in the industry to formulate the most feasible and effective policies to transform this chain into a circular economy. Afterwards, we developed a ′serious game′ tool to facilitate an interactive workshop with industry stakeholders to simulate alternative policy adoptions in a systematic structure. This workshop′s focus was on business model changes induced by the policy interventions discussed in the focus group, potential value losses or gains, and their contribution to sustainable development. This workshop enabled us to collect the required behavioral and technical data to develop a data-driven system dynamics model of the Dutch plastic packaging value chain.
There is limited research on the circular economics of plastics in The Netherlands, with the majority of these studies concentrating solely on the technical aspects of this transition [4]. This paper aims to fill this gap with a holistic approach that examines socio-economic interactions between the stakeholders of the Dutch plastic packaging value chain. We explore how best we can intervene in the existing system to improve its sustainability.
The following sections review the current literature on the topic, including institutional structures, general political regulations and targets, and the organization of plastic packaging waste (PPW) treatment in The Netherlands, outline the research methodology and data collection process, and end with results, analyses of findings, and conclusions.

2. Literature Review

2.1. Global Plastic Packaging Industry

Plastics are indispensable to our economies because of their superior properties and low cost. They are cheap, versatile, multifunctional, and lightweight and they can easily replace other scarce materials which might have higher environmental footprints [11]. However, plastics also cause some environmental damage, such as plastic soup and CO2 emission, which contributes to climate change [19]. Their use has increased twenty-fold in the last 50 years and is expected to double again in the next 20 years and almost quadruple by 2050. Today nearly every industry, and hence consumer, use plastics packaging, which is plastics′ largest application, representing 26% of the total volume [20]. They constitute around 60% of plastic waste because of the short shelf-life of most packaging plastics [18].
The share of plastics in global packaging volumes has increased from 17% to 25% between 2000 and 2015. This corresponds to a rapid growth in the global plastic packaging market of 5% annually [20]. There is a long-term stable demand for plastics packaging and there is no expectation of a large-scale substitution of this material. Short term demand is determined by gross domestic product (GDP); and higher production and consumption levels lead to more packaging in the market [21].
The size of the global plastic packaging market was estimated to be worth USD 265.2 billion in 2020 [22] and the mechanical recycling rate of plastic waste was estimated to be between 14% and 18% [23]. Plastic waste that cannot be recycled is incinerated for energy recovery (24%), or is disposed of in landfill or the natural environment (58–62%) [24]. Plastics have the highest value in packaging industry whereas paper/board is the most used material. The food and beverages industry is the heaviest user of plastics packaging (~60%) [21].
Online shopping and the rise of the delivery industry, consumption of highly processed foods in smaller portions, and ready-to-go packaging are expected to lead to an increased demand for plastics packaging in the near future [25,26]. The surge in online retail has also increased the demand for secondary and tertiary packaging. With an increasing global population and the growing demand for packaging, moving from a linear to a circular economy in the plastic packaging industry is crucial for sustainability and the environment [27].

2.2. Plastic Packaging Industry in The Netherlands

2.2.1. Current Situation

The Dutch plastics packaging market forms only a small part of the economy in The Netherlands, with most of the material produced by small to medium-sized enterprises (SMEs) for national and neighboring markets. Only a few producers have a revenue over EUR 50 million per year [21]. In 2017, figures show there was around 512 kilotons (kt) of plastic packaging on the market in The Netherlands [28]. This corresponds to an annual consumption of 30 kg of plastic packaging per capita scored in The Netherlands, which is very similar to the European average [29].
In the field of plastic recycling, The Netherlands ranks in the top five in Europe [29], but the net packaging recycling rate can still be improved [18]. Statistics show Dutch plastic consumption is continuously rising with some of its plastic waste transported to other countries and ending up in their landfill [30,31]. Additionally, nearly 50% of end-of-life plastics in The Netherlands are incinerated to generate energy [15]. Studies have shown that the Dutch plastics recycling market is fragmented [21] and recycling of household plastics is deemed too expensive [32]. Saving one ton of CO2 through plastic recycling rather than incineration costs approximately EUR 180 [33]. However, a few companies benefit from the economies of scale, such as SUEZ. SUEZ has a plastics recycling facility in Rotterdam treating 80,000 tons per year. It processes 70% of all source-separated plastic packaging in The Netherlands [20].
Various life cycle assessments show that recycling plastic into new products is better for the environment than incineration to turn the waste into energy [33]. This realisation has manifested in a recent sharp rise in the collection and recycling of plastic waste in The Netherlands. Until 2007, only plastic from the Dutch deposit system (where householders can return plastic bottles in exchange for a small refund) and industrial waste was recycled in The Netherlands, and only small amounts of plastics from households were collected and recycled. This has changed with the development of the collection system Plastic Heroes. Plastic Heroes is a Dutch national program for the collection and recycling of plastic packaging. The aim was to increase the levels of high-quality recycling, avoid landfilling and incineration, and reduce litter in the streets. The cities choose between the three collection options offered by Plastic Heroes with respect to their preferences and constraints and they receive financial compensation for this collection. This program is different from other plastic recycling schemes because it is financed by the packaging industry. This incentivises the manufacturers to optimise plastic packaging to avoid paying taxes according to the weight of packages introduced to the market. The source separation of plastic packaging waste is mainly organized through the Plastic Heroes system, which was set up by Nedvang [32,34].
In recent years, the collection of plastic packaging waste from households increased sharply. Statistics show that, in 2014, there was a total of 283 kton of plastic waste recycled, 162 kton from households (31 kton after separation), which is a sharp increase from 25.2 kton in 2009. The remaining amount, 121 kt, came from industries (including 26.5 kt from the Dutch plastic bottles deposit system). This substantial increase is expected to continue in the coming years [29].
To look at the bigger picture, Picuno et al. (2021) comparatively analysed three studies describing the PPW value chain in Austria (reference year 2013), Germany (reference year 2017), and The Netherlands (reference year 2017). In a relatively comparable product market, the three countries were found to have different management systems (e.g., separate systems of collection and treatment of residual waste) with different national strategies to achieve the circular economy goals. Austria, Germany and The Netherlands have recycling rates (washed milled goods over the total mass of PPW at the output of the recycling process) of 23%, 43% and 30%, respectively. In all three countries, there is a landfill ban for plastic waste. The study shows that the three countries have developed recycling economies for their PPW, with different recycling rates and qualities of recycled plastics. These differences are related to recycling targets and collection options.

2.2.2. Institutional Structure, General Political Regulations and Targets

The EU recently introduced stricter legislation to improve plastic waste management, and to extend the product life of plastic packaging via re-use and recycling [35]. In 2018, the European Commission launched the European Strategy for Plastics in a Circular Economy, containing ambitious recycling targets [36]. The strategy outlines that plastic packaging should have a 50% recycling rate by 2025 and 55% by 2030 [37]. According to the Dutch packaging organisation, Nedvang, the recycling target for plastics is 52% for 2022 [29]. The Circular Economy Action Plan by the Dutch government aims to become 100% circular by 2050 and regards plastics as a strategic sector to make this happen [4].
The Netherlands has made efforts to standardise and thus create cohesion within the PPW system, as well as promote an industry-wide circular economy. According to The Netherlands Institute for Sustainable Packaging (Kennisinstituut Duurzame Verpakkingen (KIDV)), packaging should be designed to prevent waste and thus manufactured to allow reuse and recovery [29]. Additionally, the Dutch framework agreement on packaging (FAP) 2013–2022 states that the national government, the packaging industry, and the association of Dutch municipalities (Vereniging van Nederlandse Gemeenten (VNG)) have agreed to recycle and re-use more packaging material in the future to improve the circularity of the packaging chain [38]. KIDV has a specific position in the chain as the representative of industries, the national government, municipalities, and consumers. Environmental associations and scientists also play a prominent role. Industry representatives, municipalities, and the national government sit at the board of KIDV, which gives the institute an independent position. [27].
The aforementioned Nedvang plays an important role in the national PPW system. Officially approved in 2008 as the body to represent the entire Dutch packaging sector, it is the key driver for stimulating the collection and recycling of all packaging waste, including PPW. It supports producers, monitors performance, and directs the sorting and reuse of collected PPW, as well as runs communication campaigns. Furthermore, as well as representing industry, Nedvang liaises with VNG, municipalities, and national government [39].
However, despite these efforts to create national cohesion and circularity, the Dutch PPW system remains disjointed. This is primarily because municipalities are responsible for the collection of all types of household waste and this has created complexity in the Dutch recycling system [40]. When the separate collection of PPW became mandatory in The Netherlands in 2009, some municipalities chose a central sorting system to recover plastics from MSRW, while others established a new, separate collection system. Currently, both systems coexist because urban and rural regions differ greatly in their approach and attitude to recycling. One study has shown that urban regions, for example, have limited success with separate plastics collection [40,41].
The recycling system for plastic packaging is funded from different sources. Producers and importers of packaged products are legally responsible for the prevention, collection and recycling of packaging waste in The Netherlands. If they bring more than 50 tons of packaging per year to the market, they register this and pay a waste management contribution tax to the Dutch packaging waste fund (Afvalfonds Verpakkingen) per kilogram of packaging. This is not only for plastics, but also other packaging materials such as glass, paper, cardboard, metal, and drink cartons. The rate set by this fund varies depending on the material, and the tax for plastics was EUR 700 per ton in 2022 [29,41].
Afvalfonds is responsible for establishing and maintaining a waste management system to minimize the packaging waste. It works with municipalities and other parties to refund the costs of collecting and processing (separated) waste packaging. The system of recycling is mostly organized by the municipalities. They have controlled the collection, sorting and ′marketing′ of plastic packaging waste that they collect from households since 1 January 2015. To carry out these tasks the municipalities are compensated by an amount of EUR 800 by the packaging waste fund for each tonne of recycled plastic. Two-thirds of this sum covers collection costs and the rest covers the costs of transport, sorting and other expenses. This incentivizes municipalities to choose recycling over incinerating. Moreover, if the latter remains the chosen option, the municipality not only misses out on the compensation but also has to pay incineration fees [29]. Afvalfonds also pays the processing fees at recycling facilities when this is required [6] and establishes the rates and collects contributions from producers and importers [41].
Afvalfonds Verpakkingen also monitors and reports on the usage, collection, and re-use of packaging materials. The monitoring process and reporting by this packaging waste fund is assessed by an independent committee (Commissie Toezicht Monitoring Verpakkingen). Afvalfonds Verpakkingen delivers the audited information to the Human Environment and Transport Inspectorate (Inspectie Leefomgeving en Transport (ILT)), a government agency that assesses various parties to see whether they comply with laws and regulations, officially registers their waste, and decides what happens to the waste. The ILT makes the final assessment of the CTMV′s monitoring [29].
To ensure that the parties are professional, and the supply of recycled plastic is of good quality, there are certification and quality standards established by the industry of waste companies. Nedvang developed a guideline in 2011 for the waste management companies: the certification directive for waste packaging (Certificeringsrichtlijn Verpakkingsafval (CRV)). CRV requires and checks whether waste companies report reliable data, which in turn enables Nedvang to collect more accurate statistics on recycling rates. The directive also stipulates how the administrative organization and internal control of a company should be set up. Plastic collectors and sorters have to prove that they meet the administrative requirements of Nedvang to be certified with a CRV. The provisional and final certification of companies is issued by Nedvang. Waste management companies that already have a quality system implemented (ISO 9001, ISO 14001 or ERK OPK) do not need to implement CRV [15].

2.2.3. The Organization of PPW Treatment in The Netherlands

From an operational perspective, the Dutch plastic packaging chain is a converging network. The plastic packaging waste collected from about 7.7 million households within 347 municipalities is transferred to 5 sorting and about 20–30 mechanical recycling facilities [42]. The principle of ‘polluter pays′ applies; the costs of collection and recovery are the responsibility of the disposer, or the companies that discard the plastic. Non-packaging plastics waste, such as toys and furniture, is not subject to fees, nor is industrial plastic packaging waste. This is because these types of waste mainly involve larger amounts of one type of plastic, making recycling in this sector more economically viable. The cost of the deposit return scheme is paid by the retailers, the manufacturers, and importers [29].
In The Netherlands, plastic packaging waste is collected for recycling in three ways [29]:
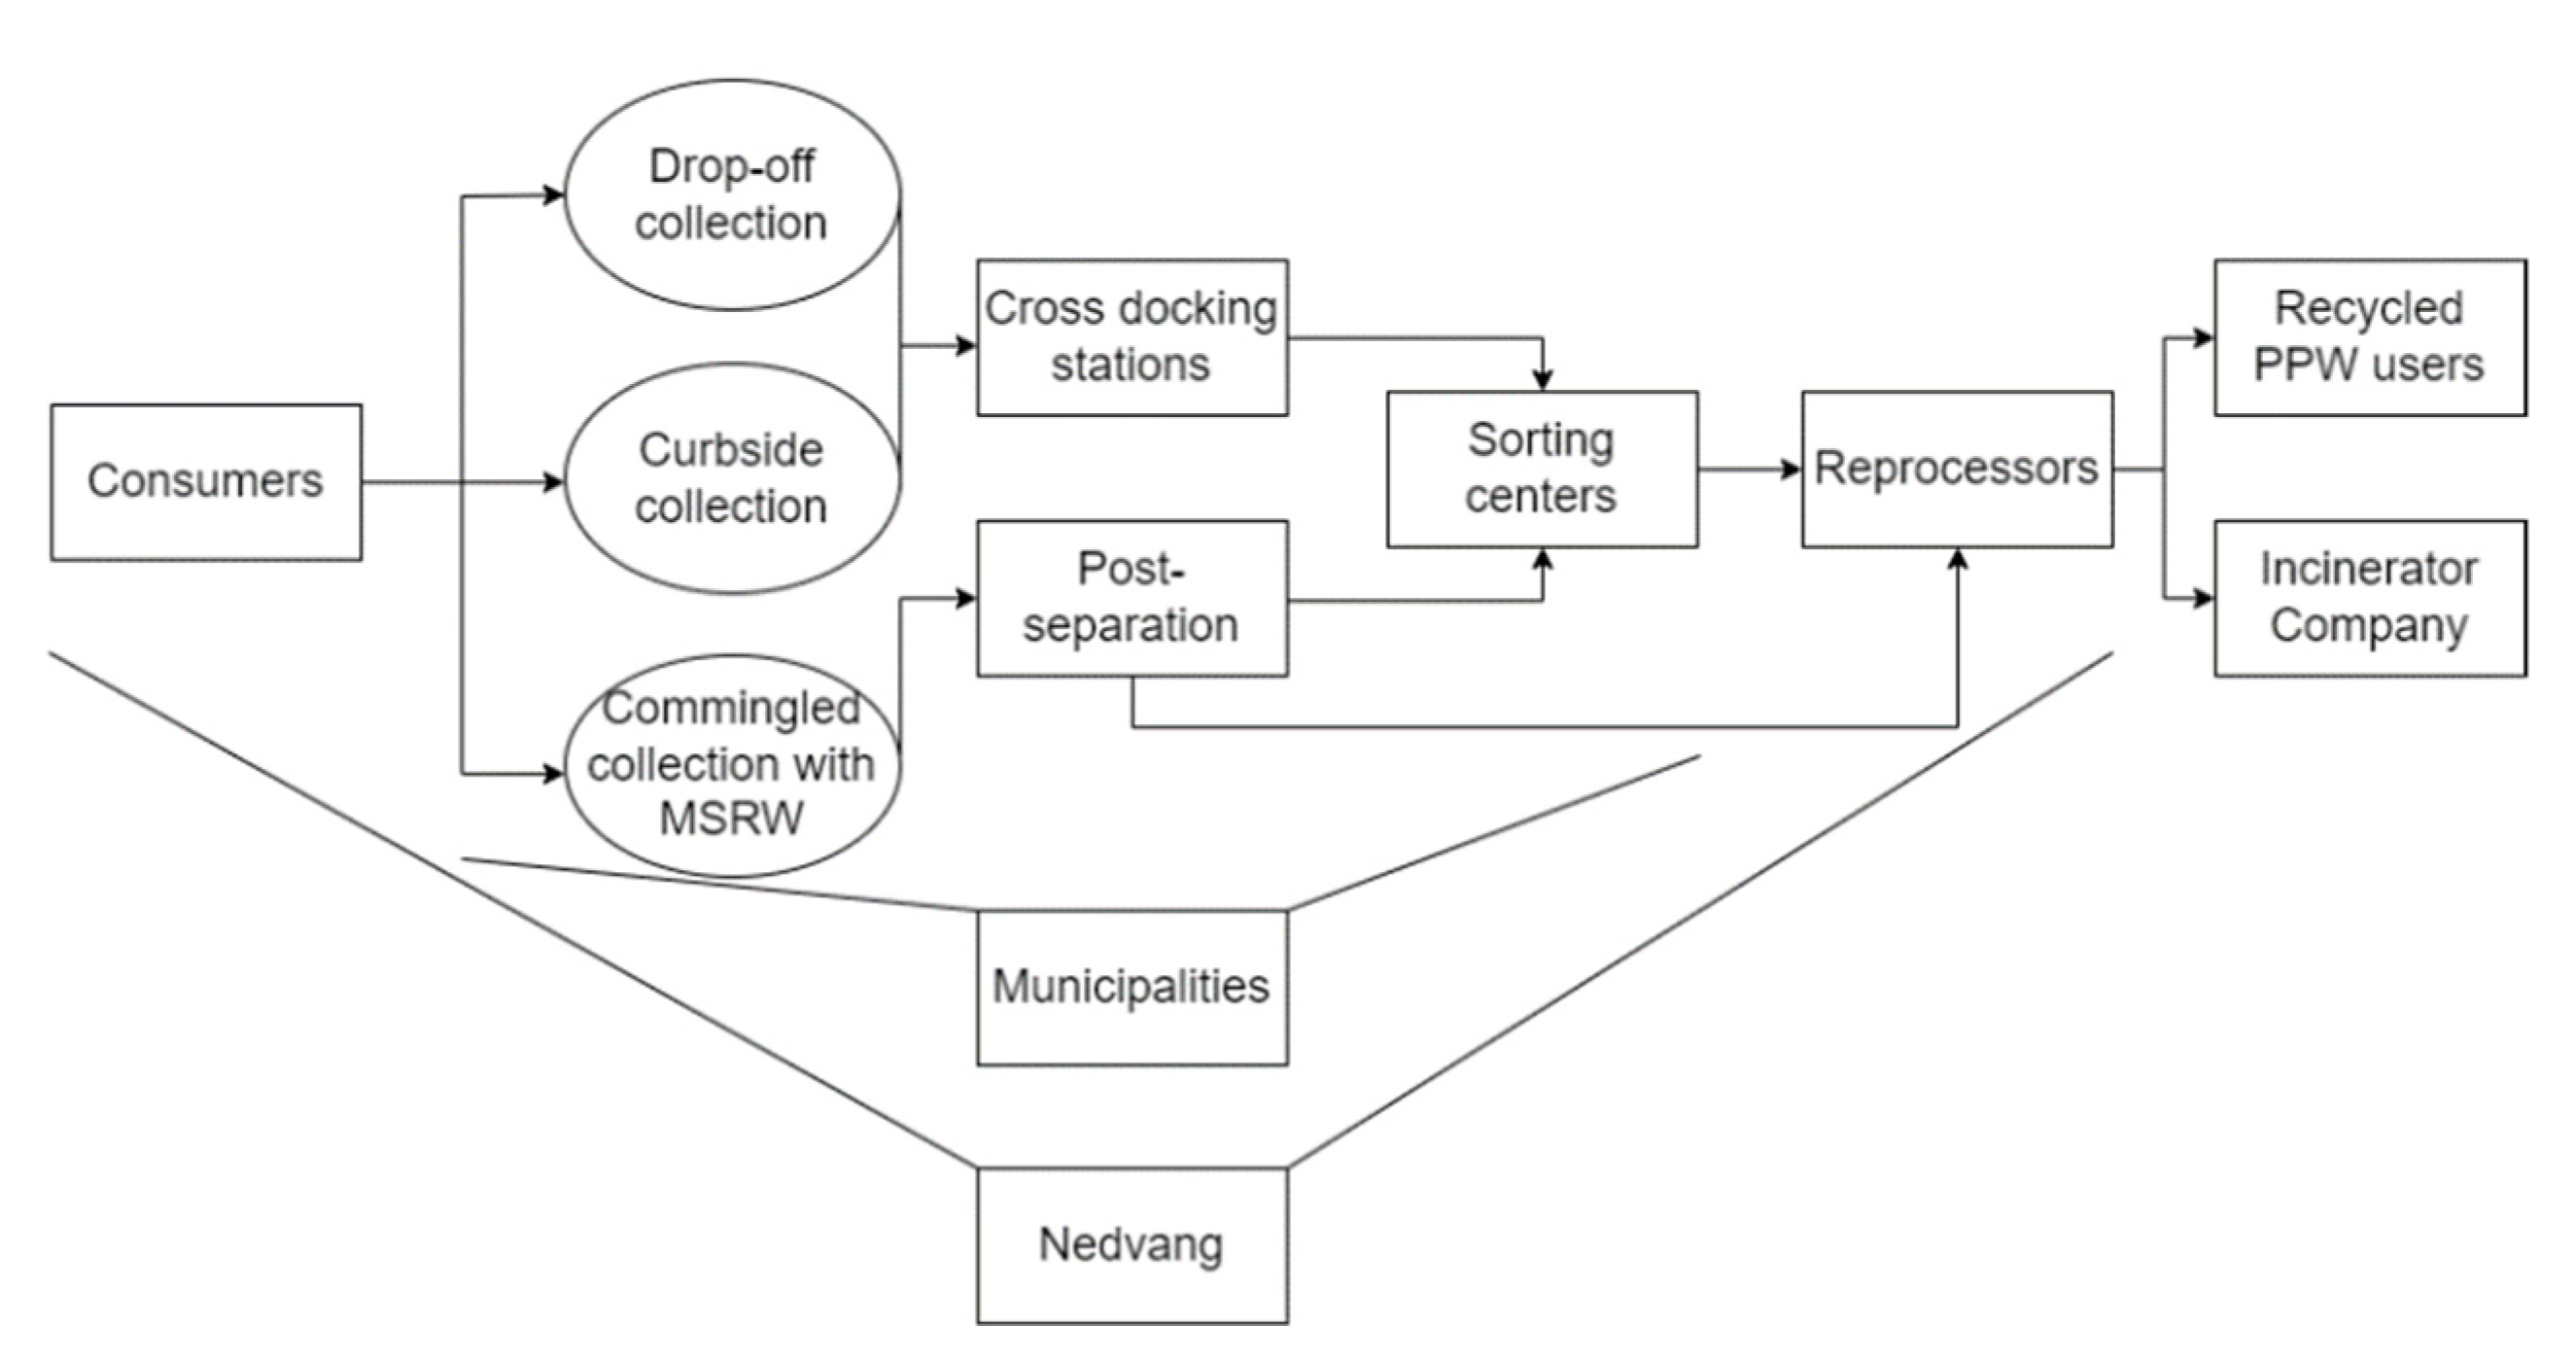
  • Household waste: Plastic packaging from households is separated in two ways—source separation and post-separation. With the former, consumers separate plastics from other household waste themselves; in the latter, sorting centers use waste processors to separate plastics from the other types of waste using infrared and film-grabber techniques [43]. While post-separation facilities can collect more material than source separation, the difference between the amounts of produced milled goods and agglomerates that each system produces are small [40,44]. Household waste contains several types of plastic and is sorted into three pure polymeric fractions (i.e., PET bottles, PE and PP), two product types (i.e., PET trays and films) and one mixed plastics fraction [6].
  • Industrial waste: This type of waste can either be sorted or left unsorted before being sent to recycling facilities. Plastic waste from businesses is usually a mono-stream, which is a waste stream of just one type of plastic.
  • Deposit return scheme: By means of the aforementioned deposit return scheme, Dutch citizens are incentivized to recycle PET bottles (greater than 50 cl) for which there is a deposit obligation. In 2021, small PET bottles were also added to this system [45]. The deposit return scheme is treated and registered as post-industrial packaging waste [44]. A ‘return packaging′ body, Stichting Retourverpakking Nederland (SRN), is responsible for the majority of producers, importers and supermarkets returning, sorting, and processing these plastic bottles. Nedvang reviews data received from the SRN and performs trend analyses. Two supermarkets have their own system for returnable bottles.
There are channel choice and facility requirement differences between the source and post-separation collection systems. Source separation (88% of municipalities) is currently the preferred policy option over post-separation in The Netherlands [44]. However, due to recent research results on the higher quality of post-separated recyclate, the cost-effectiveness of the process, and considering recent technological improvements in separating machines, an increasing number of Dutch municipalities are making the transition to post-separation, such as Amsterdam and Utrecht [9]. There is a trade-off between source separation and post-separation, however. Separation at source reduces contamination of plastics, resulting in less non-plastic in plastic waste than from post-separation. Hence, recovered plastics from source-separation require less cleaning and drying before further treatments. On the other hand, post-separation has the higher separation rate because it is automated rather than reliant on householders. Moreover, since all the waste is dumped in the same bin, collection through post-separation requires fewer infrastructures (bins, trucks, etc.) [39].
Source-separated PPW is obtained either through curbside collection or waste drop-off. The former comprises a door-to-door collection of source-separated recyclable materials in either bags, containers or wheelie bins. For the latter option, householders bring source-separated plastics to a recycling facility themselves. There are above ground as well as underground collection containers in these centers, found in neighborhoods as well as near shopping centers and super markets [39]. The separate collection of PPW in wheelie bins is the main collection system in the rural areas, where the participation rates are as high as 100% [16]. Only the drop-off collection systems work in the urban regions of the western part of the country due to low participation and hence collection rates, and the collected material contains too much non-plastic [45].
The source-separated PPW—both drop-off and curbside—is transferred to cross docking stations, whereas PPW commingled with MSRW is sent to post-separation facilities. Rigid and flexible PPW, once separated from MSRW, are sent to sorting centers and reprocessors, respectively. The PPW is then sorted into the following fractions: PET, PE, PP, film and mixed plastics. The packaging value chain loses most of the material during this sorting stage because of contaminated waste feedstock [46]. Much of the cost of recycled plastics is also associated with sorting and cleaning the post-consumer feedstock [47]. The municipality and sorting company fees for their collection efforts and processing results, respectively, are based on quality standards. The sorted plastics are transferred to reprocessors for recycling. The rest ends up in incinerators. A schematic representation of the treatment of PPW in The Netherlands is given in Figure 1 below:

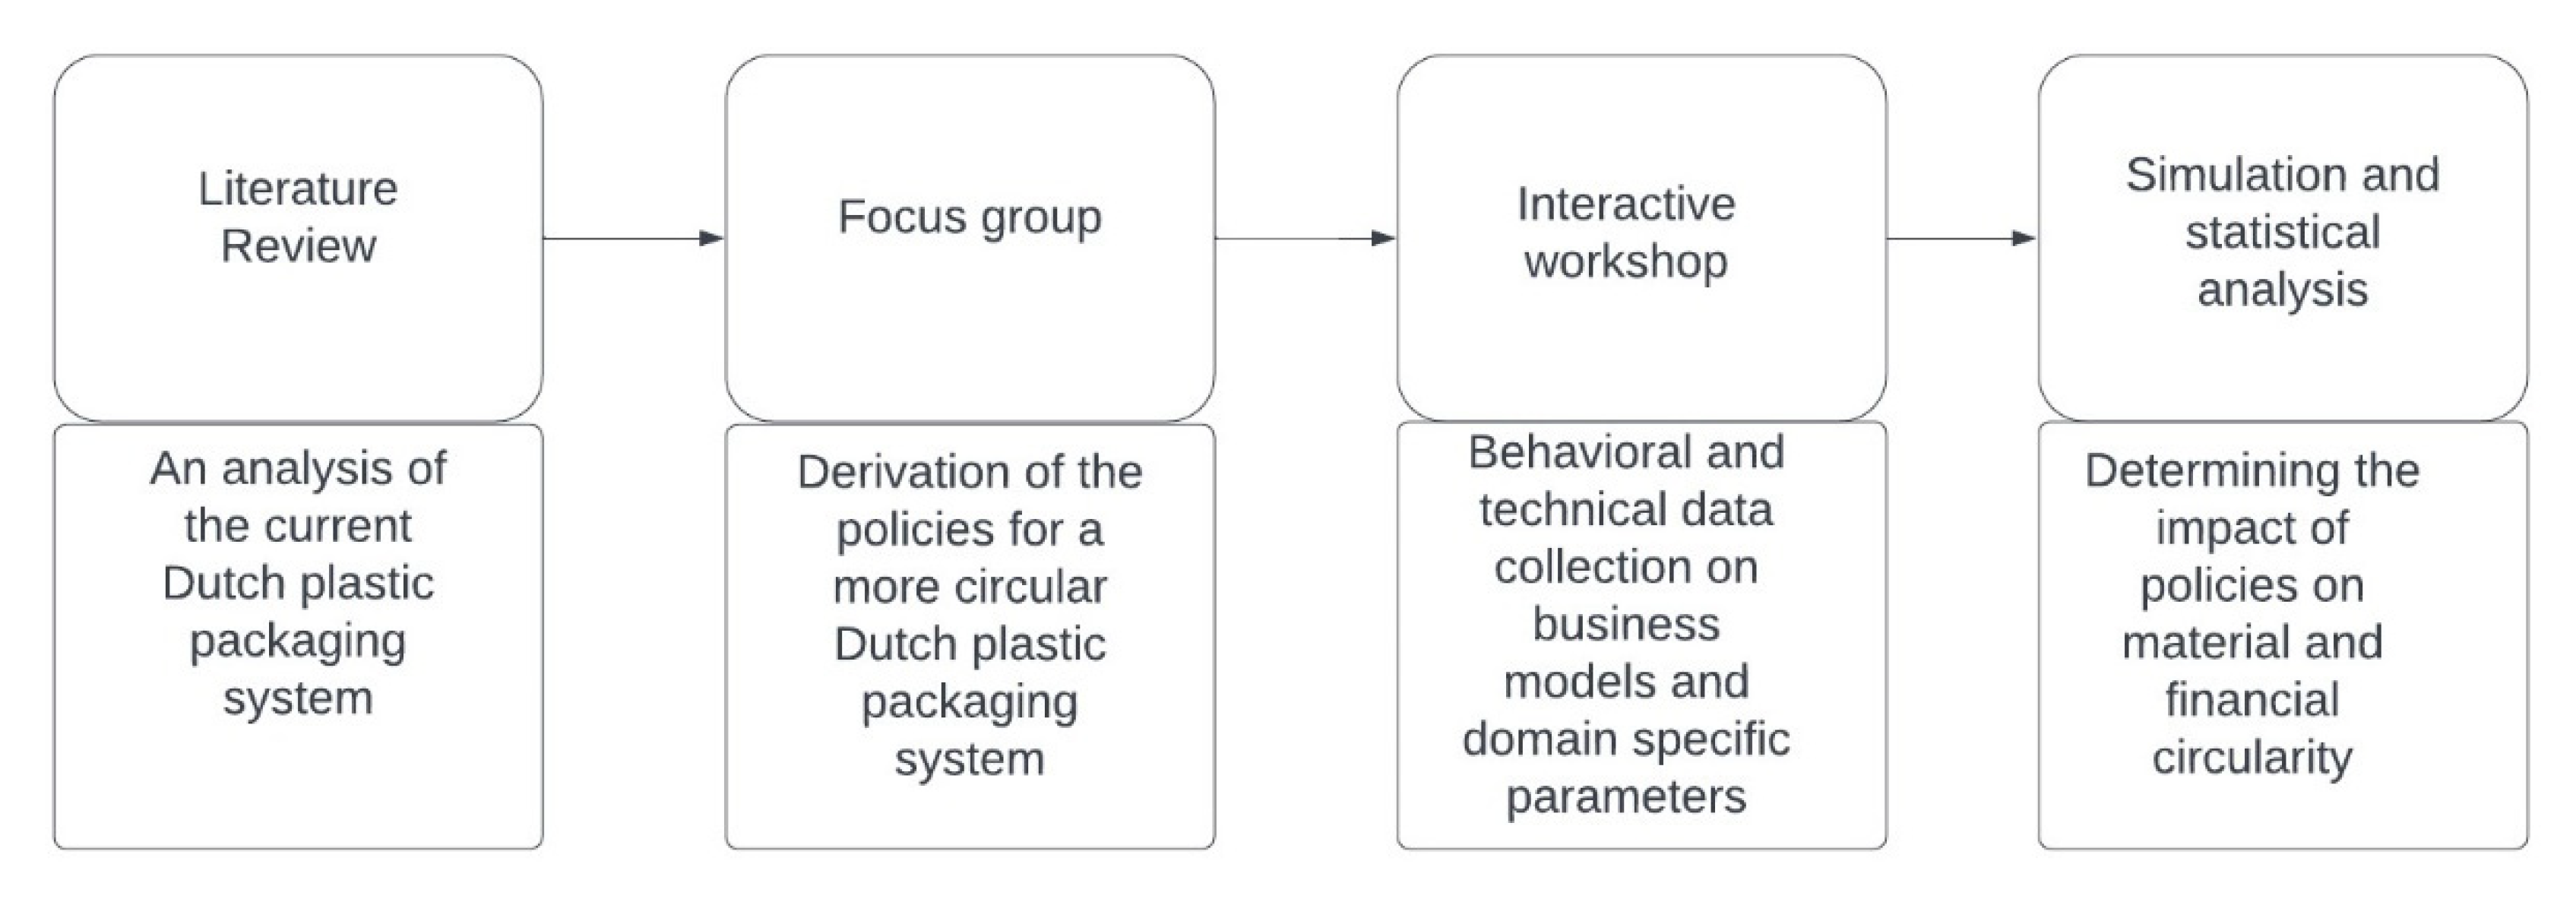
3. Data Collection and Research Method

3.1. Data Collection Phase I

Data collection phase I comprised a focus group session of two and a half hours featuring five experts from KIDV and an academic working in the field, all with several years of experience in the plastic packaging industry. They convened to determine the most feasible and efficient policies that would create a more circular plastic packaging value chain in The Netherlands. All session participants were well-prepared beforehand as they had been emailed the brief as well as a list of policies—all grouped under relevant categories—that were compiled following a comprehensive survey of current relevant literature. The experts were also requested to bring one idea from another industry as inspiration for creating circular economy policies for plastic packaging. The primary aim of these policies would be to act as exogenous interventions that would give plastic packaging system actors the necessary incentives to adapt their business models (detailed in Appendix A), which, in turn, would result in positive system-level outcomes. To achieve this, the session focused its policy development on systemic inducements with a high potential to minimize plastic package value loss, involving more than one actor group.
The session opened with an introduction to the value chain processes in plastic packaging; the participants were then invited to review the aforementioned list of existing policies to use as a framework. Divided into two groups, the six attendees were instructed to add new policy categories they believed were missing from the list, with at least one example for each category. The two groups were then reshuffled and asked again to add new policies to the already established categories, with a short description for each addition. The two policy lists created by the groups were then merged into a single list and presented to the participants, who individually graded each policy on its perceived feasibility and effectiveness in creating a circular Dutch plastic packaging economy. The three policies with the highest grades were then discussed, using generic questions to prompt debate. The policies were then worded in the clearest way possible to avoid any ambiguities when applied during the second phase of data collection.
The session concluded with an explanation of how these newly developed policies would be used as input for a second round of data collection and a computer-based simulation model. The policies created and developed during this session were:
  • Policy 1: Quadrupling the incineration fee;
  • Policy 2: Establishing a center of excellence that specifically supports SMEs in their research and development (R&D) efforts, the development of technical expertise (e.g., common labelling and chemical marking aligned with standardised separation and sorting systems), and access to state-of-the-art facilities for plastic packaging treatment;
  • Policy 3: The amount producers and importers of plastic packaged goods pay in waste management tax to Afvalfonds Verpakkingen is halved for recycled plastic packaging and doubled for non-recycled plastic packaging.

3.2. Data Collection Phase II

Data collection phase II entailed an interactive workshop of three hours including serious game elements to explore the effects of circular economy policies on the Dutch plastic packaging system that were developed during phase I. To simulate the processes of the plastic packaging value chain, highly experienced representatives from a plastic packaging producer, a brand owner using plastic packaging, a waste collection company, a post-separation facility, a waste sorting company, a recycling company, and an incineration facility attended the workshop to share their perspectives on their role in the value chain as well as backward and forward linkages (suppliers and customers). Both qualitative (business model questions) and quantitative (technical parameters, cost, and price levels) data were collected during this simulation exercise.
The phase II participants were provided with the policies developed during phase I in advance to prepare for the workshop. The aim of the game was to encourage discussion between the participants, facilitate a shared understanding of the simulated system, and see the effects of the introduced policies on the functioning of the system. This is an analog simulation game with playful and colorful aesthetics as design elements which adopted mechanics typical of board games [48]. Such simulation board games are used in the literature for communicating knowledge and explaining complex relationships on topics such as energy transition, business model innovation, sustainable development and the circular economy [47,49]. The game environment helped to break the ice and stimulate the participants to share their tacit knowledge. The gaming tools used were:
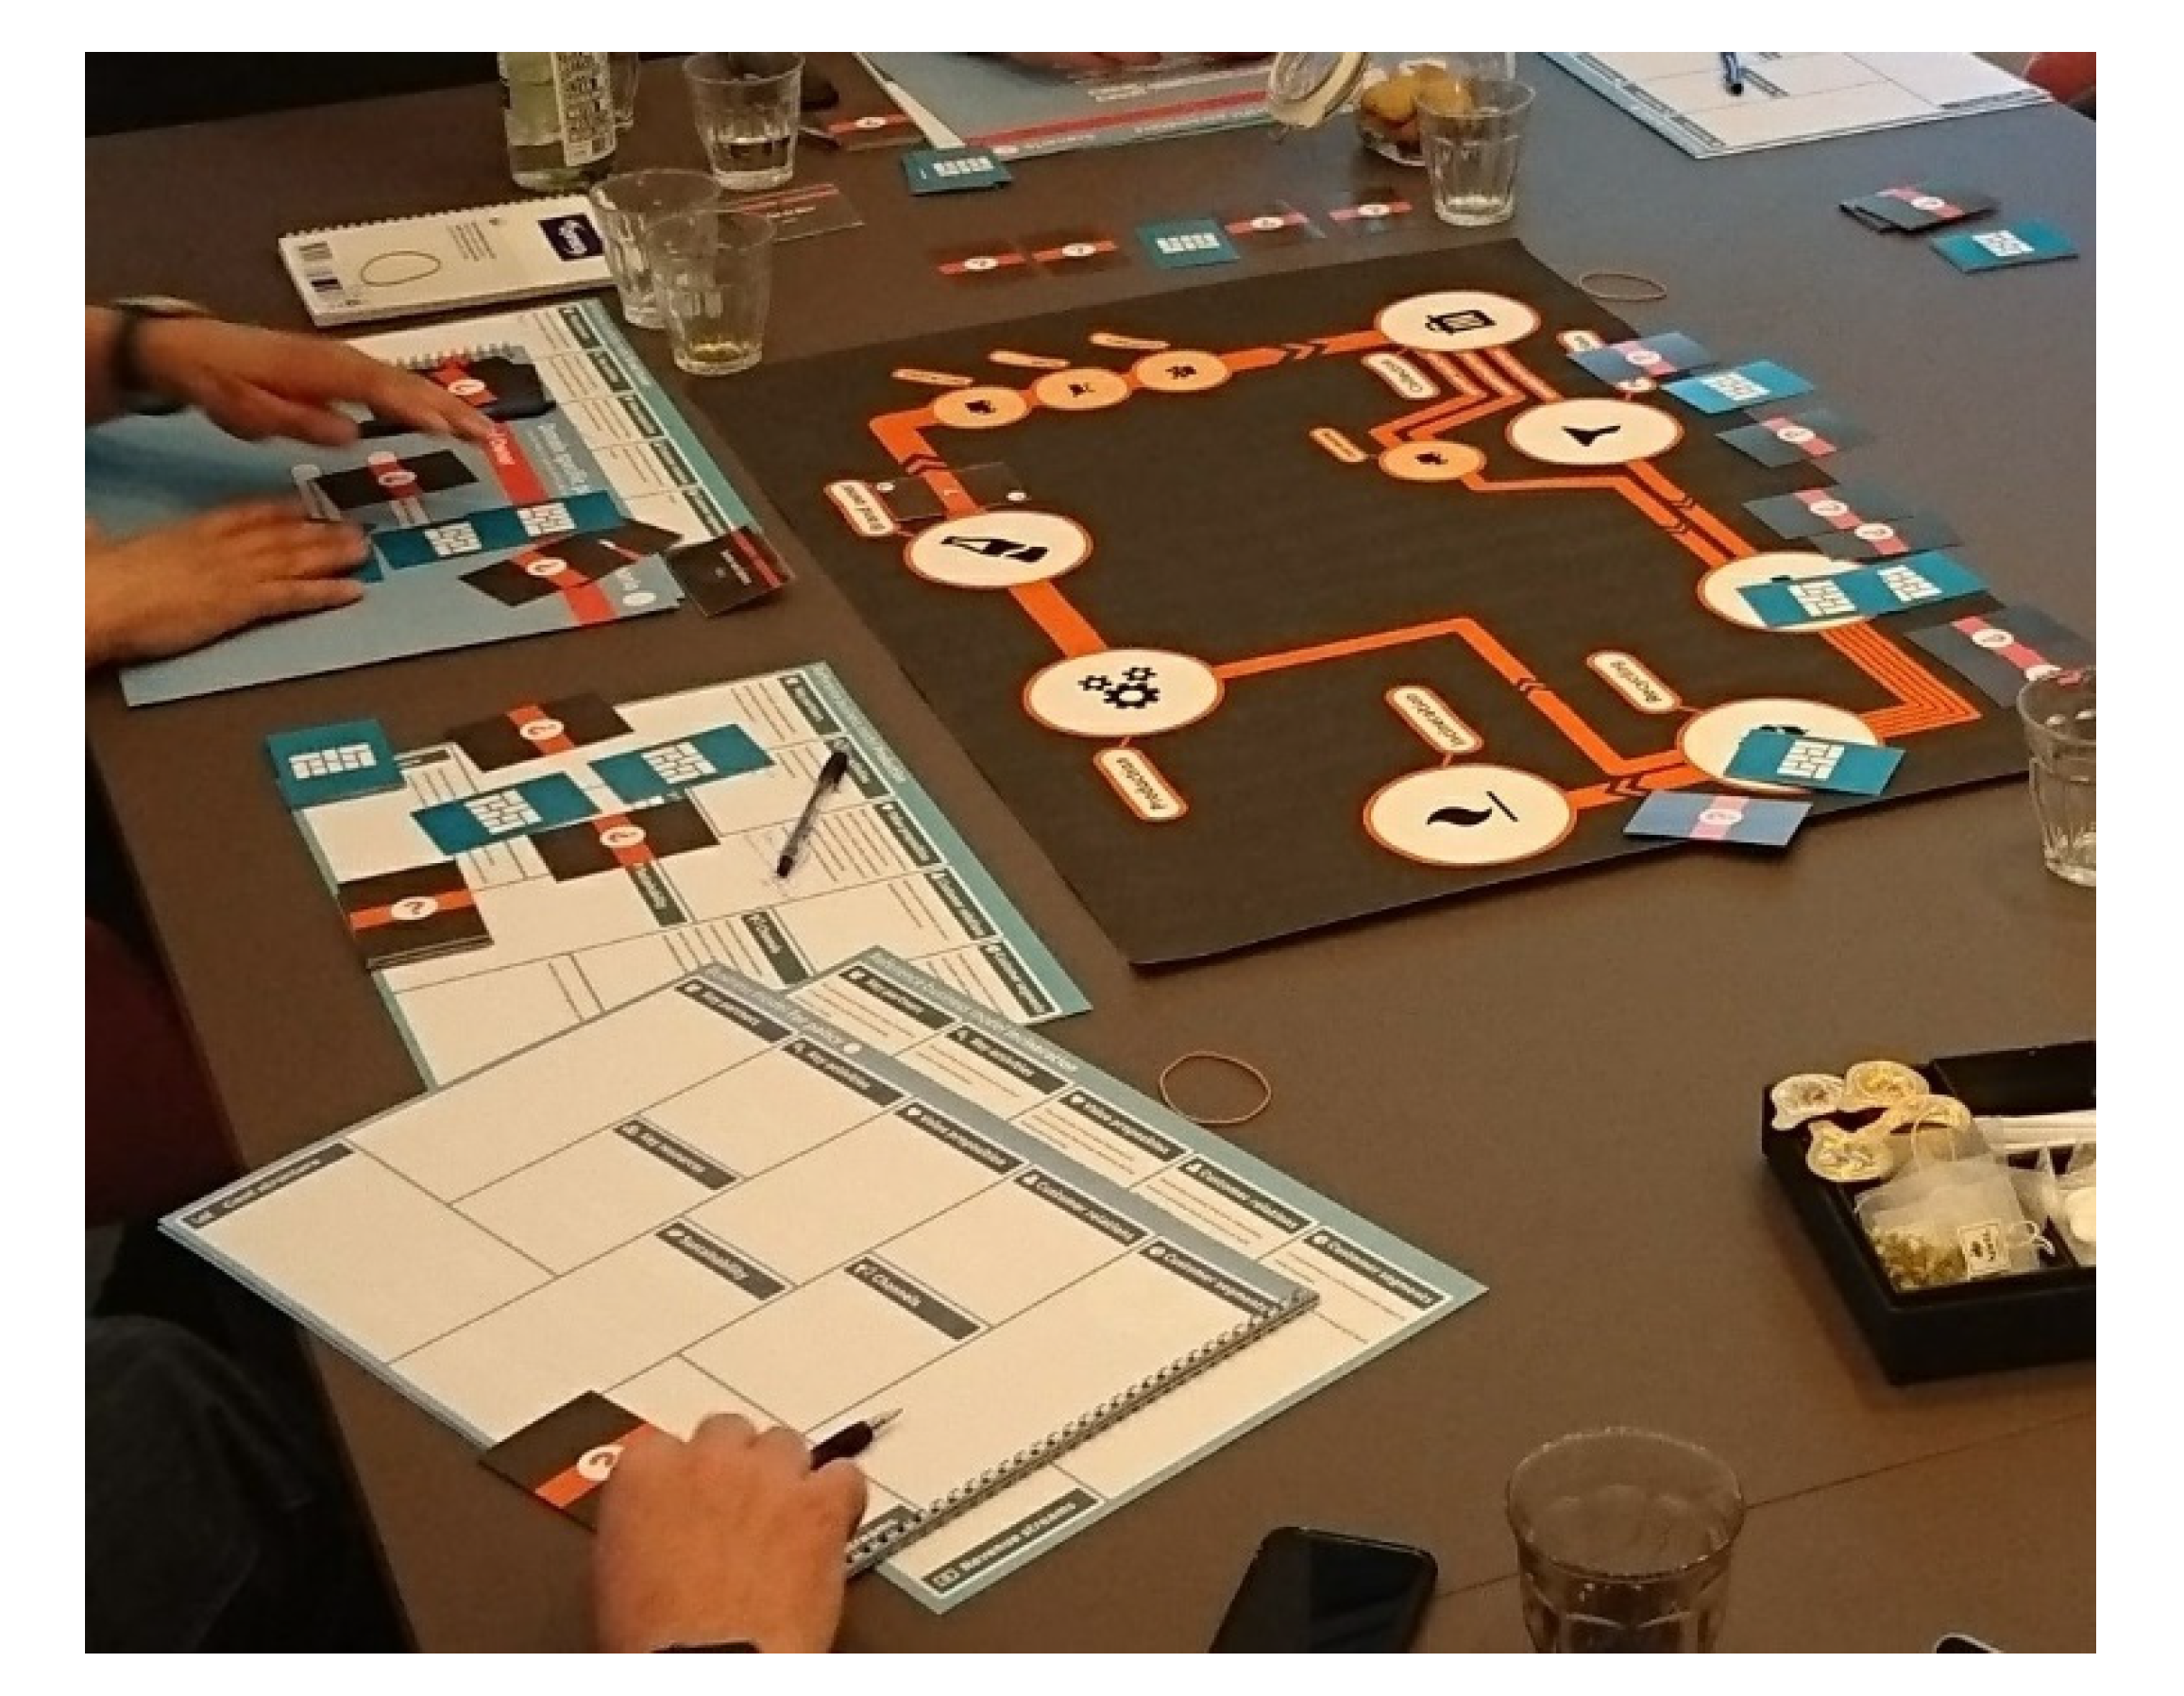
  • Game board: A visual representation of the plastic packaging value chain, showing material and monetary flows between the stakeholders and the position and role of the stakeholders within the system;
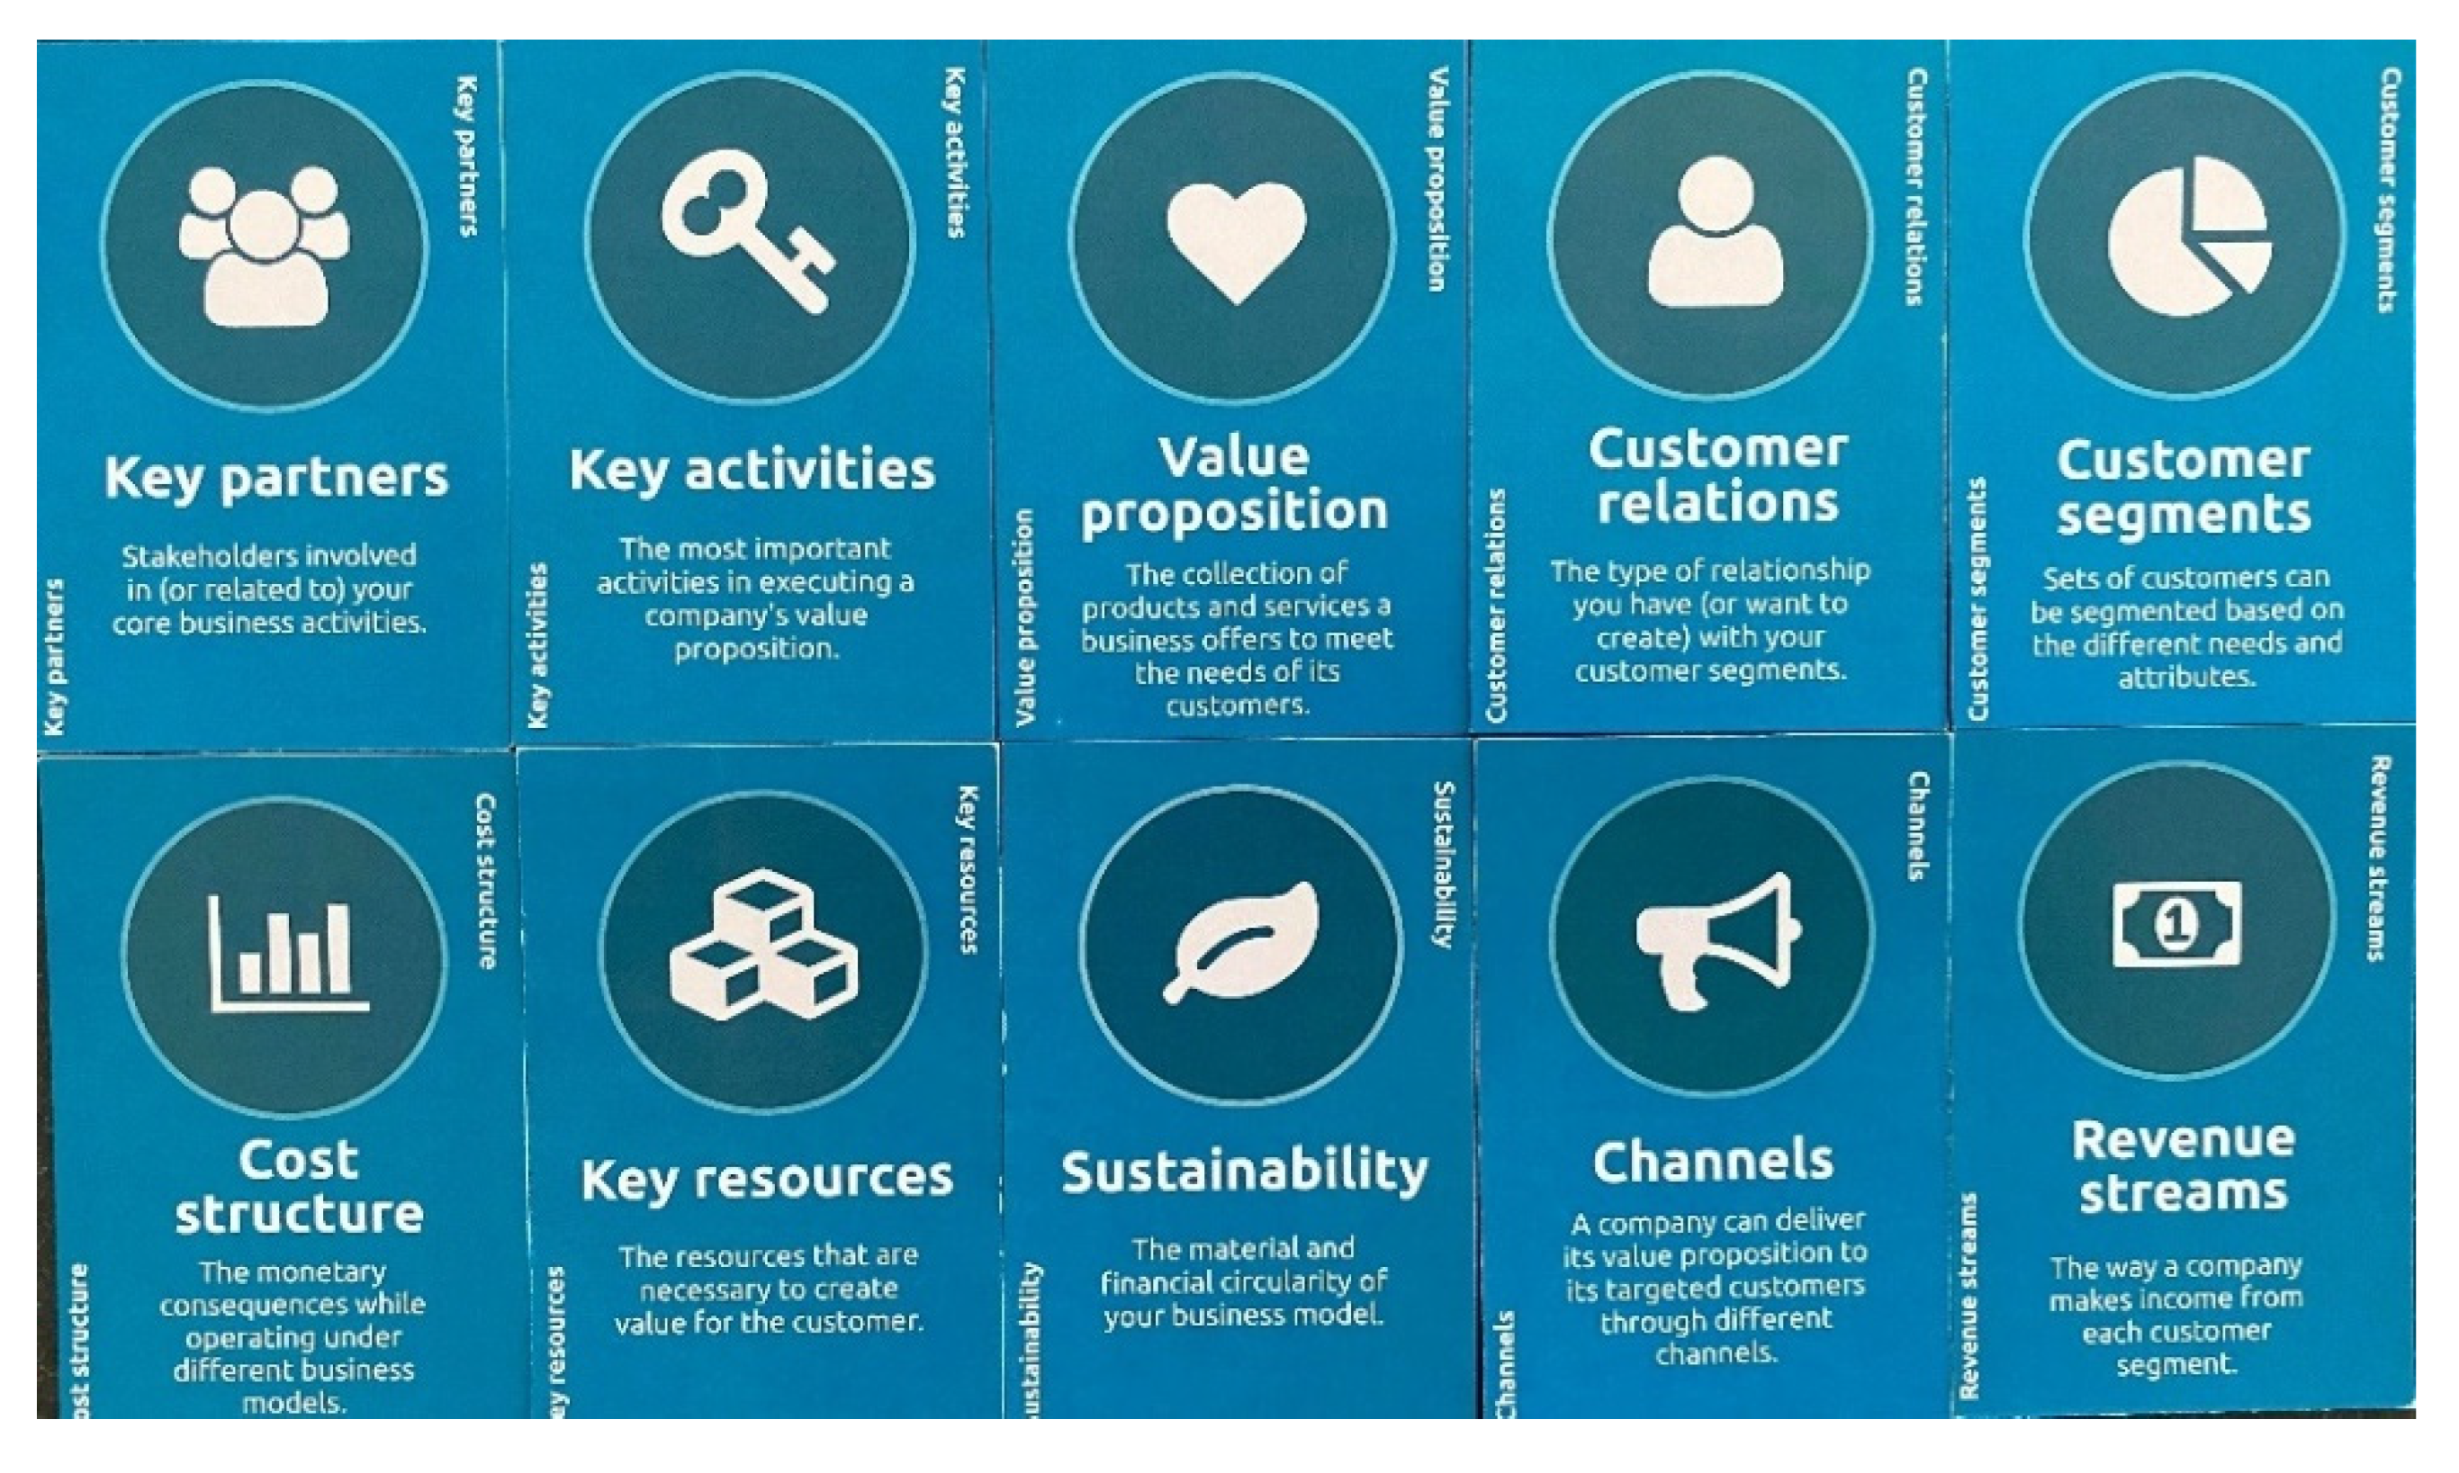
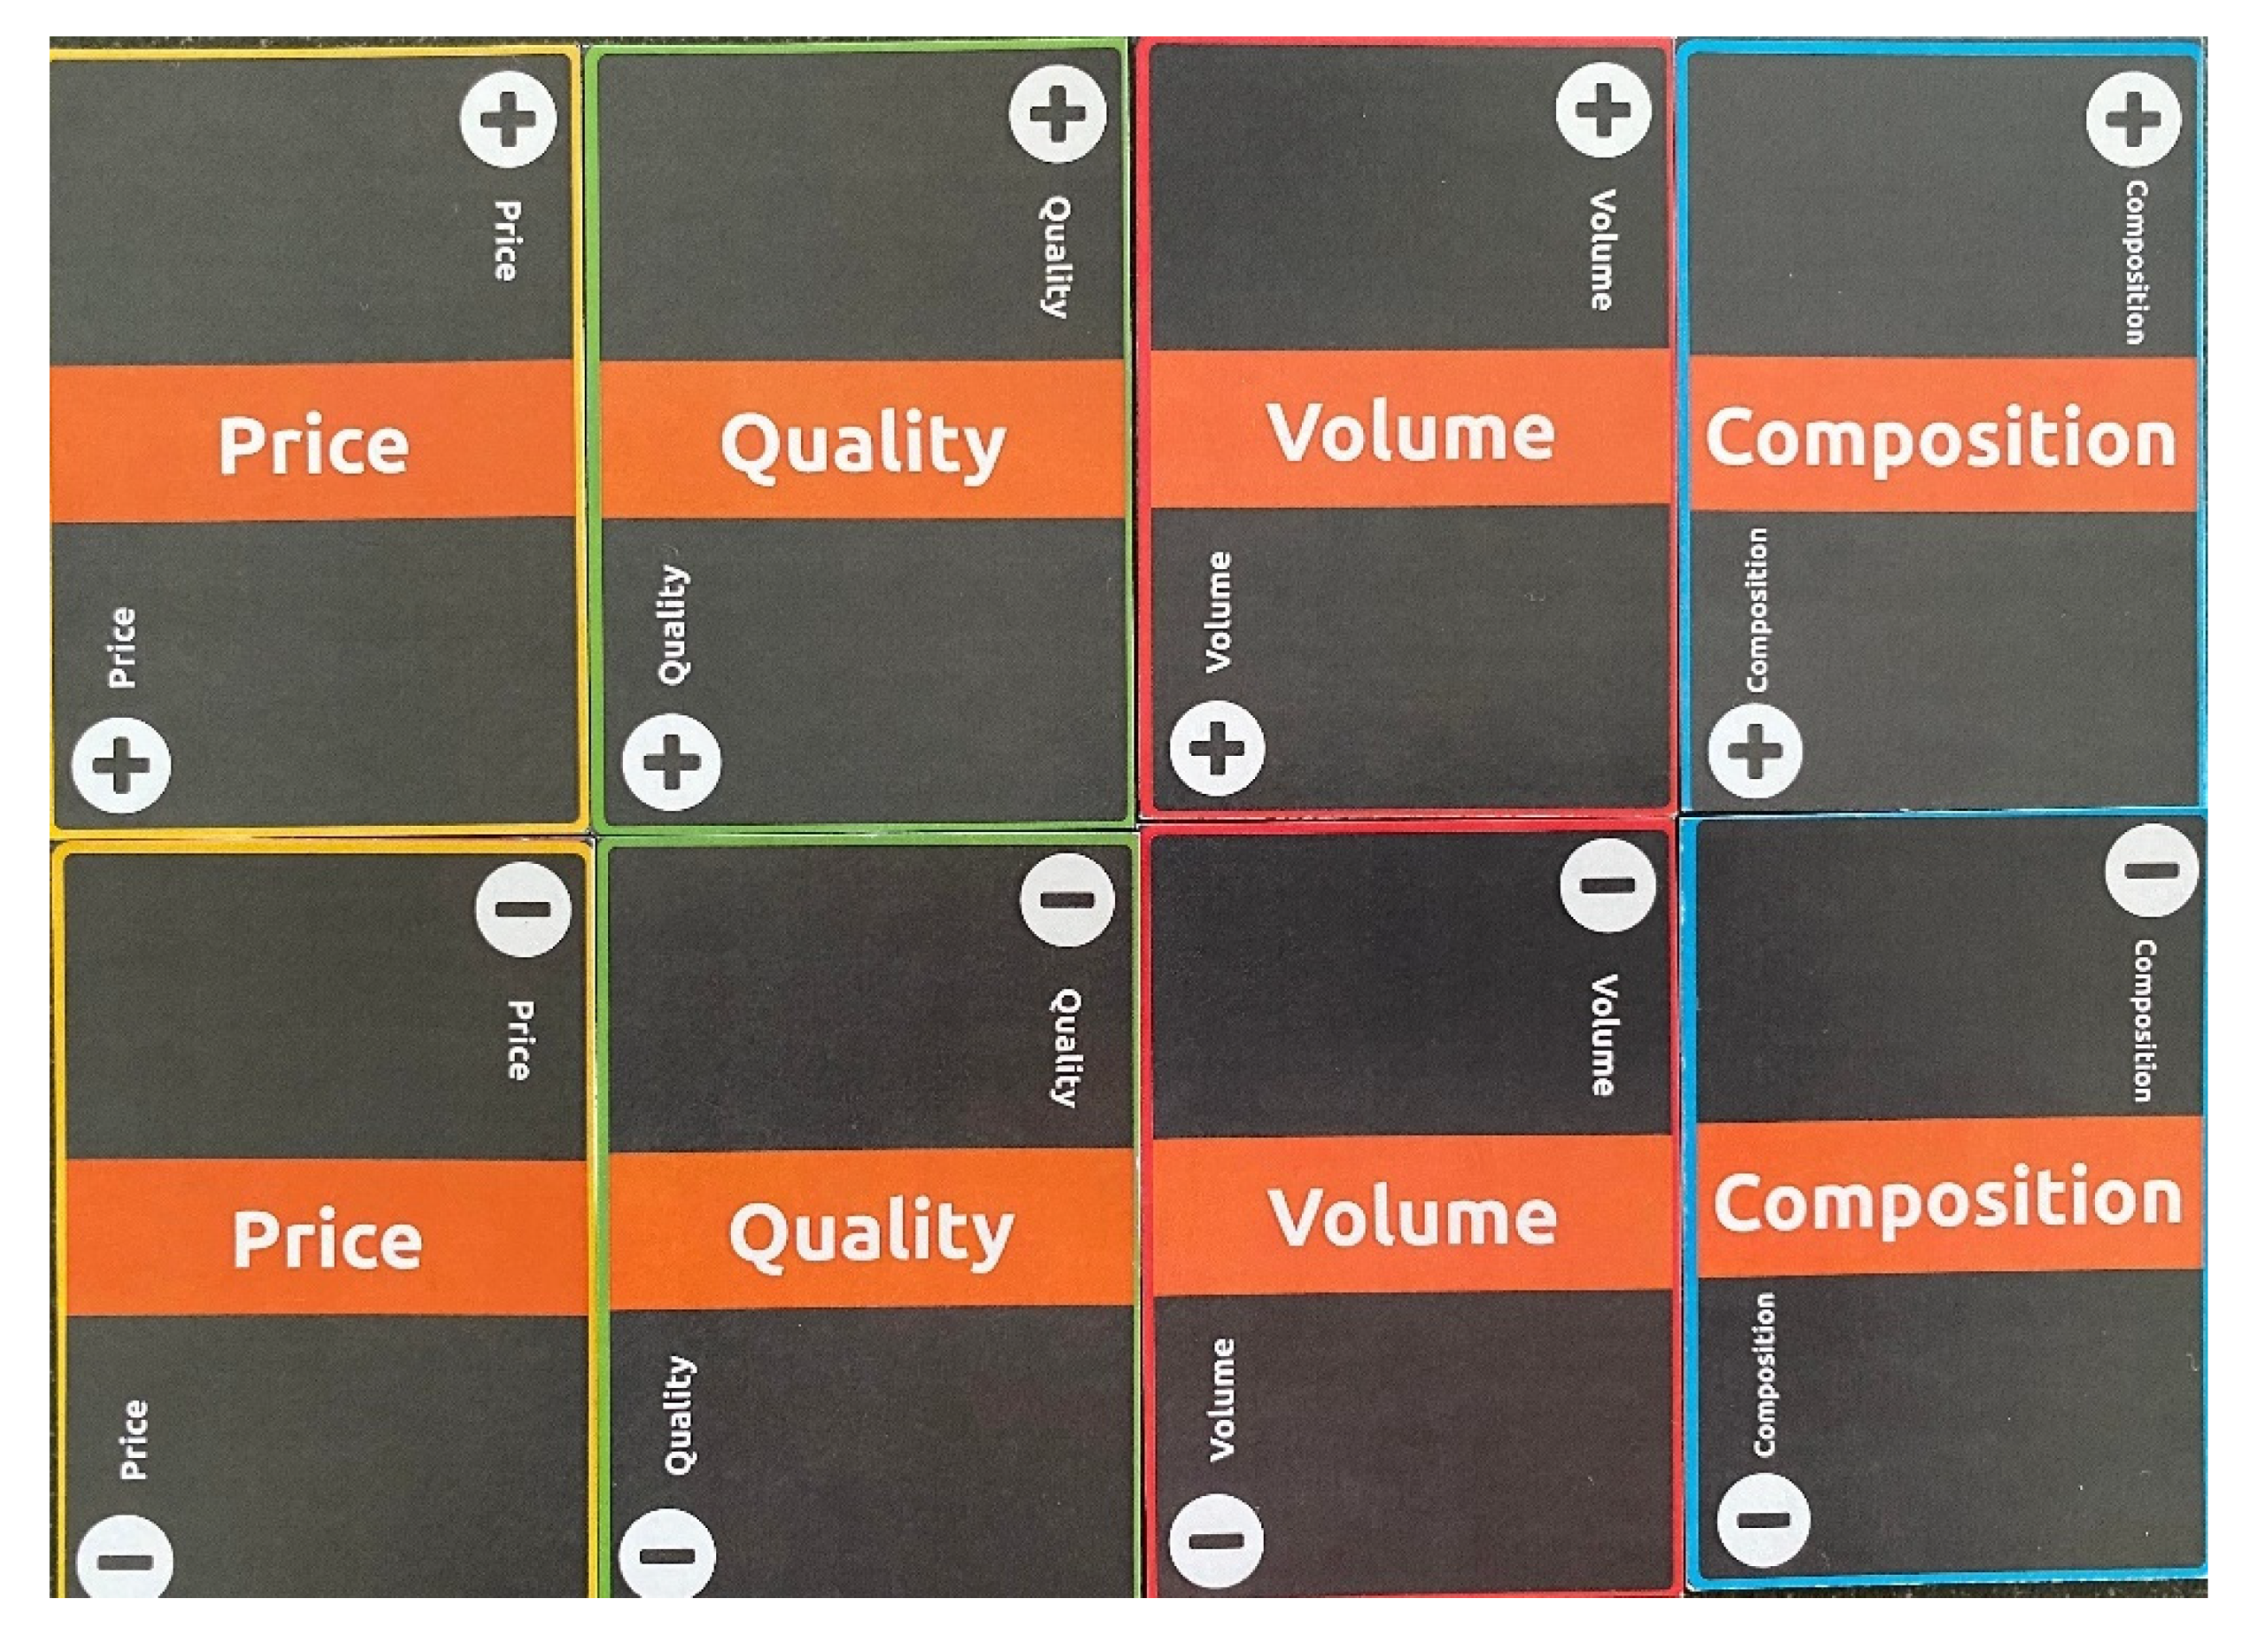
  • Business model and flow cards: Participants were given sets of business model and flow cards which they used to indicate the expected impact of a specific policy on their business models and the quality, composition, volume, and price of their input and output flow. The business model cards represented the nine building blocks of a business model canvas [50], with an extra card for the sustainability effect of each introduced policy. The participants used the flow cards to communicate an increase or decrease in the above-mentioned impact areas (quality, composition, etc.). The business model and flow cards used can be seen in Figure 2 and Figure 3, respectively, below:
Phase II was a round-table forum centred around the game board, which represented a simplified simulation of the material and financial flows of the plastic packaging system. The game itself was the main discussion platform during which the participants could act upon the responses of their peers. Before the game began, the participants were seated in accordance with the position of their roles on the board and were told why this workshop has been organized using the value chain schematics (game board), business model canvas, and the policies developed during phase I. They were also instructed beforehand on the structure of the gaming session, the building blocks of the business model canvas, and the flow cards. The session then kicked off with an introduction to the current situation in the Dutch plastic packaging value chain.
Following a discussion of the current state, participants then filled out their reference business model canvas, which would be applied to new situations in subsequent rounds. During each round, the participants were first introduced to the newly implemented policy and then had to select the appropriate business model and input and output flow cards, putting each card face down on the table to represent the estimated effects of the policy.
Once all participants selected and laid down their cards, they then took turns to show their cards and explain the reasons for their selection. The order of participants taking turns was based on the material flow—one participant′s output flow was the next participant′s input flow. If conflicts arose with the previous participant (e.g., the quality increase in the output of the previous participant did not match the quality of the input of the current participant), a brief discussion was held on the differences between the input and output. In these situations, a ‘fix′ to the chain was granted by changing cards—as long as both participants agreed on the changes.
This sequence continued until the cycle was complete, after which the participants filled out the two aforementioned forms in their booklet: the business model canvas and domain-specific parameters. They had to compare the reference business model canvas to the current situation under the studied policy and write down the most critical changes the current policy had caused to their business model. The business model cards they selected helped them with filling out the most important aspects of the changes. The participants also reported how a policy affected the domain-specific parameters of their own company, using positive or negative percentage ranges within a minimum and maximum threshold level. The flow cards they selected helped them with these estimations. Afterwards, the workshop facilitator took key findings and conflicts that arose during the game and reviewed these with the group, summing up the conclusions reached at the end. When requested to reflect on the game, players emphasized its engaging and realistic nature and appreciated how it stimulated their thinking. Figure 4 below illustrates the game in action:
This phase II workshop enabled us to collect data on the effects of the policies determined in phase I on the business models of the stakeholders, domain-specific technical parameters, as well as price and cost-level changes. The data garnered from phase II produced important insights into the business model changes that would occur when converting to a circular economy, and allowed us to estimate the impact of the policies on the material and financial circularity of the Dutch plastic packaging value chain using a simulation and statistical analysis.

3.3. The Computer Simulation and Statistical Analyses

All the industry stakeholders from phase II and material flows were recreated in a computer-based simulation model. The material flow was realized by transferring the required amount of material from one actor to the other. The financial flow emerged directly from the material flow together with taking into account relevant process costs and prices of the materials.
Within the context of this study, material and financial circularity performance indicators were used. The former is the net recycling rate for plastic packaging, which is calculated by dividing the net mass of mechanically recycled packaging materials by the mass of plastic packages placed on the market [18]. The degree of material circularity indicates what percentage of the input materials remains in the system after they complete one cycle through the plastic packaging value chain. The input data on material flows used in the calculation of the material circularity are based on the three polymeric fractions (PET, PE and PP), one product type (films) and one mixed plastics fraction grouped with respect to their collection methods (source separation, post-separation and deposit return scheme). Financial circularity refers to the extent to which the revenue created within the system covers the process costs incurred during this cycle. The process costs used in the calculations of financial circularity refer to those of collection, post-separation, sorting, recycling and incineration of PPW. The sale of recycled plastics is the main revenue stream alongside electricity and heat production through incineration.
The status quo material and financial circularity calculations in this study are based on data from KIDV plastics chain research [51]. For the policy effect analyses, for each parameter that is reported to change, each simulation run randomly selected a number from a uniform distribution between the minimum and maximum threshold levels provided by the participants in the data collection phase II. The stochastic processes within the model are governed by the seed value which is a number used to initialize the pseudorandom generation process. The data for the subsequent statistical analysis is produced as an average over 100 simulation runs. Subsequently, we ran the appropriate statistical analyses on the simulated data to test if the changes in material and financial circularity due to policy interventions were statistically significant. Figure 5 below summarises the research methodology followed in this study:

4. Results

Based on the research conducted for this study, we have calculated the current material and financial circularity figures for the Dutch plastic packaging value chain. The status quo material circularity is measured as 29.63%. This finding is consistent with the net recycling chain yield for post-consumer plastic packages of 30% in previous studies [6,42]. Financial circularity is measured as 36.17%. In the following sections, we share the prospective changes introduced by the policies developed in phase I. The changes will focus on the impact on industry stakeholders′ business models and material and financial circularity statistics.

4.1. The Effects of Policy 1 on the Business Models

Regarding the effect of quadrupling the incineration fee on the Dutch plastic packaging value chain, the participants all agreed that the attempts to evade a higher incineration fee, if successful, will result in an increase in the volume of recyclate but also the degradation of recyclate quality.
Plastic packaging producer: The plastic package producer′s value proposition is negatively affected due to the lower quality of the recyclate. This is believed to lead to a debate on quality with customers. The producer will incur higher costs, leading to uncertainty in the revenue stream. The lower quality of the recyclate also raises issues of sustainability.
Brand owner: The lower quality of recyclate affects costs of goods sold, which will have an impact on price for customers. As with plastic package producers, lower quality recyclate means more problematic customer relations. The brand owner believes that packaging material supply might change due to higher costs. It is argued that this policy will not be sustainable both from an environmental and financial perspective.
Waste collector: Collection costs will decrease because of higher volume and more efficient collection routes. More revenue is raised for collected plastics from the producer responsibility system. The waste collector takes a relatively positive approach to sustainability effects as more plastics will be recycled and less will be incinerated.
Post-separator: The huge increase in the costs of incineration of residue will boost gate fees—the charge (usually per ton) levied on waste received at a waste-processing facility (MSRW). The post-separator agrees with the waste collector that a higher volume of recovered plastics from post-separation will have a positive impact on the sustainability of the plastic packaging system.
Waste sorting company: Producing lower-quality input for recyclers will lead to the issue of quality standards for the waste sorting company. More residual waste in the input materials means more work will be needed to sort out materials according to regulation specifications, with the implications of higher process costs and lower market prices for the sorted materials.
Recycling company: Quadrupling the incineration fee will lead to higher process costs and lower-quality output for the recycling company. Less effective recycling results in less savings on the ecological footprint.
Incinerator company: According to the incinerator company, throughput will halve if fees are quadrupled. Consequently, furnaces would need to be retrofitted to accommodate other, more niche, waste streams. Operating capacity would shift to wintertime because of seasonal electricity prices and heat demand. The incinerator company will no more benefit from economies of scale as it had before. Electricity and heat production will halve, which will also halve the revenue. From a sustainability perspective, the incinerator company would only receive the worst quality waste and thus would end up with lower-quality residues after combustion.

4.2. The Effects of Policy 1 on Material and Financial Circularity

If policy 1 were implemented, the average material circularity would drop to 25.71%. According to the Jarque-Bera test (a goodness-of-fit test to see if sample data has the skewness and kurtosis matching a normal distribution), the material circularity follows a normal distribution (p = 0.1260). The one-sided t-test shows that the decrease in material circularity with respect to the status quo is statistically significant (p = 0.00). When we examine our data in more detail, we observe that the reason for this reduction in material circularity is due to lower sorting and recycling rates. Quadrupling the incineration fee forces more lower-quality PPW to go through the route of sorting and recycling instead of incineration, and this severely reduces the efficiency of these processes.
With the implementation of policy 1, the average financial circularity would be 38.69%. The material circularity follows a normal distribution, according to the Jarque-Bera test (p = 0.0693). A one-sided t-test highlights the statistical significance of the increase in financial circularity (p = 0.00). The improvement in financial circularity—despite the worsening of material circularity—can be explained by a significant reduction in curbside collection costs (more efficient collection routes with the help of higher volumes), an improved recovery rate, and increased recycled PPW and electricity prices.

4.3. The Effects of Policy 2 on the Business Models

The general consensus among the participants on the possible effects of creating a center of excellence is a new wave of investments in new machinery and infrastructure. Such financial investments on new generations of machinery will inevitably and unavoidably drive up costs, but this negative effect is compensated for by greater volumes of higher-quality recycled material, leading to significant sustainability gains in the plastic packaging value chain.
Plastic packaging producer: The change in the value proposition would result in more higher-quality recycled material used in production. This new value proposition brings brand owners emphasizing sustainability in their businesses to the fore as key partners for the plastic package producer. The cost structure is estimated to stay the same, with higher revenue streams created thanks to higher recycled content and its positive implications for sustainability.
Brand owner: The center of excellence is expected to have a positive impact on the value proposition of the brand owner due to a better sustainability image that comes with higher-recycled content in packaging. The investments in new IT infrastructure for coding, production tooling and maintenance of new machinery drives costs up. Packaging machine and machine parts producers would emerge as key partners for the brand owner.
Post-separator: The center of excellence itself would be regarded as a key partner by the post-separator company, and the requirement of investments in new machinery would, in turn, bring machinery suppliers to the fore as key partners. The new machinery and these collaborations would stimulate a higher volume of recovered plastics with efficiency gains.
Waste sorting company: In line with the previous stakeholders, costs would go up for the waste sorting company because of higher input prices and investment in new machinery. Its value proposition and sustainability would improve, with better output quality and more mono-flows, which would become possible thanks to higher-quality input from the post-separation company.
Recycling company: From the recycling company′s perspective, less waste, higher-quality input and less capital-intensive investments to remove pollutants all result in lower costs. More revenue would be created because it is easier to obtain virgin plastic- like prices for the recyclate as quality increases. Better input and output quality would mean less waste and thus a higher level of sustainability.
Incinerator company: The quality of residues might deteriorate due to more heavy metals in the remaining plastics. This might be a risk for the applications of these residuals. More heavy metals in residues and flue gas pose problems for sustainability issues.

4.4. The Effects of Policy 2 on Material and Financial Circularity

For policy 2, the average material circularity is calculated as 36.89%. This variable follows a normal distribution according to the Jarque-Bera test (p = 0.4181). The one-sided t-test results show that the increase in material circularity over the status quo is statistically significant (p = 0.00). This improvement in material circularity is caused by an increase in the sorting and recycling rate of both source-separated and post-separated PPW.
Policy 2 increases the average financial circularity to 48.48%. According to the Jarque-Bera test results, this variable follows a normal distribution (p = 0.3651). One-sided t-test results show that this increase in financial circularity is statistically significant (p = 0.00). This improvement in financial circularity can be explained by an increase in the sorting and recycling rate of both source-separated and post-separated PPW, a decrease in recycling costs, and higher sorted and recycled PPW prices.

4.5. The Effects of Policy 3 on the Business Models

The stakeholders agree that the tax law change with policy 3—halving fees for recycled plastic use and doubling for virgin material use in packaging—would inevitably introduce alternative packaging solutions other than plastics to the market. Worsening economies of scale based on lower volumes of plastics in the market, and higher contributions to the Afvalfonds Verpakkingen, would drive up all process costs. Such a transformation is expected to have negative impacts on the sustainability of the system.
Plastic packaging producer: The value proposition by the plastic packaging producer would change if policy 3 were to be implemented, as virgin plastic packaging will be less desirable. This will affect the producer′s key activities and customer relations, because 100% recycled content would not be accessible for every customer. There will be a new customer segmentation between 100% recyclable and 100% virgin material consumers. More recycled content will be required and, due to higher market demand, the cost of recycled materials will increase. The revenue will be lower because of the substitution of plastics with other materials.
Brand owner: A shift to other packaging solutions would induce the brand owner to collaborate with new key partners. This would mean a redefinition of customer relations and key resources. A higher contribution to Afvalfonds Verpakkingen will drive up costs. The adoption of alternative packaging solutions is expected to have negative impacts on the brand owner′s revenue stream and sustainability record.
Waste collector: Collection costs per ton will rise because the amount of plastics in the value chain will decrease.
Post-separator: The post-separator company envisions some packaging producers switching to materials other than plastics, with a doubling of the contribution to Afvalfonds Verpakkingen for the virgin material, which will bring about a radical change in its cost structure.
Waste sorting company: The cost of the sorting process would rise due to lower volume and quality.
Recycling company: The amount of recyclate supply by the recycling company would be low compared with the higher market demand.

4.6. The Effects of Policy 3 on Material and Financial Circularity

The change in the Afvalfonds Verpakkingen tax increases the average material circularity to 31.84%. The Jarque-Bera test results show that this variable does not follow a normal distribution (p = 0.0341). According to a Wilcoxon rank sum test, the increase in material circularity over the status quo is statistically significant (p = 0.0448). The improved material circularity follows from a higher sorting rate.
The average financial circularity is 40.29% under Policy 3. The financial circularity follows a normal distribution according to the Jarque-Bera test (p = 0.1806). The increase in financial circularity over the status quo is statistically significant according to a one-sided t-test (p = 0.00). The increase in financial circularity can be explained by higher sorting rates and higher sorted and recycled material prices. Table 1 below shows material and financial circularity figures under status quo conditions and alternative policies.

5. Conclusions

In this study, we developed, prioritized and elaborated on various feasible and effective policies to transform the linear Dutch plastic packaging system towards a circular economy and explore individual stakeholder and system-level consequences of these policy adoptions. We argue that one needs to understand how industry stakeholders react to these policies by adapting their business models within an interactive and dynamic system-level approach to observe industry-level outcomes in terms of material and financial circularity indicators. Based on KIDV plastics chain research data [51], the material and financial circularity indicators are calculated as 29.63% and 36.17%, respectively.
The results from the focus group led to the creation of three top policies that experts in the plastic packaging industry developed. The first policy focused on making plastic recycling the preferred option by quadrupling incineration fees; the second policy highlighted the possibility of establishing a center of excellence to support SMEs with recycling and recycled plastic packaging; and the third option aimed to incentivize producers and importers of plastic packaged goods to use recycled plastic by halving tax payments to Afvalfonds Verpakkingen if they chose that option, and doubling the tax payment for virgin plastic use. At this point, we would like to emphasize that there are very strong parallels between these policies and the short-term policy recommendations with strong support across societal stakeholders found with factor analysis by the Calisto Friant et al. (2021) study on the transition to a sustainable circular plastics economy in The Netherlands [4]. However, we should also note that the material circularity gain, even with the most effective policy of establishing a center of excellence, falls short of the EU′s recycling targets of 50% in 2025 and 55% in 2030 [36]. Therefore, more radical and higher value retention policies, such as refuse, reduce and reuse, should also be promoted for a more sustainable plastic management system, as emphasized again by Calisto Friant et al. (2021) [4]; although, there does not seem to be a social and political consensus on their implementation in the short term. Otherwise, a continuous increase in the production and waste of plastics will unavoidably have serious detrimental effects on the environment and public health.
Through an interactive workshop, we examined how the participants reacted to the policies listed above and analysed their business model adaptations. We used simulation and statistical analyses to uncover the effects of these policies on material and financial circularity in the plastic packaging value chain in The Netherlands.
In The Netherlands, the costs of recycling are 36.7% higher than those of energy recovery [33]. Hence, financial incentives are required to promote recycling over incineration. Our results show that the introduction of a much higher incineration fee in policy 1 would result in an increase in the volume of recyclate and, thus, degradation of its quality, with a negative impact on material circularity (25.71%) and a positive impact on financial circularity (38.69%). The reason for the decrease in material circularity comes from the resulting lower sorting and recycling rates. The improvement in financial circularity, despite the worsening of material circularity, can be explained by a significant reduction in curbside collection costs, an improved recovery rate, and increased recycled PPW and electricity prices.
The plastic packaging industry needs the resources to improve the cost-effectiveness, eco-efficiency, and commercial readiness of new technologies [5,52]. The conclusion we draw from the implementation of policy 2 is that a center of excellence would generate a new wave of investments in new machinery and infrastructure such as new sorting and recycling technologies, but that such financial investments on state-of-the-art designs would ineluctably cause costs to surge. However, this negative effect is balanced out by the consequent increase in—and higher quality of—recycled material, leading to significant sustainability gains in the plastic packaging value chain. Policy 2 would certainly benefit the Dutch plastic packaging industry the most, both in terms of material (36.89%) and financial circularity (48.48%) gains. The improvement in material circularity is caused by an increase in the sorting and recycling rate of both source-separated and post-separated PPW. The improvement in financial circularity can also be explained by this rate increase, as well as a decrease in recycling costs and higher sorted and recycled PPW prices.
Today, the very low price of virgin plastics prevents recycling from becoming an economically competitive alternative [52,53,54]. Taxes can make virgin plastics more expensive and incentivize the uptake of recycled plastics in packaging [19]. However, our findings have highlighted that the tax law change in policy 3 would unavoidably introduce alternative packaging solutions other than plastics to the market. The qualitative results show that worsening economies of scale based on lower volumes of plastics on the market, as well as higher contributions to Afvalfonds Verpakkingen, would drive up all process costs. Such a transformation is expected to have negative impacts on the sustainability of the system. However, the test results show otherwise. The change in waste packaging tax increases the average material circularity to 31.84%, with the help of a higher sorting rate. The average financial circularity also rises to 40.29%, due also to a higher sorting rate but also because of higher sorted and recycled material prices.
As well as these findings, we believe this study has also some managerial implications. A new list of policy measures has been created and developed by industry experts, focusing on the policies′ feasibility and effectiveness in transforming the plastic packaging chain into a circular model. We were also able to quantify the industry-level effects of these policy interventions with regard to material and financial circularity.
Alongside these important contributions, phase II of our qualitative research methodology enabled us to develop a bespoke serious game tool for industry stakeholders. The tool not only simulates alternative policy adoptions and scenarios in a systematic structure but integrates mutual dependency dynamics that are encountered in real-life situations.
For all the reasons above, this study fills an important gap in a body of literature that is predominantly focused on technical argumentation. We have supplied crucial economic and social considerations and interrelations that have previously been ignored [4,18]. It is our hope that, in the future, there will be more opportunities to organize work sessions using this serious game tool. We have shown that this game is a tool that reveals key ‘what if′ insights, and tests prospective policy measures so that policymakers can take a holistic approach and, consequently, make more informed decisions. Additionally, the computer simulation model and its user-friendly interface also equip policymakers with a valuable testing platform to assess alternative policies in terms of their quantitative effects at the industry-wide level before implementation. The program user can conduct several ‘what if′ analyses, exploring a wide range of policy options and parameter space combinations.
With these significant holistic insights into the plastic packaging system in The Netherlands, as well as our tools to aid future policy-testing, it is our wish to support the transformation of this industry into a circular economy—one that is both sustainable for the industry and for the environment.

Author Contributions

Conceptualization, S.Ç., C.G. and J.H.; methodology, S.Ç.; software, S.Ç.; validation, S.Ç.; formal analysis, S.Ç.; investigation, S.Ç.; resources, S.Ç.; data curation, S.Ç.; writing—original draft preparation, S.Ç.; writing—review and editing, S.Ç.; supervision, C.G. and J.H.; project administration, S.Ç., C.G. and J.H.; funding acquisition, C.G. All authors have read and agreed to the published version of the manuscript.

Funding

This research was funded by Top Institute Food & Nutrition (TIFN) and The Netherlands Institute for Sustainable Packaging (Kennisinstituut Duurzame Verpakkingen (KIDV)) within the TIFN SD002 project (Grant number: SD002 WP5.4). The APC was funded by the University of Twente.

Informed Consent Statement

Informed consent was obtained from all subjects involved in the study.

Data Availability Statement

Not applicable.

Acknowledgments

We kindly thank Peter Blok, Hans van Trijp, E. Ulphard Thoden van Velzen and Roland ten Klooster for fruitful discussions during the research process, and the three anonymous referees and the academic editor for their constructive comments and suggestions to improve the quality of this research.

Conflicts of Interest

The funders had no role in the design of the study; in the collection, analyses, or interpretation of data; in the writing of the manuscript, or in the decision to publish the results.

Appendix A. Status Quo Business Models

  • The Plastic Packaging Producer
Value Proposition: The plastic packaging producer is the designer as well as the producer of plastic packaging products (flexible and rigid plastic packages, preforms, and packaging systems). This business aims to improve performance (e.g., quality, safety, and convenience) of packaged goods, cost reduction (e.g., reduction of transportation costs of packaged goods), and a diversified product portfolio (packaging-related services). It positions itself as a system supplier, controlling performance output, throughput, and costs.
Key Activities: The key activities are defined as the production of plastic packaging (forming the plastic resins and compounds into finished products such as flexibles and rigids). It also invests in pursuing process-technology leadership.
Key Partners: Suppliers of plastic resins/polymers (powder/pellets), suppliers of additives, plastics machinery manufacturers, and brand owners.
Key Resources: Production technologies such as extrusion, stretch, injection blow moulding, and thermoforming.
Customer Segments: The customer portfolio can be divided into two key areas. The flexible packaging segment consists of food, home and personal care, hospitals, medical devices, pharmaceutical and industrial markets. The rigid packaging segment includes food, beverage, pharmaceutical, and home and personal care companies.
Customer Relations: Customer relationships are forged using key account management. It forms long-term relationships with blue-chip customers (nationally recognized, well-established, and financially sound companies).
Channels: The plastic package producer has a multichannel sales approach. It makes use of independent transportation and warehousing companies (indirect and partner), a sales force (commission-based), key account managers (direct and own) and web-enabled catalogues (direct and own).
Cost Structure: Raw material procurement, manufacturing processes and packaging design are the main cost items. It follows a value-driven pricing approach for design and performance improvement and exploits raw-material cost pass-throughs. Since raw materials account for approximately 60% of the total cost of sales, it leverages economies of scale in procurement.
Revenue Streams: The business mainly depends on asset sales and contractual agreements. Contract-based sales account for approximately 70% of its revenue.
  • The Brand Owner
Value Proposition: The brand owner′s value proposition is fulfilling daily and diverse (size, convenience, lifestyle, etc.) needs with a large product mix. It also invests in retaining its brand image by using recycled materials in packaging.
Key Activities: Production, product innovation, marketing (particularly branding) of new products, building brand equity, and operations (operational excellence).
Key Partners: Distributors and retailers. Non-governmental organizations (NGOs) have also recently emerged as a key partner as sustainability is increasingly becoming part of their business model.
Key Resources: The brand is given as a key resource for the brand owner and packaging is claimed to represent an important medium to deliver the brand message. Human capital (marketers and engineers) and corporate culture (being customer-oriented) are also listed as key resources.
Customer Segments: As a beverage company, the customers of the brand owner are its consumers.
Customer Relations: There are transactional relationships based on the exchange of services and/or products within a prescribed timescale for an agreed price. It strives to form selective interactive relationships with its customers for the purpose of product innovation.
Channels: A multichannel sales approach is pursued via distributors, retailers, and company-owned stores, both online and offline, which also fulfils a promotional function. Direct store and warehouse delivery are also used.
Cost Structure: The brand owner incurs the production, raw material procurement, energy, R&D, marketing and advertising campaigns, sales and distribution, and packaging and packaging development costs. Both a value-based pricing (brand leaders) and a cost-based pricing (no-name competitors) strategy are followed. It benefits from economies of scale and scope.
Revenue Streams: Asset (bulk) and retail (fixed margins for distributors/retailers) sales are the main ways of creating revenue streams. Primary and secondary packaging is regarded as a part of the actual product with no extra charges.
  • The Waste Collector
Value Proposition: It runs the business of waste collection in accordance with the needs of its customers in a safe and environmentally sound manner. The focus is on ‘getting the job done′. Efficient collection systems are designed to collect waste that meets the criteria of sorting and recycling facilities. In this endeavour, the target is to minimise pollution and maximise recyclable plastics.
Key Activities: A waste collection service is provided. It also handles transportation to cross docking stations and the quality control of the collected material.
Key Partners: The municipalities organize the collection of all types of household waste and thus are the natural key partners of waste collection companies. The waste collector also works in close collaboration with cross docking stations and sorting facilities.
Key Resources: A logistics network, waste disposal trucks, drivers, containers for different types of solid waste, and plastic bags for collection are at its disposal in collecting waste.
Customer Segments: It serves the municipalities it has a contract with.
Customer Relations: It has long-term contractual relationships with the municipalities. It also regularly communicates with the inhabitants of these municipalities for the sake of an efficient collection system.
Channels: The waste collecting company uses a sales force enhanced with web advertising to reach its customers. It provides information and guidelines by e-mail and post about the correct materials to be collected. The quality teams of the waste collector inform inhabitants about the correct ways of waste separation.
Cost Structure: Fixed investment and maintenance costs for the fleet of trucks and containers, fuel costs, driver wages, and managerial costs of the logistics network are main cost items for the waste collector.
Revenue Streams: Long-term collection payments for contractual agreements with the municipalities are collected through the Dutch waste packaging fund.
  • The Post-Separator
Value Proposition: The value proposition is defined as optimizing output in terms of economic value against the lowest possible costs per ton, supplying high quality and a high volume of recovered materials.
Key Activities: The post-separator recovers plastic waste from MSRW. It seeks a simultaneous improvement in the quantity and the quality of separated plastic waste. Maintenance and operational execution are also among its key activities. It sells different outputs, securing its input flow.
Key Partners: With waste separation, it depends on recovery system and spare part providers. Sorting centers, collection companies, municipalities, Dutch waste packaging fund, incinerator companies, and parties buying its outputs are the key partners.
Key Resources: A continuous supply of MSRW is critical for the post-separator. Other key resources are recovery facilities and personnel.
Customer Segments: Municipalities and other parties buying outputs with positive value (e.g., metals, beverage cartons, etc.).
Customer Relations: It has close relationships with local governments based on long-term contracts and quality assurance.
Channels: Face-to-face interactions, customer calls, and e-mails are used to reach the customers.
Cost Structure: The post-separator incurs fixed investment and maintenance costs, operational expenses, and energy and water costs. It exploits economies of scale in its cost structure.
Revenue Streams: It receives long-term payments for contractual agreements. The fees are collected either directly from Afvalfonds Verpakkingen or indirectly via municipalities. The sales of outputs with a positive value (e.g., metals) also create some revenue.
  • The Waste Sorting Company
Value Proposition: The waste sorting company optimizes input quality by an acceptance procedure in terms of economic value against the lowest possible costs per ton, supplying a high quality and a high volume of sorted materials. It helps and gives guidance to municipalities for the right input quality.
Key Activities: It operates material-sorting and recovery plants and facilitates the redistribution of recovered materials. It invests in the expansion and modernization of plants.
Key Partners: Sorting system and spare part providers as well as recycling companies are the key partners. It also collaborates with post-separation companies and municipalities because they deliver plastic bottles and packaging, metal and drink cartons, and environmental licenses.
Key Resources: The key resources for the waste sorting company are a materials recovery facility and a regular supply of industrial, commercial, and household waste.
Customer Segments: Recycling companies and municipalities.
Customer Relations: The waste sorting company has close relationships with recycling companies and municipalities based on long-term contracts and quality assurance.
Channels: Face-to-face interaction, customer calls, e-mail, Twitter, websites, tours, promo-films, YouTube and interviews in newspapers are the channels through which the waste sorting company reaches its customers.
Cost Structure: The waste sorting company exploits economies of scale and scope in its operations. Operational expenses, investment in new sorting technologies, energy, and labour-intensive processes are the main costs.
Revenue Streams: The sale of recovered materials to recyclers at market prices which is dependent on the quality of the sorted material.
  • The Recycling Company
Value Proposition: The recycling company supplies recycled plastics at reasonable prices, in accordance with international standards, to be used for different purposes.
Key Activities: It transforms waste plastics into raw materials (downcycling or upcycling), and improves the technologies, services, and processes of recycling.
Key Partners: Sorting companies, traders, and recycling technologies producers.
Key Resources: The recycling facilities, automated process technologies, and process knowledge.
Customer Segments: The main customer segments are companies using recycled plastics as raw materials in their production processes (e.g., park benches, sweaters, picture frames) and producers of lower-quality or low-margin products (e.g., pots).
Customer Relations: It provides tailormade solutions for—and establishes joint-ventures with—some of its customers. It has also forged close and recurrent relationships based on trust and transparency with part of its customer base. There are also some customers with whom the relationships are not as close, and it adopts a price-driven approach in such cases.
Channels: Sales force, traders, web catalogues, e-mails, and customer calls are used to reach the customers.
Cost Structure: The total cost mainly comprises sorted raw materials, depending on their quality, waste cost (roughly 25% of input becomes waste), operational expenses, investment in latest recycling technologies, energy and water costs, and capital-intensive processes. The recycling company utilises economies of scale and scope in its operations.
Revenue Streams: The revenue is created by the sale of recycled materials to plastics converters at market prices, which is dependent on the quality of the recycled material and virgin material prices.
  • The Incinerator Company
Value Proposition: The value proposition of the incinerator company is the conversion of municipal, industrial, and commercial waste into energy, delivering district heating and electricity. This process also supplies recovered metals and road-building materials. The shareholders′ ambition with respect to renewable energy and a circular economy define specifically its future scope of activities.
Key Activities: The operation and maintenance of a required capacity of waste treatment and energy recovery (heat and electricity) through incineration.
Key Partners: Utility companies (district heating and electricity network), ash management companies, and reprocessors. These partners finance the business and supply the incinerator company with waste, and serve as clients for its services.
Key Resources: A continuous supply of waste and the power plant.
Customer Segments: Local governments and businesses in waste acquisition and businesses and individuals in the energy grid (both power and heat).
Customer Relations: The incinerator company has customer-oriented long-term contractual relationships with its customers. These are shareholder-oriented long-term relationships based on providing them with the instruments to fulfil their waste policy, even if this conflicts with the present operations and business model (e.g., separate collection of plastic waste).
Channels: Formal and informal shareholder meetings are organised twice a year and a sales force is employed for industrial waste.
Cost Structure: The operating and maintenance costs, and investment in more efficient incineration technologies are the main cost items. Economies of scale are important in the cost structure.
Revenue Streams: The sale of heat and electricity to customers at market prices constitutes the major revenue stream. Some revenue is also created by the sale of metals recovered from bottom ash. The sale of CO2 to commercial greenhouses is regarded as a prospective revenue stream in the future.

References

  1. Guglielmi, G. In the Next 30 Years, We’ll Make Four Times More Plastic Waste than We Ever Have. 2017. Available online: https://www.science.org/content/article/next-30-years-we-ll-make-four-times-more-plastic-waste-we-ever-have (accessed on 26 March 2022).
  2. Bressanelli, G.; Adrodegari, F.; Pigosso, D.C.A.; Parida, V. Towards the Smart Circular Economy Paradigm: A Definition, Conceptualization, and Research Agenda. Sustainability 2022, 14, 4960. [Google Scholar] [CrossRef]
  3. Al-Salem, S.M.; Lettieri, P.; Baeyens, J. The Valorization of Plastic Solid Waste (PSW) by Primary to Quaternary Routes: From Re-Use to Energy and Chemicals. Prog. Energy Combust. Sci. 2010, 36, 103–129. [Google Scholar] [CrossRef]
  4. Calisto Friant, M.; Lakerveld, D.; Vermeulen, W.J.V.; Salomone, R. Transition to a Sustainable Circular Plastics Economy in The Netherlands: Discourse and Policy Analysis. Sustainability 2021, 14, 190. [Google Scholar] [CrossRef]
  5. Ragaert, K.; Delva, L.; Van Geem, K. Mechanical and Chemical Recycling of Solid Plastic Waste. Waste Manag. 2017, 69, 24–58. [Google Scholar] [CrossRef]
  6. Picuno, C.; Van Eygen, E.; Brouwer, M.T.; Kuchta, K.; Thoden van Velzen, E.U. Factors Shaping the Recycling Systems for Plastic Packaging Waste—A Comparison between Austria, Germany and The Netherlands. Sustainability 2021, 13, 6772. [Google Scholar] [CrossRef]
  7. Vollmer, I.; Jenks, M.J.F.; Roelands, M.C.P.; White, R.J.; Harmelen, T.; Wild, P.; Laan, G.P.; Meirer, F.; Keurentjes, J.T.F.; Weckhuysen, B.M. Beyond Mechanical Recycling: Giving New Life to Plastic Waste. Angew. Chem. Int. Ed. 2020, 59, 15402–15423. [Google Scholar] [CrossRef] [PubMed] [Green Version]
  8. Eze, W.U.; Umunakwe, R.; Obasi, H.C.; Ugbaja, M.I.; Uche, C.C.; Madufor, I.C. Plastics Waste Management: A Review of Pyrolysis Technology. Clean Technol. Recycl. 2021, 1, 50–69. [Google Scholar] [CrossRef]
  9. Gradus, R. Postcollection Separation of Plastic Recycling and Design-For-Recycling as Solutions to Low Cost-Effectiveness and Plastic Debris. Sustainability 2020, 12, 8415. [Google Scholar] [CrossRef]
  10. Moad, G.; Solomon, D.H. The Critical Importance of Adopting Whole-of-Life Strategies for Polymers and Plastics. Sustainability 2021, 13, 8218. [Google Scholar] [CrossRef]
  11. Bucknall, D.G. Plastics as a Materials System in a Circular Economy. Philos. Trans. R. Soc. A 2020, 378, 20190268. [Google Scholar] [CrossRef]
  12. Mah, A. Future-Proofing Capitalism: The Paradox of the Circular Economy for Plastics. Global Environ. Polit. 2021, 21, 121–142. [Google Scholar] [CrossRef]
  13. Polymer Comply Europe. The Usage of Recycled Plastic Materials by Plastic Converters in Europe. (2nd ed.). 2019. Available online: https://www.ahpi.gr/wp-content/uploads/2019/01/PCE-Report-2nd-EuPC-Survey-on-the-Use-of-rPM-by-European-Plastics-Converters-v.1_compressed.pdf (accessed on 23 March 2022).
  14. Eriksen, M.K.; Christiansen, J.D.; Daugaard, A.E.; Astrup, T.F. Closing the Loop for PET, PE and PP Waste from Households: Influence of Material Properties and Product Design for Plastic Recycling. Waste Manag. 2019, 96, 75–85. [Google Scholar] [CrossRef] [PubMed]
  15. Brouwer, M.; Picuno, C.; Thoden van Velzen, E.U.; Kuchta, K.; De Meester, S.; Ragaert, K. The Impact of Collection Portfolio Expansion on Key Performance Indicators of the Dutch Recycling System for Post-Consumer Plastic Packaging Waste, a Comparison between 2014 and 2017. Waste Manag. 2019, 100, 112–121. [Google Scholar] [CrossRef] [PubMed]
  16. Thoden van Velzen, E.U.; Brouwer, M.T.; Feil, A. Collection Behaviour of Lightweight Packaging Waste by Individual Households and Implications for the Analysis of Collection Schemes. Waste Manag. 2019, 89, 284–293. [Google Scholar] [CrossRef]
  17. Hahladakis, J.N.; Iacovidou, E. Closing the Loop on Plastic Packaging Materials: What Is Quality and How Does It Affect Their Circularity? Sci. Total Environ. 2018, 630, 1394–1400. [Google Scholar] [CrossRef] [PubMed]
  18. Brouwer, M.T.; Thoden van Velzen, E.U.; Ragaert, K.; ten Klooster, R. Technical Limits in Circularity for Plastic Packages. Sustainability 2020, 12, 10021. [Google Scholar] [CrossRef]
  19. Verrips, A.; Hoogendoorn, S.; Jansema-Hoekstra, K.; Romijn, G. The Circular Economy of Plastics in the Netherlands. In Environmental Sustainability and Education for Waste Management, Education for Sustainability; So, W.W.M., Chow, C.F., Lee, J.C.K., Eds.; Springer: Singapore, 2019; pp. 43–56. ISBN 9789811391729. [Google Scholar]
  20. World Economic Forum; Ellen MacArthur Foundation; McKinsey & Company. The New Plastics Economy: Rethinking the Future of Plastics. 2016. Available online: https://emf.thirdlight.com/link/faarmdpz93ds-5vmvdf/@/preview/1?o (accessed on 23 March 2022).
  21. Rabobank Industry Analysis. Unpacking the Dutch Plastics Packaging Industry. Available online: https://silo.tips/download/unpacking-the-dutch-plastics-packaging-industry (accessed on 23 March 2022).
  22. Grand View Research Plastic Packaging Market Size, Share & Trends Analysis Report by Product (Flexible, Rigid), by Technology (Extrusion, Thermoforming), by Application (Food & Beverages, Pharmaceuticals), and Segment Forecasts, 2021–2028. Available online: https://www.grandviewresearch.com/industry-analysis/plastic-packaging-market# (accessed on 23 March 2022).
  23. OECD. Improving Plastics Management: Trends, policy responses, and the role of international co-operation and trade. OECD Environ. Policy Pap. 2018, 12, 20. [Google Scholar] [CrossRef]
  24. Geyer, R.; Jambeck, J.R.; Law, K.L. Production, Use, and Fate of All Plastics Ever Made. Sci. Adv. 2017, 3, e1700782. [Google Scholar] [CrossRef] [Green Version]
  25. Su, Y.; Duan, H.; Wang, Z.; Song, G.; Kang, P.; Chen, D. Characterizing the Environmental Impact of Packaging Materials for Express Delivery via Life Cycle Assessment. J. Clean. Prod. 2020, 274, 122961. [Google Scholar] [CrossRef]
  26. Arunan, I.; Crawford, R.H. Greenhouse Gas Emissions Associated with Food Packaging for Online Food Delivery Services in Australia. Resour. Conserv. Recycl. 2021, 168, 105299. [Google Scholar] [CrossRef]
  27. Klein Lankhorst, H. Sustainable Packaging, the Dutch Way. Available online: https://vdocument.in/sustainable-packaging-the-dutch-way-sustainable-packaging-the-dutch-way-hester.html (accessed on 23 March 2022).
  28. Afvalfonds Verpakkingen. Monitoring Verpakkingen: Resultaten Inzameling en Recycling. 2018. Available online: https://afvalfondsverpakkingen.nl/a/i/Monitoring-Verpakkingen-Resultaten-inzameling-en-recycling-2018.pdf (accessed on 23 March 2022).
  29. KIDV; Natuur & Milieu; CE Delft. Factcheck Plastic Recycling. Available online: https://kidv.nl/media/publicaties/factcheck-plastic-recycling-in-nederland-deft.pdf?1.2.4 (accessed on 23 March 2022).
  30. Bishop, G.; Styles, D.; Lens, P.N.L. Recycling of European Plastic Is a Pathway for Plastic Debris in the Ocean. Environ. Int. 2020, 142, 105893. [Google Scholar] [CrossRef] [PubMed]
  31. Brooks, A.L.; Wang, S.; Jambeck, J.R. The Chinese Import Ban and Its Impact on Global Plastic Waste Trade. Sci. Adv. 2018, 4, eaat0131. [Google Scholar] [CrossRef] [PubMed] [Green Version]
  32. Bergsma, G.; Bijleveld, M. LCA: Recycling of Plastic Packaging Waste from Households. Available online: https://cedelft.eu/publications/lca-recycling-of-household-plastic-packaging-waste/ (accessed on 23 March 2022).
  33. Gradus, R.; van Koppen, R.; Dijkgraaf, E.; Nillesen, P.A. Cost-Effectiveness Analysis for Incineration or Recycling of Dutch Household Plastics. (TI 2016-039/VI Tinbergen Institute Discussion Paper). 2016. Available online: https://papers.tinbergen.nl/16039.pdf (accessed on 23 March 2022).
  34. Bellacosa, L. Determinants of Pro Environmental Behaviour in a Circular Program for Plastic Packaging: A Case of Plastic Heroes in Amsterdam. Master’s Thesis, Erasmus University Rotterdam, Rotterdam, The Netherlands, 2017. [Google Scholar]
  35. Hahladakis, J.N.; Iacovidou, E. An Overview of the Challenges and Trade-Offs in Closing the Loop of Post-Consumer Plastic Waste (PCPW): Focus on Recycling. J. Hazard. Mater. 2019, 380, 120887. [Google Scholar] [CrossRef] [PubMed]
  36. European Comission. A European Strategy For Plastics in a Circular Economy. Available online: https://www.europarc.org/wp-content/uploads/2018/01/Eu-plastics-strategy-brochure.pdf (accessed on 23 March 2022).
  37. European Comission Closing the Loop—An EU Action Plan for the Circular Economy. Available online: https://eur-lex.europa.eu/resource.html?uri=cellar:8a8ef5e8-99a0-11e5-b3b7-01aa75ed71a1.0012.02/DOC_1&format=PDF (accessed on 23 March 2022).
  38. VNG. Nieuwe Afspraken Raamovereenkomst Verpakkingen 2013–2022. Available online: https://vng.nl/sites/default/files/2019-11/20190906_ledenbrief_nieuwe-afspraken-raamovereenkomst-verpakkingen-2013-2022.pdf (accessed on 23 March 2022).
  39. Thoden van Velzen, E.U.; Bos-Brouwers, H.E.J.; Groot, J.J.; Bing, X.; Jansen, M.; Luijsterburg, B. Scenarios Study on Post-Consumer Plastic Packaging Waste Recycling; Wageningen UR Food & Biobased Research Rapport 1408; Wageningen UR; Wageningen UR: Wageningen, The Netherlands, 2013. [Google Scholar]
  40. Cimpan, C.; Maul, A.; Jansen, M.; Pretz, T.; Wenzel, H. Central Sorting and Recovery of MSW Recyclable Materials: A Review of Technological State-of-the-Art, Cases, Practice and Implications for Materials Recycling. J. Environ. Manag. 2015, 156, 181–199. [Google Scholar] [CrossRef]
  41. Afvalfonds Verpakkingen. Packaging Waste Management Contribution. Available online: https://afvalfondsverpakkingen.nl/en/packaging-waste-management-contribution (accessed on 23 March 2022).
  42. Brouwer, M.T.; Thoden van Velzen, E.U.; Augustinus, A.; Soethoudt, H.; De Meester, S.; Ragaert, K. Predictive Model for the Dutch Post-Consumer Plastic Packaging Recycling System and Implications for the Circular Economy. Waste Manag. 2018, 71, 62–85. [Google Scholar] [CrossRef] [Green Version]
  43. Feil, A.; Pretz, T.; Jansen, M.; Thoden van Velzen, E.U. Separate Collection of Plastic Waste, Better than Technical Sorting from Municipal Solid Waste? Waste Manag. Res. 2017, 35, 172–180. [Google Scholar] [CrossRef]
  44. Bing, X.; Bloemhof-Ruwaard, J.M.; van der Vorst, J.G.A.J. Sustainable Reverse Logistics Network Design for Household Plastic Waste. Flex. Serv. Manuf. J. 2014, 26, 119–142. [Google Scholar] [CrossRef]
  45. Thoden van Velzen, E.U.; Smeding, I.; Brouwer, M.T.; Maaskant, E. Comparison of the Quality of Mechanically Recycled Plastics Made from Separately Collected and Mechanically Recovered Plastic Packaging Waste. Waste to Resources 2021 Conference, Hanover Germany, May. 2021. Available online: https://www.researchgate.net/publication/351746182_Comparison_of_the_quality_of_mechanically_recycled_plastics_made_from_separately_collected_and_mechanically_recovered_plastic_packaging_waste (accessed on 23 March 2022).
  46. Picuno, C.; Alassali, A.; Chong, Z.K.; Kuchta, K. Flows of Post-Consumer Plastic Packaging in Germany: An MFA-Aided Case Study. Resour. Conserv. Recyc. 2021, 169, 105515. [Google Scholar] [CrossRef]
  47. Machado Leitão, T.; Lima Navarro, L.L.; Flórido Cameira, R.; Silva, E.R. Serious Games in Business Process Management: A Systematic Literature Review. Bus. Proc. Manag. J. 2021, 27, 685–721. [Google Scholar] [CrossRef]
  48. Serranti, S.; Bonifazi, G. Techniques for Separation of Plastic Wastes. In Use of Recycled Plastics in Eco-Efficient Concrete; Elsevier: Amsterdam, The Netherlands, 2019; pp. 9–37. ISBN 978-0-08-102676-2. [Google Scholar]
  49. Lanezki, M.; Siemer, C.; Wehkamp, S. “Changing the Game—Neighbourhood”: An Energy Transition Board Game, Developed in a Co-Design Process: A Case Study. Sustainability 2020, 12, 10509. [Google Scholar] [CrossRef]
  50. Manshoven, S.; Gillabel, J. Learning through Play: A Serious Game as a Tool to Support Circular Economy Education and Business Model Innovation. Sustainability 2021, 13, 13277. [Google Scholar] [CrossRef]
  51. Osterwalder, A.; Pigneur, Y.; Clark, T. Business Model Generation: A Handbook for Visionaries, Game Changers, and Challengers; Wiley: Hoboken, NJ, USA, 2010; ISBN 978-0-470-87641-1. [Google Scholar]
  52. KIDV. Plastics Chain. Available online: https://kidv.nl/kunststofketen (accessed on 23 March 2022).
  53. Cramer, J. Key Drivers for High-Grade Recycling under Constrained Conditions. Recycling 2018, 3, 16. [Google Scholar] [CrossRef] [Green Version]
  54. Forrest, A.; Giacovazzi, L.; Dunlop, S.; Reisser, J.; Tickler, D.; Jamieson, A.; Meeuwig, J.J. Eliminating Plastic Pollution: How a Voluntary Contribution From Industry Will Drive the Circular Plastics Economy. Front. Mar. Sci. 2019, 6, 627. [Google Scholar] [CrossRef]
Figure 1. A schematic representation of the treatment of PPW in The Netherlands.
Sustainability 14 07404 g001
Figure 2. Business model cards.
Sustainability 14 07404 g002
Figure 3. Flow cards.
Sustainability 14 07404 g003
Figure 4. A scene from the game with the game board, booklets, business model and flow cards.
Sustainability 14 07404 g004
Figure 5. Research methodology.
Sustainability 14 07404 g005
Table 1. Material and financial circularity results under different policies.
Material Circularity (%)Financial Circularity (%)
Status quo29.6336.17
Policy 125.7138.69
Policy 236.8948.48
Policy 331.8440.29
Publisher’s Note: MDPI stays neutral with regard to jurisdictional claims in published maps and institutional affiliations.

