Article

On a Comparative Analysis of Individual Customer Purchases on the Internet for Poland, Turkey and the People’s Republic of China at the Time of the COVID-19 Pandemic

1
Faculty of Management, University of Warsaw, Krakowskie Przedmieście 26/28, 00-927 Warsaw, Poland
2
Faculty of International Media, School of Economics and Management, Communication University of China, No. 1 Dingfuzhuang East Street Chaoyang District, Beijing 100024, China
3
School of Applied Sciences, Usak University, Ankara Izmir Yolu 8. Km Bir Eylül Kampüsü, Merkez 64000, Turkey
*
Author to whom correspondence should be addressed.
Sustainability 2022, 14(12), 7366; https://doi.org/10.3390/su14127366
Submission received: 6 May 2022 / Revised: 13 June 2022 / Accepted: 14 June 2022 / Published: 16 June 2022
(This article belongs to the Special Issue Economic and Social Consequences of the COVID-19 Pandemic)

Abstract

:
The main purpose of this article is to compare the state and dynamics of e-commerce development in selected countries: Poland, Turkey and the PRC (People’s Republic of China), from the point of view of individual customers. The comparison was carried out in two stages: the first months of 2020 (before the COVID-19 pandemic) and the first months of 2021 (during the pandemic). The study conducted involved university students. The surveys were carried out using the CAWI method, and they were made available on the servers of the Faculty of Management at the University of Warsaw. The research sample included 650 individuals. Differences in the obtained results were evaluated using the City distance. The hypothesis concerning the lack of differentiation between the evaluations of individual e-commerce criteria was formulated, and it was disproved in the course of the study. The results of the research indicate that the variation between countries appeared mainly in relation to the direction of the development of e-commerce during the COVID-19 pandemic, the type of (mobile/traditional) device used to shop online and, above all, the specificity of the country where the study took place with its past experiences, cultural circumstances and shopping habits, as reflected in the development of online commerce. The limitation of the study was the fact that it was conducted in an academic environment and, at this stage, it was limited to the analysis of the results covering selected countries. Nevertheless, the valuable contribution and undoubted achievement of the work consist in the fact that, for the first time, e-commerce solutions have been compared for countries that are so culturally, economically and demographically different. The results of this study may be used by business practitioners to guide them on possible strategies regarding the development of e-commerce in their countries in the post-pandemic reality.

1. Introduction

From the beginning of the 21st century until 2020, e-commerce was developing steadily, with only two disruptions resulting from the economic crisis in 2000 [1] and 2008 [2]. Since the crises affected the sphere of the electronic economy the least, and after two or three years the situation was restored to its pre-crisis conditions, the ongoing investments made in this area contributed to its increasingly rapid growth. When the pace of development began to stabilize after 2010, mobile commerce and the development of a social mobility platform became a specific catalyst for its further development. While the initial definitions describing this phenomenon have not changed over the years: “e-commerce—the process of buying, selling, transferring, or exchanging products or services or information via the public Internet or private corporate networks” [3,4,5,6] problems have arisen related to the distinction in the business-to-customer sphere and its inherent components, which included “i-commerce—the process of buying, selling, transferring, or exchanging products or services or information only via the public Internet” [3,4,5] and m-commerce (“m-commerce—any e-commerce done in a wireless environment, especially via the Internet”) [3,4,5,6]. When hardware or the device used became the criterion of distinction, i-commerce, i.e., traditional electronic commerce, was typically associated with the use of a laptop or a desktop computer, while m-commerce was carried on with the use of mobile applications via a smartphone and tablet. However, there arises a problem regarding this definition if users engage in online shopping using a smartphone. According to the definition presented above, this activity can be interpreted as e-commerce; however, smartphone users usually do not take notice of whether transactions are performed using apps or using websites. Unfortunately, the latter makes it difficult to evaluate this phenomenon from the user’s point of view. Taking the above into consideration, in this paper, the authors assumed that all transactions performed via a smartphone/tablet will be treated as mobile.
Regardless of whether the term is treated more broadly or more specifically, “e-commerce enables customers to purchase goods and services through an interactive and self-service experience. It includes the people, processes and technologies necessary to execute the offering of development content, analytics, promotion, pricing, customer acquisition and retention, and customer experience” [7], and analyses of its development have become the subject of many publications examining this phenomenon on different levels [8], considering different sectors [9] or regions [10,11], etc.
The COVID-19 pandemic was another unexpected stimulus that accelerated and, in some cases enforced, the emergence of new e-commerce development trends. This acceleration was not consistent or uniform. It depended on many factors, the most important of which were:
  • Organizational factors—as a method of preventing the spread of the virus: significant restrictions on movement (e.g., lockdown, use of codes (health code, green pass (with GPS) used on smartphones)—allowing entry to public or private institutions, forced and voluntary mass anti-HCV tests covering selected areas or entire countries in some cases, wearing masks in public places, restrictions imposed on the number of people per square meter allowed to enter restaurants, hairdressing salons, etc., restrictions concerning mass events and private meetings) as well as sometimes inconsistent restrictions (e.g., ban on entering the forest or beaches without masks), online education and teleworking),
  • Legal: enforced vaccination of all citizens or selected professional groups at one time or at different times, a total or partial ban on leaving home (lockdown), quarantine of varying lengths, lockdowns and closing cities, closing national borders, restrictions on entry to or exit from various countries, ban on travel/entry to a country or selected countries,
  • Economic (purchase and distribution of face masks, vaccines, tests, respirators, drugs and their economic consequences),
  • Technological—the availability of hardware/devices and software as well as the skills needed to use them, owning devices to make health codes available on-demand in countries where they are required,
  • Security—measures applied to secure the growing need for network services and ensure their correct and secure functioning and use,
  • Political—the desire to convince the public that the state administration is taking all available steps to prevent and reduce the spread of the pandemic, mitigate its consequences as well as the need to communicate tangible results in this regard.
The aforementioned phenomena have occurred and continue to occur to a greater or lesser extent in all the analyzed countries, at different, unevenly distributed times, at different periods depending on the strain of virus spread (e.g., delta, omicron) and the associated rate of infection and number of deaths, depending on the government policy adopted at the time.
From the point of view of individual customers, such a policy often enforced purchasing goods and services over the Internet. The burden and related problems of owning the device to communicate with the Internet, mastering the skills to use appropriate software, and the cost of Internet access were initially placed on individual customers, slowly adapting the ICT infrastructure to their needs. Thus, customers rationally chose between different options of using e-commerce, and they usually focused on the solutions that were the cheapest, easiest to learn, durable and those which could be applied in the long-term perspective. This was reflected in the growing popularity of smartphones, mobile applications (often free of charge) and related m-commerce [3,4,12,13,14]. Numerous analyses of consumer behavior during the COVID-19 pandemic [14,15,16,17,18,19] point also to the size of this phenomenon and the changes that are taking place in this area.
However, international comparisons seem to be the most difficult to carry out [20], especially those covering countries with different levels and circumstances of their economic development, different trade habits or different social and political cultures. This may be seen as a challenge even though studies only concern analyses of statistical data [21,22,23]. Therefore, this area raises numerous research questions about the situation related to the factors mentioned above, the most important of which is the difference in the development of e-commerce perceived by the individual customer in the analyzed countries during the COVID-19 pandemic. The technological aspect of this phenomenon has already been highlighted in some studies [15,24,25,26]. Therefore, the analyses presented here are much broader in scope than just technology.
If differences between countries were insignificant, the study could be seen as yet another analysis of globalization and convergence phenomena, accelerated by the crisis conditions. If significant differences were to occur, this might reflect that the analyzed countries seek to adopt their own, specific model of e-commerce development. Thus, the problem described above may be seen as a research gap that the authors will try to bridge with the consideration and thorough examination of the economic, social and cultural circumstances of particular countries selected for the study.
Therefore, the main purpose of this article is to compare the state and the dynamics of e-commerce development in selected countries: Poland, Turkey and the PRC, from the point of view of an individual customer.
To achieve this objective, the paper adopts the following structure of the paper. The introduction presents the nature of the problem, the research gap and the objectives of the paper. Section 2 provides a literature review on e-commerce development during the pandemic. Section 3 characterizes the research procedure and the research sample examined in the study. Section 4 and Section 5 contain an analysis of the obtained results and their discussion. Section 6 presents conclusions, limitations and directions for the further development of research work in this field.

2. Literature Review

As indicated in the introduction, the emergence of the COVID-19 pandemic led to several changes in the functioning of the economy and the social sphere. First of all, it manifested itself in the increasing popularity of teleworking, which, as long as it could be carried out remotely, moved to private apartments and houses [27,28]. These changes were mainly due to pandemic restrictions. A similar phenomenon occurred in the sphere of teaching, medical services (online appointments and consultations) and broadly defined entertainment and cultural events.
However, the biggest changes have occurred in online shopping behavior in the digital environment that changed in line with new consumers’ needs and expectations. Shopping in stores, malls, supermarkets or street markets has moved to the realm of electronic commerce (e-commerce). The observable significant increase in the volume of commercial transactions carried out over the Internet, as well as changes in other areas of human life, have become the subject of many studies.
In research conducted by Pollák, Konecný, Šceulovs [29] two perspectives on the development of e-commerce were adopted. The first was a comparison of changes in shopping habits between e-commerce users in the Czech Republic and Latvia. The second was a study of changes in e-commerce shopping habits in each of these markets examined separately. The study analyzed shopping behavior during the workweek, weekends and on holidays. Differences in shopping behavior were also observed depending on the time of day. As the study shows, as far as differences in the approach to e-commerce are concerned, Czech consumers showed loyalty to local providers while Latvian consumers tended to use the services of international providers.
Research on changing consumer shopping habits (Anna Amalyah Agus, Gatot Yudoko, Nurbudi Mulyono, Taliya Imaniya) [30] before and during the COVID-19 pandemic was analyzed in the following four contexts: opportunities for digital promotion, supply chain capabilities, customer preferences, and the performance of e-commerce platforms. Factors such as seasonal pricing and outsourcing of logistics services were also examined in the paper. The article shows that before the pandemic, customer evaluations of e-commerce platforms had a significant impact on transaction volume, but after the pandemic broke out, this factor ceased to have any real significance. Furthermore, it has been proven that logistics outsourcing does not affect the relationship between the perceived supply chain capability and the (relative) performance of an e-commerce platform. Before the COVID-19 pandemic, according to the authors, the impact of logistics outsourcing was significant.
Changes in consumer habits, as well as those of organizations operating in the field of e-commerce, and m-commerce in particular, have also been studied in the context of the development of the use of mobile marketing tools. W. Sardjono et al. [31] indicate that mobile commerce (m-commerce) and mobile marketing (m-marketing) provided customers with great convenience and comfort in purchasing products during the COVID-19 pandemic. Furthermore, organizations operating in the areas of internet commerce (i-commerce) and m-commerce took advantage of the imposed lockdown and social distance that accompany the pandemic to increase the number of transactions carried out by consumers. Organizations introduced free shipping and offered discounts, among others, on basic necessities or medical products. Changes in customer motivation to shop online were also observed. Original purchase motives, which could be described as a “desire to purchase a particular product,” became a necessity due to the COVID-19 pandemic. It was proven that during the pandemic, online purchases involved products directly related to health, products to support remote work at home and food products.
Each major global shock, such as the global financial crisis of 2008–2009 or the COVID-19 pandemic, had a significant impact on the economies of many countries. However, this impact was different in the area of trade in physical products compared to trade in services (in the digital sphere). Mitsuyo Ando, Kazunobu Hayakawa [32] proved that, despite problems with production, logistics of raw materials and supply of online stores/digital intermediaries, during the financial crisis, trade in material goods was more resilient to the crisis and related changes than the trade in services, which required direct contacts between the service provider and the customer. The study analyzed the impact of the COVID-19 pandemic on services trade using quarterly data from 146 countries in 2019 and 2020. The impact was measured based on factors such as trade volume and an index that describes the severity of pandemic restrictions. The strength of the impact of the pandemic, thus described, manifested itself in different economic sectors with varying intensity. The sectors most affected by the impact of the COVID-19 pandemic were tourism, followed by transport and construction services. The reason for this condition was that these sectors were linked to the international physical movement of people and goods. Digital services, such as IT services, provided internationally were hardly affected at all.
A separate aspect was a study on the possibility of pandemic shopping habits returning to their pre-pandemic state (Alexander Hodbod, Cars Hommes, Stefanie J. Huber, Isabelle Salle) [33]. Habits reflect factors such as consumer trust in brands and products or purchase preferences. Consumer studies were conducted in France, Germany, Italy, the Netherlands and Spain in 2020, after the introduction of restrictions in these countries related to the first wave of the pandemic. The research examined the underlying causes of reduced household consumption in five key sectors: tourism, hospitality, services, trade and public transport. Large changes were observed in southern European countries and slight changes in consumer preferences in the north of the continent. These changes were particularly evident among high-income earners. The research indicated that there are currently strong and long-term changes taking place in e-commerce shopping trends in the analyzed countries.
An analysis of the factors influencing the transformation of electronic retail during the COVID-19 pandemic was also performed on the Belgian market [34]. The study took two perspectives: the short- and long-term impact of the pandemic on retail. Changes in consumer behavior dictated by the appearance of pandemic restrictions had a direct impact on the behavior of small retailers. The article shows that the COVID-19 pandemic creates great opportunities for increased use of e-commerce in small, local markets. At the same time, a lack of professionalism in emergency situations can prevent traditional, local sellers from maintaining their market share and retaining customers.
Research on the impact of the COVID-19 pandemic on consumer behavior was also carried out in the area of food shopping in China’s domestic market, whose size is impressive in comparison to the European market. Data analyses presented in the article (Xuwen Gao, Xinjie ShiID, Hongdong Guo, Yehong Liu) [35] showed that confirmed cases of pandemic occurrences increase the likelihood of online food purchases. This tendency was more prominent for young people who are not afraid to shop online and those living in large cities. The researchers pointed out that in order to offset the impact of a pandemic, government support and regulation should focus on factors such as ensuring the safety of food sold online, protecting the supplier and recipient from infection, and providing financial resources and support for the poorer residents of small towns. Counteracting the so-called technical exclusion also turned out to be an important factor considered in the study. All the elements considered above assess the impact of the COVID-19 pandemic on consumer behavior and contribute to the creation of new knowledge in the field.
Another article (Hongdong Guo, Yehong Liu and Xinjie Shi; Kevin Z. Chen) [36], in which the authors analyzed e-commerce models in the pandemic era, also considered similar research problems. The authors showed that publicly available large e-commerce platforms that provide service in large cities enabled food delivery to a significant number of customers. In areas where strong pandemic restrictions prevailed, simple m-commerce applications performed best. Additional factors influencing customer confidence in e-commerce also included online product reservations, centralized ordering, and community support for delivery distribution.
The research the authors conducted lies within the area of world literature on the subject and, through its international nature, covers a broader scope than the analyses presented above.

3. Methodology

3.1. Research Procedure

The research presented in this article consisted of the following stages resulting from international cooperation:
  • Consultancy regarding the research topic and creating the first pilot survey involving broadly defined international comparisons,
  • The share of responses to survey questions across countries and the differences between them,
  • E-commerce situation before (early 2020) and during (early 2021) the COVID-19 pandemic,
  • Traditional electronic commerce (i-commerce) with mobile electronic commerce (m-commerce),
  • Selecting research sample groups at each of the cooperating universities,
  • Conducting research (Computer-Assisted Web Interviewing method, CAWI) on a verified and tested questionnaire, hosted on the servers of the University of Warsaw,
  • Analysis and discussion of the obtained results,
  • Drawing conclusions from the study in all mentioned aspects based on the previous analysis and discussion,
  • Description of the limitations and establishing directions for future research.
The survey was conducted during the first two weeks of November 2021 simultaneously in three countries in Poland, Turkey and the PRC. The survey contained 50 questions divided into five sections and demographic data. The questions were formulated in English, translated into national languages, and then translated again into English after the survey was completed. English was also the language of communication between team members. The form of the survey was agreed upon between the partners. The LimeSurvey tool was used to process the results obtained from all research samples.
The survey questionnaire was divided into the following sections:
  • Infrastructure information,
  • E-commerce operations carried out using mobile and desktop devices,
  • Sectors and functions of i-commerce and m-commerce tools used, before and during a pandemic,
  • Delivery of services and goods as part of e-commerce transactions, and
  • Other e-commerce related information during the pandemic.
In spite of the prior agreement and consultations, detailing the questions and translating them into national languages, there occurred some problems with the full understanding of the survey questions and the comparability of demographic data concerning Poland, Turkey and the PRC or the specificity of e-commerce development in particular countries. As a result, the data obtained from the questionnaires had to be carefully adjusted for subsequent analyzes. To carry out international comparisons, a total of 24 key questions were selected and fully answered for both mobile (smartphones, tablets) and traditional (PC, desktop) shopping.
The Cronbach’s alpha coefficient was applied for the reliability analysis. In all analyzed key questions, Cronbach’s alpha coefficient indicates the internal consistency and reliability of the sample (Hinton, Brownlow, McMurray and Cozens, 2004) [37]. The internal consistency measure of the 17 dependent variables for the three compared countries, which was based on Cronbach’s coefficient alpha, amounted to 0.71 (and 0.72 for Cronbach’s alpha calculated based on standardized items), for a total of 24 items.
International comparisons were made based on absolute differences in the percentages of responses to individual options (subcriteria) within each criterion. The sum of these absolute differences (City distance) indicated the strength of the variation between countries.
Additionally, the authors formulated the H0 hypothesis about the lack of differences in the level and development of electronic commerce before and during the COVID-19 pandemic between individual pairs of the three analyzed countries: Poland and Turkey, Poland and the PRC or Turkey and the PRC in the values for individual criteria and groups of analyzed criteria, against the hypothesis H1 concerning the existence of differences, with the assumed probability of 0.05.
To prove this hypothesis, the significance level of α was calculated for the probability distribution of the Fisher–Snedecor inverse (right-hand) value. It can be used in the Fisher–Snedecor test to compare the degree of variability of two data sets for two populations (including the study of the distribution of the assessment of differences in opinions on the level and development of e-commerce between Poland, Turkey and the PRC) and to compare it with the p value determined based on test statistics. If p ≤ α, then we reject H0 and adopt H1, if p ≥ α, then we reject H0 and take H1. The critical value of p for this distribution amounts with assumed probability and with the corresponding degrees of freedom for pairs are respectively: Poland-Turkey: 1.3874, Poland-PRC: 1.2164, Turkey-PRC: 1.4145.

3.2. Description of the Research Sample

Data were collected simultaneously in three locations at the University of Warsaw (Poland), Uşok University (Turkey), and Communication University of China in Beijing (PRC). The study included a total of 650 participants, 387 from Poland, 50 from Turkey and 213 from the PRC. The detailed characteristics of the research sample are presented in Table 1.

4. Analysis of Results

As mentioned above, the survey was divided into five sections with varying numbers of questions. The authors carried out comparisons of the share of responses to question options from each country, the situation before the COVID-19 pandemic, and i-commerce and m-commerce solutions. Specific sections of the survey were used to ensure consistency in both the analyses and the conclusions drawn from them. The first section of the survey contained introductory infrastructure information common to the analysis in all the aspects considered.

4.1. Infrastructure Information

The first question concerned the frequency of Internet use before and during the pandemic. On average, the highest number of answers in all countries (34%) was related to the response: I use the Internet 50% more than before the pandemic. However, in Poland, the dominant response was I use the Internet: twice as much as before the pandemic, and in the PRC: I use the Internet with the same frequency and intensity (26%). On the other extreme there were the answers: 25% less (20% in PRC; 13% in Poland). Most respondents in Turkey recorded a quantitative increase in terms of internet access. In Turkey, 46% of the respondents believe they use the Internet 50%—more during the pandemic, and 16% of them stated that their use of the Internet increased—more than twofold.
The greatest differences between the respondents in Poland and Turkey appeared in the category of—I use the Internet twice as much as before the pandemic (16%) in favor of Poland and—I use the Internet 50% more (16%) in favor of Turkey. The biggest differences between the respondents in Poland and the PRC occurred in the category of—twice as much (29%) in favor of Poland, and—I use the Internet the same way (with the same frequency and intensity)—14%, in favor of the PRC. In contrast, the largest difference between Turkey and the PRC occurred in the category of I use it 50% more (21%), in favor of Turkey, and—I use it with the same frequency and intensity (18%), in favor of the PRC. Overall, the largest recorded City distance index, calculated as the sum of the absolute values of the percentage differences of all responses, occurred between Turkey and the PRC.
The second question in this section was related to the type of device mainly used by respondents during the pandemic to access the Internet. In all three countries, the most popular device used to access the Internet is a smartphone (50% on average), a laptop (13%) or a combination of the two (30%). In Poland, the most popular option (44%) is a combination of a smartphone and a laptop. Poland is also the only country where 8% of respondents use a desktop computer. In Turkey, the smartphone is undoubtedly the most popular device (64%), the same is true in the PRC (50%). In China, the second most popular options are both laptops and smartphones (29%). The biggest differences occur between Polish and Turkish respondents in the smartphone category (34%) and the combination of smartphone and laptop (26%). A difference of similar magnitude is found in smartphone use in Poland and the PRC (28%). The low popularity of tablets and desktop computers is reflected in the scores. The only combination of devices besides a laptop and a smartphone is the combination of a desktop computer with a smartphone.
The biggest differences (City distance—80%) occur between respondents from Poland and Turkey, which mainly consist of differences in smartphone usage (34%) in favor of Turkey and laptop-smartphone combination—26% in favor of Poland. In addition, there is a 28% difference between Poland and the PRC in smartphone use, with an advantage of 28% in favor of the PRC. More than twice the urban aggregate distance, which is 33%, occurs in the comparison between Turkey and the PRC. Another very rare combination, i.e., a desktop computer and a smartphone, amounts to more than 1%, and it occurs in Poland.
The next question regarding the change of a device used during the pandemic period (with the following options: the pandemic period affected the change from a laptop to a smartphone, it affected change from a smartphone to a laptop, it had no effect, other). The largest number of respondents (71% on average) said that the COVID-19 pandemic period did not affect the change with respect to the device which they use. Such a response was provided most frequently in the PRC, reaching the level of nearly 83%, and in the other two countries such responses amounted to 65%. The biggest change was recorded in Poland; 28% of the respondents said that they had switched from a smartphone as their main communication tool to a laptop (in Turkey 20%, in the PRC just less than 4%). But in the PRC, 13% of people switched from a laptop to a smartphone as their main device used on the Internet.
The largest discrepancy in the findings occurred between Poland and the PRC—the City distance reached 55%, due to a 24% difference in switching from a smartphone to a laptop in the case of Poland, and a 16% difference in the category—pandemic did not affect the change in favor of PRC. Slightly lower variation occurred between Turkey and the PRC—44%, also in the above two categories.
The next question included in the infrastructure-related section concerned the frequency of the use of the device with the options: more than twice as much, twice as much, half as much, 50% more, more or less by 25% and —the same. In Poland, the highest number of people, i.e., 31% answered that they use information and communication technology (ICT) devices—twice as much as before the pandemic, and together with the category more than twice—43%, with the category 50%—more—over 70%. In Turkey, the combination of these categories amounted to 82%, and in the PRC—only 48%. Respondents in the PRC indicated that they use the device—as much as they did before the pandemic—the share was higher than in the two other countries in the study—twice as high as in the case of Poland or more than three times as high as in Turkey.
Thus, it emerges that the differences between respondents in Poland and Turkey are the smallest (City distance 42%). The biggest differences (City distance 67%) occurred in the comparison between respondents from Turkey and the PRC. It is caused by the differences in the statements concerning the frequency of the use of the device 50% more (City distance at the level of 17%) and the same intensity and frequency (City distance at the level of 22%). The biggest difference occurred between Poland and the PRC (City distance of 24%) in the category—twice as much.

4.2. E-Commerce Transactions on Mobile and Desktop Devices

The second section of the survey focused on e-commerce operations before and during the COVID-19 pandemic.
Before the COVID-19 pandemic, the most common response in all analyzed countries was that respondents shop online from time to time (37% of the responses on average, the highest 46% in Poland, the lowest 30% in Turkey). The responses—once a month and—rarely were slightly less popular in Poland and Turkey (22% on average). In the PRC, both responses were given by only 9% of respondents on average. In the PRC, the average answers of 19% were: several times a week and every week. This indicates a more frequent use of e-commerce in the PRC than in other countries.
The results presented in the article reflect the differences between the assessments in the countries studied. The biggest difference is between Poland and the PRC (18%) in the category—several times a week, followed by the difference between Poland and Turkey (16%) in the category—from time to time. Furthermore, a 15% difference appears between Turkey and the PRC in the category of—once a month. In summary, the largest difference occurs in the frequency of the use of e-commerce prior to the COVID-19 pandemic between Turkey and the PRC (City distance of 64%).
When asked about the frequency of their online purchases during the COVID-19 pandemic compared to the pre-pandemic period, on average, the most frequent answer (28%) indicated by respondents was that the frequency of their purchases had not changed. Students from the PRC (31%) and Poland (28%) chose this particular option most frequently. Respondents from Turkey most often (28%) answered that the frequency with which they shop online increased by 50%. 17% of respondents from Poland indicated the option twice as much, and 9% of them selected the answer more than twice as much. In the PRC, the combined options of more than twice as much, twice as much, 50% more, and 25% more reached a total of 61%. Those claiming to shop less, half as much or not at all constituted on average only 7% in all analyzed countries, the highest in Turkey (12%), the lowest in Poland (2%).
The values of the City distance indicators ranged from 29% to 37%, with the largest differences between Poland and Turkey. The latter was mainly due to differences in the category of twice as many online purchases (9%). Despite a slightly larger difference between Poland and the PRC in the same category (13%), the overall difference index was the smallest. On the other hand, the biggest differences between Turkey and the PRC occurred in categories of 50% more (8%) and more than twice (7%).
Another question in this section concerned the use of different types of devices used for shopping: mobile (smartphone, tablet) and desktop devices (PC, desktop computer). In Poland, the answer I use both variants prevailed (71%), and 19% of people used only a smartphone for e-commerce. Most of the respondents (86%) used a smartphone to shop online in the PRC and Turkey (66%). Across all countries, an average of just over 5% used only desktop devices for this purpose.
Thus, the greatest difference (67%) was observed between Poland and the PRC, and a slightly smaller difference of 59% in the category I use both variants. This resulted in the highest value of the City distance indicator of 133% between those countries. The differences in the opinions of the respondents from Poland and Turkey were 40% smaller, and the differences between the results from Turkey and the PRC did not exceed 40%.
Additionally, the survey section on the distinction between mobile and traditional e-commerce included a question about the place and role of showrooms (stores/stands) during the COVID-19 pandemic. The most common answer on average (47%) was that they are less important because they are closed periodically. This opinion was expressed primarily by respondents from Poland (56% of responses) and survey participants in the PRC (46%). Moreover, respondents from the PRC believed that showrooms are just as important (30%). In Turkey, there was a divergent opinion on the same topic: 24% said they were of equal importance, and 24% said they were of greater importance during the COVID-19 pandemic. In contrast, an average of 19% in the three countries analyzed said they could not assess this issue.
The biggest differences in terms of City distance occur between Poland and Turkey because of the specific category they are less important because they are closed periodically (18%) and the option they are more important (18%). The biggest difference occurred between Turkey and the PRC in the category they have greater importance (15% of responses) and between Poland and the PRC in the case of the option they are just as important—an 18% advantage of the PRC.
The convenience of using mobile devices for e-commerce received the highest scores (50% of respondents on average believe so, mostly from the PRC—81% and Turkey—52%). In second place is the option—it depends on the type of shopping, where the opinion of respondents in Poland prevails—36%, (the average of 21%). In Turkey the category I don’t see a difference takes the second place (20% of responses).
This makes for large differences in the City distance index between countries—the largest between Poland and the PRC (130%), mainly in terms of the differences between views on the role of mobile devices, 65% in favor of the PRC. Second, there are differences between Poland and Turkey (73%) in the same category. Another major difference between these countries is the option: it depends on the type of purchase (20% of opinions). In addition, there is also a 29% difference between Turkey and the PRC in the category of more convenient use of mobile devices.
The question of the change regarding the relevance of the main functions of websites and mobile applications leads to the conclusion that, in general, in all countries, it has increased in all categories. In Poland, the popularity of shopping function (93%) and the payment function (84%) increased the most. In Turkey, it was similar—shopping (70%) and payment (72%). In the PRC—shopping (54%) and information (51%). The biggest differences occur between the scores obtained in Poland and the PRC in the following categories: shopping—39%, payment—36% and information functions—27%.

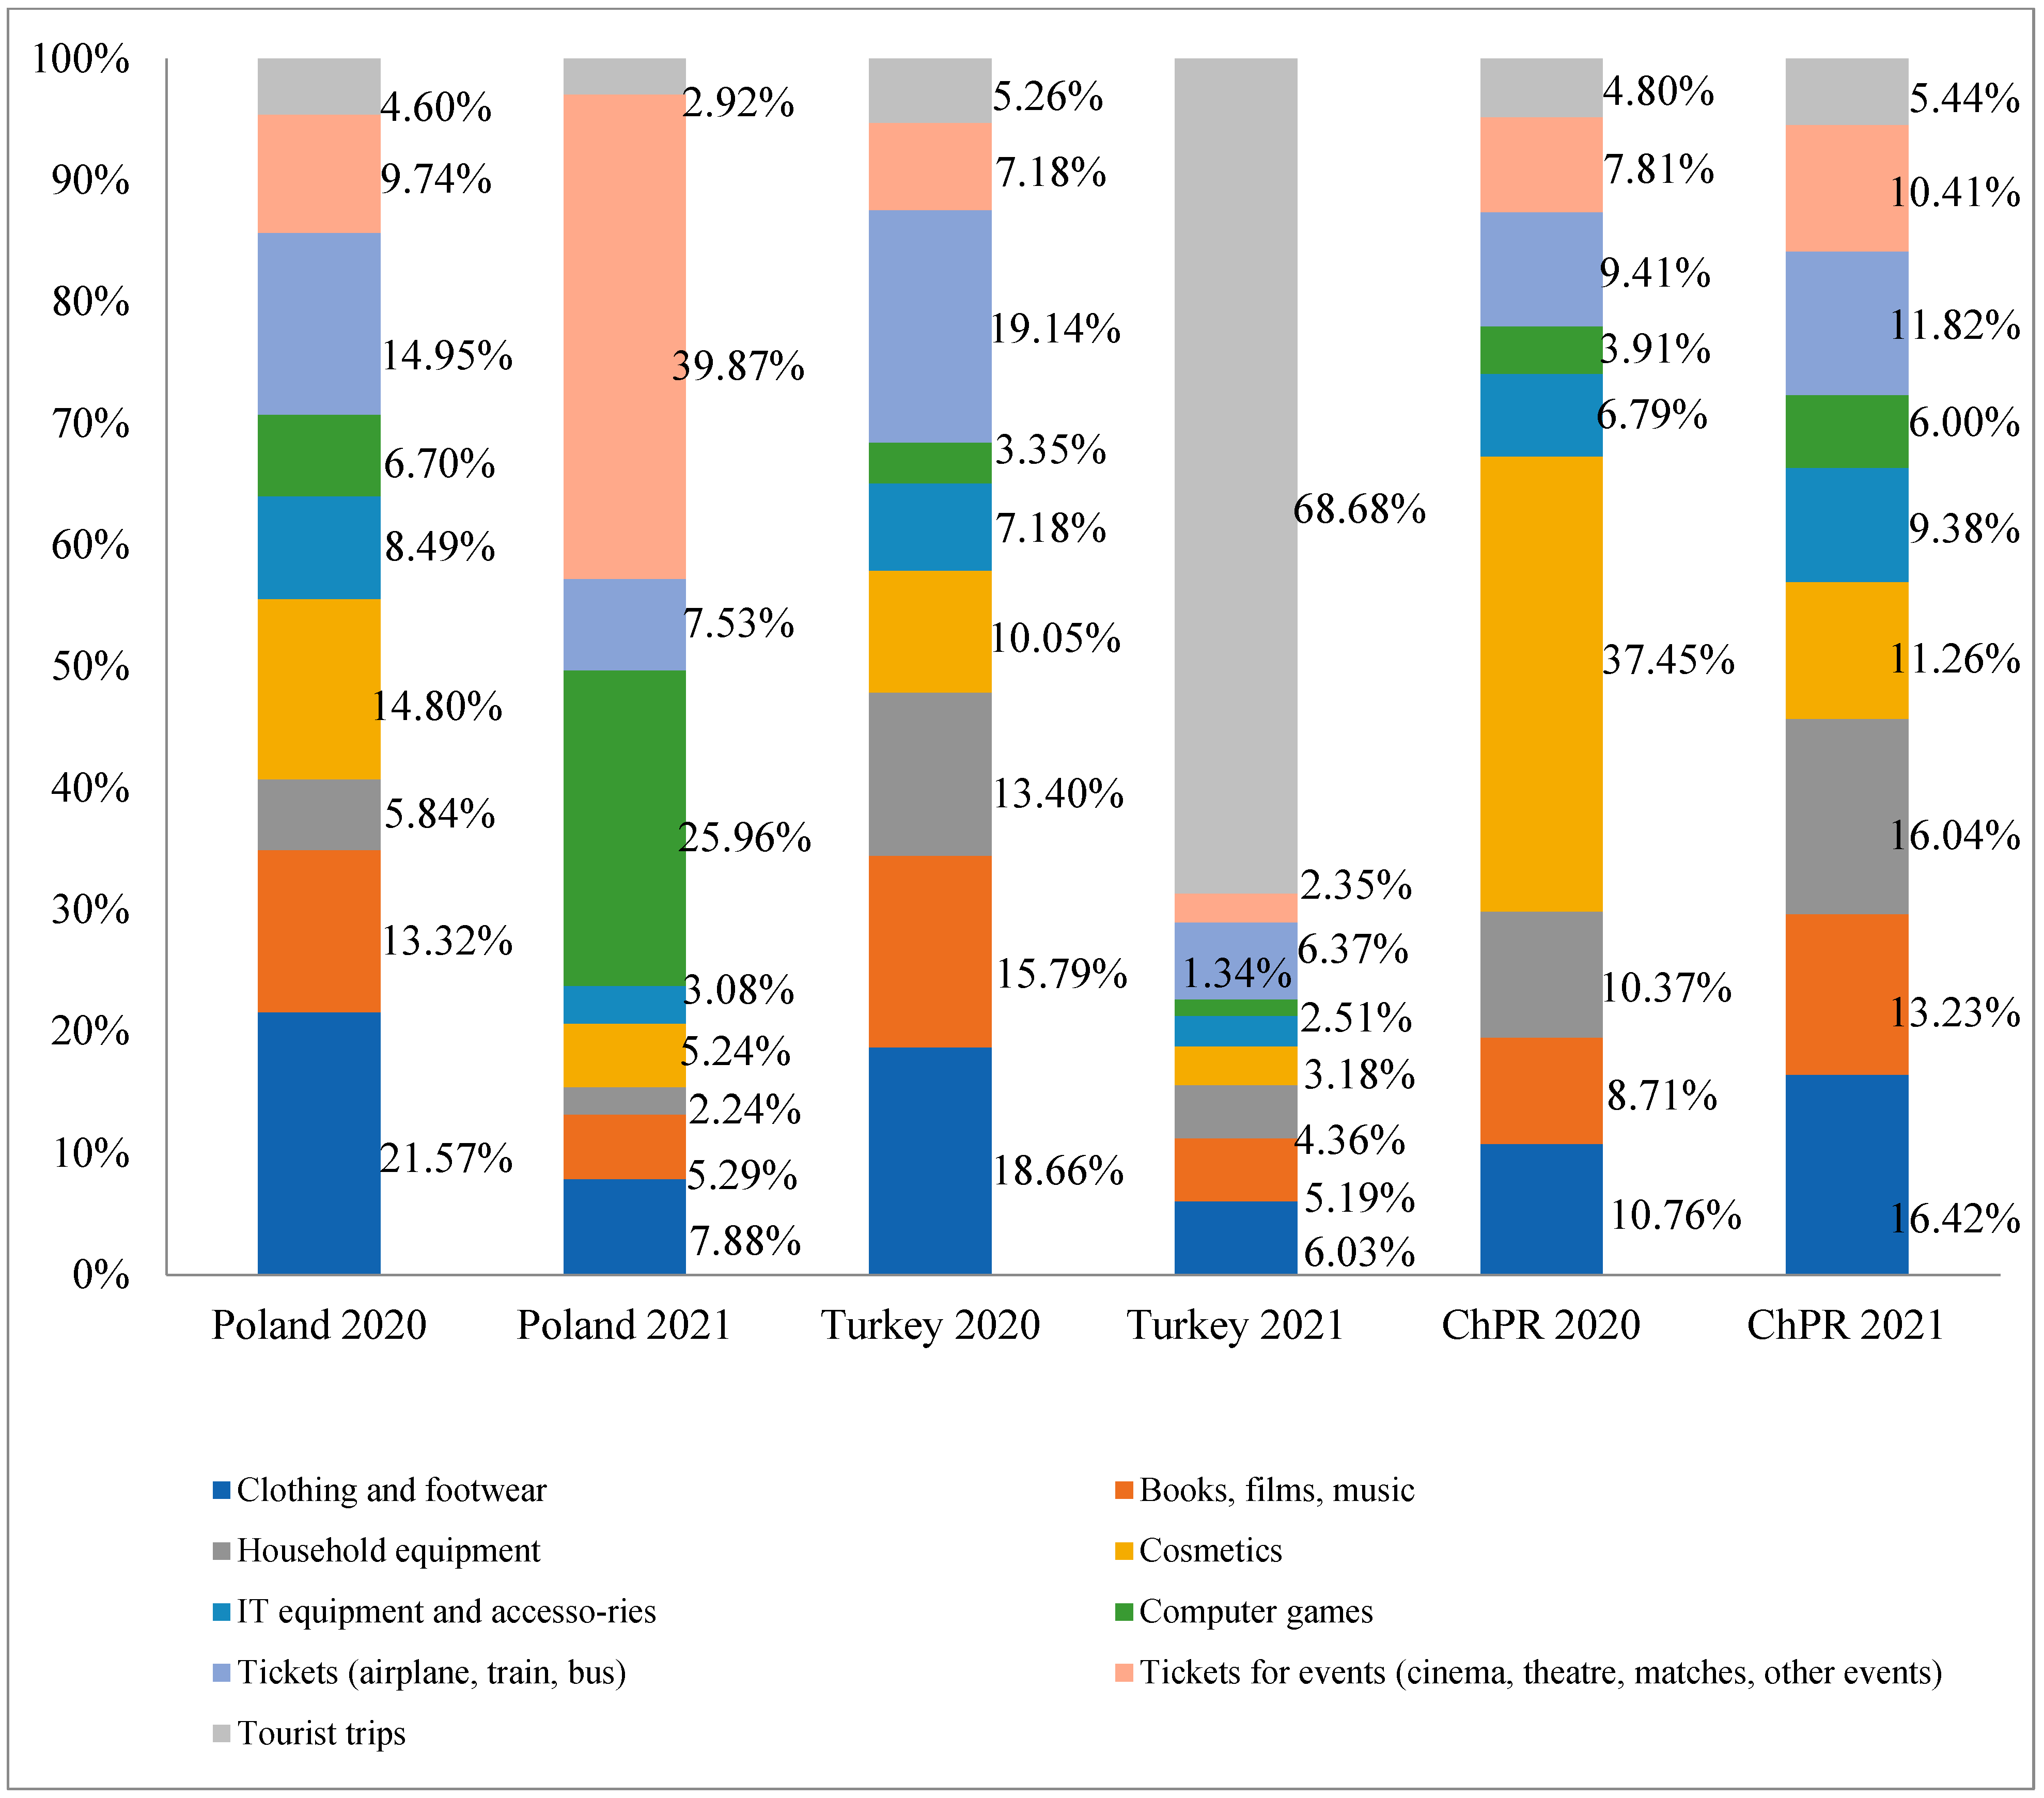
4.3. Sectors and Functions That Used I-Commerce and M-Commerce Tools before and during a Pandemic

The first question in this section concerned the types of products/services that were purchased using a mobile device in each country during the first three months of 2020. In Poland, products such as clothing and footwear (22% of responses), transport tickets (car, train, bus 15%) and cosmetics (14%) are generally purchased in this way. A similar structure of purchases is found in Turkey, where transport tickets are first (19%), followed by clothing and footwear (almost 19%). In the PRC, cosmetics are in the first place (37%), followed by clothing and footwear (11%), and household appliances (10%). In Poland, household appliances are mainly purchased using traditional devices (laptops), due to the greater safety of such purchases, as perceived by the respondents. The biggest differences are between respondents in Turkey and the PRC (27%) and in Poland and the PRC (23%) in the cosmetics industry. The highest City distance (57%) is found in comparisons between Turkey and the PRC.
The above results are not supported by the statistics of product/service purchases made with the use of mobile devices during the first three months of 2021, that is during the COVID-19 pandemic. Only the PRC shows a somewhat similar pattern of purchases with clothing and footwear (16%), household appliances (16%) and cosmetics (11%). Additionally, respondents in the PRC admitted to purchasing books, movies and music in this way (13% share in spending). In Poland, the largest amount of money spent (40%) involving mobile transactions was recorded in terms of tickets for events (cinema, theater, match, other), followed by computer games (25%). In Turkey, mobile devices and applications were mainly used to pay for tourist trips (69%).
The highest City distance occurs between data from Poland and Turkey (136%), primarily due to differences in tourist trips (66% difference) and the category of computer games (24%). It is not far behind the difference index between Turkey and the PRC (127%), due to tourist trips (63%) and household appliances 12%.
The results concerning the structure of the m-commerce purchases before and during the COVID-19 pandemic are shown in Figure 1.
The next question included in the survey addressed the problem of reluctance to purchase selected products/services using a mobile device. Before the pandemic (first months of 2020), respondents would not buy transport tickets (plane, train, bus—33%), tickets for events (cinema, theater, match, other—30%) and household appliances (10%) via mobile devices in Poland. In Turkey, the same was true mainly for tourist trips (14%) and tickets for events (cinema, theater, match, other—14%). In the PRC—for computer games (20%), cosmetics (14%) and IT equipment and accessories (14%).
The largest difference (City distance—101%) occurred between Poland and the PRC, mainly due to differences in resigning from buying computer games (16% difference), transport tickets (plane, train, bus—25%) and tickets for events (cinema, theater, match, other events) 25%. The remaining differences are much smaller.
During the COVID-19 pandemic period (the first three months of 2021), respondents would not make mobile purchases of tourist trips (an average of 15% of responses) and computer games (14%). However, the distribution of preferences varies from country to country. In Poland, 23% of the respondents would not buy household appliances and 18% of them would not buy tourist trips. In Turkey, the survey participants would not buy all kinds of tickets for cultural events and trips (13% each) and tourist trips (also 13% of responses) using their mobile devices. In the PRC, the surveyed individuals said that they would not buy computer games (21%), tourist trips 13% or computer equipment and accessories (13%) via a mobile phone. The greatest discrepancy in this regard occurred between respondents from Poland and Turkey—City distance—45%. In this category, all differences were not as large as in previous questions.
Before the COVID-19 pandemic (first three months of 2020), respondents used desktop devices to buy transport tickets (plane, train, bus) and clothing and footwear (14% of responses on average). In Poland in particular, the main focus was on cosmetics (18%), books, films and music (16%) and transport tickets (plane, train, bus—13%). In Turkey, it was mainly—clothing and footwear (18%) and transport tickets (plane, rail, bus—17%). In the PRC, the respondents chose to buy clothing and footwear (16%) and household appliances (15%) using their standard desktop devices.
The greatest differences occurred between the ratings of respondents from Poland and Turkey (City distance of 38%), mainly due to differences in the category of clothing and footwear in favor of Turkey and cosmetics in favor of Poland.
The purchases made during the first months of 2021 by traditional devices differed somewhat from those made prior to the COVID-19 pandemic. In general, the most popular purchases in the three countries analyzed were clothing and footwear (18%) and transport tickets (plane, train, and bus tickets, an average of 14%). Although clothing and footwear were ranked first in all three countries, in the PRC purchases of household appliances were second (14%) and transport tickets were only third. The largest differences in terms of City distance were between Poland and Turkey (19%), mainly due to differences in the purchase of household appliances (6%) and tickets for cultural events (4%).
The results of the structure of the purchases by traditional devices before and during the COVID-19 pandemic are shown in Figure 2.
The products/services that the respondents would not have purchased through traditional devices before the COVID-19 pandemic (in the first three months of 2020) were mainly household appliances (15% of the responses) and cosmetics (12%). However, the preferred products/services were different in each country. In Poland, they included household appliances (22%) and cosmetics (15%); in Turkey, clothing and footwear (14%) and books, films, music (13%), in the PRC, the products preferred products included computer games (14%) and cosmetics (11%). The greatest differences occurred between the results obtained in Poland and Turkey—the calculated City distance amounted to 44%, mainly due to differences in purchases of household appliances (11%) and books, films and music (9%).
Products/services that respondents from the three analyzed countries would not buy in the first three months of 2021 were mainly tourist trips (13% of the responses on average) and household appliances (13% on average). In Poland, respondents would not buy home appliances (20% of responses) and tourist trips (18%), in Turkey—clothing and footwear (13%), books, films and music (13%) and transport tickets (13%), in the PRC the survey participants would not buy computer games (14%) and hardware, IT accessories (11%).
The biggest difference occurred between Poland and Turkey: the City distance amounted to 19%, mainly in relation to household appliances.

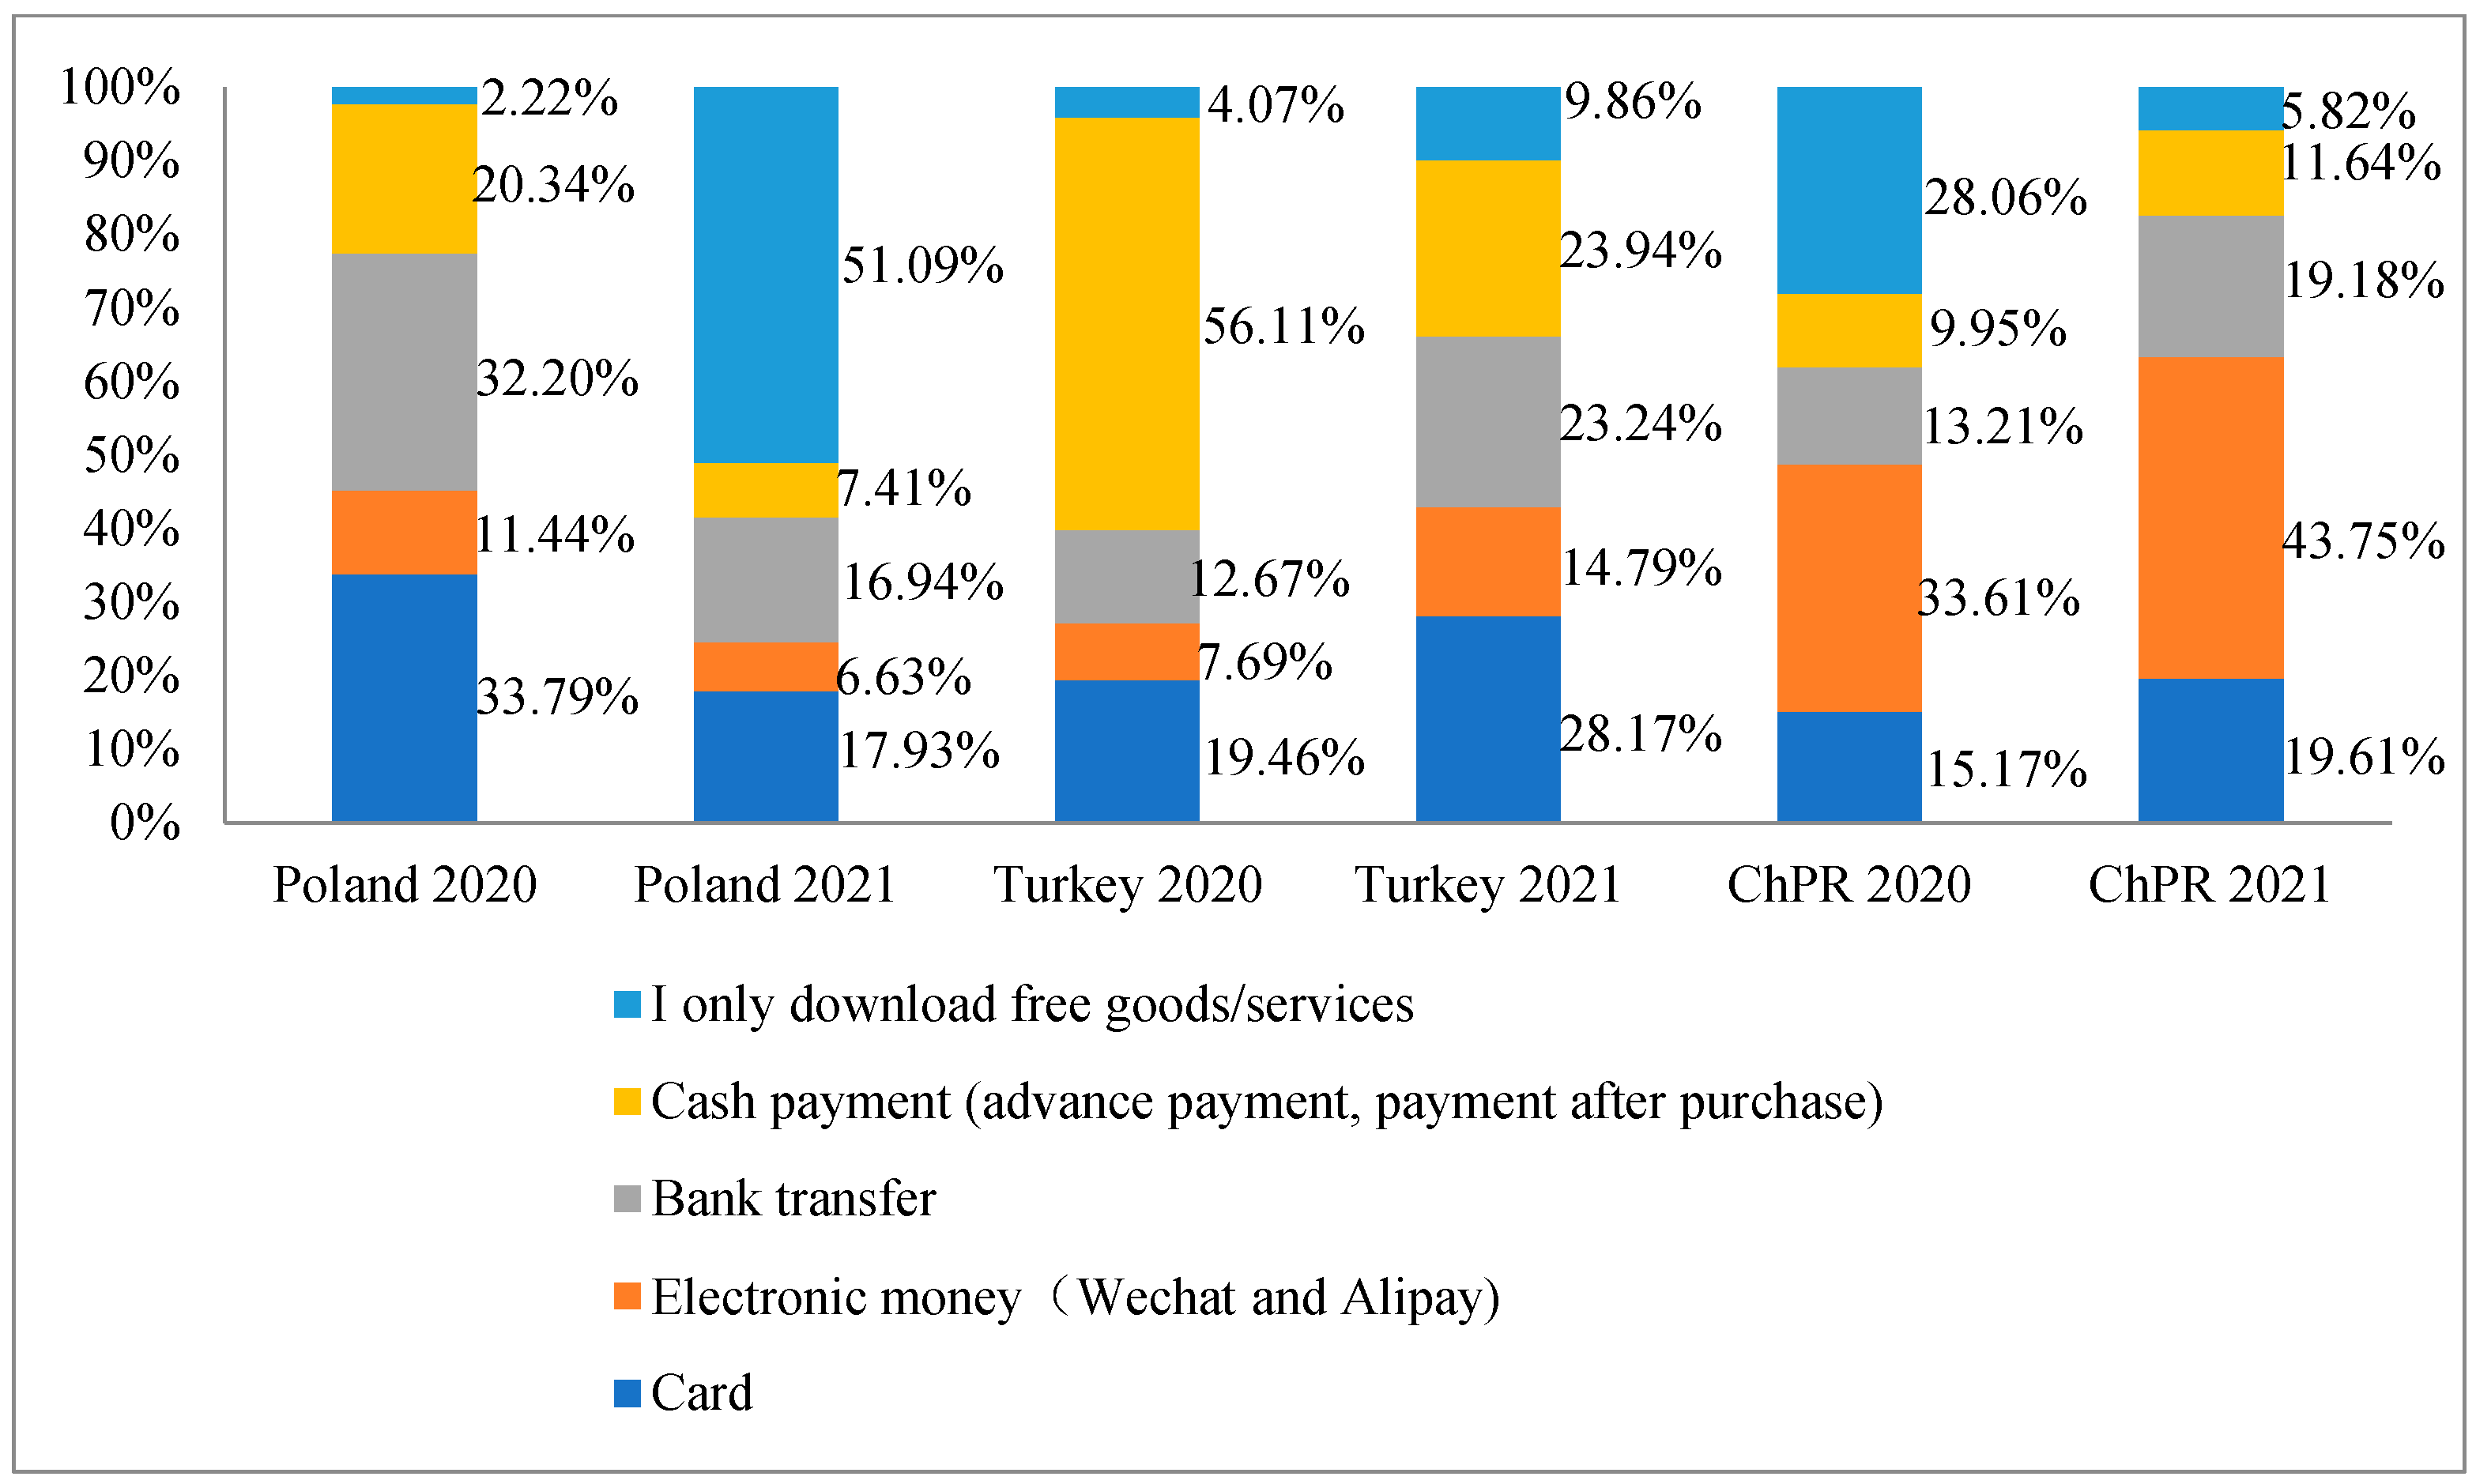
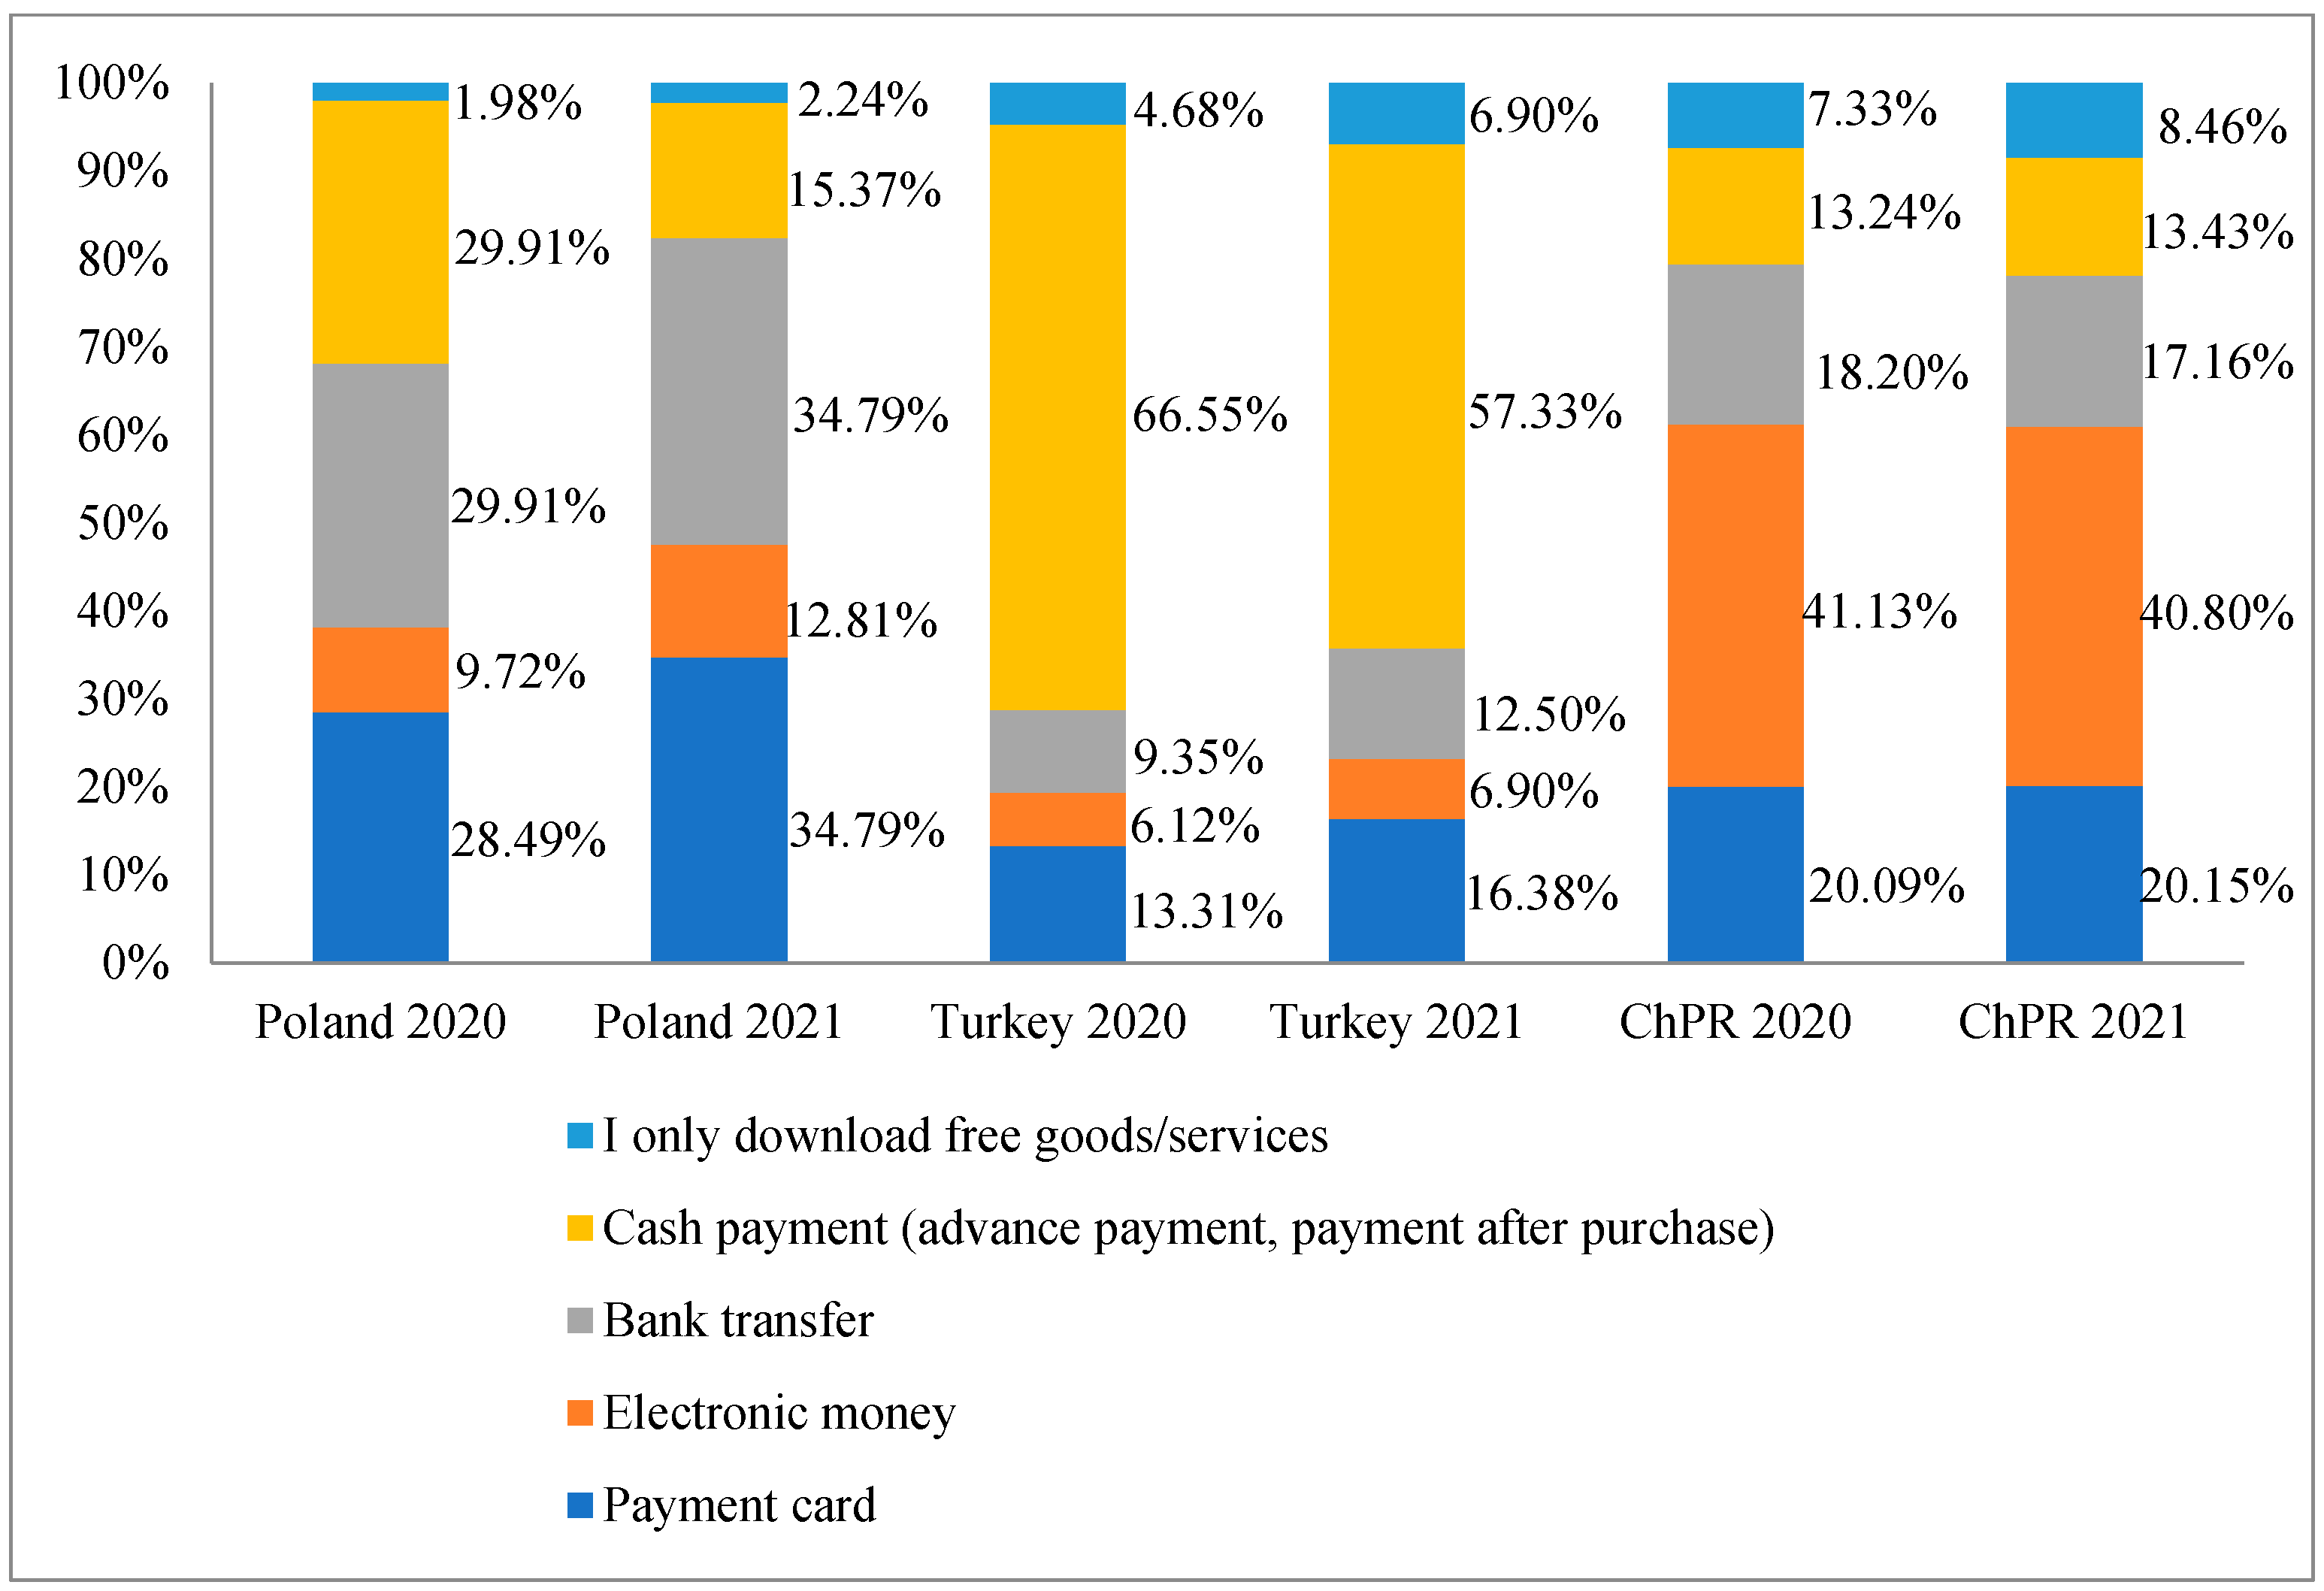
4.4. Methods of Payment and Delivery Regarding E-Commerce Products/Services

Before the COVID-19 pandemic, in the first three months of 2020, respondents in the three analyzed countries used mainly cash (29% of responses on average) and cards (23% on average) when making mobile transactions. In Poland, card payments (34%) and bank transfers (32%) came first, due to the then weak e-money market and the high level of security of bank transfers. In Turkey—in addition to card payments (19%), cash payments were preferred (prepayment, payment after purchase, etc.—56%). In the PRC, e-money payments prevailed (34%), and in addition to that 28% of respondents supported the option I only downloaded free products/services.
The highest level of City distance occurred between Turkey and the PRC, mainly due to the use of e-money in the PRC (the sum of the absolute value of differences amounted to 26%) and cash in Turkey (46%). The differences between the results obtained from Poland and the PRC were slightly smaller (96%), which resulted from a 26% difference in the category of downloading only free products/services and a 22% difference in the category of e-money.
In the first three months of 2021, i.e., during the COVID-19 pandemic, respondents downloaded only free products/services (22% on average), used card payments (22% on average), and electronic money (22% on average). What has changed in this period is the structure of payments across countries. In Poland, 51% of the respondents chose only free products/services in addition to pre-pandemic card payments (now 18%) and bank transfers (now 17%). In Turkey, in addition to cash and card payments, bank transfers have gained a strong position with 23% and the responses regarding electronic money amounted to 15%. In China—downloading free products and services and e-money were extended to include card payments (20%) and bank transfers (19%). The highest City distance was observed between Poland and the PRC (91%) due to differences in downloading only free products/services, this time to the advantage of Poland, and e-money (37%), still to the advantage of the PRC. Large differences were also identified between Poland and Turkey (42%) in downloading only free products/services and cash transactions (17%). The main difference between Turkey and the PRC is in the more frequent use of e-money in the PRC (29%).
The results obtained regarding the payment structure when using mobile devices before and during the COVID-19 pandemic are shown in Figure 3.
Before the COVID-19 pandemic (first months of 2020), transactions on traditional devices were mainly carried out using cash (on average 37% of responses) and cards (average of 21%). However, the distribution of the payments used varied by country. In Poland, it was cash (30%), bank transfers (almost 30%) and card payments (28%). In Turkey, the payment transactions involved mainly cash (67%) and cards (13%). In the PRC, the respondents used electronic money (41%) and cards (20%). The biggest differences, expressed by means of City distance, occurred between Turkey and the PRC 107%, and they were mainly due to cash forms (53%) and electronic money (21%).
During the COVID-19 pandemic, transactions on traditional devices for the first months of 2021 were mainly made using cash (57% on average) and cards (24% on average). In Poland it was mainly done by bank transfer (35%) and cards (also 35%), in Turkey, respondents used cash (57%) and cards (16%), in PRC respondents used e-money (41%) and cards (20%). The biggest differences were recorded between Turkey and the PRC (City distance—101%). It was due to the popularity of cash transactions in Turkey (46%) and e-money operations that prevailed in the PRC (26% difference).
The results concerning the payment forms involved in transactions via traditional devices before and during the COVID-19 pandemic are shown in Figure 4.

4.5. Other E-Commerce-Related Information during the Pandemic Period

Before the COVID-19 pandemic in the first months of 2020, in all transactions surveyed consumers preferred delivery via a specialized delivery company (22% on average) and via a parcel locker (18%): in Poland, mainly through a parcel locker (26% of the responses) and using the services of a specialized delivery company (22%); in Turkey—by postal collection (22%) and by a specialized delivery company (22%); and in the PRC via a specialized delivery company (22%) and via retailer’s transport (21%). The differences between individual countries are relatively small here, the biggest being between Poland and Turkey (City distance—39%).
Similarly to before the pandemic, during the pandemic the preferred option in all transactions was a specialized delivery company (22% on average) and a parcel locker (21%). In Poland, little has changed with the option of a parcel locker (32%) and specialized delivery company (24%) being the most important. Similar situations were observed in Turkey and the PRC, and there were insignificant changes in both countries. The differences between individual countries were small, with the highest difference between Poland and Turkey (50%).
In m-commerce, carried out using both the website and mobile apps before the pandemic, respondents preferred the use of a specialized delivery company (22% on average) and the retailer’s transport (19% on average). In Poland, they expressed a preference for using parcel locker (26%) and the services of a specialized delivery company (23%), in Turkey and China using the services of a specialized delivery company (average 21%) and using retailer’s transport (average 21%). The differences—as before—were not significant—and reached at most 50%.
The same case considered during the COVID-19 pandemic yields very similar results. City distance indicators are also very similar, both overall and regionally.

5. Discussion of Results

To compare the results, a summary table has been constructed, and it contains the questions and the values of the City distance indicators calculated for pairs of individual countries: Poland and Turkey, Poland and the PRC, and Turkey and the PRC (see Table 2).
A comparison in terms of differences in individual criteria between Poland and Turkey shows the greatest differences of more than 100%, occurring in the assessment of the following criteria:
  • Mobile purchases of specific products/services during the pandemic,
  • The type of devices used to shop online (traditional (online)/mobile/both),
  • The type of payment used on mobile devices during the pandemic.
The smallest differences, five-times smaller (on average 19%), were observed in the following categories:
  • Traditional online purchases of specific products/services during the pandemic, [38],
  • Products/services that one cannot buy online during the pandemic,
  • The impact of the pandemic on the change of the device that the respondents use to access the Internet [39].
The comparison between Poland and the PRC produced the following results. The biggest differences were noticed in the following categories:
  • The type of device used to shop online (traditional (online)/mobile/both),
  • Mobile purchases of specific products/services made during the pandemic,
  • The relevance of the main functions of websites and mobile applications during the pandemic.
The smallest differences (an average of 17%) occurred in the following categories:
  • Traditional (online) purchases of specific products/services during the pandemic,
  • Specific products/services one did not buy online using traditional e-commerce solutions before the pandemic,
  • Specific products/services that one did not buy online using traditional e-commerce solutions during the pandemic.
The comparison between Turkey and the PRC produced the following results. The biggest differences were recorded in the following categories:
  • The convenience of using mobile versus traditional online devices during the pandemic [40],
  • Mobile purchases of specific products/services during the pandemic,
  • Mobile purchases of specific products/services that the respondents would not buy before the pandemic.
The smallest differences (an average of 22%) occurred in the following categories:
  • Traditional online purchases of specific products/services prior to the pandemic,
  • Specific products/services that the respondents would not buy online (traditionally) during the pandemic [41],
  • The primary device used to access the Internet.
An overview of the differences between the individual countries shows especially large differences with respect to traditional devices. In general, three basic trends emerge:
  • E-commerce transactions are carried out using both traditional (PC, desktop computer) and mobile (smartphone, tablet) devices, depending on the product/service. There is also a tendency to reduce the role of both desktop computers and tablets. Such a trend is mainly visible in Poland, which is also shown by statistical data [11,21,22,28],
  • The use of primarily mobile devices, mainly smartphones and mobile applications and electronic payments integrated with them. This trend is mainly recorded in the PRC [35,36,42],
  • An intermediate solution, where for economic reasons and situational necessity (COVID-19 pandemic), consumer trends are shaped similarly to the Chinese model of consumer behavior on the Internet, simultaneously, the solutions are adapted to the previously applied (in relation to the time before the pandemic) ways of using e-commerce—such a situation can be observed in Turkey [43,44].
These tendencies result primarily from:
  • Cultural differences and related customs in traditional online i-commerce, especially in Turkey [45,46],
  • Centralized, accessible to all, highly developed electronic payment and courier delivery system in the PRC, which was developed even before the pandemic and accelerated and strengthened local m-commerce during the COVID-19 pandemic and renewed the place and role of electronic money in e-commerce during that time [35,36,47],
  • The phenomenon of live streaming in e-commerce is growing rapidly in the PRC and the U.S., followed by the worldwide value of this form of sales by about US $60 billion per year. In the PRC, it is estimated that 560 million people used live streaming for e-commerce in 2020 [42,48],
  • Asymmetries in the development of specific industries and their treatment during the COVID-19 pandemic—many small and medium-sized stores were mostly open during the pandemic, limiting e-commerce in this sector [49],
  • Variations in payment methods—the adoption of different security strategies resulted, for example, in the development of pre-pandemic bank transfer systems in Poland, and electronic payment systems in the PRC [35,36],
  • The disparity in economic and population development—it is easier to introduce mass mobile commerce than online commerce in large populations [42]; it is easier to introduce e-commerce based on differentiated forms of communication in smaller and/or economically developed countries [49],
  • Organizational differences in restrictions related to the COVID-19 pandemic: duration of lockdowns and social distancing in houses and homes (specific areas), accessibility to stores (number of people, number of people per store area, restrictions or bans to enter branch stores or service establishments, etc.),
  • The distinctive nature of the governmental policies and economic strategies of the state administration,
  • External conditions (international trade and services) with a variable frequency of formal restrictions [50].
There occurred a certain problem concerning the analyses in this paper, namely the averaging of consumer behaviour and consumer approach to e-commerce before and during the pandemic period. However, comparisons and analyses of this relationship will be the subject of the authors’ next article.

6. Conclusions

The main objective of the current phase of the study was to identify differences in e-commerce, both traditional online and mobile solutions, in the analyzed countries characterized by distant geographical locations, different cultures and varying levels and stages of economic development.
The survey and the resulting analyses showed fundamental differences in the distinguished twenty-four criteria that were formulated in order to assess the development of online and mobile commerce. Significant differences were shown in almost all analyzed criteria by calculating the City distance indices as the sum of the absolute values of the differences between the assessments of respondents from each country and disproving the hypothesis concerning their absence. The hypothesis was verified by calculating the inverse Fisher–Snedecor test for each criterion based on the ratings of the subcriteria in the given criterion and for the whole set of criteria. The critical values of the Fisher–Snedecor test were determined based on the probability (0.95) and the assumed degrees of freedom of the differences between the analyzed countries for each criterion. The critical values were then compared with those obtained from the calculations made based on the respondents’ assessment of the individual sub-criteria.
Significant differences occur in 64% of responses to the selected questions (evaluation criteria) (calculated p > α), which indicates a significant differentiation in e-commerce between the analyzed countries and proves that the hypothesis H0 about the lack of differentiation for individual indicators did not hold. Moreover, considering the entire set of criteria, it proved correct only in relations between Poland and Turkey, which in the case of these two countries may indicate the similarity between the assessments of the analyzed criteria. In the remaining cases, the hypothesis regarding similarity in the use of e-commerce was disproved (See: Table 2).
The survey carried out as part of the study had two primary limitations. The first limitation was the fact that it was conducted only among the representatives of the academic community. However, it is important to note that this is the population that is most active in online activities in all the analyzed countries; on the other hand, this group is also interested in using free products/services.
A second limitation was the fact that the presented findings apply to the situation of direct, survey-based comparisons of individual country results or differences between countries. However, based on the survey and the data obtained in this way, interesting conclusions can be drawn about other platforms of international comparison. Survey results in other cross-sections:
  • Regarding the differences in e-commerce product/service sales to individual customers in the three countries analyzed before and during the COVID-19 pandemic; and
  • Sales on mobile versus desktop devices along with the resulting differences will be described in subsequent articles.
The considerations presented above determine directions of further research, which should be extended to include also other social groups and structural studies in terms of dynamics and directions of the observed phenomena, i.e., the comparison of customer behavior in the period before the pandemic, during the pandemic and after the pandemic period.

Author Contributions

Conceptualization, W.C., M.Z., X.J., M.A. and J.S.; methodology, W.C., M.Z., X.J., M.A. and J.S.; software, W.C., M.Z., X.J., M.A. and J.S.; validation, W.C., M.Z., X.J., M.A. and J.S.; formal analysis, W.C., M.Z., X.J., M.A. and J.S.; investigation, W.C., M.Z., X.J., M.A. and J.S.; resources, W.C., M.Z., X.J., M.A. and J.S.; data curation, W.C., M.Z., X.J., M.A. and J.S.; writing—original draft preparation, W.C., M.Z., X.J., M.A. and J.S.; writing—review and editing, W.C., M.Z., X.J., M.A. and J.S.; visualization, W.C., M.Z., X.J., M.A. and J.S.; supervision, W.C., M.Z., X.J., M.A. and J.S.; project administration, W.C., M.Z., X.J., M.A. and J.S.; funding acquisition, W.C., M.Z., X.J., M.A. and J.S. All authors have read and agreed to the published version of the manuscript.

Funding

This research received no external funding.

Institutional Review Board Statement

Not applicable.

Informed Consent Statement

Not applicable.

Data Availability Statement

Not applicable.

Conflicts of Interest

The authors declare no conflict of interest.

References

  1. Becker, A.; Tian, Y.; Stewart, C. History of E-Commerce. In Electronic Commerce: Concepts, Methodologies, Tools, and Applications; Information Science Reference: Melbourne, Australia, 2008; Volume 1, pp. 1–8. ISBN 978-1-59904-944-1. [Google Scholar]
  2. Savrul, M.; Kılıç, C. E-Commerce as an Alternative Strategy in Recovery from the Recession. Procedia Soc. Behav. Sci. 2011, 24, 247–259. [Google Scholar] [CrossRef] [Green Version]
  3. Turban, E.; Pollard, C.; Wood, G. Information Technology for Management: Driving Digital Transformation to Increase Local and Global Performance, Growth and Sustainability, 12th ed.; John Wiley & Sons: Hoboken, NJ, USA, 2021; ISBN 978-1-119-70290-0. [Google Scholar]
  4. Laudon, K.; Traver, C. E-Commerce 2020–2021: Business, Technology and Society, Global Edition, 16th ed.; Pearson Education Limited: New York, NY, USA, 2020. [Google Scholar]
  5. Fuchs, C. Theoretical Foundations of Defining the Participatory, Co-Operative, Sustainable Information Society. Inf. Commun. Soc. 2010, 13, 23–47. [Google Scholar] [CrossRef] [Green Version]
  6. Edward Freeman, R. Managing for Stakeholders: Trade-Offs or Value Creation. J. Bus. Ethics 2010, 96, 7–9. [Google Scholar] [CrossRef]
  7. Information Technology (IT) Glossary—Essential Information Technology (IT) Terms & Definitions. Available online: https://www.gartner.com/en/information-technology/glossary (accessed on 16 April 2022).
  8. How COVID-19 Triggered the Digital and e-Commerce Turning Point. Available online: https://unctad.org/news/how-covid-19-triggered-digital-and-e-commerce-turning-point (accessed on 17 March 2022).
  9. Gössling, S.; Scott, D.; Hall, C.M. Pandemics, Tourism and Global Change: A Rapid Assessment of COVID-19. J. Sustain. Tour. 2021, 29, 1–20. [Google Scholar] [CrossRef]
  10. Wang, X.; Wong, Y.D.; Qi, G.; Yuen, K.F. Contactless Channel for Shopping and Delivery in the Context of Social Distancing in Response to COVID-19 Pandemic. Electron. Commer. Res. Appl. 2021, 48, 101075. [Google Scholar] [CrossRef]
  11. E-Commerce in Europe. Available online: https://www.postnord.se/en/business-solutions/e-commerce/e-commerce-reports/e-commerce-in-europe (accessed on 16 March 2022).
  12. Wang, B.; Liu, Y.; Qian, J.; Parker, S.K. Achieving Effective Remote Working During the COVID-19 Pandemic: A Work Design Perspective. Appl. Psychol. 2021, 70, 16–59. [Google Scholar] [CrossRef]
  13. Hilty, L.M.; Hercheui, M.D. ICT and Sustainable Development. In Proceedings of the What Kind of Information Society? Governance, Virtuality, Surveillance, Sustainability, Resilience, Brisbane, Australia, 20–23 September 2010; Berleur, J., Hercheui, M.D., Hilty, L.M., Eds.; Springer: Berlin/Heidelberg, Germany, 2010; pp. 227–235. [Google Scholar]
  14. Gerlich, M. COVID-19 Induced Changes in Consumer Behavior. Open J. Bus. Manag. 2021, 9, 2425–2451. [Google Scholar] [CrossRef]
  15. He, W.; Zhang, Z.; Li, W. Information Technology Solutions, Challenges, and Suggestions for Tackling the COVID-19 Pandemic. Int. J. Inf. Manag. 2021, 57, 102287. [Google Scholar] [CrossRef]
  16. Tarasiuk, W.; Dłużniewska, J. Wpływ pandemii COVID-19 na rozwój sektora e-commerce w Polsce. Akad. Zarządzania 2021, 5, 14. [Google Scholar]
  17. Chmielarz, W.; Parys, T.; Szumski, O.; Zborowski, M. The Impact of the Pandemic (COVID-19) on Globalization—The Perspective of Electronic Commerce. Probl. Zarządzania Manag. Issues 2021, 19, 53–72. [Google Scholar] [CrossRef]
  18. Amsari, S.; Sari, D.P. Consumer Factors in Deciding to Purchase Online at Shopee E-Commerce During the COVID-19 Pandemic. Proc. Int. Semin. Islamic Stud. 2022, 3, 174–182. [Google Scholar]
  19. Zhang, G. The Impact of COVID-19 on China’s E-Commerce. In Proceedings of the IC4E 2021: 2021 12th International Conference on E-Education, E-Business, E-Management, and E-Learning, Tokyo, Japan, 10–13 January 2021; Association for Computing Machinery: New York, NY, USA, 2021; pp. 333–336. [Google Scholar]
  20. Galhotra, B.; Dewan, A. Impact of COVID-19 on Digital Platforms and Change in E-Commerce Shopping Trends. In Proceedings of the 2020 Fourth International Conference on I-SMAC (IoT in Social, Mobile, Analytics and Cloud) (I-SMAC), Palladam, India, 7–9 October 2020; pp. 861–866. [Google Scholar]
  21. Alcedo, J.; Cavallo, A.; Dwyer, B.; Mishra, P.; Spilimbergo, A. E-Commerce during COVID: Stylized Facts from 47 Economies. Int. Monet. Fund Work. Pap. Res. Dep. 2022, WP/22/19, 19. [Google Scholar]
  22. Chevalier, S. COVID-19: In-Store to e-Commerce Switch by Country 2020. Available online: https://www.statista.com/statistics/1105597/coronavirus-e-commerce-usage-frequency-change-by-country-worldwide/ (accessed on 16 April 2022).
  23. Pantelimon, F.-V.; Georgescu, T.M.; Posedaru, B.-S. The Impact of Mobile E-Commerce on GDP: A Comparative Analysis between Romania and Germany and How COVID-19 Influences the e-Commerce Activity Worldwide. Inform. Econ. 2020, 24, 27–41. [Google Scholar] [CrossRef]
  24. Beaunoyer, E.; Dupéré, S.; Guitton, M.J. COVID-19 and Digital Inequalities: Reciprocal Impacts and Mitigation Strategies. Comput. Hum. Behav. 2020, 111, 106424. [Google Scholar] [CrossRef]
  25. Nguyen, M.H.; Hargittai, E.; Marler, W. Digital Inequality in Communication during a Time of Physical Distancing: The Case of COVID-19. Comput. Hum. Behav. 2021, 120, 106717. [Google Scholar] [CrossRef]
  26. Ziemba, E. Towards a Sustainable Information Society: People, Business and Public Administration Perspectives; Cambridge Scholars Publishing: Newcastle upon Tyne, UK, 2016; ISBN 978-83-7875-114-4. [Google Scholar]
  27. Waizenegger, L.; McKenna, B.; Cai, W.; Bendz, T. An Affordance Perspective of Team Collaboration and Enforced Working from Home during COVID-19. Eur. J. Inf. Syst. 2020, 29, 429–442. [Google Scholar] [CrossRef]
  28. Sirimanne, S.N. COVID-19 and e-Commerce: A Global Review; UNCTAD: Geneva, Switzerland, 2021. [Google Scholar]
  29. Pollák, F.; Konečný, M.; Ščeulovs, D. Innovations in the Management of E-Commerce: Analysis of Customer Interactions during the COVID-19 Pandemic. Sustainability 2021, 13, 7986. [Google Scholar] [CrossRef]
  30. Agus, A.A.; Yudoko, G.; Mulyono, N.; Imaniya, T. E-Commerce Performance, Digital Marketing Capability and Supply Chain Capability within E-Commerce Platform: Longitudinal Study Before and after COVID-19. Int. J. Technol. 2021, 12, 360–370. [Google Scholar] [CrossRef]
  31. Sardjono, W.; Selviyanti, E.; Mukhlis, M.; Tohir, M. Global Issues: Utilization of e-Commerce and Increased Use of Mobile Commerce Application as a Result of the COVID-19 Pandemic. J. Phys. Conf. Ser. 2021, 1832, 012024. [Google Scholar] [CrossRef]
  32. Ando, M.; Hayakawa, K. Impact of COVID-19 on Trade in Services. Jpn. World Econ. 2022, 62, 101131. [Google Scholar] [CrossRef]
  33. Hodbod, A.; Hommes, C.; Huber, S.J.; Salle, I. The COVID-19 Consumption Game-Changer: Evidence from a Large-Scale Multi-Country Survey. Eur. Econ. Rev. 2021, 140, 103953. [Google Scholar] [CrossRef]
  34. Beckers, J.; Weekx, S.; Beutels, P.; Verhetsel, A. COVID-19 and Retail: The Catalyst for e-Commerce in Belgium? J. Retail. Consum. Serv. 2021, 62, 102645. [Google Scholar] [CrossRef]
  35. Gao, X.; Shi, X.; Guo, H.; Liu, Y. To Buy or Not Buy Food Online: The Impact of the COVID-19 Epidemic on the Adoption of e-Commerce in China. PLoS ONE 2020, 15, e0237900. [Google Scholar] [CrossRef] [PubMed]
  36. Guo, H.; Liu, Y.; Shi, X.; Chen, K. The Role of E-Commerce in the Urban Food System under COVID-19: Lessons from China. China Agric. Econ. Rev. 2021, 13, 436–455. [Google Scholar] [CrossRef]
  37. Hinton, P.R.; McMurray, I.; Brownlow, C. SPSS Explained, 1st ed.; Routledge: London, UK, 2004; ISBN 978-0-415-27409-8. [Google Scholar]
  38. Çebi Karaaslan, K. Determinants of Online Shopping Attitudes of Households in Turkey. J. Model. Manag. 2022, 17, 119–133. [Google Scholar] [CrossRef]
  39. Öztürk, S.P. The Era of Digital Transformation: Visualizing the Geography of e-Commerce Usage in Turkey. Environ. Plan. A 2021, 53, 1241–1243. [Google Scholar] [CrossRef]
  40. Mensah, I.K.; Liu, Y.; Luo, C. Factors Influencing the Continued Acceptance of Wechat Mobile Payments by Chinese Vendors. Inf. Resour. Manag. J. 2021, 34, 28–47. [Google Scholar] [CrossRef]
  41. Ünver, Ş.; Alkan, Ö. Determinants of E-Commerce Use at Different Educational Levels: Empirical Evidence from Turkey e-Commerce Use at Different Educational Levels. Int. J. Adv. Comput. Sci. Appl. 2021, 12, 40–49. [Google Scholar] [CrossRef]
  42. Greenwald, M. Live Streaming E-Commerce Is the Rage in China. Is the U.S. Next? Available online: https://www.forbes.com/sites/michellegreenwald/2020/12/10/live-streaming-e-commerce-is-the-rage-in-china-is-the-us-next/ (accessed on 16 April 2022).
  43. Chmielarz, W.; Zborowski, M.; Fandrejewska, A.; Atasever, M. The Impact of E-Commerce on Globalization Processes: Comparison of Poland and Turkey. Eur. Res. Stud. J. 2021, XXIV, 682–698. [Google Scholar] [CrossRef]
  44. Peng, C.; Ma, B.; Zhang, C. Poverty Alleviation through E-Commerce: Village Involvement and Demonstration Policies in Rural China. J. Integr. Agric. 2021, 20, 998–1011. [Google Scholar] [CrossRef]
  45. Ling Ge, Y. Research on the Influence of Mobile E-Commerce Webcast on Users’ Online Shopping Intentions. In Proceedings of the ICEMC ‘21: 2021 the 6th International Conference on E-Business and Mobile Commerce, Seoul, Korea, 27–29 May 2021; pp. 24–31. [Google Scholar]
  46. Huang, Y. Influence of Cultural Differences on the Establishment of Consumer Trust in a Socialized Cross-Border E-Commerce. Mob. Inf. Syst. 2022, 2022, 9952335. [Google Scholar] [CrossRef]
  47. Huang, L.; Huang, Y.; Huang, R.; Guojie, X.; Cai, W. Factors Influencing Returning Migrants’ Entrepreneurship Intentions for Rural E-Commerce: An Empirical Investigation in China. Sustainability 2022, 14, 3682. [Google Scholar] [CrossRef]
  48. Dong, X.; Zhao, H.; Li, T. The Role of Live-Streaming E-Commerce on Consumers’ Purchasing Intention Regarding Green Agricultural Products. Sustainability 2022, 14, 4374. [Google Scholar] [CrossRef]
  49. Chmielarz, W.; Zborowski, M.; Fandrejewska, A.; Atasever, M. Poland–Turkey Comparison of Mobile Payments Quality in Pandemic Time. J. Risk Financ. Manag. 2021, 14, 426. [Google Scholar] [CrossRef]
  50. Dumanska, I.; Hrytsyna, L.; Kharun, O.; Matviiets, O. E-Commerce and m-Commerce as Global Trends of International Trade Caused by the COVID-19 Pandemic. WSEAS Trans. Environ. Dev. 2021, 17, 386–397. [Google Scholar] [CrossRef]
Figure 1. Structure of m-commerce purchases in Poland, Turkey and the PRC before and during a pandemic.
Sustainability 14 07366 g001
Figure 2. Structure of i-commerce purchases by desktop devices in Poland, Turkey and the PRC before and during the pandemic.
Sustainability 14 07366 g002
Figure 3. Structure of m-commerce payments made via mobile devices in Poland, Turkey, and the PRC before and during the pandemic.
Sustainability 14 07366 g003
Figure 4. Structure of i-commerce payments made by traditional devices in Poland, Turkey and the PRC before and during the pandemic.
Sustainability 14 07366 g004
Table 1. Characteristics of the research sample.
DemographicsPolandTurkeyThe PRC
Gender
Women67.18%54.00%60.56%
Men32.82%46.00%39.44%
Age
>184.65%6.00%9.39%
19–2491.99%80.00%37.09%
25–343.10%14.00%31.46%
35–550.26%0.00%18.31%
55+0.00%0.00%3.76%
Education
Bachelor’s degree, undergraduate10.59%92.00%62.44%
Primary0.78%0.00%0.47%
Secondary87.60%2.00%1.41%
Higher0.52%6.00%32.86%
Basic vocational0.52%0.00%2.82%
Place of origin *
Large city over 200,000 inhabitants (PRC 20+ million)67.18%4.00%36.15%
Large city 51–200 thousand inhabitants (PRC 11–20 million)6.20%16.00%14.55%
Medium city 21–50 thousand inhabitants (PRC 6–10 million)7.49%4.00%18.31%
Small city up to 20,000 inhabitants (PRC up to 5 million)4.65%50.00%12.21%
Village14.47%26.00%18.78%
Specialization
Humanities, including philology, history, cultural studies, art history0.52%2.00%15.02%
Medical0.00%0.00%0.94%
Social sciences, including psychology, sociology, economics, pedagogy, administration, law, management77.30%30.00%48.83%
Science, including mathematics, computer science, physics, chemistry11.11%4.00%13.15%
Natural sciences, including biology, environmental studies, geography0.00%0.00%2.35%
Agricultural, forestry and veterinary0.00%6.00%1.41%
Arts, including music, visual arts, theater0.00%2.00%4.69%
Technical0.00%10.00%2.82%
Other28.42%46.00%11.27%
Respondents’ material situation
Very good (I can afford everything; I can save some money)21.71%2.00%9.86%
Good (I am not complaining, but it could be better)43.67%18.00%41.78%
Sufficient (I still make ends meet)1.03%10.00%4.69%
I am a student; I am not financially independent24.81%30.00%9.39%
Average (I have enough to lead a frugal life)8.53%26.00%33.80%
Bad (I cannot afford basic goods and services)0.26%14.00%0.47%
Professional status
I am a student69.25%86.00%48.36%
I work on a casual basis (contract work/contract of mandate)12.14%2.00%1.41%
I work on a full-time or part-time contract10.59%4.00%38.97%
Other5.68%0.00%0.47%
I am self-employed1.81%4.00%3.76%
I am running a household/raising child0.00%0.00%1.41%
I am unemployed/currently without a permanent job0.26%4.00%1.88%
I am a pensioner0.26%0.00%3.76%
Source: own work based on survey findings. * The PRC data were properly adjusted to match the regionalization typology of the other countries
Table 2. Differences in key indicators between the examined countries.
No.IndicatorCity DistanceFisher-Snedecor Inverse Test for Pairwise Comparisons of Individual Countries
Question/Difference between CountriesPoland-TurkeyPoland-PRCTurkey-PRCPoland-TurkeyPoland-PRCTurkey-PRC
1Frequency of Internet use during the pandemic49.31%67.65%73.09%1.39960.67660.4834
2A basic device used to access the Internet79.76%55.12%32.54%2.04041.71130.8387
3The impact of the pandemic on the change of the device used to access the Internet20.11%54.60%43.55%0.93831.78771.9053
4Change in the frequency of use of the device that the respondent uses to access the Internet during the pandemic42.48%54.73%67.29%1.42581.00650.706
5Frequency of online purchases before the pandemic43.70%58.85%63.77%0.48980.52951.0809
6Changes in shopping frequency during a pandemic37.04%29.12%33.78%1.07351.15951.0802
7Type of device used for online shopping (traditional/mobile/both)93.24%133.07%39.83%0.83191.9012.2852
8Changing role of the showroom during a pandemic61.37%30.16%42.37%1.39960.67660.4834
9Convenience of using mobile devices versus traditional devices during a pandemic73.72%58.44%130.40%2.04041.71130.8387
10Relevance of the main functions of websites and mobile applications during a pandemic28.12%110.29%82.17%0.93831.78771.9053
11Products/services purchased using a mobile channel before the pandemic29.76%57.19%54.78%1.39960.67660.4834
12Products/services purchased using a mobile channel during the pandemic135.74%126.47%98.82%2.04041.71130.8387
13Products/services that the respondent would not buy using a mobile channel before the pandemic76.71%36.26%101.10%0.93831.78771.9053
14Products/services that the respondent would not buy using a mobile channel during the pandemic45.04%32.17%40.45%1.42581.00650.706
15Products/services purchased using a traditional online channel before the pandemic37.67%21.67%34.24%0.48980.52951.0809
16Products/services purchased using a traditional online channel during the pandemic18.56%15.84%17.46%1.07351.15951.0802
17Products/services that the respondent would not buy using a traditional online channel before the pandemic43.87%18.41%34.47%0.83191.9012.2852
18Products/services that the respondent would not buy using a traditional online channel during the pandemic18.56%15.84%17.46%1.39960.67660.4834
19Type of payment used on mobile devices before the pandemic75.23%100.89%96.00%2.04041.71130.8387
20Type of payment used on mobile devices during the pandemic82.46%57.92%90.54%0.93831.78771.9053
21Type of payment used on traditional devices before the pandemic78.67%106.62%73.53%0.19210.55292.878
22Type of payment used on traditional devices during the pandemic75.23%100.89%96.00%3.896816.54244.2451
23Preferences regarding delivery methods for mobile shopping before the pandemic39.18%32.42%33.42%0.16910.63453.7523
24Preferences regarding delivery methods for mobile shopping before the pandemic49.85%30.73%35.89%3.93890.93910.2384
Fisher-Snedecor inverse test values for the analyzed sample of indicators1.63311.18620.7263
Fisher-Snedecor inverse test limits for the sample analyzed1.46791.22451.4866
Source: own work based on calculations.
Publisher’s Note: MDPI stays neutral with regard to jurisdictional claims in published maps and institutional affiliations.

