Article

Hotel Service Analysis by Penalty-Reward Contrast Technique for Online Review Data

1
Department of Big Data Analytics, Graduate School, Kyung Hee University, 24 Kyungheedae-ro, Dongdaemun-gu, Seoul 02453, Korea
2
Department of Business Administration, Graduate School, Kyung Hee University, 24 Kyungheedae-ro, Dongdaemun-gu, Seoul 02453, Korea
3
Department of Business Administration, Kyung Hee University, 24 Kyungheedae-ro, Dongdaemun-gu, Seoul 02453, Korea
*
Authors to whom correspondence should be addressed.
Sustainability 2022, 14(12), 7340; https://doi.org/10.3390/su14127340
Submission received: 7 April 2022 / Revised: 21 May 2022 / Accepted: 10 June 2022 / Published: 15 June 2022
(This article belongs to the Special Issue Sustainable Tourism and Tourist Satisfaction)

Abstract

:
Hotel reviews play an important role in the selection of hotels by travelers. Online travel platforms (e.g., Tripadvisor, Expedia) provide multi-criteria (e.g., room, service, location, sleep quality, etc.) ratings to make it easier for travelers to choose a hotel from reviews. Through penalty-reward contrast analysis (PRCA), this study aims to explore the asymmetric effects of attribute performance (Value, Cleanliness, Location, Rooms, Service, and Sleep Quality) on customer satisfaction with different geographic and cultural backgrounds using review data from hotels in Shanghai, Seoul, and New York. This study compares the asymmetric effects of attribute performance on customer satisfaction of hotels in different cities. At the same time, this study compares the asymmetric effects of attribute performance on customer satisfaction of reviews that are written in English and reviews that are written in the domestic language of hotels in the same city. The findings of this study help hotel managers serve customers from different cultural backgrounds and improve hotel services by identifying the criteria that affect customer satisfaction. As a result, it will be possible to improve the service and profitability of the hotel.

1. Introduction

The integration of information and communication technology in the hotel industry has led to an explosion of e-commerce used for today’s hotel products. Such growth in e-commerce has heightened competition in the hotel industry, yet it has also provided diverse options to hotel customers [1]. In order to secure a competitive advantage in the hotel industry, the enhancement of hotel service quality and its service value are absolutely essential. One of the important roles for hotel managers is therefore to explore which hotel service attribute is of the utmost importance, as failure to pay attention to such quality can give rise to negative reviews of the hotel [2]. As a matter of fact, unlike e-commerce platforms like Amazon and eBay, hotel platforms such as Tripadvisor and Expedia provide not only the overall satisfaction ratings of hotel customers but also the specified feedback on the hotel’s value, cleanliness, service, location, rooms, and sleep quality, which reinforces the need to analyze such attributes [3].
Most of the previous research focused on investigating hotel reviews that were written by travelers from a single city or from the same culture. For instance, Li et al. [4] identified the factors determining hotel customer satisfaction through online review analysis of Beijing hotels listed on the Chinese website called daodao.com. Abbasi et al. [5] studied the effects of hotel service quality and service characteristics on customer satisfaction in four hotels within Pakistan. Jannach et al. [3] revealed that multi-criteria rating information from Taoyuan Hotel is a factor that promotes customer satisfaction in regard to various segments.
However, the evaluation of a hotel differs from one customer to another, considering the geographical locations of hotels and the cultural differences among customers. Prior studies have revealed that approximately 14% of hotel ratings are affected by travel destinations [6]. In addition, culture has a strong influence on customers’ behavior because customers having different cultural backgrounds may have different expectations as well as perceptions of hotel services [7,8]. For example, while there is a cultural prevalence for people to sleep on the floor in certain countries, these customers may have evaluated the sleep quality of the hotel negatively for only providing a bed. Therefore, if hotel managers were to identify the needs of customers who have different geographical and cultural expectations, as well as hotel attributes affecting the overall satisfaction, they can generate better service strategies that can ultimately fulfil hotel customers’ expectations [9]. This study will collect hotel data from three different cities (Shanghai, Seoul, and New York); distinguish tourists from different cultures by referring to the use of language among reviewers; and analyze the differences in the overall hotel customer satisfaction with respect to geographical locations and cultural backgrounds.
Many studies were conducted from the perspective of both symmetrical and asymmetrical effects to classify the properties of hotels affecting customer satisfaction. Most of them have incorporated regression equations and importance-performance analysis (IPA) as methods that are based on the symmetric effect of hotel properties and customer satisfaction. Studies using regression equations are as follows. Kandampully & Suhartanto [1] and Lait et al. [10] contended that service quality and corporate image have a positive effect on customer satisfaction, while Lait et al. [11] argued that service recovery and service quality are the ones that generate a positive effect on customer satisfaction. Research using IPA has delineated both the importance and the achievement of hotel properties in a two-dimensional grid, grouping them into four domains as follows: “low priority” (low importance and low performance), “possible overkill” (low importance and high performance), “keep up the good work” (high importance and high performance), and “concentration here” (high importance and low performance). However, IPA has a linear problem in which important attributes are also high in performance. Therefore, some researchers have propounded that the relationship between hotel properties and customer satisfaction has an asymmetrical effect [12,13,14]. In fact, the analysis considering the asymmetric effect between hotel properties and customer satisfaction is called penalty-reward contrast analysis (PRCA). PRCA classifies hotel attributes into basic factors, excitement factors, and performance factors based on the three-factor theory of customer satisfaction, and has been widely used in unveiling the asymmetric effect of the attributes on customer satisfaction. In other words, PRCA has been approved as a reliable method in various studies [15,16]. This study intends to explore the asymmetric effects of hotel attribute performance on customer satisfaction with different geographic and cultural backgrounds using PRCA. To this end, this study extracts the overall satisfaction of customers as well as the satisfaction of hotel attributes from the reviews on Tripadvisor, which is one of the most widely used travel platforms. To be more specific, reviews written in English from Shanghai, Seoul, and New York are collected and analyzed to determine whether there is a geographical difference in hotel properties that poses an asymmetric effect on customer satisfaction. In order to seek cultural differences, Shanghai’s reviews written in English and Chinese, as well as Seoul’s reviews written in English and Korean are further analyzed. The experimental results of this study are expected to provide a foundation for hotel managers to improve six service attributes (Value, Cleanliness, Service, Location, Room, and Sleep Quality) for the purpose of enhancing customer satisfaction. This study also expects to provide a practical guidance to hotel operators to improve their quality of hotel services and increase customer satisfaction in a cultural context.
This paper first briefly reviews the literature on the three-factor theory of customer satisfaction and penalty-reward contrast analysis. Then, the research methodology is presented and the experimental procedure (transformation of dummy variables, regression analysis, and classification of hotel attributes) is presented. Then, we analyze the results of each attribute classification and propose how to improve hotel customer satisfaction according to the results. In the final section of the paper, the implications of our findings are discussed.

2. Research Background

2.1. Three-Factor Theory of Customer Satisfaction

The three-factor theory of customer satisfaction groups three quality attributes that have different effects on customer satisfaction by the Kano model [17]. In other words, the must-be quality attribute of the Kano model was named as the basic factor, the one-dimension quality attribute as the performance factor, and the attractive quality as the excitement factor.
  • Basic factor: A factor that causes dissatisfaction if not satisfied yet does not lead to satisfaction if satisfied or exceeded, and has an asymmetric effect on customer satisfaction. Negative performance on these attributes has a greater impact on overall satisfaction than positive performance.
  • Excitement factor: A factor that increases customer satisfaction if satisfied, but does not cause dissatisfaction if not satisfied, and has an asymmetric effect on customer satisfaction like a basic factor.
  • Performance factor: High performance leads to satisfaction while low performance leads to dissatisfaction, which has a symmetrical effect on customer satisfaction.
In other studies, the basic factor, excitement factor, and performance factor are also referred to as dissatisfier, satisfier, and hybrid, respectively. A growing body of research categorizes product and service attributes into three factors (basic factors, performance factors, and excitement factors) that have different impacts on customer satisfaction. Albayrak [18] identified six daily tour service quality attributes (transportation, tour guide, food and beverage facility, shopping facility, stopover facility, and museums and sites) to measure the asymmetric impact of each service attribute on overall tourist satisfaction. The results based on the customer satisfaction three-factor theory showed that all of the attributes were basic factors, the only exception was food and beverage facility, which had an insignificant effect on overall customer satisfaction. Fajriyati et al. [19] identify and classify generic and Islamic attributes as basic, performance, and excitement factors in accordance with the three-factor theory of customer satisfaction. Comfortable accommodations, cleanliness, safety, availability of tourist information, and local transportation are evaluated as Islamic basic factors for Muslim tourists. Activities, entertainment, and attractions offered at the destination, a comfortable climate, infrastructure at the destination, communication with locals, and facilities for children and elderly people are performance factors. Local cuisine and drink, destination image, and friendliness of the locals are excitement factors. Cao & Cao [20] applied three-factor theory to classify service attributes that will affect passenger satisfaction into basic, performance, and excitement factors. Comfort while riding is an excitement factor. Safety while at a station/stop is a basic factor. Safety while riding the service and comfort while waiting at the station/stop are performance factors. Wu et al. [21] employed the three-factor theory to identify transit service attributes that critically impact overall satisfaction of express and local bus riders. “vehicles are comfortable”, “route going where people need to go” and “hours of operation for transit service meet my needs” are classified as basic factors, “transferring is easy”, “reliability” and “courteous drivers” are classified as performance factors, and “Vehicles are clean”, “fares are easy to understand”, and “easy to identify the right bus” are classified as excitement factors of express buses, respectively. Matzler et al. [22] explained individual price dimensions and overall satisfaction as the three-factor theory of customer satisfaction. The result shows that price fairness is a basic factor, the reliability of prices and conditions are excitement factors, and price transparency is classified as a performance factor. Preziosi et al. [23] classified hotel attributes according to the three-factor structure of customer satisfaction and found that customers identify green practices as a specific dimension of the service. Customers recognize green practices as excitement attributes, which lead to delight in case of a good performance but do not produce discontent if not achieved. Three-factor theory is used in a variety of domains, including tourism [18,19], transit [20,21], banking [22] and sustainability [23]. Both researchers and practitioners have shown that the three-factor theory of customer satisfaction has important implications on practice.

2.2. Penalty-Reward Contrast Analysis

In general, the Kano model classifies product/service attributes by distinguishing between the possibility of customer satisfaction and dissatisfaction. PRCA, however, is quite different from Kano’s approach in that it classifies attributes. The disadvantage of using the Kano method is that it neither reveals the relative importance of various attributes from the customer’s overall evaluation of the product/service nor how these analyzed attributes are related to each other. To compensate for these shortcomings, penalty-reward contrast analysis (PRCA) is conducted. PRCA quantifies penalties for low performance and rewards for high performance with respect to changes in overall satisfaction with products or services. PRCA is a reliable approach for analyzing asymmetries in the relationship between subjective perceptions of attribute performance and overall satisfaction with a product/service. Compared with the Kano method, PRCA’s advantage is that it can be used to discriminate among attributes in terms of their relative importance in explaining a customer’s overall judgment of a product/service. The PRCA quantifies penalties for low performance and rewards for high performance in terms of changes in overall satisfaction with a product/service. Moreover, penalties and rewards are comparable across attributes, and they can be totaled to obtain a measure of an attribute’s impact on overall satisfaction with a product/service [24]. PRCA can easily adapt to the general customer satisfaction data [25]. PRCA has been recognized by many researchers as a reliable method for identifying attribute categories in terms of the asymmetric relationship between Overall Customer Satisfaction (OCS) and the product/service attribute performance [15,16]. PRCA is a method used by Brandt [26] to discover attributes that reinforce the customer value and thereby increase customer satisfaction. The PRCA process is as follows. Each attribute is converted into dummy variables to represent “low performance” and “high performance”, and then regression analysis is performed to classify quality attributes. In other words, PRCA uses dummy variables to calculate the degree to which high and low performance of quality attributes are affected by OCS, and classifies quality attributes into basic factors, excitement factors, and performance factors.

2.2.1. Dummy Variable Conversion

Prior to conducting PCRA, it is essential to distinguish what is meant by “low performance” and “high performance”. From the previous studies, the definitions of the two have been propounded in various ways among scholars [27]. Using the 7-point Likert scale, Busacca & Padula [15] define scores “1” and “2” as ‘low performance,’ while they define scores “6” and “7” as “high performance” levels. Alegre & Garau [28], however, specify scores “1” and “2” as “low performance”, and “5” as “high performance” on the 5-point Likert scale. Meanwhile, using the same 5-point Likert scale, Mikulic & Prezebac [27] define score “1” as “low performance” and “5” as “high performance” as they used the crawled data for analysis measuring on a 5-point Likert scale. In this study, a 5-point Likert scale is used, and 1 point is defined as “low performance” and “5” as “high performance” according to Mikulic & Prezebac [27].

2.2.2. Quality Attributes Classification

There are various ways to classify quality attributes using PCRA analysis. The first method is to use the regression coefficients of the high-performance dummy variables and of the low-performance dummy variables, respectively [29]. Perhaps the regression coefficient of the low-performance dummy variable is significant while the regression coefficient of the high-performance dummy variable is not, then the corresponding quality attribute is classified as a basic factor. If the regression coefficient of the low-performance dummy variable is not significant while the regression coefficient of the high-performance dummy variable is found to be significant, it is classified as an excitement factor. When both of the regression coefficients of the low- and high-performance dummy variables are significant, they are classified as performance factors, but when neither of them are significant, they are not classified into any factors.
The second method is a method of classifying quality attributes using the impact ratio (IR) [30]. IR is a value dividing the regression coefficient of the high-performance dummy variables by the regression coefficient of the low-performance dummy variables. A quality attribute with IR higher than 1.1 is considered as an excitement factor, IR in between 0.9 and 1.1 as a performance factor, and IR lower than 0.9 as a basic factor. This study, therefore, classifies hotel attributes that affect customer satisfaction into three categories using IR; excitement factor, performance factor, and basic factor.
Recently, PRCA has been widely applied in various fields. Kakar [31] investigated whether there is an asymmetric effect between the user’s requirements and satisfaction with the software using the PRCA method. Alegre & Garau [28] identified the factors affecting the satisfaction of tourists heading to “sun and sand destination” through PRCA. Besides, many studies have used PRCA to analyze the relationship between hotel service attributes and customer satisfaction of the hotel [31,32]. As opposed to previous studies collecting data through surveys to examine the asymmetric relationship between hotel service quality attributes and customer satisfaction [33,34], this study performs PRCA by collecting data via web crawling from Tripadvisor.

3. Method

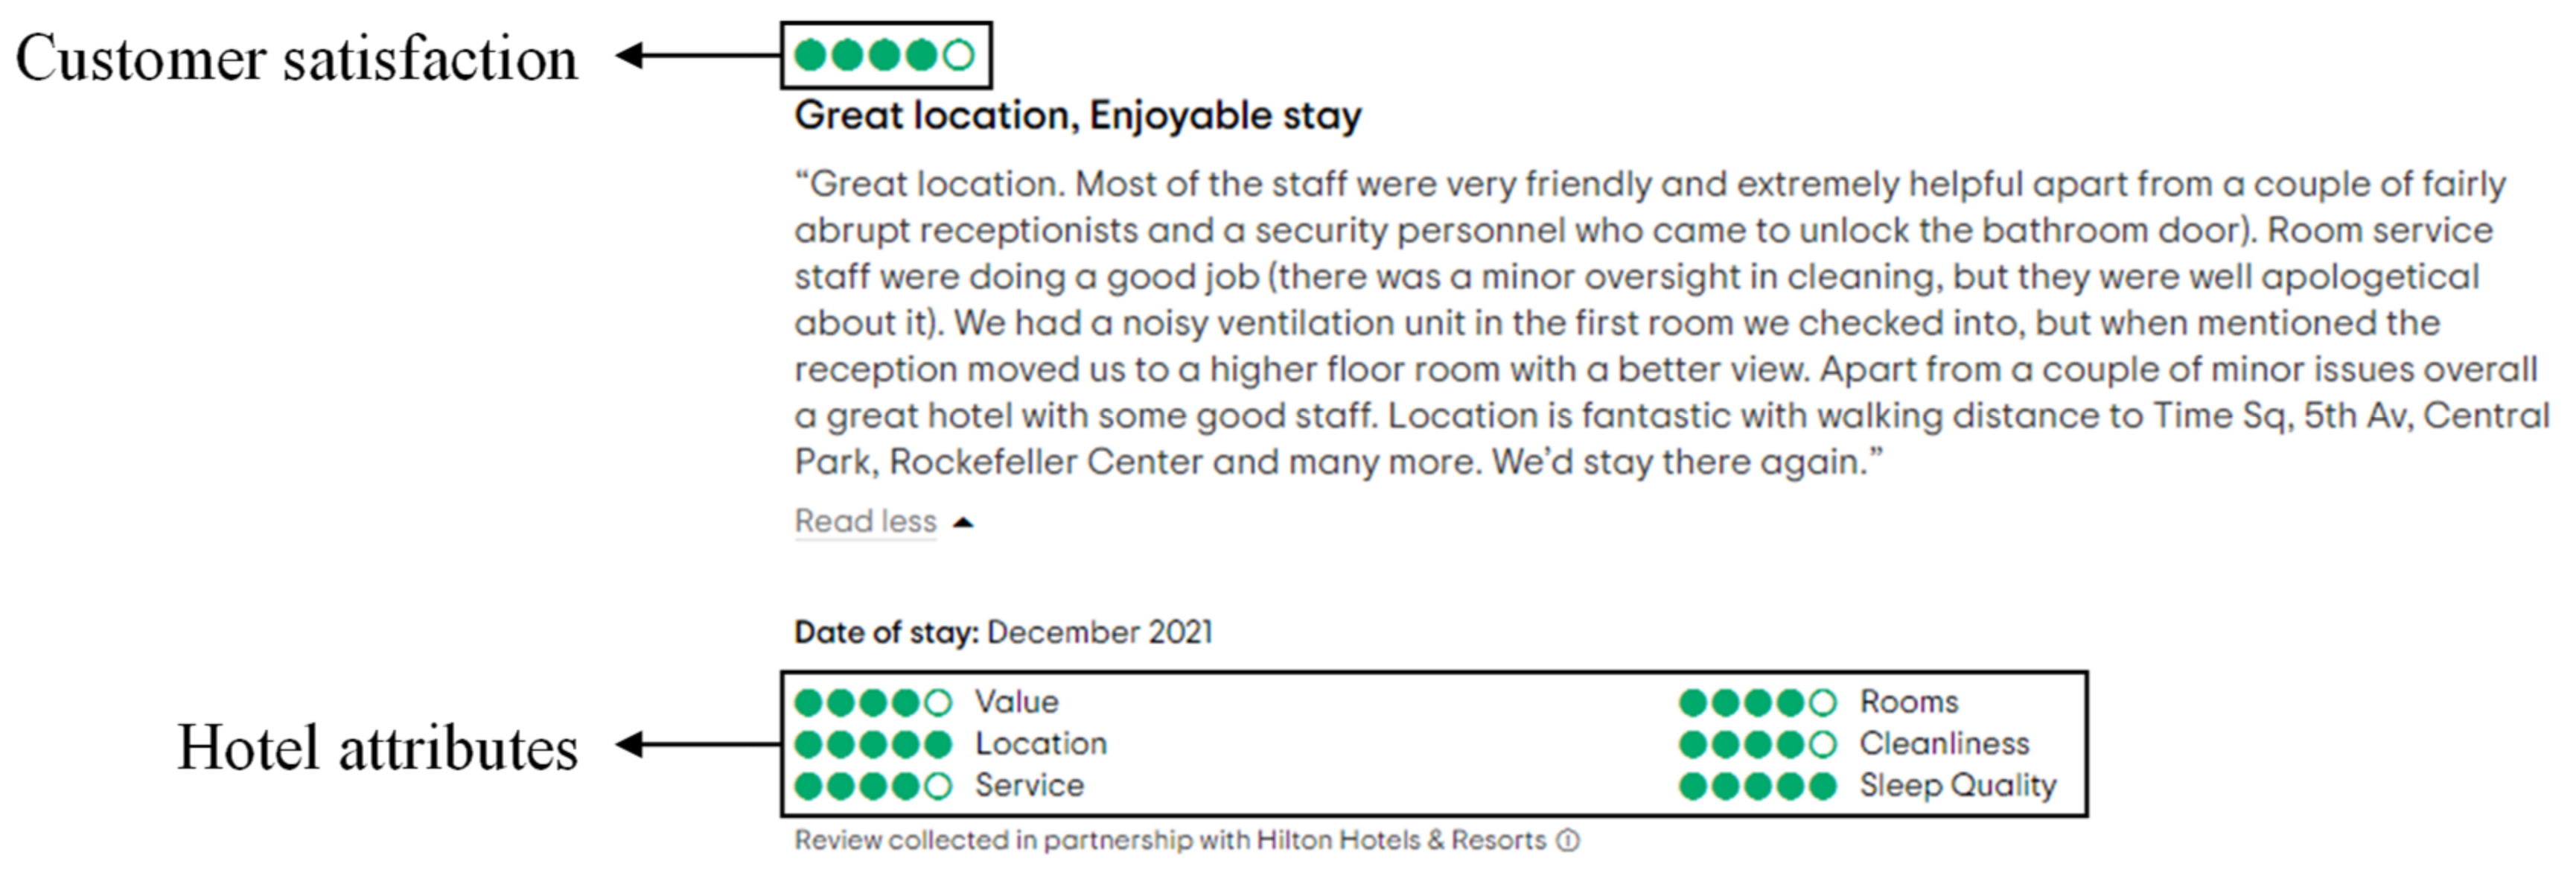
3.1. Data Collection

In order to explore whether the asymmetric effects of hotel attributes on customer satisfaction differ in geographical or cultural contexts, this study collected six different hotel attributes, which are Value, Rooms, Location, Cleanliness, Service, and Sleep Quality, as well as the overall customer satisfaction from the reviews of Tripadvisor showed as of September 2021, as shown in Figure 1. Such reviews include ones written in English or Chinese for hotels in Shanghai, ones written in English or Korean for hotels in Seoul, and ones written in English for hotels in New York.
Table 1 displays the number of hotel reviews across three different cities in English, Chinese or Korean; there are 26,236 reviews written in English for hotels in Shanghai, 13,297 reviews written in Chinese for hotels in Shanghai, 13,016 reviews written in English for hotels in Seoul, 6806 reviews written in Korean for hotels in Seoul, and 53,757 reviews written in English for hotels in New York, respectively.

3.2. Apply Penalty-Reward Contrast Analysis

3.2.1. Dummy Variable Conversion

An overall rating is maintained as the original data since the rating for each attribute of the collected data is converted into a dummy variable. The first dummy variable is input as 1 for the case where the performance of the corresponding attribute is high, or as 0 for the case where it is not. Using the 5-point Likert scale, attributes with a score of 5 are defined as high-performance level, and attributes with a score of 1 are defined as low-performance level. For instance, 5 points are marked as 1 and the rest are marked as 0. The second dummy variable is input as 1 if the performance is low for the attribute, and 0 if it is not. In other words, 1 point is denoted as 1, while the rest is denoted as 0.

3.2.2. Regression Analysis

The next step is to perform regression analysis using dummy variables. The dependent variable corresponds to the overall rating for each reviewed hotel. Independent variables are the high-performance dummy variables of each attribute expressed as “1” and the low-performance dummy variables of each attribute expressed as “0”. This analysis can derive two regression coefficients for each attribute. One quantifies the penalty value of the attribute (the negative effect on overall satisfaction when poorly performed), while the other quantifies the reward value of the attribute (the positive effect on overall satisfaction when well-performed). In this study, the dependent variable for the hotel is the OCS, the user’s overall rating, and the independent variables are the dummy variables for the user’s rating for the hotel’s six attributes. Regression below is performed using the aforementioned dummy variable, as shown in Equation (1).
OCS = β 0 + t = 1 n β p i d p i + β r i d r i + ε
In Formula (1), n is the total number of attributes; β 0 is the constant; β p i is an incremental change in OCS for the low performance of attribute i (the penalty value); β r i is an incremental change in OCS for the high performance of attribute i (the reward value); d ρ i is the dummy variable with respect to attribute i, where its value equals 1 for the low performance and the rest equals 0. The dummy variable for attribute i has a value of 1 for high performance and a value of 0 for all the other performances. ε represents an error term.

3.2.3. Attribute Classification

In the final step, attributes are classified as basic factors, excitement factors, or performance factors in accordance with the regression coefficients used for identifying low-performance (penalty) and high-performance (reward) levels. The experimental results of this study demonstrate that neither the penalty coefficient nor the reward coefficient is significant, which confirms our decision to use the second attribute classification method among the aforementioned classification methods. As IR indicates a value obtained from the division of the regression coefficient of the high-performance dummy variable by the regression coefficient of the low-performance dummy variable, the quality factor with an IR higher than 1.1 belongs to excitement factors, one with an IR falling in between 0.9 and 1.1 belongs to performance factors, and one with an IR lower than 0.9 belongs to basic factors. Thus, hotels’ IR is used to classify hotel attributes on customer satisfaction as excitement factor, performance factor, and basic factor.

4. Results

4.1. Descriptive Analysis

The descriptive statistics of the collected reviews are illustrated in Table 2. While Cleanliness has the highest value for the reviews written in English and Chinese at hotels in Shanghai, as well as the reviews written in English at hotels in Seoul, Location has the highest value for reviews written in Korean at hotels in Seoul and reviews written in English at hotels in New York. Meanwhile, Value is found to be the lowest for all the collected reviews. In fact, the OCS ratings for the English reviews in Shanghai are higher than the ones written in Chinese within the same city. In similar cases, the OCS ratings for the English reviews in Seoul are higher than those written in Korean. Out of the three city hotels’ reviews written in English, New York’s OCS rating is found to be the highest.

4.2. Geographical Differences in Destinations for The Asymmetric Effects of Hotel Attributes

This study conducted penalty-reward contrast analysis (PRCA) on English reviews of all the hotels in Shanghai, Seoul, and New York to investigate whether the asymmetrical effects of hotel attributes on customer satisfaction have a geographical significance.
Table 3 shows the results of PRCA for the English reviews of Shanghai hotels. Among the six hotel attributes, performance for Value, Cleanness, Service, Locations, and Sleep Quality are relatively low, which makes them all basic factors, while performance for Rooms is relatively high, making it an excitement factor. Therefore, in order to further satisfy the English speakers, hotel managers ought to improve the performance levels on Value, Cleanliness, Service, Locations, and Sleep Quality.
Table 4 presents the PRCA results of the English reviews at hotels in Seoul where Value, Cleanliness, Service, Rooms, and Sleep Quality are basic factors, while Locations is excitement factor. Therefore, hotel managers in Seoul ought to improve their performance on Value, Cleanliness, Service, Rooms, and Sleep Quality to further enhance the satisfaction level of the English-speaking customers.
Table 5 demonstrates the PRCA results of the English reviews in New York hotels where Value, Service, Locations, Rooms, and Sleep Quality are considered as basic factors. Thus, hotel managers in New York are encouraged to improve their performance on Value, Service, Rooms, and Sleep Quality to increase the level of satisfaction among the English speakers. Meanwhile, among the proposed hotel attributes, Cleanliness is considered as performance factor. In the case of “performance factor”, lowering its performance would convert to “basic factor”, while increasing its performance would convert into “excitement factor”. Therefore, it is necessary for hotel managers in New York to improve the level of performance in cleanliness.
Figure 2 shows the results from the classification of hotel attributes by cities of English-speaking users. Value, Service, and Sleep Quality are the common basic factors among English speakers who have visited hotels in Shanghai, Seoul, and New York. This implies that there is an urgent need to further improve the level of satisfaction in regards to such hotel attributes. Since Cleanliness is considered a basic factor for hotels in Shanghai and Seoul, whereas a performance factor in New York, hotel managers in both Shanghai and Seoul ought to devise strategies to improve cleanliness satisfaction, while those in New York ought to ponder about strategies that could slightly enhance customer satisfaction as of now. In the case of Location, it is a basic factor in both Shanghai and New York, while it is an excitement factor in Seoul. However, the location of the hotel is an immovable property. Therefore, in the case of hotels in Shanghai and New York, it is necessary to reinforce the infrastructure of public transportation for the sake of tourists’ convenience as a way to solve unfavorable location conditions. Finally, rooms in Shanghai hotels are excitement factors, while they are basic factors in both Seoul and New York hotels; hotel managers in Seoul and New York should thereby consider remodeling of the rooms for better interior design which can ultimately increase satisfaction on this particular attribute.

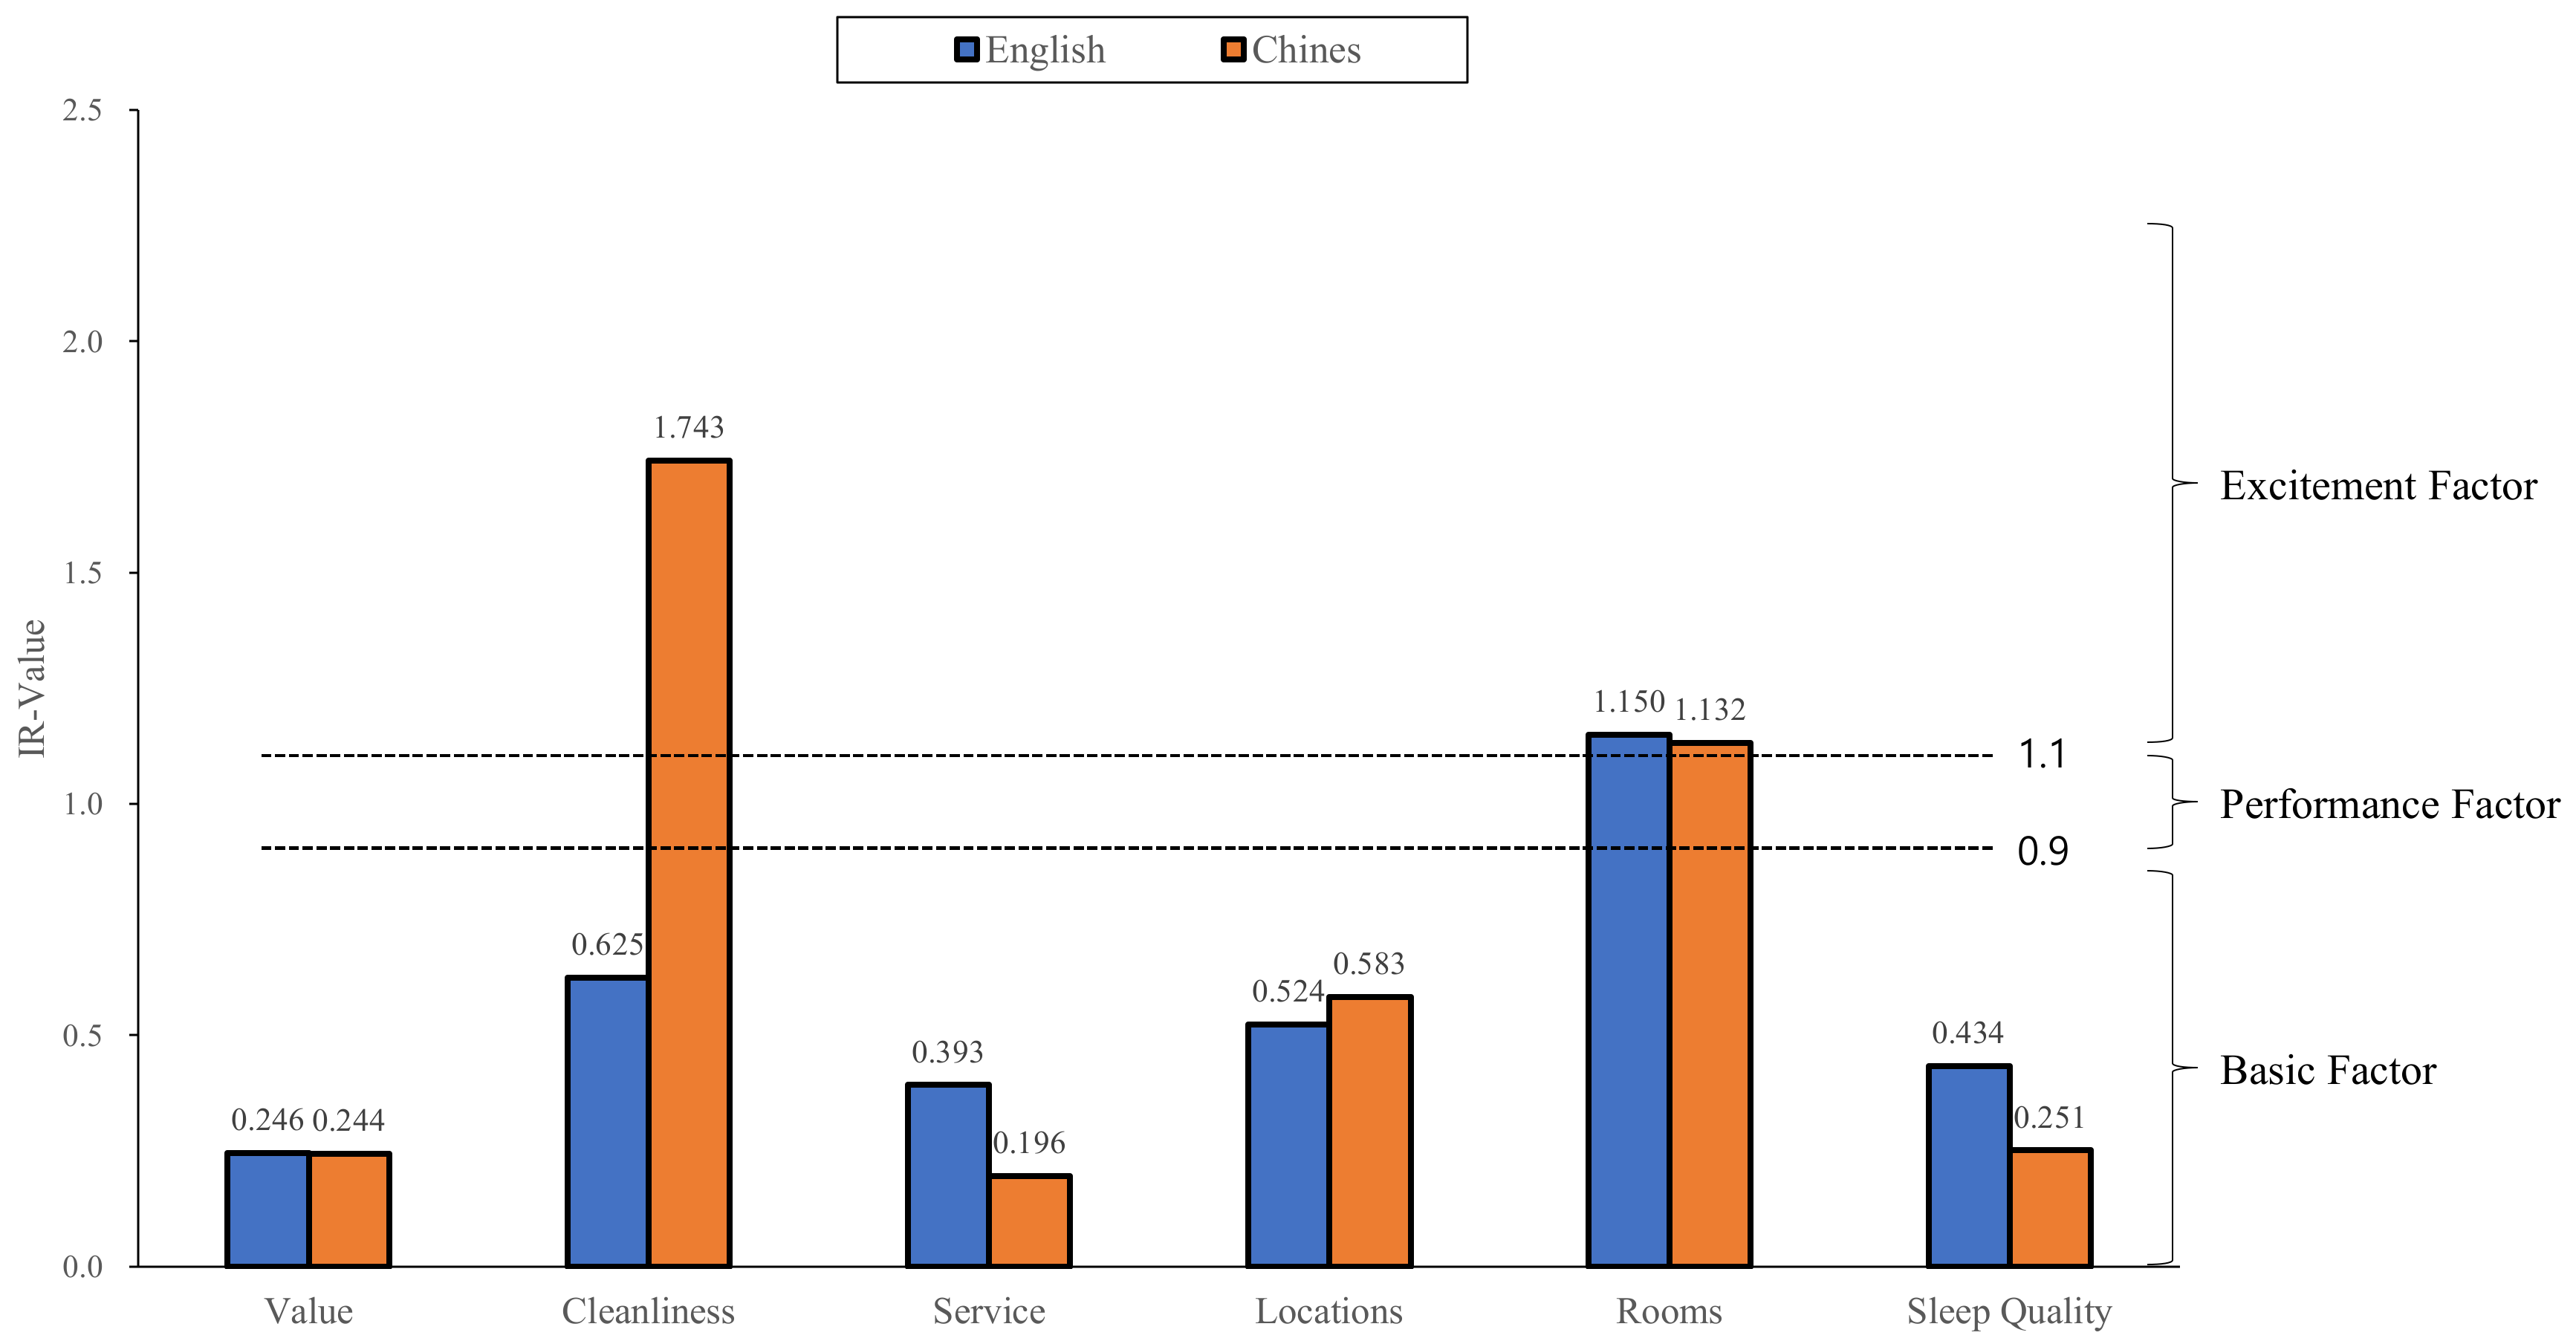
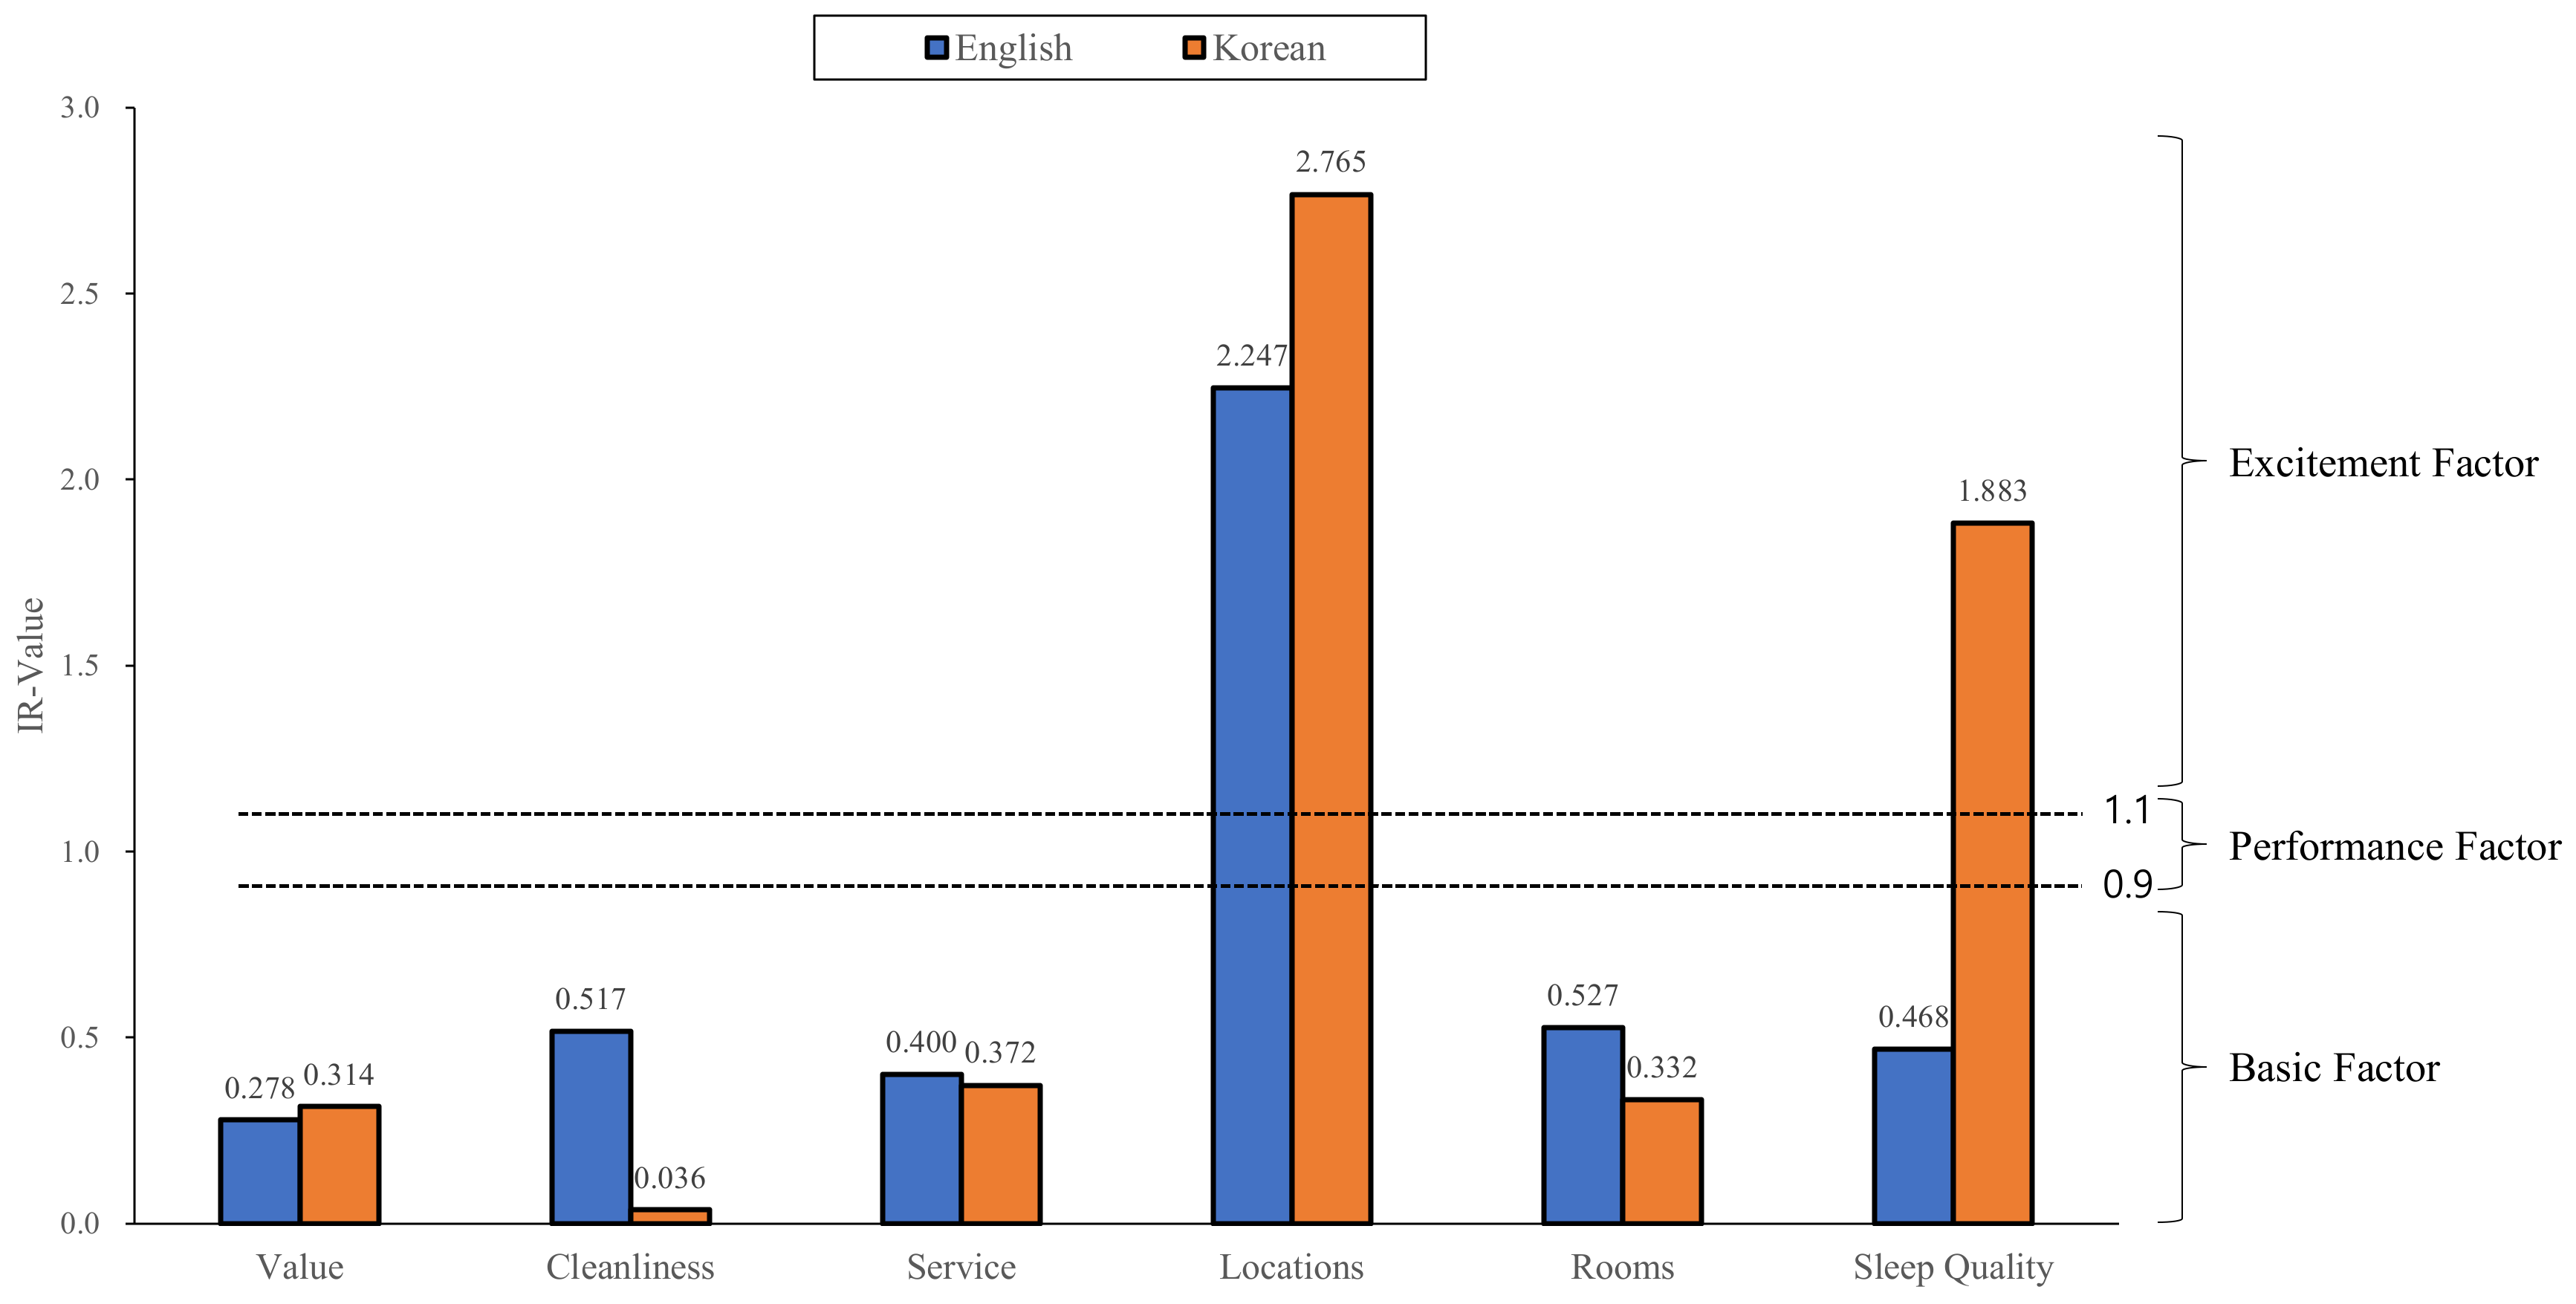
4.3. Cultural Differences in the Asymmetric Effects of Hotel Attributes

In order to investigate whether the asymmetrical effects of hotel attributes on customer satisfaction are culturally different, PRCA was conducted on English and Chinese reviews of Shanghai hotels, as well as English and Korean reviews of Seoul hotels. Table 6 presents the results of PRCA for the Chinese reviews of Shanghai hotels. Among the hotel attributes, performance on Value, Service, Locations, and Sleep Quality is relatively low, which makes them “basic factors”, while performance on Cleanliness and Rooms is relatively high, making these two attributes “excitement factors”.
Figure 3 indicates the results from comparing and classifying hotel attributes by English and Chinese reviews of hotels in Shanghai. For the English and Chinese users, Value, Service, Location, and Sleep Quality are basic factors, while Rooms are excitement factors. Therefore, the hotel managers in Shanghai are highly encouraged to establish a plan that can increase satisfaction with basic factors. In the case of the Cleanliness, it is an excitement factor for Chinese customers, while it is a basic factor for English customers; thus, it is recommended to increase the cleanliness of the hotel for English speaking customers.
Table 7 conveys the results of PRCA for Korean reviews of hotels in Seoul. Out of all the hotel attributes, Value, Cleanliness, Service, Locations, Rooms, and Sleep Quality are found to be basic factors.
Figure 4 shows the results of comparing and classifying quality factors for hotel properties of English and Korean hotel customers in Seoul. For the English and Korean speaking customers, Value, Cleanliness, Service, and Rooms are classified as basic factors, while Location is classified as an excitement factor. Therefore, hotel managers in Seoul need to establish strategies to resolve basic factors in order to increase the overall satisfaction of both the English and Korean speaking customers. For Sleep Quality, it is found to be an excitement factor for Korean customers, but a basic factor for English speaking customers. In order to increase the satisfaction level of the English-speaking customers, it is indispensable to modify the sleeping environment by, for instance, adjusting humidity and illumination at a suitable level, preparing pillows at an appropriate height, and equipping warm blankets.

5. Conclusions

The activation of online travel agency platforms, such as Tripadvisor and Expedia, has intensified competition between hotels in the hospitality industry. In fact, numerous customers book hotels through online travel agencies and evaluate their stay by writing reviews. Such reviews play a significant role as an electronic word of mouth for other potential customers in choosing a place to stay [35]. Therefore, it is crucial for hotel stakeholders to identify the attributes that impact hotel customer satisfaction.
This study has figured out six hotel attributes (Value, Cleanness, Service, Locations, Rooms, and Sleep Quality) that affect customer satisfaction using Tripadvisor’s review data. This study focuses on the asymmetric relationship between hotel service attributes and customer satisfaction using PRCA. In particular, this study not only analyzes reviews of hotels in Shanghai, Seoul, and New York that are written in English to investigate asymmetric differences in hotel attributes, but also the impact of culture on asymmetric differences between hotel attributes and customer satisfaction based on English and Chinese reviews of hotels in Shanghai, as well as English and Korean reviews of hotels in Seoul. Our result first indicates that there are differences in Cleanliness, Location, and Rooms depending on the geographical location of one’s travel destination. In terms of Cleanliness, it is a basic factor in both Shanghai and Seoul hotels, while it is a performance factor in New York hotels. Location is a basic factor in Shanghai and New York hotels, while it is an excitement factor in Seoul hotels. Finally, in the case of Rooms, it is found to be an excitement factor in Shanghai hotels, while it is considered as basic factor in Seoul and New York hotels. In addition, with respect to cultural influences, it is observable to find a difference in Cleanliness in Shanghai hotels, while there is a difference in Sleep Quality for Seoul hotels. In other words, Cleanliness is an excitement factor among Chinese customers, while this is not the case for English speaking customers, yet Sleep Quality is an excitement factor among Korean customers while it is rather considered as a basic factor for English speaking customers.
These findings are helpful in understanding customer behavior within the hotel industry in a scientific manner. The asymmetric effect between the attributes of hotel services and overall satisfaction varies depending on the location of the tourist destination and the cultural background of the customers. From a hotel manager’s perspective, this study has two main contributions. The first is to understand the different opinions of customers who use English for reviews on hotels located in different countries/cities. Hotel managers can make reasonable adjustments to the hotel’s service attributes according to local conditions so as to improve customers’ satisfaction. Secondly, understanding customers from different cultural backgrounds makes hotel managers have different views on hotels in the same city. Therefore, hotel managers can make targeted service adjustments for customers in different cultural circles according to the research results, so as to attract customers from different countries/cities. In order to sustain one’s competitive advantage in the dynamic nature of the hotel market environment, hotel managers are highly encouraged to render optimized strategies of hotel services and thereby eliminate the dissatisfactory features.
The limitations and further research areas of this study are summarized as follows. First, Shanghai, Seoul, and New York cannot fully represent the opinions of customers who write reviews in the same language about hotels in different locations. Therefore, in future work, it is necessary to collect hotel customer rating data in more cities, such as some European countries and Asian countries, and also need to collect hotel customer rating data in different cities in the same country to ensure that the research results can be applied to hotels in a wider range of regions. Second, this study collected reviews in English and in the language of the country where the hotel is located in order to investigate cultural differences. However, there is a limit to generalizing cultural differences through review analysis in two languages, so it is necessary to collect reviews in other languages. Third, this study used only the language of customer reviews to judge customers from different cultural backgrounds. In future research, it is necessary to collect and analyze various pieces of information, such as a customer’s nationality, to understand the customer’s cultural background. Finally, when collecting big data by crawling the web site, if the crawl delay is too short, it can be recognized as a DDoS attack, and if the crawl delay is too long, it takes a lot of time to collect. Therefore, it is necessary to find an optimal crawl delay.

Author Contributions

Conceptualization, I.Y.C. and J.K.K.; methodology, W.T.Z. and I.Y.C.; software, W.T.Z.; validation, W.T.Z. and I.Y.C.; formal analysis, I.Y.C. and Y.J.H.; investigation, W.T.Z.; resources, I.Y.C. and Y.J.H.; data curation, W.T.Z.; writing—original draft preparation, W.T.Z.; writing—review and editing, I.Y.C. and J.K.K.; visualization, W.T.Z.; supervision, Y.J.H. and J.K.K.; project administration, J.K.K. All authors have read and agreed to the published version of the manuscript.

Funding

This research received no external funding.

Institutional Review Board Statement

This study did not require ethical approval.

Informed Consent Statement

Not applicable.

Data Availability Statement

This study did not report any data for publication.

Acknowledgments

We would like to thank Kyung Hee University President’s Scholarship (Foreign thesis publication) for supporting this research.

Conflicts of Interest

The authors declare no conflict of interest.

References

  1. Kandampully, J.; Suhartanto, D. The role of customer satisfaction and image in gaining customer loyalty in the hotel industry. J. Hosp. Leis. Mark. 2003, 10, 3–25. [Google Scholar] [CrossRef]
  2. Dominici, G.; Guzzo, R. Customer satisfaction in the hotel industry: A case study from Sicily. Int. J. Mark. Stud. 2012, 2, 3–12. [Google Scholar] [CrossRef] [Green Version]
  3. Jannach, D.; Zanker, M.; Fuchs, M. Leveraging multi-criteria customer feedback for satisfaction analysis and improved recommendations. Inf. Technol. Tour. 2014, 14, 119–149. [Google Scholar] [CrossRef]
  4. Li, H.; Ye, Q.; Law, R. Determinants of customer satisfaction in the hotel industry: An application of online review analysis. Asia Pac. J. Tour. Res. 2013, 18, 784–802. [Google Scholar] [CrossRef]
  5. Abbasi, A.S.; Khalid, W.; Azam, M.; Riaz, A. Determinants of customer satisfaction in hotel industry of Pakistan. Eur. J. Sci. Res. 2010, 48, 97–105. [Google Scholar]
  6. Bulchand-Gidumal, J.; Melián-González, S.; Lopez-Valcarcel, B.G. A social media analysis of the contribution of destinations to client satisfaction with hotels. Int. J. Hosp. Manag. 2013, 35, 44–47. [Google Scholar] [CrossRef]
  7. Nakayama, M.; Wan, Y. The cultural impact on social commerce: A sentiment analysis on Yelp ethnic restaurant reviews. Inf. Manag. 2019, 56, 271–279. [Google Scholar] [CrossRef]
  8. Weiermair, K. Tourists’ perceptions towards and satisfaction with service quality in the cross-cultural service encounter: Implications for hospitality and tourism management. Manag. Serv. Qual. Int. J. 2000, 10, 397–409. [Google Scholar] [CrossRef]
  9. Jones, P.; Chen, M.M. Factors determining hotel selection: Online behaviour by leisure travellers. Tour. Hosp. Res. 2011, 11, 83–95. [Google Scholar] [CrossRef]
  10. Liat, C.B.; Mansori, S.; Huei, C.T. The associations between service quality, corporate image, customer satisfaction, and loyalty: Evidence from the Malaysian hotel industry. J. Hosp. Mark. Manag. 2014, 23, 314–326. [Google Scholar] [CrossRef]
  11. Liat, C.B.; Mansori, S.; Chuan, G.C.; Imrie, B.C. Hotel service recovery and service quality: Influences of corporate image and generational differences in the relationship between customer satisfaction and loyalty. J. Glob. Mark. 2017, 30, 42–51. [Google Scholar] [CrossRef]
  12. Cadotte, E.R.; Turgeon, N. Dissatisfiers and satisfiers: Suggestions from consumer complaints and compliments. J. Consum. Satisf. Dissatisfaction Complain. Behav. 1988, 1, 74–79. [Google Scholar]
  13. Yi, Y.; La, S. The moderating role of confidence in expectations and the asymmetric influence of disconfirmation on customer satisfaction. Serv. Indsutries J. 2003, 23, 20–47. [Google Scholar] [CrossRef]
  14. Deng, W. Using a revised importance–performance analysis approach: The case of Taiwanese hot springs tourism. Tour. Manag. 2007, 28, 1274–1284. [Google Scholar] [CrossRef]
  15. Busacca, B.; Padula, G. Understanding the relationship between attribute performance and overall satisfaction: Theory, measurement and implications. Mark. Intell. Plan. 2005, 23, 543–561. [Google Scholar] [CrossRef]
  16. Matzler, K.; Sauerwein, E. The factor structure of customer satisfaction: An empirical test of the importance grid and the penalty-reward-contrast analysis. Int. J. Serv. Ind. Manag. 2002, 13, 314–332. [Google Scholar] [CrossRef]
  17. Matzler, K.; Bailom, F.; Hinterhuber, H.H.; Renzl, B.; Pichler, J. The asymmetric relationship between attribute-level performance and overall customer satisfaction: A reconsideration of the importance–performance analysis. Ind. Mark. Manag. 2004, 33, 271–277. [Google Scholar] [CrossRef]
  18. Albayrak, T. Classifying daily tour service attributes by three-factor theory of customer satisfaction. J. Qual. Assur. Hosp. Tour. 2018, 19, 112–125. [Google Scholar] [CrossRef]
  19. Fajriyati, I.; Afiff, A.Z.; Gayatri, G.; Hati, S.R.H. Generic and Islamic attributes for non-Muslim majority destinations: Application of the three-factor theory of customer satisfaction. Heliyon 2020, 6, e04324. [Google Scholar] [CrossRef]
  20. Cao, J.; Cao, X. Comparing importance-performance analysis and three-factor theory in assessing rider satisfaction with transit. J. Transp. Land Use 2017, 10, 837–854. [Google Scholar] [CrossRef] [Green Version]
  21. Wu, X.; Cao, J.; Huting, J. Using three-factor theory to identify improvement priorities for express and local bus services: An application of regression with dummy variables in the Twin Cities. Transp. Res. Part A Policy Pract. 2018, 113, 184–196. [Google Scholar] [CrossRef]
  22. Matzler, K.; Renzl, B.; Faullant, R. Dimensions of price satisfaction: A replication and extension. Int. J. Bank Mark. 2007, 25, 394–405. [Google Scholar] [CrossRef]
  23. Preziosi, M.; Acampora, A.; Lucchetti, M.C.; Merli, R. Delighting Hotel Guests with Sustainability: Revamping Importance-Performance Analysis in the Light of the Three-Factor Theory of Customer Satisfaction. Sustainability 2022, 14, 3575. [Google Scholar] [CrossRef]
  24. Mikulić, J.; Prebežac, D. A critical review of techniques for classifying quality attributes in the Kano model. Manag. Serv. Qual. Int. J. 2011, 21, 46–66. [Google Scholar] [CrossRef] [Green Version]
  25. Mikulić, J.; Prebežac, D. Using dummy regression to explore asymmetric effects in tourist satisfaction: A cautionary note. Tour. Manag. 2012, 33, 713–716. [Google Scholar] [CrossRef]
  26. Brandt, R.D. A procedure for identifying value-enhancing service components using customer satisfaction survey data. In Add Value to Your Service; Surprenant, C., Ed.; American Marketing Association: Chicago, IL, USA, 1987; pp. 61–65. [Google Scholar]
  27. Mikulić, J.; Prebežac, D. Prioritizing improvement of service attributes using impact range-performance analysis and impact-asymmetry analysis. Manag. Serv. Qual. Int. J. 2008, 18, 559–576. [Google Scholar] [CrossRef]
  28. Alegre, J.; Garau, J. The factor structure of tourist satisfaction at sun and sand destinations. J. Travel Res. 2011, 50, 78–86. [Google Scholar] [CrossRef]
  29. Fuchs, M.; Weiermair, K. Destination benchmarking: An indicator-system’s potential for exploring guest satisfaction. J. Travel Res. 2004, 42, 212–225. [Google Scholar] [CrossRef] [Green Version]
  30. Albayrak, T.; Caber, M. Penalty–Reward-Contrast Analysis: A review of its application in customer satisfaction research. Total Qual. Manag. Bus. Excell. 2013, 24, 1288–1300. [Google Scholar] [CrossRef]
  31. Kakar, A.K. Investigating the penalty reward calculus of software users and its impact on requirements prioritization. Inf. Softw. Technol. 2015, 65, 56–68. [Google Scholar] [CrossRef]
  32. Davras, Ö.; Caber, M. Analysis of hotel services by their symmetric and asymmetric effects on overall customer satisfaction: A comparison of market segments. Int. J. Hosp. Manag. 2019, 81, 83–93. [Google Scholar] [CrossRef]
  33. Bi, J.W.; Liu, Y.; Fan, Z.P.; Zhang, J. Exploring asymmetric effects of attribute performance on customer satisfaction in the hotel industry. Tour. Manag. 2020, 77, 104006. [Google Scholar] [CrossRef]
  34. Tontini, G.; dos Santos Bento, G.; Milbratz, T.C.; Volles, B.K.; Ferrari, D. The Critical Incident Technique (CIT) and Penalty-Reward Contrast Analysis (PRCA) applied to online reviews on TripAdvisor: Evaluation of satisfaction of hotel customers. Int. J. Hosp. Manag. 2017, 66, 106–116. [Google Scholar] [CrossRef]
  35. Nie, R.X.; Tian, Z.P.; Wang, J.Q.; Chin, K.S. Hotel selection driven by online textual reviews: Applying a semantic partitioned sentiment dictionary and evidence theory. Int. J. Hosp. Manag. 2020, 88, 102495. [Google Scholar] [CrossRef]
Figure 1. Illustration of the collected data (a review from Tripadvisor.com, accessed on 16 August 2021).
Sustainability 14 07340 g001
Figure 2. The classification of hotel attributes by cities.
Sustainability 14 07340 g002
Figure 3. The classification of hotel attributes by language in Shanghai.
Sustainability 14 07340 g003
Figure 4. The classification of hotel attributes by language in Seoul.
Sustainability 14 07340 g004
Table 1. Number of collected reviews.
CityLanguageNo. of HotelNo. of Review
ShanghaiEnglish117026,236
Chinese100513,297
SeoulEnglish57413,016
Korean4846806
New YorkEnglish52153,757
Table 2. Descriptive statistics.
CityLanguageVariablesMinMaxMeanStd
ShanghaiEnglishValue154.110.969
Cleanliness154.450.854
Service154.181.070
Location154.310.901
Rooms154.320.900
Sleep Quality154.380.912
Customer Satisfaction154.230.968
ChineseValue153.890.897
Cleanliness154.240.806
Service154.000.944
Location154.090.878
Rooms154.140.843
Sleep Quality154.120.869
Customer Satisfaction154.100.856
SeoulEnglishValue154.030.969
Cleanliness154.410.841
Service154.280.955
Location154.340.862
Rooms154.140.950
Sleep Quality154.250.934
Customer Satisfaction154.190.923
KoreanValue153.991.001
Cleanliness154.250.979
Service154.171.054
Location154.420.861
Rooms154.081.019
Sleep Quality154.220.952
Customer Satisfaction154.141.025
New YorkEnglishValue154.350.887
Cleanliness154.740.602
Service154.650.763
Location154.790.513
Rooms154.520.790
Sleep Quality154.570.786
Customer Satisfaction154.600.765
Table 3. Categorization of the hotel attributes for English reviews in Shanghai.
Hotel AttributesDummy Variable Regression Analysis Coefficients ****IR-ValueCategorization
Low PerformanceHigh Performance
Value−0.747 ***0.184 ***0.246Basic factor
Cleanliness−0.408 ***0.255 ***0.625Basic factor
Service−1.166 ***0.458 ***0.393Basic factor
Locations−0.269 ***0.141 ***0.524Basic factor
Rooms−0.286 ***0.329 ***1.150Excitement factor
Sleep Quality−0.500 ***0.217 ***0.434Basic factor
*** p < 0.001; R2: 0.700; F: 5094; **** Unstandardized Beta Coefficient. Dependent variable; Customer satisfaction.
Table 4. Categorization of the hotel attributes for English reviews in Seoul.
Hotel AttributesDummy Variable Regression Analysis Coefficients ****IR-ValueCategorization
Low PerformanceHigh Performance
Value−0.821 ***0.228 ***0.278 Basic factor
Cleanliness−0.416 ***0.215 ***0.517 Basic factor
Service−1.040 ***0.416 ***0.400 Basic factor
Locations−0.0810.182 ***2.247 Excitement factor
Rooms−0.575 ***0.303 ***0.527 Basic factor
Sleep Quality−0.453 ***0.212 ***0.468 Basic factor
*** p < 0.001; R2: 0.650; F: 2010; **** Unstandardized Beta Coefficient. Dependent variable; Customer satisfaction.
Table 5. Categorization of the hotel attributes for English reviews in New York.
Hotel AttributesDummy Variable Regression Analysis Coefficients ****IR-ValueCategorization
Low PerformanceHigh Performance
Value−1.039 ***0.134 ***0.129 Basic factor
Cleanliness−0.245 ***0.254 ***1.037 Performance factor
Service−1.078 ***0.515 ***0.478 Basic factor
Locations1.4010.164 ***0.117 Basic factor
Rooms−0.572 ***0.281 ***0.491 Basic factor
Sleep Quality−0.601 ***0.144 ***0.240 Basic factor
*** p < 0.001; R2: 0.665; F: 8908; **** Unstandardized Beta Coefficient. Dependent variable; Customer satisfaction.
Table 6. Categorization of the hotel attributes for Chinese speaker customers in Shanghai.
Hotel AttributesDummy Variable Regression Analysis Coefficients ****IR-ValueCategorization
Low PerformanceHigh Performance
Value−0.729 ***0.178 ***0.244 Basic factor
Cleanliness−0.1400.244 ***1.743 Excitement factor
Service−1.339 ***0.262 ***0.196 Basic factor
Locations−0.228 ***0.133 ***0.583 Basic factor
Rooms−0.408 ***0.462 ***1.132 Excitement factor
Sleep Quality−0.645 ***0.162 ***0.251 Basic factor
*** p < 0.001; R2: 0.622; F: 1823; **** Unstandardized Beta Coefficient. Dependent variable; Customer satisfaction.
Table 7. Categorization of the hotel attributes for Korean speaker customers in Seoul.
Hotel AttributesDummy Variable Regression Analysis Coefficients ****IR-ValueCategorization
Low PerformanceHigh Performance
Value−0.544 ***0.171 ***0.314Basic factor
Cleanliness−0.580 ***0.021 ***0.036Basic factor
Service−1.262 ***0.469 ***0.372Basic factor
Locations−0.0810.224 ***2.765Excitement factor
Rooms−0.913 ***0.303 ***0.332Basic factor
Sleep Quality−0.094 ***0.177 ***1.883Excitement factor
*** p < 0.001; R2: 0.622; F: 1118; **** Unstandardized Beta Coefficient. Dependent variable; Customer satisfaction.
Publisher’s Note: MDPI stays neutral with regard to jurisdictional claims in published maps and institutional affiliations.

