Article

Pull and Push Factors of Data Analytics Adoption and Its Mediating Role on Operational Performance

by
Luther Yuong Qai Chong
and
Thien Sang Lim
*
Faculty of Business, Economics and Accountancy, Universiti Malaysia Sabah, Kota Kinabalu 88400, Sabah, Malaysia
*
Author to whom correspondence should be addressed.
Sustainability 2022, 14(12), 7316; https://doi.org/10.3390/su14127316
Submission received: 20 April 2022 / Revised: 31 May 2022 / Accepted: 7 June 2022 / Published: 15 June 2022

Abstract

:
Despite the influx of data analytics (DA) practices among firms, their impact on operational performance remains ambiguous. This study examined the pull and push factors affecting the data analytics adoption (DAA) from the theoretical perspectives of the technology–organization–environment (TOE) model, theory of perceived risk (TPR), and resource-based view (RBV). The study analyzed data from 169 firms on the basis of the positivist paradigm and employed the partial least square to run the reflective–formative two-stage analysis. Accordingly, the results indicated that the three TOE model aspects exhibited a positive direct impact on DAA and indirectly impacted operational performance through DAA. However, the perceived risk did not display a similar effect in both situations. This study further revealed that the environment push factor had more explanatory power than the perceived risk pull factor, suggesting that a conducive TOE environment would motivate DAA, subsequently enhancing operational performance. The study provided valuable empirical evidence on the determinants of DAA and its subsequent effect on firms’ operational performance. Uniquely, the study also contributed to the literature from the perspective of higher-order-construct analysis in examining the determinants of DAA and its effect on operational performance. Furthermore, the mediation analysis covered the interaction of indirect-path coefficients, minimizing errors in interpreting the mediation effect.

1. Introduction

The era of knowledge-driven economies has altered how firms compete [1,2], prompting them to utilize data analytics (hereafter DA) as a ‘game-changer’ to improve performance [3]. Data analytics serves as a tool for firms to transform data into meaningful information and subsequently make an informed decision. Firms that successfully integrate DA will reap results through improved predictive capabilities and enhancing operational performance [4,5]. Without DA, it is challenging for managers to learn from the past or future. In essence, DA improves the assessment of business parameters in dealing with market dynamics.
Previous studies focused on the potential of DA in various aspects, such as improving financial performance [6], marketing efficiency [7], and the decision-making process [8]. Despite DA being frequently associated with improved performance, contradictory evidence is found [6,9,10]. These contradictions may cast doubt on the benefits of DA and cloud the understanding of DA’s benefits. Such misunderstandings, especially among smaller firms where resources are often limited, would hinder them from embarking on the process of DA adoption (hereafter DAA). Furthermore, the association between DAA and operational performance remained uncharted in the past. Hence, this study enriches the body of knowledge through simultaneous analysis of the pull factors (determinants that attract) and push factors (determinants that repel) acting on DAA and examines the mediating role of DAA on operational performance using firm-level data of a developing country [11]. Accordingly, the study aims: (1) to examine if the pull factors of the TOE (technological, organizational, and environmental context) and the push factor (perceived risk) of the theory of perceived risk (TPR) can be associated with DAA, (2) to determine if DAA is related to firms’ operational performance, and (3) to investigate the central role of DAA in the relationship between the pull/push factors and firms’ operational performance.

2. Literature Review

The cornerstone of strategic management involves creating and sustaining business values and performance [9]. The resource-based view (RBV) theory suggests that the firms’ performances are influenced by the capabilities to exploit strategic resources [12]—tangible resources, intangible resources, and organizational capabilities [13]. DAA is essential for business development [14], enabling firms to increase their competitive advantages [15,16,17]. Thus, it is justifiable to examine the impact of DAA through the lens of the RBV.
Essentially, data are meaningless if not being converted into information and, subsequently, knowledge. Thus, firms embracing DA can acquire critical knowledge that leads to informed business decision making. In other words, they possess better insight into dealing with issues and challenges from the knowledge gained, which provides them with leverage in competitive advantages. However, for most firms, setting up a DA platform can consume substantial resources. Rationally, firms would usually engage in such endeavors if the expected improved performance or return exceeds the anticipated risks and costs.
Firms’ resources and capabilities are two vital RBV elements that received significant attention in empirical studies, especially in technological innovation [9,18]. Previous literature reported the direct and indirect influence of technological capabilities on firms’ performance [19,20]. Similarly, recent findings suggested that Information Technology (IT) investment [21,22] enables firms to stay competitive [23]. Even though these works were grounded on the RBV, they focused exclusively on financial or marketing performance. Because of the insufficient evidence from the perspective of the firm’s operational performance, which deserves equal attention as financial and marketing performances, this study examined the impact of DAA on operational performance.
The operational performance is measurable from several viewpoints: managing demand, supply chain, customer relationships, and new product development [24]. Demand forecast and supply chain are frequently combined in operations management [25,26] related to DA [27]. This idea is based on the viewpoint that operations and the supply chain are intrinsically linked [28]. Thus, the current study measured operational performance in terms of demand forecast and supply chain. Chae et al. [29] explained that efficiency in data handling and analysis would support management with relevant and quality information, and these aspects are deemed vital to enhance a firm’s planning, control, and overall operational performance. The study employed a higher construct for operational performance to ensure a parsimonious and interpretable model [30].
Previously, pull and push factors that may implicate DAA were often investigated separately. Specifically, there are more studies on pull factors than push factors. The disunification of these factors in previous research somewhat impedes understanding the firm’s technology adoption. Simultaneously, the motivating and hindering factors are affecting firms’ DAA. Hence, this study contributes to the literature by merging the two groups of regressors in a research model.
The technology–organization–environment (TOE) framework posited that the firms’ technology adoption, DAA included, is related to external and internal factors [31]. The first context of the TOE encompasses various technologies relevant to firms, including those in the marketplace, regardless of their implementation. Accordingly, three essential factors consistently employed to measure technological aspects are compatibility, complexity, and trialability [31,32]. The second TOE context is organizational, which focuses on the firms’ characteristics and resources. Measures used in this context include top management support, organizational readiness, communication process, and organizational structure. The linkage mechanism within firms affects innovation adoption, and the process that connects these subunits tend to promote this adoption further. Notably, other primary factors for innovation adoption include top management support and organizational readiness [6]. The final TOE context is environmental, which refers to the business operating environment directly impacting innovation adoption. This context includes external aspects related to industry structure, the presence of technology providers, and the regulatory system. Observing recent trends [2,6,33], it is opined that competitive pressure and external support are relevant for the current study.
While past studies on technology adoption mainly include the pull factor from the TOE framework, the push factor perspective, on the other hand, can be examined in Bauer’s (1960) Theory of Perceived Risk (TPR). The TPR includes a two-dimensional construct of uncertainties and negative consequences. These constructs explain why the decision to act is affected by one’s subjective judgments about risk, a critical concern that firms must address. Accordingly, the greater the decision-makers-perceived adverse possibilities related to DAA, the lower the tolerance to undertake these initiatives. Thus, any rational decision makers would be concerned to consider investing in DA and evaluate their readiness to face challenges arising from at least three fronts: erroneous, legal, and ethical. The TPR is closely related to the concept of partial ignorance, in which neither the negative consequences nor the probability of incidence is precisely known. Other than the two dimensions, TPR’s flexibility enables researchers to include the types of uncertainties according to the research context [34,35]. Hence, the TPR is widely used in various research areas, and scholars have proposed numerous types of risks, including psychological and social, and related to performance and resources. The current study includes several dimensions under perceived risk: privacy and security, data quality, and resource risk.
Substantial existing evidence was determined using the repeated-indicators approach, where the manifest items of the lower-order constructs are used again for the higher-order constructs. As scholars recommend higher-order constructs examination, the study was motivated to investigate DAA among firms using a two-stage approach. There are two statistical stages under this approach where the lower and higher stages are separated. The former examines the relationship between deals constructs and indicators, while the latter defines the relationship among various constructs. In other words, hypothesis testing will be based on a higher-level construct. There are at least three advantages that arise from the reduction in measurement in lower-order constructs. Firstly, higher-order construct utilization minimizes multicollinearity among indicators [36]. Secondly, the approach prevents indicators from double counting [37]. Thirdly, it allows the higher-order construct to be placed at the endogenous position within a research framework [38]. Overall, instead of specifying relationships between multiple independent and dependent constructs in a path model, higher-order constructs help reduce the number of path model relationships, thereby achieving model parsimony.

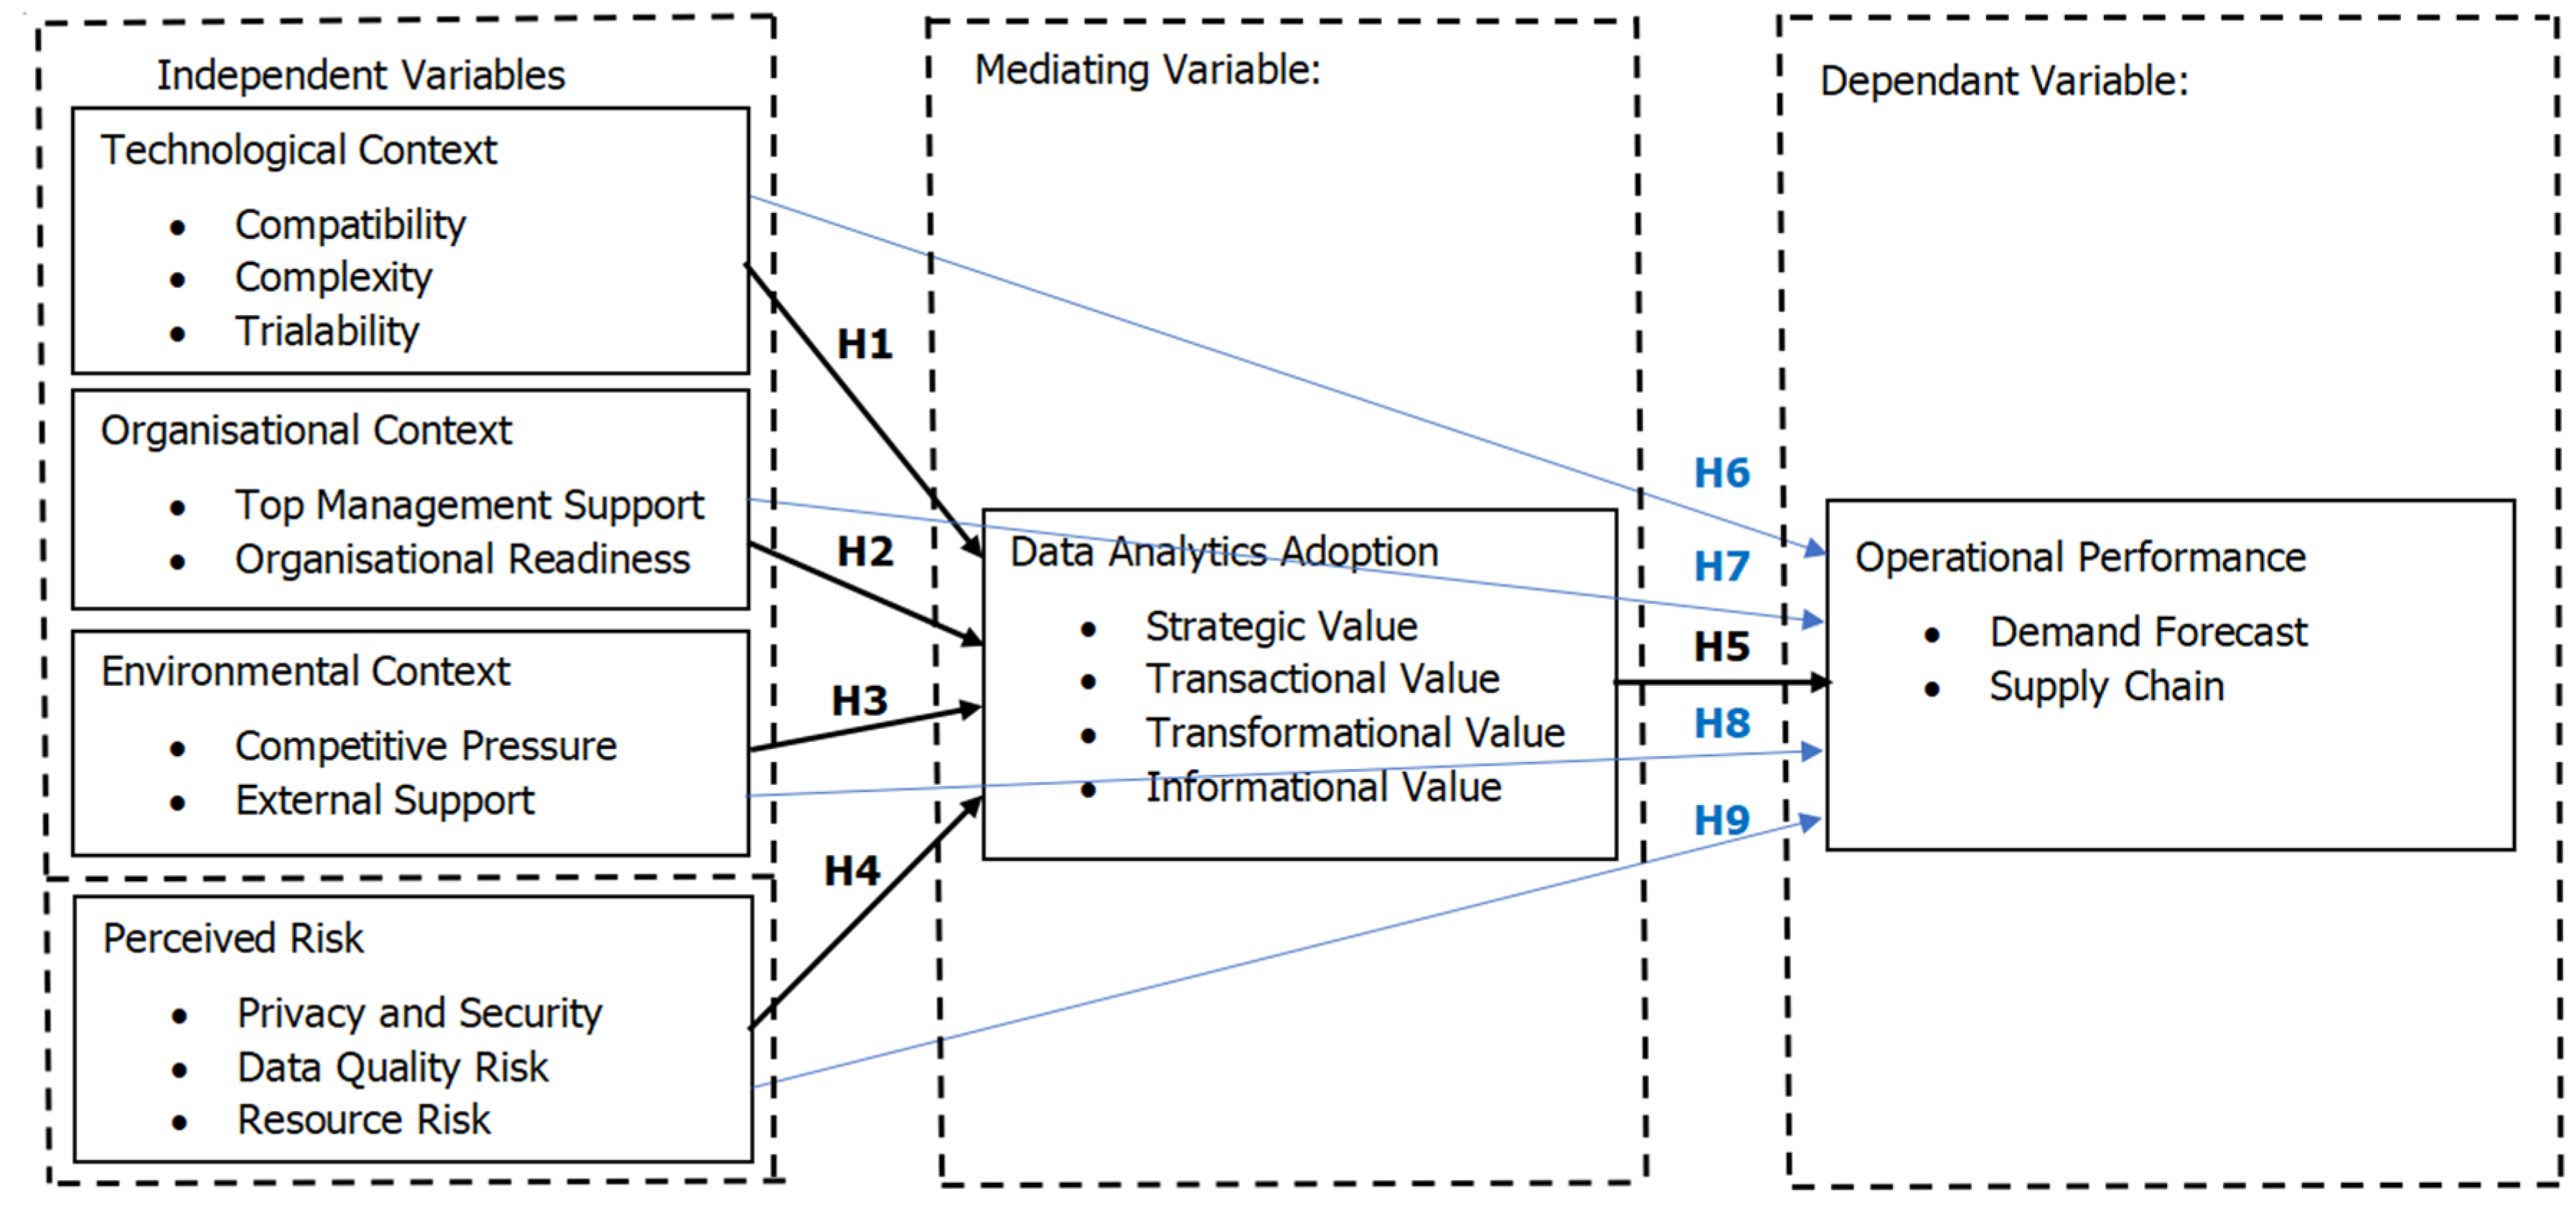
3. Research Framework and Hypotheses Development

The study merges three theoretical perspectives: the TOE framework, the TPR, and the RBV. The TOE framework provides illumination of the potential pull factors of DAA and operational performance. Meanwhile, the TPR grounds the inclusion of the push factor by examining the correlation of perceived risk, DAA, and operational performance. The RBV provides support to investigate the association between the DAA and the firm’s operational performance. Though literature shows that DAA mediates between TOE contexts and firms’ performance, these studies did not specify operational performance. Thus, it is crucial to determine if DAA would display a persistent mediating role under this context. The research framework showing the nine hypotheses of the study is given in Figure 1.

3.1. Technological Context

Technological context comprises various technologies relevant to a firm, including those not implemented by the firm but available in the marketplace [32]. These technologies can significantly impact their future adoption process [39] and will set the pace and capacity to deal with technological change. For most firms, there are three primary types of technological changes related to innovation adoption: (1) incremental (minimal risk and changes due to new features of existing technology), (2) synthetic (moderate change due to existing technologies being integrated in a novel way), and (3) discontinuous (massive change due to paradigm shift) [32]. Therefore, firms must consider the potential technological changes resulting from innovation adoption.
Technological context can be measured based on several aspects such as compatibility, complexity, and trialability [32]. While compatibility and complexity are said to be the most consistent determinants [6], trialability is recognized as a crucial determinant, especially for early adopters [40]. Hence, the study examined this context from the angle of compatibility, complexity, and trialability. Compatibility refers to the degree of consistency related to the firm’s current condition [41], which is measurable upon the firm’s innovation adoption. Innovation provides tremendous success when the firm can adopt them seamlessly. The firm will exploit competitive advantage from the innovation, given that the adoption is seamless and appropriate to its values and practices. However, incompatible innovation could be costly and prohibit them from gaining the advantage.
Complexity is the difficulty level in utilizing innovation [42], and complex innovation can cause integration difficulty that potentially makes it incompatible with the existing system [18,43]. Even if innovation can be easily applied, at times, it may require a different approach from the existing practice. In other words, a simple innovation does not necessarily imply higher compatibility. Hence, it is fair to argue that complex innovation hinders firms from innovation adoption [44]. Accordingly, compatibility can only be confirmed at the postadoption phase, and complexity may discourage a firm from innovation adoption. Meanwhile, the adoption of data analytics would be favorable if firms had the opportunity to pretest the technology innovation without any significant commitment [6]. This reflects the degree to which an innovation can be put on trial, and it is described as trialability [45]. Trialability encourages the adoption of technology innovation as it increases a firm’s innovation exposure and reduces its level of insecurity. Hence, H1 postulates:
H1. 
Technological context has significant influences on DAA.

3.2. Organizational Context

The firm’s characteristics and resources describe the organizational context, which influences the innovation adoption propensity through formal or informal Intra organizational mechanisms for communication and control [46]. Innovation adoption is closely related to the firm’s internal connection, where the mechanism that links the internal subunits promotes this adoption [32]. There are multiple studies on the factors under this context, such as top management support, organizational readiness, communication process, and structure type [32,47]. Among them, top management support and organizational readiness are the most critical in innovation adoption [6]. Hence, top management support and organizational readiness are examined in this study.
Top management is usually referred to as senior executives or individuals who hold most responsibilities in the decision-making process [48], while support refers to physical and mental assistance. Senior executives who are optimistic about the potential advantages of sustainable innovation adoption are more likely to take action to implement them [49]. Top management’s support (e.g., financial support) can effectively build positive values, culture, and environment towards this adoption [42,50]. However, the extent of support is also highly dependent on resource availability [51]. This term is known as organizational readiness [51], or the firm’s capabilities in investing and managing an innovation adoption [52]. The resources cover various types of the firm’s assets, including the skills and talents of employees. If organizational assets are inadequate, it will be challenging for the firm to properly utilize and maintain innovation [32,41]. Therefore, H2 suggests:
H2. 
Organizational context has significant influences on DAA.

3.3. Environmental Context

In the TOE model, the environmental context refers to the external business environment that directly impacts innovation adoption. Previous studies have included various aspects of environmental context. Factors that have been linked to impacting business activities include government intervention, policies, legislation system, geographic location, cultural, and consumer behavior. In the context of technology adoption, researchers have regarded competitive pressure and external support competitive pressure as preeminent antecedents of innovation adoption [53,54,55,56].
Competitive pressure is the singular antecedent of innovation adoption by an organization [53]. Early adopters of DA can strategically increase competitive pressure on their peers, accelerating the innovation adoption process [57]. Hence, firms that realize their competitors are adopting DA may feel threatened, especially when the competitiveness gap between them becomes widened.
Meanwhile, scholars explain that external support can be personal development and technical assistance provided by external vendors or third parties [2,6]. External support has been proven critical toward innovation success [55]. Therefore, firms that garner more support from external parties would be more likely to adopt DA [6]. In other words, the degree of external support can impact DAA. Nevertheless, the firm’s willingness to adopt DA depends on its perception of the vendor [6], meaning there is no specific positive or negative relationship between external support and DAA. Thus, H3 proposes:
H3. 
Environmental context has significant influences on DAA.

3.4. Perceived Risk

Perceived risk refers to the uncertainties and unfavorable consequences associated with one’s expectations [58]. Its level depends on the subjective uncertainty degree of outcomes [59]. Companies that decide on adopting and investing in innovation may sense higher risk if they find any dispute between goals and experiences. Risks that are related to DAA, including privacy and security, data quality, and resource risk, are the risk investigated from the perspective of firms.
Privacy and security become an issue when the data storage is outsourced to an external party [2]. The main concern of data outsourcing is to safeguard the security of personally identifiable data and customer information. New adopters often encounter this issue, especially when they do not have sufficient capability and capacity to sustain the DA system. Consequently, they may feel insecure because of a lack of complete control over the data, which subsequently leads to concern over data quality. Firms that lack experience, tools, and talent to screen and analyze data may feel less certain that their data are credible, complete, accurate, relevant, and timely [60]. In other words, the perception of DA risk would influence DAA. Therefore, H4 is:
H4. 
Perceived risk has significant influences on DAA.

3.5. The Firm’s Data Analytics Adoption and Operational Performance

The current study examines the relationship between the DAA and the operational performance based on RBV. The firm’s operational performance is measured using two constructs: demand forecast and supply chain. Structured demand forecasting and practices in supply chain management improve the firm’s operational performance [61,62]. Specifically, DA contributes to a firm’s values as DA potentially enhances efficiency, flexibility, and cost reduction [9,63]. It transforms conventional operation practices and makes a paradigm shift to data-driven decision making [64]. In other words, firms that practice DA can efficiently transform data into information that is valuable for strategic decision making. Hence, improvement in demand forecasting and supply chain management would lead to alleviation of operational performance [42]. Accordingly, H5 proposes:
H5. 
DAA has a significant influence on operational performance.

3.6. Mediating Role of Data Analytics

One of the key successes of innovation adoption depends very much on firms’ capabilities to effectively assimilate the adoption into their business process. A precondition for successful innovation adoption includes the technological, organizational, and environmental factors [65], enabling firms to achieve effective business performance [18]. In the past, scholars claimed that DAA mediates the effect between sustainable business performance and other factors not included in the TOE model [6,66]. Drawing from this concept, the TOE model may potentially serve as the factor of DAA, and DAA would, in turn, enhances firms’ performances. In other words, this framework can be extended to examine the factors of DAA, which will subsequently improve the firm’s performance.
Meanwhile, a study by Khayer et al. [67] showed that perceived risk has a negative impact on innovation adoption. The reason for the reverse relationship is the uncertain outcomes of the adoption, which causes concern and unease among managers at firms, ultimately hindering the adoption of innovation. Although Khayer et al.’s study was based on cloud adoption, a similar scenario may also be observed in the context of DAA. Hence, perceived risk may negatively impact the adoption of data analytics, which subsequently impedes the firms’ performance, including operational performance [68].
Another study found that DA fully mediates the relationship between environmental practice and supply chain performance in the manufacturing sector but only partially mediates the linkage between supply chain performance and total quality management [69]. Additionally, a study that investigated the management control system of family SMEs and technological innovation found that technological adoption exhibited mediating effects between family management and firm performance [70].
This study differs from the previous by examining the DAA’s determinants and the consequence of DAA on operational performance. Hence, four hypotheses in which DAA is a mediator are proposed:
H6. 
DAA mediates the relationship betweentechnological context and operational performance.
H7. 
DAA mediates the relationship between organizational context and operational performance.
H8. 
DAA mediates the relationship between environmental context and operational performance.
H9. 
DAA mediates the relationship between perceived risk and operational performance.
Investigation of the literature also revealed that the interpretation of indirect effect mostly ignored the path coefficients of a, b, and c for a simple mediation model, which may have led to erroneous conclusions [71]. Hence, this study extends the mediation analysis by examining the impact of indirect (a and b) coefficients (i.e., the indirect effect) on the total mediation effect, which has been largely ignored in previous works.

4. Methodology

An online survey (refer Table A1) was employed after the research instrument had been pretested (for content clarity and validity) and piloted (ensuring internal consistency). Respondents were selected according to judgmental sampling, involving both local and multinational firms from the services and manufacturing sectors utilizing DA. As the study was based on firm-level data, it was vital to ensure respondents of the study were firm owners, chief executives, senior managers, executives, or DA authorized personnel. Accordingly, 169 responses were collected and entered for analysis. It fulfilled the minimum sample required at 129 calculated responses based on the G*Power criterion, and it exceeded the suggested minimum of 100 for path analysis [72].
Data were analyzed using the SmartPLS-SEM that can deal with non-normal distribution and a relatively small sample between 100 to 200 [73,74]. Notably, this variance-based SEM approach can verify a hierarchical model by considering relevant solutions with its flexible assumptions feature [75]. Subsequently, Harman’s Single Factor test was performed to ensure there were no detrimental effects caused by the common method bias [76].

5. Data Analysis and Findings

The data in Table 1 show there is a good proportion in terms of representation from the service (43.70%) and manufacturing (56.21%) sectors. As intended, all the data for the research were obtained from relevant personnel (CEO/Owner, Senior Manager, Executive, and other authorized personnel) with authority for valid feedback about DAA.

5.1. Measurement Model Assessment

The measurement model is divided into two parts. First is the assessment of the reflective measurement model, which is then followed by the formative measurement model.
The reflective measurement model assessment is to examine the internal consistency reliability, indicator reliability, convergent validity, and discriminant validity. Table 2 shows the composite reliability of constructs ranging between 0.832 and 0.944, suggesting good internal consistency reliability. The AVEs of constructs are between 0.502 to 0.808, which are all exceeding the 0.50 threshold, thus, signifying adequate convergent validity [77]. The discriminant validity assessment showed that the constructs are free from discriminant validity issues. In other words, the constructs do not overlap with one another [78] and are measuring what they are designed to measure. Three approaches were employed to check discriminant validity, namely cross-loading, the Fornell and Larcker Criterion, and the Heterotrait-Monotrait (HTMT) ratio of correlations [79]. All results confirmed that the discriminant validity of the constructs is sufficient (Full results for discriminant validity are not included in the current paper).
The study subsequently assessed a formative measurement model for the higher-order construct. Specifically, this procedure assessed the convergent validity, indicator collinearity, indicator significance, and model relevance. Table 3 illustrates the redundancy analysis, revealing that the constructs’ path coefficients exceed 0.70 [80] and the R2 values of endogenous constructs are higher than 0.50 [81]. These results provide the confirmation that the formative constructs successfully meet the convergent validity evaluation, meaning that the constructs are, in fact, measuring what they are theoretically expected to measure. Meanwhile, high collinearity in the measurement models may cause severe issues for the model’s estimation because of the standard error increment within the model. Evidently, in Table 2, the model’s variance inflation factors (VIFs) range between 1.010 and 2.099, which are less than 3.3, signifying that the constructs were not correlated. Thus, this confirms that the model does not exhibit multicollinearity issues [82].
The outer weights can be estimated by measuring the multiple regression between indicators and latent variable scores [81]. The indicators’ relative contribution to the construct and the outer loadings were assessed with t-values. The outer weights should not be outright treated as a poor measurement if their indicator is insignificant. Instead, further assessment based on the outer loading can be assessed. Table 4 shows the measurement properties for the formative construct. Initial investigation shows that the outer weights (column A) of the three constructs are insignificant (t < 1.96), namely complexity, resource risk, and transactional value. Further examination of their outer loadings (column B) indicates that the outer loading t-value of transactional value is significant (t = 4.198). Therefore, transactional value is retained as a dimension of DAA as it reflects the innovation’s ability to create operational benefits [83]. Meanwhile, the outer loading t-values for complexity and resource risk were insignificant, and the two dimensions were removed from subsequent estimation.

5.2. Structural Model Assessment

The structural model assessment (SMA) has two parts. The first is to assess the lateral collinearity, and the second is for hypothesis testing, determination coefficient (R2), effect sizes (f2), and predictive relevance (Q2). Lateral collinearity in models can contradict the findings, specifically for variables that are hypothesized to be causally related, especially in measuring the common construct [84]. Table 5 shows that the VIFs are all under the value of 3.3, confirming that the SMA is free from lateral multicollinearity concerns. The multivariate skewness and kurtosis were also assessed. Although results based on Mardia’s multivariate skewness (β = 53.726, p < 0.01) and multivariate kurtosis (β = 339.514, p < 0.01) suggest that the data were not multivariate normal, the estimation approach approximates the data’s normality using a 5,000-subsample bootstrapping to estimate the t-value for path analysis [73].
Table 6 shows the results of H1 to H5, the direct path analysis for pull and push factors on DAA. Evidently, all three TOE constructs are significantly related to DAA. The beta coefficients (β) for H1, H2, and H3 are 0.253 (t = 2.676, p = 0.007), 0.236 (t = 2.498, p = 0.013), and 0.199 (t = 2.286, p = 0.022), respectively, confirming the crucial positive role of TOE constructs on DAA. Meanwhile, H4, which examines if the perceived risk is associated with DAA, is not supported (t = 1.515, p = 0.130). The results for H5 indicate that DAA is significant and positively related to operational performance (β = 0.404, t = 4.611, p < 0.001).
The effect of the four factors on DAA is substantial, with an R2 of 0.428, exceeding 0.26 [85]. In other words, these factors are responsible for explaining 42.8% of variances in DAA. Similarly, DAA has a substantial effect on operational performance, as evident by R2 of 0.567, implying that DAA explains 56.7% of the variance in operational performance. Individually, each of the TOE constructs exhibited a negligible effect on the DAA, measured by f2, as the values are between 0.02 to 0.15 [85]. Meanwhile, DAA with an f2 value of 0.216 has a medium effect (within the threshold of 0.15 to 0.35) in producing the R2 for operational performance. Overall, the model presented sufficient predictive relevance, indicated by the Q2 values exceeding zero both for DAA (0.176) and operational performance (0.418).
Table 7 illustrates the mediation results (H6 to H9). The study shows that DAA significantly mediates the relationships between the three TOE constructs and operational performance. The t-values and p-values for H6, H7, and H8 exceed the threshold of 1.645 and are lower than 0.05, respectively. This result is further confirmed by the bias-corrected confidence interval (BCa-CI), where the lower limit and upper limit confidence intervals are not straddled between the value of zero [86]. The result for H9, however, revealed that DAA does not significantly mediate the link between perceived risk and operational performance, as indicated by all the indicators (t-value, p-value, and BCa-CI).
The examination of the mediation’s path coefficients was carried out, and the results are shown in Table 8. The indirect pathway TC→DAA→OP (H6) shows that technological context encourages DAA (a = 0.253), and in sequence improves operational performance (b = 0.404). The indirect effect of TC→DAA→OP is 0.102 (0.253 × 0.404). As the total effect of the mediation is 0.263, the indirect pathway explains approximately 38.8% (0.102/0.263) of the total effect. Following a similar approach, the pathways OC→DAA→OP (H7) and EC→DAA→OP (H8) revealed that they contributed 23.6% and 43.5%, respectively, to the total effect. As all coefficients are positive, it is fair to conclude that efforts to enhance TOE contexts at firms would promote DAA, which subsequently improves operational performance. Although the pathway PR→DAA→OP (H9) yielded insignificant results, its total negative effect may serve as a precaution that perceived risk could not be taken lightly as it has the potential to hinder DAA and impede operational performance growth.

6. Discussion

The resultant outcomes of the study demonstrated the significant association of the pull factors under the TOE context with the DAA, in sequence affecting operational performance. It also reaffirmed the role of technological context influence on innovation adoption. With respect to the research hypotheses, all three pull factors representing the technological, organizational, and environmental contexts are positively associated with DAA. From the technological viewpoint, innovation and solution providers must ensure that data analytic system designs are user friendly and easily integrated with systems that are commonly used by industry players. Moreover, the solution providers can provide trial versions to new adopters to promote further innovation adoption. In essence, as firms will assess multiple technological criteria when deciding on DAA, system trialability would allow firms to conduct necessary system evaluation, which is vital to avoid postadoption incompatibility. Meanwhile, firms should have proactive initiative and lend support to encourage the adoption of innovative solutions, including searching for new solutions for data analytics.
Additionally, the study revealed organizational context as an influential pull factor toward DAA, which covers internal and external organizational aspects. Internally, top management support and organizational readiness are vital to DAA. It plays a central role in managing the changes in norms, values, and cultures and facilitating firm members to accept innovation [50] fully. Firms must also pay attention to organizational readiness in terms of resource availability and capabilities. For example, internal fund shortages and inadequacy of human capital would hinder DAA. Roles of external agencies also potentially affect DAA. For instance, financial institutions may offer support through the provision of a unique lending scheme; educational organizations could contribute in terms of developing and nurturing DA talents; governmental agencies may support by offering incentives for DAA. Accordingly, support and cooperation both from the internal and external organizational aspects would encourage a shift towards the DAA sphere. Overall, an inference from the organizational context describes the constructive internal and external attitude that would enhance the DAA.
The obtained results proved the significance of the pull factor under the environmental context. From the viewpoint of competitive pressure, firms may lose market shares if they are not alert and fail to respond to rivals’ strategies. Thus, tense competition within the industry induces firms’ reactions to adopt new technologies [87]. From our findings and concurring with Gangwar [2], the study exerts critical consideration for external support toward DAA. This form of support prompts firms’ DAA, encompassing reinforcement, knowledge sharing, and problem resolution. The experiential learning offered by external parties, i.e., DA solution providers, would promote DAA; hence, more channels must be established for this idea.
The study showed that DAA is associated with TOE pull factors and an antecedent of operational performance. TOE enhances operational performance through DAA, as evident by three mediation analyses showing significant results. Their level of effect on operational performance, indirectly via DAA, varies from one to another. Based on the empirical evidence presented, the technological context of TOE exhibited the most robust effects on DAA and, subsequently, the operational performance, followed by organizational and environmental contexts.
The role of perceived risk on DAA was not established in the study. At the time of the study, the DAA among firms in Malaysia was relatively low [88], and DAA among the firms was still in its infancy. Perhaps, these early adopters may view DA as a game changer, and its adoption would offer more benefits than inherent risk. Thus, they were more focused on the prospects of a successful adoption. Furthermore, it is also fair to assume that early adopters generally are risk takers and thus have a higher tolerance to risk [89]. The unsupported finding on the association of perceived risk with DAA may be viewed as encouraging as there was no evidence to support the claim that perceived risk would repel firms from adopting DA among the firms in the manufacturing and services sectors.

7. Conclusions

The study provided empirical evidence using data collected from 169 firms in the manufacturing and services sectors. This study shows that pull factors are more dominant than push factors in associating with data analytic adoption. Although the study covered firms in two economic sectors, it does support the proposition that data analytic adoption plays a strong contribution toward operational performance. From the viewpoint of technological context (compatibility and trialability), it supports the argument that the technological context was positively related to the adoption of data analytics. Meanwhile, organizational context (the top management support and organizational readiness perspective) and environmental support (the competitive pressure and external support perspective) demonstrated a similar link to data analytic adoption. The indirect effects between the three TOE contexts and operational performance, via data analytic adoption as moderator, have also been confirmed. Evidently, initiatives that increase support in terms of technological, organizational, and environmental contexts would promote the adoption of data analytics among firms, which in turn would improve operational performance.
As the TOE and TPR are considered flexible contextual theories, future research can include additional dimensions, which would broaden the scope of interpretation and provide a comprehensive view of the higher-order construct. New research may also explore if the size of firms would influence the relationship between the pull and push factors on the adoption of data analytics. This is because firm size potentially delivers varying challenges in priorities or strategy formulations. As the current study does not distinguish between new and old adopters, examination using multigroup analysis may unravel new insight as firms at different stages of adoption may encounter different challenges in each phase of data analytics. Lastly, future studies may adopt a mixed-method approach to understand how the progression of data analytics adoption affects firm performance.

Author Contributions

Conceptualization, L.Y.Q.C. and T.S.L.; Formal analysis, L.Y.Q.C.; Investigation, L.Y.Q.C. and T.S.L.; Methodology, L.Y.Q.C. and T.S.L.; Resources, T.S.L.; Supervision, T.S.L.; Validation, T.S.L.; Writing—original draft, L.Y.Q.C.; Writing—review & editing, T.S.L. All authors have read and agreed to the published version of the manuscript.

Funding

The Article Processing Charges was funded by Universiti Malaysia Sabah.

Informed Consent Statement

Informed consent was obtained from all parties involved in the study.

Data Availability Statement

Data for research are available upon request from authors.

Conflicts of Interest

The authors declare no conflict of interest.

Abbreviations

TCPTTechnological-Compatibility
TCPXTechnological-Complexity
TTRLTechnological-Trialability
OTMSOrganisational-Top Management Support
OORDOrganisational-Organisational Readiness
ECPREnvironmental-Competitive Pressure
EESPEnvironmental-External Support
RPNSRisk-Privacy and Security
RDQTRisk-Data Quality
RRSRRisk-Resource Risk
ASTRAdoption-Strategic Value
ATSCAdoption-Transactional Value
ATFMAdoption-Transformational Value
AIFMAdoption-Informational Value
PDMFPerformance-Demand Forecast
PSPCPerformance-Supply Chain

Appendix A

Table A1. Research Instrument for the Study (After Pre and Pilot Tests).
SymbolQuestion
TCPT1The adoption of data analytics is consistent with our business practices.
TCPT2The adoption of data analytics fits our organizational culture.
TCPT3It is easy to synchronize external data with the internal data of our firm.
TCPT4Data analytics adoption provides a flexible architecture that is compatible with numerous analytical tasks.
TCPT5Overall, it is uncomplicated to incorporate data analytics into our organization.
TCPX1Our firm manages to operate data analytics without difficulty.
TCPX2Our firm manages to maintain data analytics without difficulty.
TCPX3Our firm manages to extract useful information without difficulty.
TCPX4Our firm manages to normalize a huge amount of unstructured data from multiple sources without difficulty.
TCPX5Our employees manage to learn data analytics without difficulty.
TTRL1It is easy for our firm to quit after testing a data analytics package.
TTRL2The start-up cost for our firm to use data analytics is low.
TTRL3Our firm has the opportunity to try out different types of data analytics software packages.
TTRL4Our firm has the opportunity to try out allowed data analytics until its capabilities are revealed.
TTRL5Our firm has the opportunity to have a free trial before deciding adoption of data analytics.
OTMS1Our top management promotes the use of data analytics in the organization.
OTMS2Our top management creates support for data analytics initiatives within the organization.
OTMS3Our top management promotes data analytics as a strategic priority within the organization.
OTMS4Our top management is interested in the news about using data analytics adoption.
OTMS5Our top management provides the necessary resources to support the use of data analytics.
OORD1There are adequate financial resources for our firm to adopt data analytics.
OORD2There are adequate IT infrastructures for our firm to adopt data analytics.
OORD3There is adequate analytics capability for our firm to exploit data analytics.
OORD4There are adequate employee skills to conduct data analytics in our firm.
OORD5There is adequate training provided to the analyst about data analytics and its applications.
ECPR1Our choice to adopt data analytics would be strongly influenced by what competitors in the industry are doing.
ECPR2Our firm is under pressure from competitors to adopt data analytics.
ECPR3Our firm would adopt data analytics in response to what competitors are doing.
ECPR4There is a trend in the industry to enhance the utilization of data analytics for business-related activities and decision making.
ECPR5Our firm could lose customers to the competitors if we do not adopt new technologies.
EESP1Community agencies who provide training encourage our firm to adopt data analytics.
EESP2Community agencies who provide effective technical support encourage our firm to adopt data analytics.
EESP3Community agencies who provide valuable assistance at the postimplementation stage encourage our firm to adopt data analytics.
EESP4The governmental policies encourage our firm to adopt data analytics.
EESP5The government provides incentives if our firm adopts data analytics.
RPNS1Our firm has the ability to secure data.
RPNS2Our firm has complied with Internet security.
RPNS3Our firm has given top priority to the privacy of customer data.
RPNS4The need to outsource data analytics creates concerns about data security and privacy.
RPNS5The need to outsource data analytics creates risks through excessive dependency on the vendor.
RDQT1There are risks where data used for analytics are incomplete.
RDQT2There are risks where data used for analytics are inconsistence.
RDQT3There are risks where data used for analytics are inaccurate.
RDQT4All data (ordering details, material inventory, etc.) are managed the same way throughout our firm.
RDQT5A common definition of the main data source (order forms, component information, etc.) is being applied in our firm.
RRSR1There are uncertainties about the costs involved in data analytics adoption.
RRSR2There are uncertainties about the potential benefits of data analytics adoption.
RRSR3There are uncertainties about the employee to adapt to changes.
RRSR4The use of data analytics creates concerns about technological risks.
RRSR5The use of data analytics creates capital outlay with no guarantee of financial returns.
ASTR1The adoption of data analytics helps our firm gain competitive advantages.
ASTR2The adoption of data analytics helps our firm improve customer relations.
ASTR3The adoption of data analytics helps our firm establish useful links with other organizations.
ASTR4The adoption of data analytics helps our firm respond more swiftly to changes.
ASTR5The adoption of data analytics helps our firm provide better products or services to customers.
ATSC1The adoption of data analytics helps our firm increase savings in supply chain management.
ATSC2The adoption of data analytics helps our firm reduce operating costs.
ATSC3The adoption of data analytics helps our firm reduce communication costs.
ATSC4The adoption of data analytics helps our firm enhance employee productivity.
ATSC5The adoption of data analytics helps our firm increase its return on financial assets.
ATFM1The adoption of data analytics helps our firm improve employees’ skill levels.
ATFM2The adoption of data analytics helps our firm develop new business opportunities.
ATFM3The adoption of data analytics helps our firm expand its capabilities.
ATFM4The adoption of data analytics helps our firm improve organizational structure and processes.
ATFM5The adoption of data analytics helps our firm improve its business models.
AIFM1The adoption of data analytics enables our firm to access data faster.
AIFM2The adoption of data analytics enables our firm to access data easier.
AIFM3The adoption of data analytics enables our firm to improve data management.
AIFM4The adoption of data analytics enables our firm to improve data accuracy.
AIFM5The adoption of data analytics enables our firm to generate data in more useable formats.
PDMF1The adoption of data analytics enables our firm to perform demand forecasts accurately.
PDMF2The adoption of data analytics enables our firm to access demand forecasts conveniently.
PDMF3The adoption of data analytics enable our firm to have reliable demand forecast.
PDMF4The adoption of data analytics enables our firm to increase the number of goods delivered on time.
PDMF5The adoption of data analytics enables our firm to decrease in inventory levels.
PSPC1The adoption of data analytics enables our firm to reduce order fulfilment lead times.
PSPC2The adoption of data analytics enables our firm to reduce order-to-delivery cycle time.
PSPC3The adoption of data analytics enables our firm to enhance customer response time.
PSPC4The adoption of data analytics enables our firm to enhance the ability to respond to customer/supplier query time.
PSPC5The adoption of data analytics enables our firm to enhance the ability to help customers by providing the services needed.

References

  1. World Economic Forum. Understanding the Impact of Digitalization on Society. Available online: https://reports.weforum.org/digital-transformation/understanding-the-impact-of-digitalization-on-society/ (accessed on 3 June 2021).
  2. Gangwar, H. Understanding the Determinants of Big Data Adoption in India: An Analysis of the Manufacturing and Services Sectors. Inf. Resour. Manag. J. 2018, 31, 1–22. [Google Scholar] [CrossRef]
  3. Wamba, S.F.; Akter, S. Enterprise and Organizational Modeling and Simulation. Lect. Notes Bus. Inf. Process. 2015, 88, 173–191. [Google Scholar] [CrossRef]
  4. Ganbold, O.; Matsui, Y. Effect of IT-Enabled Supply Chain Process Integration on Firm’s Operational Performance Completed Research Paper. In Proceedings of the 20th Americas Conference on Information Systems, AMCIS 2020, Virtual Conference, 15–17 August 2010; pp. 1–7. [Google Scholar]
  5. Zelbst, P.J.; Green, K.W.; Sower, V.E. Impact of RFID Technology Utilization on Operational Performance. Manag. Res. Rev. 2010, 33, 994–1004. [Google Scholar] [CrossRef]
  6. Maroufkhani, P.; Wan Ismail, W.K.; Ghobakhloo, M. Big Data Analytics Adoption Model for Small and Medium Enterprises. J. Sci. Technol. Policy Manag. 2020, 11, 171–201. [Google Scholar] [CrossRef]
  7. Benoit, D.F.; Lessmann, S.; Verbeke, W. On Realising the Utopian Potential of Big Data Analytics for Maximising Return on Marketing Investments. J. Mark. Manag. 2020, 36, 233–247. [Google Scholar] [CrossRef]
  8. Akter, S.; Bandara, R.; Hani, U.; Fosso Wamba, S.; Foropon, C.; Papadopoulos, T. Analytics-Based Decision-Making for Service Systems: A Qualitative Study and Agenda for Future Research. Int. J. Inf. Manag. 2019, 48, 85–95. [Google Scholar] [CrossRef]
  9. Mikalef, P.; Boura, M.; Lekakos, G.; Krogstie, J. Big Data Analytics and Firm Performance: Findings from a Mixed-Method Approach. J. Bus. Res. 2019, 98, 261–276. [Google Scholar] [CrossRef]
  10. Davenport, T.; O‘Dwyer, J. Tap into the Power of Analytics. Supply Chain Quarterly. Available online: https://www.supplychainquarterly.com/articles/567-tap-into-the-power-of-analytics (accessed on 3 June 2021).
  11. Yan, H.; Wickramasekera, R.; Tan, A. Exploration of Chinese SMEs’ Export Development: The Role of Managerial Determinants Based on an Adapted Innovation-Related Internationalization Model. Thunderbird Int. Bus. Rev. 2018, 60, 633–646. [Google Scholar] [CrossRef]
  12. Barney, J.B. Resource-Based Theories of Competitive Advantage: A Ten-Year Retrospective on the Resource-Based View. J. Manag. 2001, 27, 643–650. [Google Scholar] [CrossRef]
  13. Dess, G.G.; McNamara, G.; Eisner, A.B.; Lee, S.H. Strategic Management: Text and Cases, 10th ed.; McGraw-Hill: New York, NY, USA, 2021. [Google Scholar]
  14. Mathias, H. Analyzing Small Businesses’ Adoption of Big Data Security Analytics; Walden Dissertations and Doctoral Studies: Minneapolis, MN, USA, 2019. [Google Scholar]
  15. Dahiya, R.; Le, S.; Ring, J.K.; Watson, K. Big Data Analytics and Competitive Advantage: The Strategic Role of Firm-Specific Knowledge. J. Strateg. Manag. 2021, 15, 175–193. [Google Scholar] [CrossRef]
  16. Muhammad, R.N.; Tasmin, R.; Nor Aziati, A.H. Sustainable Competitive Advantage of Big Data Analytics in Higher Education Sector: An Overview. J. Phys. Conf. Ser. 2020, 1529, 042100. [Google Scholar] [CrossRef]
  17. Sharma, R.; Reynolds, P.; Scheepers, R.; Seddon, P.B.; Shanks, G.G. Business Analytics and Competitive Advantage: A Review and a Research Agenda. Front. Artif. Intell. Appl. 2010, 212, 187–198. [Google Scholar]
  18. Akter, S.; Wamba, S.F.; Gunasekaran, A.; Dubey, R.; Childe, S.J. How to Improve Firm Performance Using Big Data Analytics Capability and Business Strategy Alignment? Int. J. Prod. Econ. 2016, 182, 113–131. [Google Scholar] [CrossRef] [Green Version]
  19. Wang, N.; Liang, H.; Zhong, W.; Xue, Y.; Xiao, J. Resource Structuring or Capability Building? An Empirical Study of the Business Value of Information Technology. J. Manag. Inf. Syst. 2012, 29, 325–367. [Google Scholar] [CrossRef]
  20. Bhatt, G.D.; Grover, V. Types of Information Technology Capabilities and Their Role in Competitive Advantage: An Empirical Study. J. Manag. Inf. Syst. 2005, 22, 253–277. [Google Scholar] [CrossRef]
  21. Lin, W.L.; Yip, N.; Ho, J.A.; Sambasivan, M. The Adoption of Technological Innovations in a B2B Context and Its Impact on Firm Performance: An Ethical Leadership Perspective. Ind. Mark. Manag. 2020, 89, 61–71. [Google Scholar] [CrossRef]
  22. Kijkasiwat, P.; Phuensane, P. Innovation and Firm Performance: The Moderating and Mediating Roles of Firm Size and Small and Medium Enterprise Finance. J. Risk Financ. Manag. 2020, 13, 97. [Google Scholar] [CrossRef]
  23. Raguseo, E. Big Data Technologies: An Empirical Investigation on Their Adoption, Benefits and Risks for Companies. Int. J. Inf. Manag. 2018, 38, 187–195. [Google Scholar] [CrossRef]
  24. Muhammad, Z.; Yi, F.; Shumaila, N.A. How a Supply Chain Process Matters in Firms’ Performance-an Empirical Evidence of Pakistan. J. Compet. 2017, 9, 66–88. [Google Scholar] [CrossRef]
  25. Gonçalves, J.N.C.; Cortez, P.; Carvalho, M.S.; Frazão, N.M. A Multivariate Approach for Multi-Step Demand Forecasting in Assembly Industries: Empirical Evidence from an Automotive Supply Chain. Decis. Support Syst. 2021, 142, 113452. [Google Scholar] [CrossRef]
  26. Boulaksil, Y. Safety Stock Placement in Supply Chains with Demand Forecast Updates. Oper. Res. Perspect. 2016, 3, 27–31. [Google Scholar] [CrossRef] [Green Version]
  27. Hofmann, E.; Rutschmann, E. Big Data Analytics and Demand Forecasting in Supply Chains: A Conceptual Analysis. Int. J. Logist. Manag. 2018, 29, 739–766. [Google Scholar] [CrossRef]
  28. Stevenson, W.J. Operations Management, 14th ed.; McGraw-Hill: New York, NY, USA, 2021. [Google Scholar]
  29. Chae, B.; Yang, C.; Olson, D.; Sheu, C. The Impact of Advanced Analytics and Data Accuracy on Operational Performance: A Contingent Resource Based Theory (RBT) Perspective. Decis. Support Syst. 2014, 59, 119–126. [Google Scholar] [CrossRef] [Green Version]
  30. Chen, F.F.; Sousa, K.H.; West, S.G. Teacher’s Corner: Testing Measurement Invariance of Second-Order. Struct. Equ. Model. 2005, 12, 471492. [Google Scholar] [CrossRef]
  31. Tornatzky, L.G.; Fleischer, M.; Chakrabarti, A.K. Processes of Technological Innovation; Lexington Books: Lanham, MD, USA, 1990. [Google Scholar]
  32. Baker, J. Informations Systems Theory: Explaining and Predicting Our Digital Society, Vol.2; Springer: Berlin/Heidelberg, Germany, 2012; Volume 28, p. 461. [Google Scholar] [CrossRef]
  33. Verma, S.; Chaurasia, S. Understanding the Determinants of Big Data Analytics Adoption. Inf. Resour. Manag. J. 2019, 32, 1–26. [Google Scholar] [CrossRef] [Green Version]
  34. Dowling, G.R. Perceived Risk Concept Its Meas. Psychol. Mark. 1986, 3, 193–210. [Google Scholar] [CrossRef]
  35. Ahmad, M.H.; Michelle, B.K.; Allison, W.P.; Fatma, A.M. Conceptualization and Measurement of Perceived Risk in Online Shopping. Mark. Manag. J. 2006, 16, 138–147. [Google Scholar]
  36. Sarstedt, M.; Hair, J.F.; Cheah, J.H.; Becker, J.M.; Ringle, C.M. How to Specify, Estimate, and Validate Higher-Order Constructs in PLS-SEM. Australas. Mark. J. 2019, 27, 197–211. [Google Scholar] [CrossRef]
  37. Arnett, D.B.; Laverie, D.A.; Meiers, A. Developing Parsimonious Retailer Equity Indexes Using Partial Least Squares Analysis: A Method and Applications. J. Retail. 2003, 79, 161–170. [Google Scholar] [CrossRef]
  38. Ringle, C.M.; Sarstedt, M.; Straub, D.W. Editor’s Comments: A Critical Look at the Use of PLS-SEM in “MIS Quarterly”. MIS Q. 2012, 36, 3–14. [Google Scholar] [CrossRef] [Green Version]
  39. Ikumoro, A.O.; Jawad, M.S. Intention to Use Intelligent Conversational Agents in E-Commerce among Malaysian SMEs: An Integrated Conceptual Framework Based on Tri-Theories Including Unified Theory of Acceptance, Use of Technology (UTAUT), and T-O-E. Int. J. Acad. Res. Bus. Soc. Sci. 2019, 9, 205–235. [Google Scholar] [CrossRef] [Green Version]
  40. Moghavvemi, S. Competitive Advantages Through It Innovation Adoption by Smes. Soc. Technol. 2012, 2, 24–39. [Google Scholar]
  41. Everett, M.R. Diffusion of Innovations, 5th ed.; Simon and Schuster: New York, NY, USA, 2003. [Google Scholar]
  42. Lai, Y.; Sun, H.; Ren, J. Article Information: Adoption in Logistics and Supply Chain Management: An Empirical. Int. J. Logist. Manag. 2018, 29, 676–703. [Google Scholar] [CrossRef]
  43. Wamba, S.F.; Gunasekaran, A.; Akter, S.; Ren, S.J.F.; Dubey, R.; Childe, S.J. Big Data Analytics and Firm Performance: Effects of Dynamic Capabilities. J. Bus. Res. 2017, 70, 356–365. [Google Scholar] [CrossRef] [Green Version]
  44. Tsai, M.C.; Lee, W.; Wu, H.C. Determinants of RFID Adoption Intention: Evidence from Taiwanese Retail Chains. Inf. Manag. 2010, 47, 255–261. [Google Scholar] [CrossRef]
  45. Salleh, K.A.; Janczewski, L.; Ahmad, K. Adoption of Big Data Solutions: A Study on Its Security Determinants Using Sec-TOE Framework. In Proceedings of the 2016 International Conference on Information Resources Management (CONF-IRM), Cape Town, South Africa, 18–20 May 2016; Volume 66. [Google Scholar]
  46. Gangwar, H.; Date, H.; Raoot, A.D. Review on IT Adoption: Insights from Recent Technologies. J. Enterp. Inf. Manag. 2014, 27, 488–502. [Google Scholar] [CrossRef]
  47. Surabhi, V.; Sekhar, B. Perceived Strategic Value Based Adoption of Big Data Analytics in Emerging Economy: A Qualitative Approach for Indian Firms. Eletronic Libr. 2017, 30, 1–36. [Google Scholar]
  48. Donald, C.H. Top Management Teams. In Wiley Encyclopedia of Management; John Wiley & Sons: Hoboken, NJ, USA, 2014; pp. 1–2. [Google Scholar]
  49. Boumediene, R.; Peter, K. Sme Adoption of Enterprise Systems in the Northwest of England: An Environmental, Technological, and Organizational Perspective. IFIP Int. Work. Conf. Organ. Dyn. Technol. Innov. 2007, 235, 409–430. [Google Scholar] [CrossRef]
  50. Karahanna, E.; Preston, D. The Effect of Social Capital of the Relationship between the Cio and Top Management Team on Firm Performance. J. Manag. Inf. Syst. 2013, 30, 15–56. [Google Scholar] [CrossRef]
  51. Eder, L.B.; Igbaria, M. Determinants of Intranet Diffusion and Infusion. Omega 2001, 29, 233–242. [Google Scholar] [CrossRef]
  52. Chen, D.Q.; Preston, D.S.; Swink, M. How the Use of Big Data Analytics Affects Value Creation in Supply Chain Management. J. Manag. Inf. Syst. 2015, 32, 4–39. [Google Scholar] [CrossRef]
  53. Tsai, M.C.; Lai, K.H.; Hsu, W.C. A Study of the Institutional Forces Influencing the Adoption Intention of RFID by Suppliers. Inf. Manag. 2013, 50, 59–65. [Google Scholar] [CrossRef]
  54. Jeyaraj, A.; Rottman, J.W.; Lacity, M.C. A Review of the Predictors, Linkages, and Biases in IT Innovation Adoption Research. J. Inf. Technol. 2006, 21, 1–23. [Google Scholar] [CrossRef]
  55. Ghobakhloo, M.; Arias-Aranda, D.; Benitez-Amado, J. Adoption of E-Commerce Applications in SMEs. Ind. Manag. Data Syst. 2011, 111, 1238–1269. [Google Scholar] [CrossRef]
  56. Grandon, E.E.; Pearson, J.M. Electronic Commerce Adoption: An Empirical Study of Small and Medium US Businesses. Inf. Manag. 2004, 42, 197–216. [Google Scholar] [CrossRef]
  57. Hsu, P.F.; Ray, S.; Li-Hsieh, Y.Y. Examining Cloud Computing Adoption Intention, Pricing Mechanism, and Deployment Model. Int. J. Inf. Manag. 2014, 34, 474–488. [Google Scholar] [CrossRef]
  58. Bauer, R.A. Consumer Behaviour as Risk Taking. In Risk Taking and Information Handling in Consumer Behaviour; Boston University Press: Boston, MA, USA, 1960; pp. 23–33. [Google Scholar]
  59. Kesharwani, A.; Bisht, S.S. The Impact of Trust and Perceived Risk on Internet Banking Adoption in India: An Extension of Technology Acceptance Model. Int. J. Bank Mark. 2012, 30, 303–322. [Google Scholar] [CrossRef]
  60. Al Nuaimi, E.; Al Neyadi, H.; Mohamed, N.; Al-Jaroodi, J. Applications of Big Data to Smart Cities. J. Internet Serv. Appl. 2015, 6, 1–15. [Google Scholar] [CrossRef] [Green Version]
  61. Danese, P.; Kalchschmidt, M. The Role of the Forecasting Process in Improving Forecast Accuracy and Operational Performance. Int. J. Prod. Econ. 2011, 131, 204–214. [Google Scholar] [CrossRef]
  62. Sharma, S.; Modgil, S. TQM, SCM and Operational Performance: An Empirical Study of Indian Pharmaceutical Industry. Bus. Process Manag. J. 2020, 26, 331–370. [Google Scholar] [CrossRef]
  63. Müller, O.; Fay, M.; vom Brocke, J. The Effect of Big Data and Analytics on Firm Performance: An Econometric Analysis Considering Industry Characteristics. J. Manag. Inf. Syst. 2018, 35, 488–509. [Google Scholar] [CrossRef]
  64. Arunachalam, D.; Kumar, N.; Kawalek, J.P. Understanding Big Data Analytics Capabilities in Supply Chain Management: Unravelling the Issues, Challenges and Implications for Practice. Transp. Res. Part E Logist. Transp. Rev. 2018, 114, 416–436. [Google Scholar] [CrossRef]
  65. Ahani, A.; Rahim, N.Z.A.; Nilashi, M. Forecasting Social CRM Adoption in SMEs: A Combined SEM-Neural Network Method. Comput. Hum. Behav. 2017, 75, 560–578. [Google Scholar] [CrossRef]
  66. Raut, R.D.; Mangla, S.K.; Narwane, V.S.; Gardas, B.B.; Priyadarshinee, P.; Narkhede, B.E. Linking Big Data Analytics and Operational Sustainability Practices for Sustainable Business Management. J. Clean. Prod. 2019, 224, 10–24. [Google Scholar] [CrossRef]
  67. Khayer, A.; Talukder, M.S.; Bao, Y.; Hossain, M.N. Cloud Computing Adoption and Its Impact on SMEs’ Performance for Cloud Supported Operations: A Dual-Stage Analytical Approach. Technol. Soc. 2020, 60, 101225. [Google Scholar] [CrossRef]
  68. Wongsuwatt, S.; Suntrayuth, S. The Influence of Risk Perception and Proactive Behavior on Performance of Firms: The Moderating Roles of Organizational Units and Types of Firms. J. Risk Manag. Insur. 2019, 23, 1–14. [Google Scholar]
  69. Raut, R.D.; Mangla, S.K.; Narwane, V.S.; Dora, M.; Liu, M. Big Data Analytics as a Mediator in Lean, Agile, Resilient, and Green (LARG) Practices Effects on Sustainable Supply Chains. Transp. Res. Part E Logist. Transp. Rev. 2021, 145, 102170. [Google Scholar] [CrossRef]
  70. Ruiz-Palomo, D.; Diéguez-Soto, J.; Duréndez, A.; Santos, J.A.C. Family Management and Firm Performance in Family SMEs: The Mediating Roles of Management Control Systems and Technological Innovation. Sustainability 2019, 11, 3805. [Google Scholar] [CrossRef] [Green Version]
  71. Hayes, A.F. Introduction to Mediation, Moderation, and Conditional Process Analysis, 2nd ed.; The Guilford Press: New York, NY, USA, 2018. [Google Scholar]
  72. O’Rourke, N.; Hatcher, L. A Step-By-Step Approach to Using SAS for Factor Analysis and Structural Equation Modeling, 2nd ed.; SAS Institute Inc.: Cary, NC, USA, 2013. [Google Scholar]
  73. Wong, K.K.-K. Partial Least Squares Structural Equation Modeling (PLS-SEM) Techniques Using SmartPLS. Mark. Bull. 2013, 24, 1–32. [Google Scholar]
  74. Kline, R.B. Principles and Practice of Structural Equation Modeling, 4th ed.; Guilford Publications: New York, NY, USA, 2016. [Google Scholar]
  75. Jaya, I.G.M.; Hermina, N.; Sunengsih, N. CB-SEM and VB-SEM: Evaluating Measurement Model of Business Strategy of Internet Industry in Indonesia. Int. J. Sci. Eng. Res. 2019, 10, 878–883. [Google Scholar]
  76. Podsakoff, P.M.; MacKenzie, S.B.; Lee, J.Y.; Podsakoff, N.P. Common Method Biases in Behavioral Research: A Critical Review of the Literature and Recommended Remedies. J. Appl. Psychol. 2003, 88, 879–903. [Google Scholar] [CrossRef] [PubMed]
  77. Hair, J.F., Jr.; Matthews, L.M.; Matthews, R.L.; Sarstedt, M. PLS-SEM or CB-SEM: Updated Guidelines on Which Method to Use. Int. J. Multivar. Data Anal. 2017, 1, 107. [Google Scholar] [CrossRef]
  78. Rönkkö, M.; Cho, E. An Updated Guideline for Assessing Discriminant Validity. Organ. Res. Methods 2022, 25, 6–14. [Google Scholar] [CrossRef]
  79. Fornell, C.; Larcker, D.F.; Fornell, C.; Larcker, D.F. Evaluating Structural Equation Models with Unobservable Variables and Measurement Error. J. Mark. Res. 1981, 18, 39–50. [Google Scholar] [CrossRef]
  80. Ramayah, T.; Cheah, J.; Chuah, F.; Ting, H.; Memon, M.A. Partial Least Squares Structural Equation Modeling (PLS-SEM) Using SmartPLS 3.0: An Updated Guide and Practical Guide to Statistical Analysis, 1st ed.; Pearson: Kuala Lumpure, Malaysia, 2016. [Google Scholar]
  81. Leguina, A. A Primer on Partial Least Squares Structural Equation Modeling (PLS-SEM). Int. J. Res. Method Educ. 2015, 38, 220–221. [Google Scholar] [CrossRef]
  82. Diamantopoulos, A.; Siguaw, J.A. Formative versus Reflective Indicators in Organizational Measure Development: A Comparison and Empirical Illustration. Br. J. Manag. 2006, 17, 263–282. [Google Scholar] [CrossRef]
  83. Raguseo, E.; Vitari, C. Investments in Big Data Analytics and Firm Performance: An Empirical Investigation of Direct and Mediating Effects. Int. J. Prod. Res. 2018, 56, 5206–5221. [Google Scholar] [CrossRef]
  84. Kock, N.; Lynn, G.S. Lateral Collinearity and Misleading Results in Variance-Based SEM: An Illustration and Recommendations. J. Assoc. Inf. Syst. 2012, 13, 546–580. [Google Scholar] [CrossRef] [Green Version]
  85. Cohen, J. Statistical Power Analysis for the Behavioural Sciences, 2nd ed.; Lawrence Erlbaum Associates: Hillsdale, NJ, USA, 1988. [Google Scholar]
  86. Memon, M.A.; Cheah, J.H.; Ramayah, T.; Ting, H.; Chuah, F. Mediation Analysis Issues and Recommendations. J. Appl. Struct. Equ. Model. 2018, 2, I–IX. [Google Scholar] [CrossRef]
  87. Zhu, K.; Kraemer, K.L.; Xu, S. The Process of Innovation Assimilation by Firms in Different Countries: A Technology Diffusion Perspective on e-Business. Manag. Sci. 2006, 52, 1557–1576. [Google Scholar] [CrossRef] [Green Version]
  88. Eu Lay, T.; Suraya, M.; Norasnita, A.; Norris, S.A. Big Data Analytics Adoption Model for Malaysian SMEs. Emerg. Trends Intell. Comput. Inform. 2020, 1073, 45–53. [Google Scholar] [CrossRef]
  89. LaMorte, W.W. Diffusion of Innovation Theory. Available online: https://sphweb.bumc.bu.edu/otlt/mph-modules/sb/behavioralchangetheories/behavioralchangetheories4.html (accessed on 6 August 2021).
Figure 1. Research Framework.
Sustainability 14 07316 g001
Table 1. Description of Respondents (n = 169).
Demographic ProfileFrequencyPercentage
Job Position:
CEO/Owner2514.79
Senior Manager52.96
Executive8047.34
Authorized Personnel5934.91
Number of Employees:
5–291710.06
30–756840.24
>758449.70
Business Sector:
Service Sector7443.79
Of which:
Business Services79.46
Constructions and Related Engineering1824.32
Education2027.03
Health and Related Social Services1824.32
Tourism and Related Travel1114.86
Manufacturing Sector9556.21
Of which:
Automotive Industry1111.58
Electrical and Electronics Industry3233.68
Machinery and Equipment Industry1920.00
Iron Steel Industry1111.58
Food Industry1010.53
Pharmaceutical Industry1212.63
Table 2. Factor Loadings (Explanation for abbreviation provided in Abbreviations part).
ConstructsItemsInitial LoadingModified LoadingCRAVEVIF
CompatibilityTCPT10.8590.8650.8770.6441.126
TCPT20.7610.766
TCPT30.8610.876
TCPT40.6590.688
TCPT50.195Deleted b
ComplexityTCPX1−0.146Deleted a0.8730.7761.022
TCPX20.644Deleted c
TCPX30.5910.939
TCPX40.5650.819
TCPX50.241Deleted b
TrialabilityTTRL10.6570.6570.8400.5141.104
TTRL20.6780.678
TTRL30.7120.713
TTRL40.8070.808
TTRL50.7190.719
Top ManagementOTMS10.7240.7250.8820.6001.144
OTMS20.7600.760
SupportOTMS30.6870.687
OTMS40.8320.832
OTMS50.8570.857
Organizational
Readiness
OORD10.374Deleted b0.9350.7821.144
OORD20.8770.879
OORD30.8690.877
OORD40.8800.895
OORD50.8780.885
CompetitiveECPR10.7340.7340.8740.5821.195
PressureECPR20.7840.784
ECPR30.7020.703
ECPR40.8200.820
ECPR50.7690.769
External SupportEESP10.5710.5720.8670.5701.195
EESP20.7820.782
EESP30.8240.824
EESP40.8160.816
EESP50.7520.751
Privacy andRPNS10.7010.6970.8320.5021.037
SecurityRPNS20.7380.740
RPNS30.8220.822
RPNS40.5600.560
RPNS50.6950.696
Data QualityRDQT10.8260.8260.8870.6121.036
RDQT20.8170.816
RDQT30.7470.748
RDQT40.7530.754
RDQT50.7650.765
Resource RiskRRSR10.393Deleted b0.8580.6031.010
RRSR20.7620.830
RRSR30.7360.802
RRSR40.5720.675
RRSR50.8200.789
Strategic ValueASTR10.6430.6410.8480.5321.164
ASTR20.7610.758
ASTR30.8200.823
ASTR40.8150.817
ASTR50.5760.575
TransactionalATSC10.8740.8770.9440.8082.099
ValueATSC20.9360.936
ATSC30.8980.900
ATSC40.8790.881
ATSC5−0.111Deleted a
TransformationalATFM10.8440.8510.9180.7381.982
ValueATFM20.8490.845
ATFM30.8920.894
ATFM40.8400.845
ATFM5−0.155Deleted a
InformationalAIFM10.8150.8150.9170.6901.832
ValueAIFM20.8930.891
AIFM30.8900.889
AIFM40.7090.711
AIFM50.8320.833
DemandPDMF10.8320.8310.9240.7081.557
ForecastPDMF20.8420.842
PDMF30.8490.849
PDMF40.8730.874
PDMF50.8110.812
Supply ChainPSPC10.8290.8280.9080.6641.557
PSPC20.7800.780
PSPC30.8590.859
PSPC40.7830.784
PSPC50.8210.821
Deleted a: Item removed due to negative loadings. Deleted b: Item removed due to loading less than 0.40. Deleted c: Item removed due to AVE less than 0.50.
Table 3. Paths Coefficient and R2.
ConstructPath CoefficientR2
Technological Context0.7250.526
Organizational Context0.8380.702
Environmental Context0.8090.655
Perceived Risk0.8310.691
DAA0.9060.821
Operational Performance0.8800.775
Table 4. Decision in Retaining or Removing Formative Indicators.
ConstructItemsOuter Weight t-Value (A)Outer LoadingOuter Loading t-Value (B)Decision
Technological ContextCompatibility3.8190.6546.133
Complexity1.087−0.0650.449Deleted
Trialability8.3120.91017.095
Organizational ContextTop Management Support10.9620.89621.882
Organizational Readiness5.7140.73311.335
Environmental ContextCompetitive Pressure4.1510.7609.153
External Support7.0660.90216.854
Perceived RiskPrivacy and Security4.4940.7276.225
Data Quality5.0370.7536.191
Resource Risk1.9290.2591.702Deleted
DAAStrategic Value8.9110.91221.508
Transactional Value0.5460.4834.198Retained
Transformational Value2.2850.6286.496
Informational Value2.2500.6486.115
Operational PerformanceDemand Forecast9.3550.94540.226
Supply Chain4.9070.82816.908
Table 5. VIFs for Lateral Collinearity Assessment.
ConstructDAAOperational Performance
DAA 1.748
Technological Context1.4441.556
Organizational Context1.8201.918
Environmental Context1.7361.805
Perceived Risk1.5151.549
Table 6. Results of Direct Path Analysis (H1 to H5).
HypothesisRelationshipStd. BetaStd. Errort-Valuep-ValueBCa-CI0.025BCa-CI0.975DecisionR2f2Q2
H1TC→DAA0.2530.0942.6760.0070.0890.445Supported0.4280.0770.176
H2OC→DAA0.2360.0952.4980.0130.0570.423Supported0.054
H3EC→DAA0.1990.0872.2860.0220.0240.372Supported0.040
H4PR→DAA0.1410.0931.5150.130−0.0470.308Not Supported0.023
H5DAA→OP0.4040.0884.611<0.0010.2430.591Supported0.5670.2160.418
Note: Bootstrapping of 5000 at 95% confidence interval.
Table 7. Results of Mediation Analysis (H6 to H9).
HypothesisRelationshipStd. BetaStd. Errort-Valuep-ValueBCa-CI0.025BCa-CI0.975Decision
H6TC→DAA→OP0.1020.0442.3130.0210.0280.197Supported
H7OC→DAA→OP0.0950.0432.9180.0280.0230.192Supported
H8EC→DAA→OP0.0800.0441.8220.0680.0090.178Supported
H9PR→DAA→OP0.0570.0401.4130.158−0.0100.151Not Supported
Note: Bootstrapping of 5000 at 95% confidence interval.
Table 8. Path Coefficients Effects of Mediation Model.
Mediation Pathwaya Coefficientb CoefficientIndirect Effect (IE) (a × b)Direct Effect (DE) (c’)Total Effect (TE = IE + DE)IE/TE
H6: TC→DAA→OP0.2530.4040.1020.1610.26338.8%
H7: OC→DAA→OP0.2360.0950.3060.40123.6%
H8: EC→DAA→OP0.1990.0800.1040.18443.5%
H9: PR→DAA→OP0.1410.057−0.095−0.038−150.0%
Note: H9 is unsupported.
Publisher’s Note: MDPI stays neutral with regard to jurisdictional claims in published maps and institutional affiliations.

