Article

Evolutionary Game Theory and the Simulation of Green Building Development Based on Dynamic Government Subsidies

College of Civil Science and Engineering, Yangzhou University, Yangzhou 225127, China
*
Author to whom correspondence should be addressed.
Sustainability 2022, 14(12), 7294; https://doi.org/10.3390/su14127294
Submission received: 2 April 2022 / Revised: 10 June 2022 / Accepted: 10 June 2022 / Published: 14 June 2022
(This article belongs to the Section Green Building)

Abstract

:
The carbon emissions of the construction industry pose a significant challenge to implementing China’s carbon peaking and carbon neutrality goals. This study considered how to promote stable green building (GB) development. First, evolutionary game theory (EGT) was applied to examine the interaction mechanism of complex behaviors between governments and developers, constructing two scenarios of static and dynamic subsidies. Second, we proposed the ideal state where the government does not give funding subsidies and developers take the initiative to build GBs. On this basis, the simulation method was used to verify the game models and primary conclusions. Finally, a detailed sensitivity analysis of selected parameters was undertaken. The results demonstrated that subsidy policy phase-outs could help in the development of GBs; the probability of an ideal state was positively correlated with government supervision and punishment, and it was negatively correlated with government funding subsidies. The research results can be used as a reference for the government to improve incentive measures and decision support for stakeholders to adjust their strategies.

1. Introduction

Rapid global economic development has led to a series of energy and environmental problems [1], and carbon emissions originating from building operations rose to an all-time high of approximately 10 billion tons by the end of 2019, accounting for 28% of the total global energy-related carbon emissions. Combined with emissions from the building construction sector, this represents 38% of the total global energy-related carbon emissions [2,3]. Facing the problems of energy supply shortages, energy conservation, and emission reduction, the development of GB has become part of the development vision of the country and society [4]. GB’s whole life cycle carbon dioxide (LCCO2) is lower than that of non-GB by 10% for residential and 32% for commercial buildings [5]. According to China’s Assessment standard for green building, a GB is defined as a high-quality building that saves resources; protects the environment; reduces pollution; provides people with healthy, suitable, and efficient use of space; and maximizes the harmonious coexistence between human beings and nature during the whole life cycle [6]. Given the characteristics of GBs, buildings and urban communities composed of buildings can be transformed from pure energy consumers to renewable energy providers and will play an indispensable and important role in the urban carbon neutralization path.
In today’s China, the GB industry is strategically important because it represents a major attempt by the construction industry to save energy and reduce carbon emissions [7]. As far as the whole country is concerned, the regional development of GBs is not balanced: most of the GB evaluation and marking projects are concentrated mainly in Jiangsu, Guangdong, Shandong, Shanghai, Tianjin, Zhejiang, and other economically developed eastern coastal areas. Even in the same province, such as Jiangsu Province, the projects are concentrated in the south of Jiangsu Province [8] (see Figure 1 and Figure 2). In recent years, Chinese governments at all levels have introduced various regulations and policies to regulate the GB market and stimulate the development of GBs [9]. In 2017, the “13th Five-Year Plan” for the development of building energy efficiency and GBs proposed that by 2020, the proportion of GBs in new buildings in urban areas nationwide would exceed 50%, with a new GB area of more than 2 billion square meters. By the end of 2020, a total of 23,700 building projects in China were awarded the GB evaluation mark, with a building area of 2.433 billion square meters (see Figure 3), and the proportion of GBs in new buildings in urban areas nationwide exceeded 50% [10]. To ensure the high-quality development of GBs, the Ministry of Housing and Urban-Rural Development of China (MOHURD) issued the GB label management measures in 2021 to strengthen the operation and management of GBs [11].
The state introduced a series of policies and measures to encourage the construction of GBs. Some provinces and cities also introduced specific incentive rules to actively create an atmosphere conducive to the development of GBs in the market. However, the development of GB is seriously hindered by the general lack of awareness of GBs among developers and the lack of clear government incentives. Therefore, the government needs to optimize the subsidy policy and encourage more developers to build GBs.
The development of GB has been explored extensively in the field of engineering technology and project management. Evolutionary game theory is used to study the strategy selection among the main participants of GB [12,13]. Although scientists conduct a lot of research on GBs, most of the work is mainly at the macro-level of GBs, such as legal policies [14] and drivers [15].
However, there exists a strong need for an understanding of stakeholder strategy choices in the field of GBs, such as the following: (1) The conditions for the emergence of a Nash equilibrium in the imperfect information game scenario. (2) What conditions exist for stakeholders in an evolutionary game to have stable points? (3) An ideal point event: the government does not adopt a funding subsidy policy and developers take the initiative to develop a GB strategy. Most studies mainly focused on the strategies adopted by three stakeholders, namely, government, developers, and consumers, around GBs [16].
In this study, we investigated the decision-making process of stakeholders in the development of GBs by (1) classifying GBs by carbon emissions in the operational phase, (2) constructing a dynamic government subsidy based on the degree of GB market regularization, and (3) proposing the ideal point state: no financial subsidies from the government and developers take the initiative to build GBs.

2. Related Literature

The literature review section of this paper drew on [17,18] and the search tool of the Web of Science was used to search the literature within the past five years using “GB”, “government”, and “incentive” as keywords, where a total of 111 papers were retrieved. The research purpose of this study was to analyze the factors affecting the development of GBs and then to explore the strategies of the stakeholders in the process of GB development. Therefore, 19 papers containing stakeholder papers and review papers studying the factors influencing GB development in China were screened. The review of these 19 outstanding papers is reported in Table 1.
Table 1 shows that (1) the role of the government in the development of GBs is very important, (2) certain financial incentives help to increase the degree of willingness of developers to build GBs, (3) most of the policies found in these studies were generally static policies and did not consider the applicability of policies in the process of GB market development, and (4) the combination of positive (subsidies) and negative (punishment) policy incentive measures will be the better way to promote GBs.
A series of works were carried out by scholars on the research into the influencing factors and incentive mechanisms of GB projects. Researchers’ empirical studies on factors related to the development of GB projects in China also provide a reliable basis for conducting incentive studies on GB projects. However, existing studies in the literature mainly consider GBs as a single subject to explore the influencing factors that constrain their development or use EGT to analyze the models of participating subjects, generally ignoring the fact that different levels of GBs have different incremental costs. GBs are divided into four levels: basic, one-star, two-star, and three-star, with the basic standard being the lowest and the three-star standard being the highest, where the specific certification standard requirements can be found in the Assessment standard for green building. The incremental cost of a one-star GB is one-seventh of that of a three-star building. The higher the level of a GB, the greater its incremental cost, which is the main factor that hinders the development of GBs. Carbon emissions are one of the important factors in approving the grade of GBs. Based on this, dynamic subsidies are given according to the annual carbon emissions per unit area in the operation stage of a GB. The scale development of the GB market uses EGT to analyze the decision-making process of developers and the government, uses Matlab for simulation analysis, and gives policy recommendations in the process of GB promotion and implementation.

3. Model

3.1. Application of Evolutionary Game

In this study, an evolutionary game model was applied to analyze how the strategic choices of the government and developments might change following the changes in different variables. Game theory provides a mathematical framework for analyzing strategic choice situations in terms of stakeholders [36]. In recent years, EGT has been applied to many professional fields, such as energy [37], architecture [38], and the environment [39], instead of classical game theory. Classical game theory assumes that participants have complete rationality in the case of complete information. In contrast, EGT assumes that participants have bounded rationality and an incomplete information environment [17]. At present, the incentive policy of GB is in the development stage and the participants can adjust the strategy according to the environment, policy, and benefits. Therefore, this study used EGT to carry out a long-term dynamic game between bounded rationality participants. The evolutionary stable strategy (ESS) is not an absolute existence in some evolutionary games [40]. When the government and developers do not fully understand each other’ s intentions and market environment changes, EGT provides a mechanism to analyze the behavior of such a system. Classical game theory often cannot describe the best behavior from the perspective of optimality and stability [41]. Moreover, EGT is more advantageous when analyzing the dynamics of strategy change. In reality, the strategic choices of government and developers will change over time in response to environmental changes. EGT provides a basis for understanding the dynamic iterations in the background of strategic interactions. As mentioned above, this study selected EGT as the research method.

3.2. Carbon Emission Factor Method

A report on the State of the Global Building and Construction Industry in 2020 pointed out that during the entire life cycle of a building, carbon emissions during the operation of the building account for 35% to 38% of the total carbon emissions. Based on the actual situation of China’s construction industry, building carbon emissions are mainly concentrated in the operation stage, followed by the building materials transportation stage.
Therefore, the energy consumption during the operational phase of the building was selected as the basis for calculating the carbon emissions of GBs. Then, we assessed the subsidy level received by developers developing GB projects. This study used the carbon emissions factor method to measure carbon emissions. As a widely used method for measuring carbon emissions, the basic idea of the carbon emissions factor method is to construct activity data and emissions factors for each source according to the carbon emissions inventory list, and multiply the activity data and emission factors to obtain the carbon emissions of a source [42,43]; the calculation formula for this is as follows:
e = i = 1 n A D i × E F i
where A D i is the use or input of the carbon emissions source i and E F i is the carbon emissions released per unit of use of the emissions source i.

3.3. Model Assumption

Assumption 1: All participants in the game system have bounded rationality [17] and the information they have is not completely symmetrical. During the evolutionary process, the influence of other factors on the system is not considered, and the government and developers are regarded as a complete system. With time t as a variable, the two parties in the game will adjust their strategies according to the decision-making behavior of the other party during the evolution process to maximize their benefits.
Assumption 2: The policy sets of the government and the developer are S G = E , N E and S C = G C , N G C , respectively, where E and N E indicate that the government adopts a subsidy policy and does not adopt a subsidy policy, respectively, and G C   and   N G C indicate that developers develop GBs and traditional buildings, respectively.
Assumption 3: The carbon emissions were calculated based on the carbon emission factor method to determine the GB subsidy σ R . This study assumed that it ranged from levels 1 to 5, with level 3 as the benchmark, that is, the coefficient σ = 1 .
Parameter assumptions:
In this article, x   and   y represent the probability that the government adopts the subsidy policy and the developer develops GBs, respectively, where x , y 0 , 1 are all functions of time t and the relevant parameter assumptions [13,15,19] are shown in Table 2.

3.4. Model Analysis

According to the assumptions and basic symbol table, a payoff matrix for both players under different strategies is shown in Table 3.

3.4.1. Strategy Stability Analysis of Government

The income matrix of the government is defined as G , which is shown as follows:
G = r 4 σ R c 3 + λ M c 4 c 3 + q r 4 c 4 .
The expected utility of the government that adopts the subsidy policy is
E S = ( r 4 σ R c 3 + λ M ) y + ( c 4 c 3 + q ) ( 1 y ) .
The expected utility of the government that makes the decision not to adopt the subsidy policy is
E N S = r 4 y c 4 ( 1 y ) .
The government’s average expected return is
E G = x E S + ( 1 - x ) E N S .
According to the EGT analysis method [25], the government’s replicator dynamics equations are obtained as follows:
F x = d x d t = x ( E S E G ) = x ( 1 x ) q c 3 + λ M q σ R y .
The first derivative is as follows:
F x = d F x d x = ( 1 2 x ) q c 3 + λ M q σ R y .
Obviously, x = 0 , x = 1 , y = c 3 q λ M q σ R are roots of F x = 0 . Based on the stability theorem, when F x = 0 , F x 0 , x is an ESS.
If y = q c 3 q + σ R λ M , then for any x [ 0 , 1 ] , F x = 0 , F x = 0 , the x-axis is in a stable state [25] and any production strategy of the government is a stable strategy.
If y q c 3 q + σ R λ M , then we analyze the different cases of q c 3 q + σ R λ M as follows:
(1)
When q c 3 q + σ R λ M < 0 , y > q c 3 q + σ R λ M ; if q c 3 < 0 < q + σ R λ M , then F x = 0 < 0 , F x = 1 > 0 , and we can see that x = 0 is the only ESS, and the bounded rational government will not adopt a funding subsidy policy; if q + σ R λ M < 0 < q c 3 , then F x = 0 > 0 , F x = 1 < 0 , we can see that x = 1 is the only ESS, and the bounded rational government will adopt a funding subsidy policy.
(2)
When 0 < q c 3 q + σ R λ M < 1 , y < q c 3 q + σ R λ M ; if 0 < q c 3 < q + σ R λ M , then F x = 0 > 0 , F x = 1 < 0 , x = 1 is the only ESS, and the bounded rational government will adopt a funding subsidy policy; if q + σ R λ M < q c 3 < 0 , then F x = 0 < 0 , F x = 1 > 0 , x = 0 is the only ESS, and the bounded rational government will not adopt a funding subsidy policy.
When 0 < q c 3 q + σ R λ M < 1 , y > q c 3 q + σ R λ M ; if 0 < q c 3 < q + σ R λ M , then F x = 0 < 0 , F x = 1 > 0 , x = 0 is the only ESS, and the bounded rational government will not adopt a funding subsidy policy; if q + σ R λ M < q c 3 < 0 , then F x = 0 > 0 , F x = 1 < 0 , x = 1 is the only ESS, and the bounded rational government will adopt a funding subsidy policy.
(3)
When q c 3 q + σ R λ M > 1 , y < q c 3 q + σ R λ M ; if q c 3 < q + σ R λ M < 0 , then F x = 0 < 0 , F x = 1 > 0 , x = 0 is the only ESS, and the bounded rational government will not adopt a funding subsidy policy; if 0 < q + σ R λ M < q c 3 , then F x = 0 > 0 , F x = 1 < 0 , x = 1 is the only ESS, and the bounded rational government will adopt a funding subsidy policy.
The above shows that the government faces greater financial pressure while adopting the funding subsidy policy, and imposing penalties on developers for violations of regulations can alleviate some of the pressure. Therefore, as the punishment increases, the probability of a limited rational government adopting capital subsidies also increases.

3.4.2. Strategy Stability Analysis of Developer

The income matrix of the government is defined as C , which is shown as follows:
C = r 2 + r 3 c 2 + σ R λ M r 1 c 1 q r 2 + r 3 c 2 r 1 c 1 .
The expected utility of developers developing GBs is
E G C = ( r 2 + r 3 c 2 + σ R λ M ) x + ( r 2 + r 3 c 2 ) ( 1 x )
The expected utility of developers developing traditional buildings is
E N G C = ( r 1 c 1 q ) x + ( r 1 c 1 ) ( 1 x )
A developer’s average expected return is
E C = y E G C + ( 1 - y ) E N G C
The government’s replicator dynamics equations are obtained as follows:
F y = d y d t = y ( E G C E N G C ) = y ( 1 y ) q + σ R λ M x + r 2 + r 3 c 2 r 1 + c 1
The first derivative is as follows:
F y = d F y d y = ( 1 2 y ) q + σ R λ M x + r 2 + r 3 c 2 r 1 + c 1
Obviously, y = 0 , y = 1 , x = r 1 c 1 r 2 r 3 + c 2 q + σ R λ M are the roots of F y = 0 . Based on the stability theorem, when F y = 0 , F y 0 , y is an ESS.
If x = r 1 c 1 r 2 r 3 + c 2 q + σ R λ M , then for any y [ 0 , 1 ] , F y = 0 , F ( y ) = 0 , the y-axis is in a stable state, and any production strategy of the government is a stable strategy.
If x r 1 c 1 r 2 r 3 + c 2 q + σ R λ M , then we analyze the different cases of r 1 c 1 r 2 r 3 + c 2 q + σ R λ M as follows:
(1)
When r 1 c 1 r 2 r 3 + c 2 q + σ R λ M < 0 , x > r 1 c 1 r 2 r 3 + c 2 q + σ R λ M ; if r 1 c 1 r 2 r 3 + c 2 < 0 < q + σ R λ M , then F y = 0 > 0 , F ( y = 1 ) < 0 , we can see that y = 1 is the only ESS, and the bounded rational developer will adopt GBs; if q + σ R λ M < 0 < r 1 c 1 r 2 r 3 + c 2 , then F y = 0 < 0 , F ( y = 1 ) > 0 , we can see that y = 0 is the only ESS, and the bounded rational developer will adopt traditional buildings.
(2)
When 0 < r 1 c 1 r 2 r 3 + c 2 q + σ R λ M < 1 , x < r 1 c 1 r 2 r 3 + c 2 q + σ R λ M ; if 0 < r 1 c 1 r 2 r 3 + c 2 < q + σ R λ M , then F y = 0 < 0 , F ( y = 1 ) > 0 , y = 0 is the only ESS, and the bounded rational developer will adopt traditional buildings; if q + σ R λ M < r 1 c 1 r 2 r 3 + c 2 < 0 , then F y = 0 > 0 , F ( y = 1 ) < 0 , y = 1 is the only ESS, and the bounded rational developer will adopt GBs.
When 0 < r 1 c 1 r 2 r 3 + c 2 q + σ R λ M < 1 , x > r 1 c 1 r 2 r 3 + c 2 q + σ R λ M ; if 0 < r 1 c 1 r 2 r 3 + c 2 < q + σ R λ M , then F y = 0 > 0 , F ( y = 1 ) < 0 , y = 1 is the only ESS, and the bounded rational developer will adopt GBs; if q + σ R λ M < r 1 c 1 r 2 r 3 + c 2 < 0 , then F y = 0 < 0 , F ( y = 1 ) > 0 , y = 0 is the only ESS, and the bounded rational developer will adopt traditional buildings.
(3)
When r 1 c 1 r 2 r 3 + c 2 q + σ R λ M > 1 , x < r 1 c 1 r 2 r 3 + c 2 q + σ R λ M ; if r 1 c 1 r 2 r 3 + c 2 < q + σ R λ M < 0 , then F y = 0 > 0 , F ( y = 1 ) < 0 , y = 1 is the only ESS, and the bounded rational developer will adopt GBs; if 0 < q + σ R λ M < r 1 c 1 r 2 r 3 + c 2 , then F y = 0 < 0 , F ( y = 1 ) > 0 , y = 0 is the only ESS, and the bounded rational developer will adopt traditional buildings.
The above shows that without the current policy of subsidies, developers face relatively high capital costs when developing GBs. As such, bounded rational developers will choose to invest in traditional buildings. When the government grants financial subsidies, the probability of developers investing in GBs varies, while the government funding subsidies have increased accordingly.

3.4.3. ESS Analysis between Local Governments and Developers

The development of GBs can effectively reduce carbon emissions in the construction industry, and the government’s aim of adopting a punitive policy is to indirectly stimulate developers and guide them to invest in GB projects given the current situation that without policy support, the profit of traditional construction is higher than that of green construction. Furthermore, we discuss the dynamic evolution of the game system under the conditions of 0 < q c 3 < q + σ R λ M and 0 < r 1 c 1 r 2 r 3 + c 2 < q + σ R λ M , and the replicator dynamic system (I) was obtained, which is a two-dimensional nonlinear dynamic system for local governments and developers as follows:
F x = x ( 1 x ) q c 3 + λ M q σ R y F y = y ( 1 y ) q + σ R λ M x + r 2 + r 3 c 2 r 1 + c 1 .
The following equilibrium points of system (I) can be deduced:
0 , 0 , 0 , 1 , 1 , 0 , 1 , 1 , x * , y *
where x * = r 1 c 1 r 2 r 3 + c 2 q + σ R λ M , y * = q c 3 q + σ R λ M . According to the differential equation method for describing population evolution proposed by Friedman [44], it is known that the stability of the equilibrium point of the evolving system can be derived by analyzing the local stability of the Jacobi matrix of the evolving system. The Jacobian matrix J1 of this system is
J 1 = F ( x ) / x F ( x ) / y F ( y ) / x F ( y ) / y = a 11 a 12 a 21 a 22
where a 11 = ( 1 2 x ) q c 3 + λ M q σ R y , a 12 = x ( 1 x ) ( λ M q σ R ) , a 21 = y ( 1 y ) q + σ R λ M , and a 22 = ( 1 2 y ) q + σ R λ M x + r 2 + r 3 c 2 r 1 + c 1 .
When the equilibrium point satisfies det ( J ) > 0 , t r ( J ) < 0 , it is the stable point, namely, the ESS [16]. The local stability analysis of the equilibrium point is shown in Table 4.
It was calculated that ( 0 , 0 ) , ( 0 , 1 ) , ( 1 , 0 ) , ( 1 , 1 ) is a saddle point at the equilibrium point. At the point ( x * , y * ) , the characteristic root corresponding to a point is an imaginary number. According to related documents [45,46], it can be seen that a point is the center point of the system, but it is not asymptotically stable. The trajectory of system evolution is a closed-loop curve around the center point ( x * , y * ) . The closed-loop curve does not pass through the center point, and there is no limit cycle—that is, there is no ESS in the evolution system (I).

3.4.4. ESS Analysis of Both Parties in the Improved Evolutionary System Game

From the perspective of the macro development of the construction industry, with the development of GBs on a large scale, the government can abolish the policy of financial subsidies accordingly and further promote the development of GBs by increasing the supervision and implementing other related measures. This section presents the analysis results of the mixed strategies of both sides of the game in the evolutionary system based on the premise that the government’s financial subsidies are gradually eliminated. It was assumed that the government funding subsidies decreased with an increase in GB projects; that is, R became R ( y ) = α ( 1 y ) [36], where α denotes the phasing out rate. A new evolutionary system (II) was obtained:
F x = x ( 1 x ) q c 3 + λ M q σ R ( y ) y F y = y ( 1 y ) q + σ R ( y ) λ M x + r 2 + r 3 c 2 r 1 + c 1
The Jacobian matrix J2 of this system is
J 2 = F ( x ) / x F ( x ) / y F ( y ) / x F ( y ) / y = a 11 a 12 a 21 a 22
where a 11 = ( 1 2 x ) q c 3 + λ M q σ R ( y ) y , a 12 = x ( 1 x ) λ M q σ R ( y ) σ R ( y ) y , a 21 = y ( 1 y ) q + σ R ( y ) λ M , and a 22 = ( 1 2 y ) ( q + σ R ( y ) λ M ) x + r 2 + r 3 c 2 r 1 + c 1 + y ( 1 y ) σ R ( y ) x .
Under the condition of 0 < q c 3 < q + σ R ( y ) λ M and 0 < r 1 c 1 r 2 r 3 + c 2 < q + σ R ( y ) λ M , we analyzed the local stability of the equilibrium point of system (II). The local stability analysis of the equilibrium point is shown in Table 5, where x * = r 1 c 1 r 2 r 3 + c 2 q + σ R ( y ) λ M , y * = q c 3 q + σ R ( y ) λ M .
From Table 5, it can be seen that the stable strategy between the government and the developer ( 0 , 0 ) , ( 0 , 1 ) , ( 1 , 0 ) , ( 1 , 1 ) is a saddle point, indicating that under the circumstance of gradual changes in various external conditions, there is no very clear and stable strategy between the government and the developer. The stability strategy of both parties will be changed based on changes in external conditions, and then based on the stability analysis of the equilibrium point.
The ultimate goal of the government’s subsidy policy is to stimulate and promote the development of GBs. Therefore, with the stable development of GBs, the government will gradually remove the financial subsidies. Following that, the management will be further increased from the supervision level to regulate the resource treatment process, and whether developers choose GBs is influenced by the development of green technology, industry standards, and public green preferences. According to [36]: if x reaches 0 and y reaches 1, such a state is called an ideal state.
More specific effects of different parameters on the dynamic evolutionary path of the occurring probability for the ideal state will be discussed in Section 4.2.

4. Numerical Simulations and Discussion

The focus of this study was to analyze the trends in the strategic choices of the two sides of the game in the evolutionary system and their relationship with the probability of the ideal state when the parameters in the model changed. To more intuitively express the effect of important parameter changes on the strategies of both sides of the game, Matlab was selected for the numerical simulation analysis.

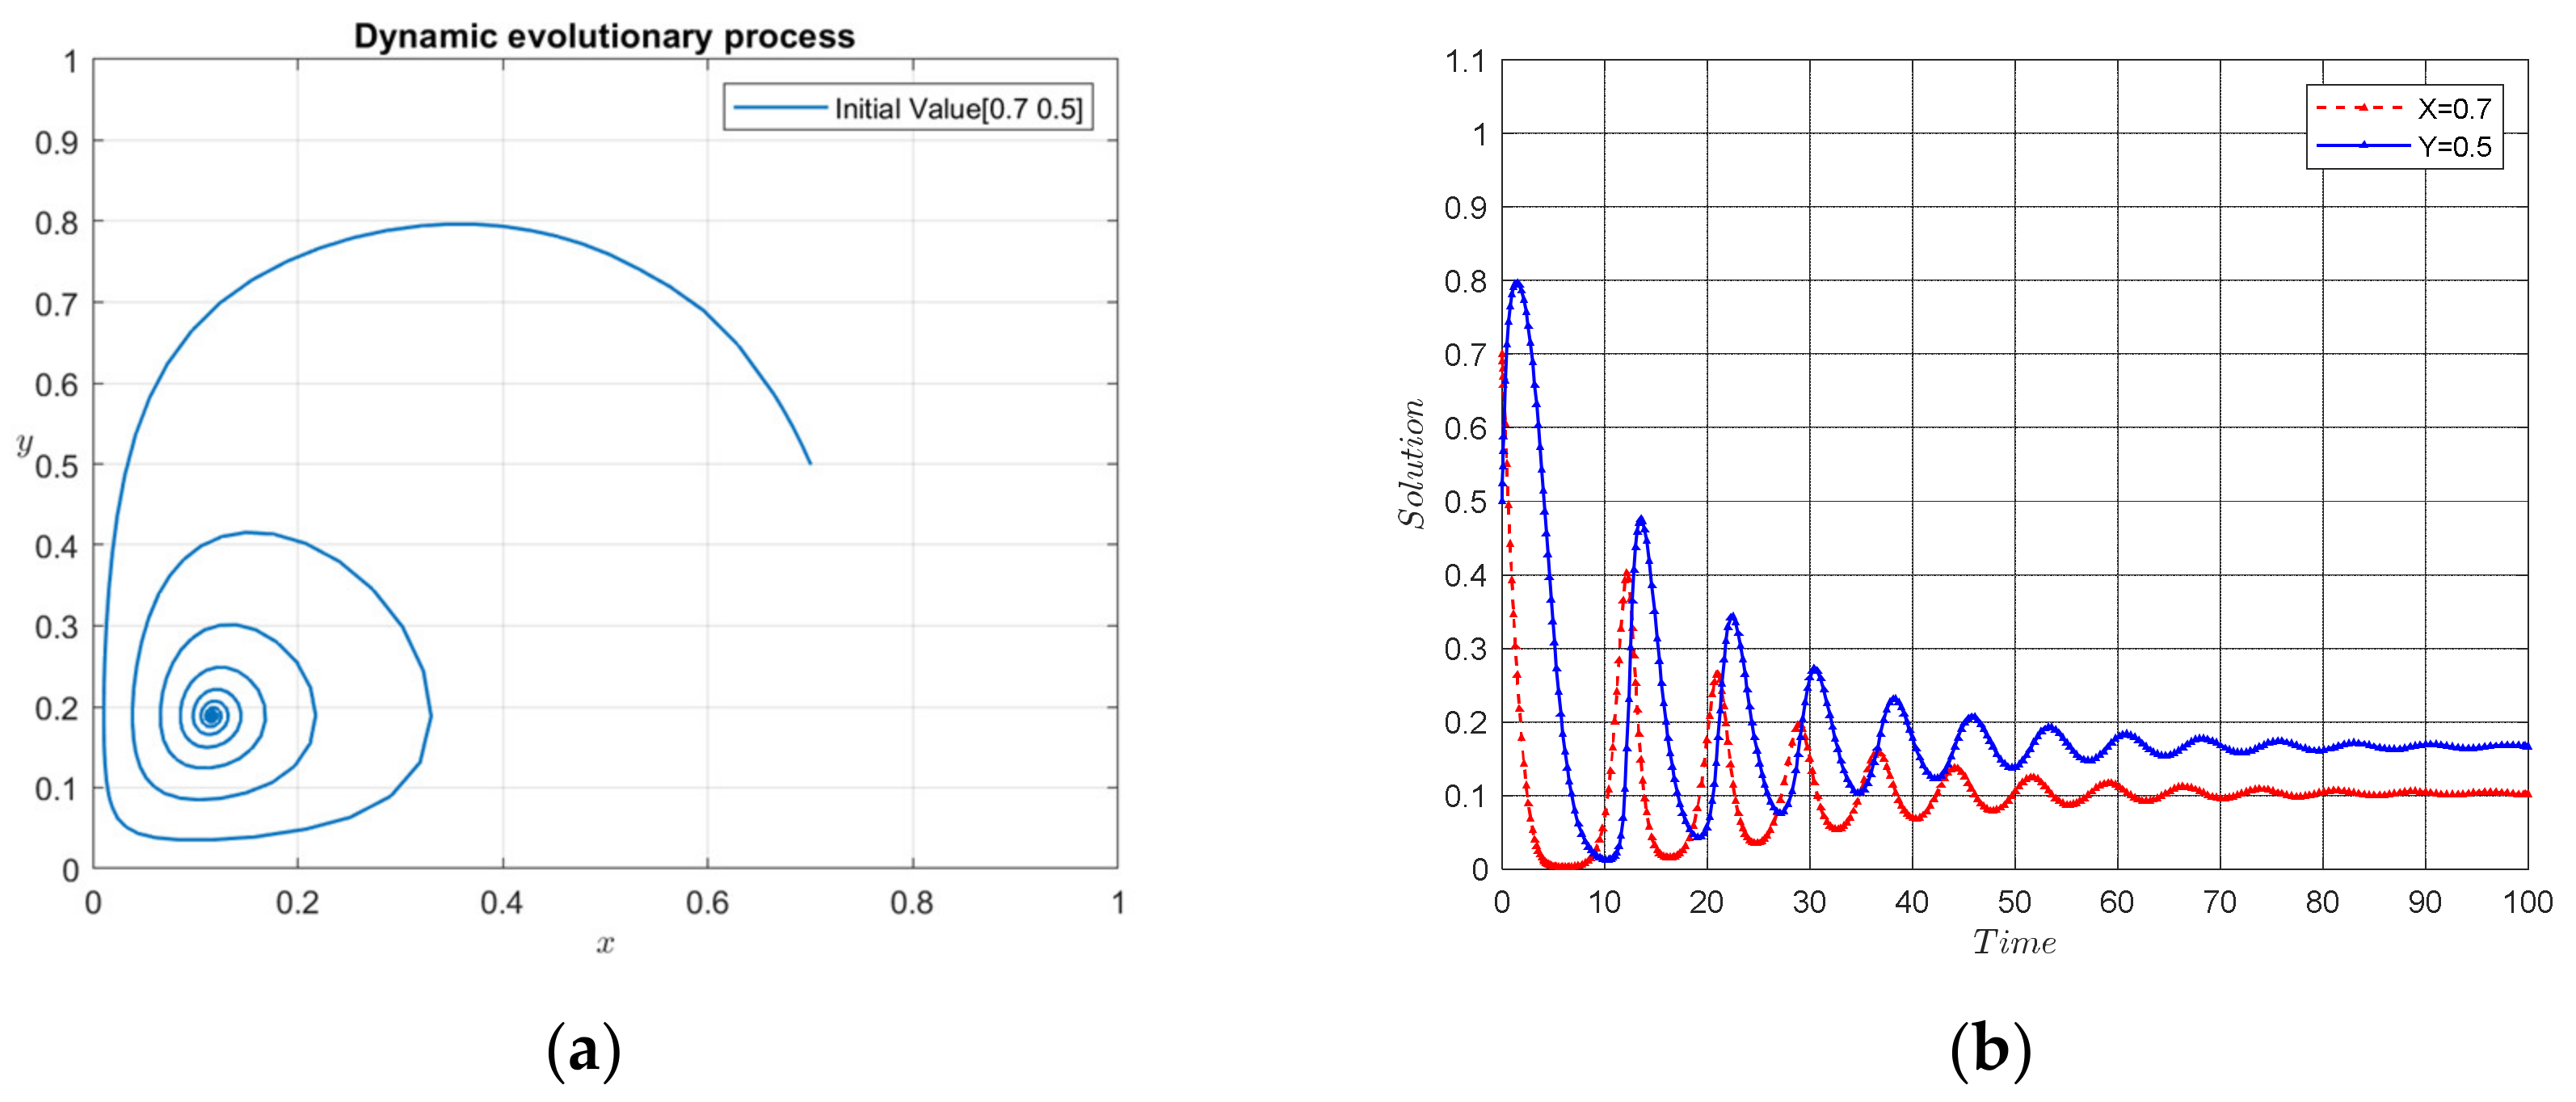
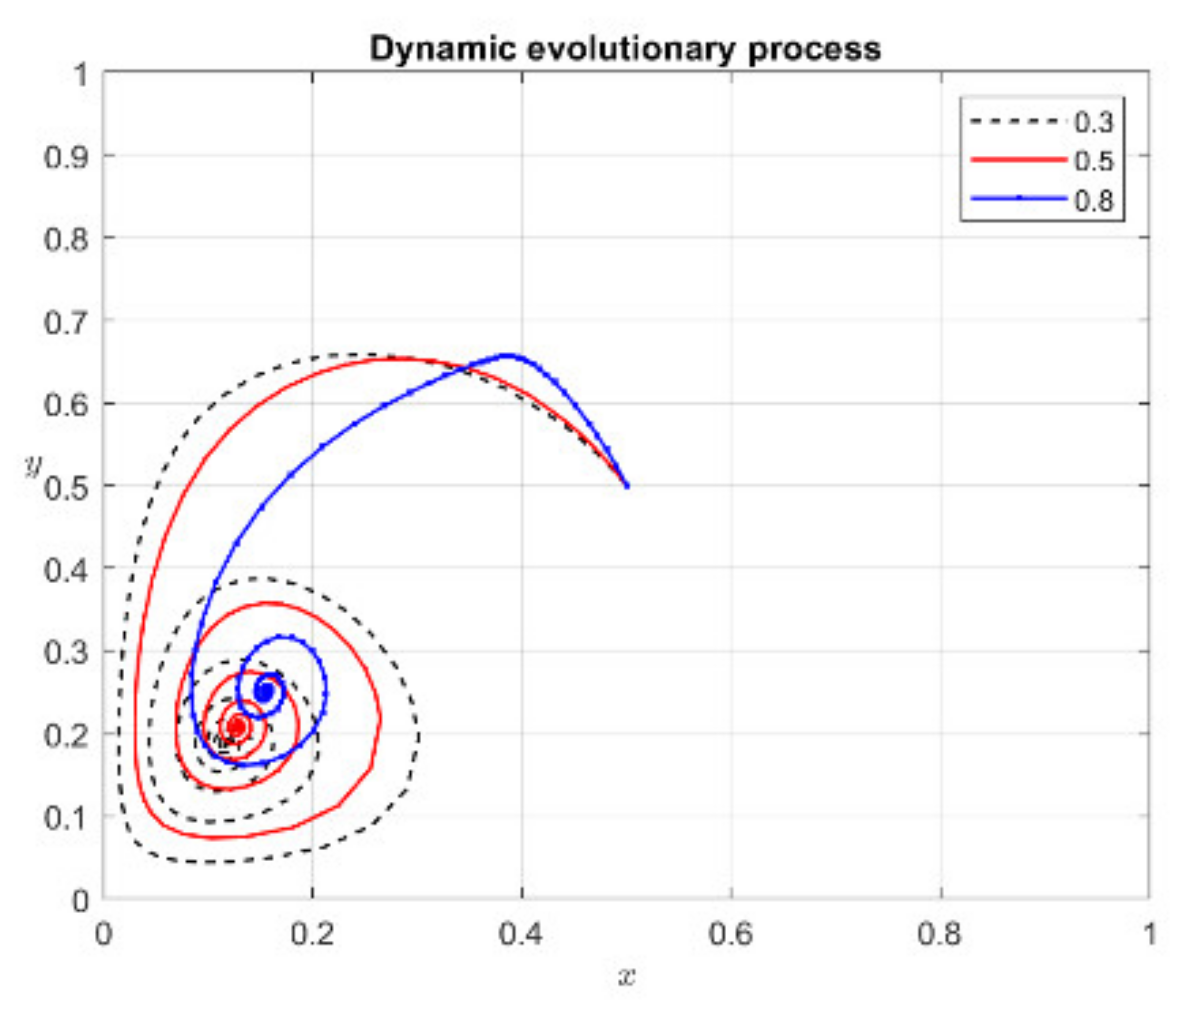
4.1. The Dynamic Evolution Process of the Two Sides of the Game

References [47,48] assigned the correlation coefficients in Table 6, where the initial values of the numerical simulation were x = 0.5 , y = 0.5 , and the GB grade was 3 for the simulation analysis. The dynamic evolution process of the players’ strategies in the game changed over time, as shown in Figure 4 and Figure 5. The simulation results in Figure 4a verified that without considering the gradual cancellation of government funding subsidies in Section 3.4.3, the evolutionary trajectory of the system (I) was a closed-loop curve around the center point, the curve did not pass through the center point, and there was no asymptotic ESS between the government and developers. In Figure 4b, we can see that both sides of the game were changing their strategic choices over time, which indicated that the strategies of the government and developers were always in an unstable state. The simulation results of the modified evolutionary game system are shown in Figure 5. Figure 5a shows that the trajectory of the system (II) converged in a spiral, and in Figure 5b, we can see that considering the gradual cancellation of government funding subsidies, fluctuating amplitudes of developers and governments with subsidies triggered a gradual fall and then tended to stabilize.
In a static subsidy game system, when the government adopts a financial subsidy policy, the developer community will correspondingly increase the likelihood of constructing GBs. A finite rational game player with incomplete symmetry of information will adjust its strategy according to the strategies of other players in the game system. The government under financial pressure will tend to eliminate the financial subsidy strategy. At this time, the GB market has not yet developed on a large scale. With the elimination of government subsidies, developers’ motivation decreases, and the cycle repeats. In contrast, in a dynamic game system, by examining, for example, the application rate of green technologies, the utilization rate of GB materials, and the implementation of industry standards, the government reduces the financial subsidies accordingly. The GB market will be stable and sustainable, and developers will actively choose GBs. Therefore, funding subsidy phase-outs will benefit GB development.

4.2. Sensitivity Analysis of Related Parameters

4.2.1. Government Supervision

When the government implements the encouragement policy, the supervision of developers λ is changed, where the value of λ was changed to 0.3, 0.5, and 0.8. The initial state was set to x = 0.5 , y = 0.5 , and the other parameters in Table 6 remain unchanged. The strategy evolution of the government and developers is shown in Figure 6. It can be seen from Figure 6 that the impact of the change in regulatory intensity was mainly reflected in the evolution rate, and the increase in regulatory intensity accelerated the system evolution process. When the intensity of government regulation was increased from 0.3 to 0.8, the rate of system stabilization was significantly accelerated. In the ideal state, x increased from 0.11 to 0.16, and y increased from 0.19 to 0.25. The probability of the ideal state increased from 0.1691 to 0.21. When the government adopts high-intensity regulation, if developers do not build GBs, it will increase their extra cost, and for the benefit, the possibility of building GBs increases. Therefore, the intensity of regulation is positively related to the ideal state. To guide the orderly development of GBs, the government should build a regulatory mechanism that takes into account the interests and demands of multiple parties.

4.2.2. Government Punishment

We studied the evolution trend of the game subject when the government punishment q was different. By changing the government’s incentive policy to penalize developers q, the values were 1.5, 2.5, and 3.5 (unit: millions), and the other parameters remained unchanged from that given in Table 6. As can be seen from Figure 7, as the punished object, developers had greater sensitivity and faster evolutionary convergence. In this analysis, when the government’s penalty was small, developers tend to choose not to build GBs due to their interests; when the penalty was increased, their group behavior gradually tended to the “GB” strategy to pursue the maximum benefit in the face of the increased penalty. The greater the penalty, the more obvious the effect, and the penalty was proportional to the appearance of the ideal state. The simulation results showed that increasing the penalty for developers can motivate developers to build GBs. Therefore, the government can promote the industrial transformation of developers by designing appropriate penalties for their excessive carbon emissions.

4.2.3. Government Funding Subsidies

By changing the government’s incentive policy for developers’ funding subsidy R, the values were 1.2, 1.6, and 2.5 (unit: millions), and the other parameters remained unchanged from that given in Table 6. The evolution of the government and the developer’s strategy is shown in Figure 8. As can be seen from Figure 8, the increase in government subsidies reduced the speed of evolution of the game players toward stability. On the one hand, the government subsidizes developers and introduces related policies, such as the use of GB materials, carbon emissions restrictions, and the development of industry standards to regulate the market order. In the short term, when government subsidies are strong, developers will be more motivated and other market players will carry out green technology innovation accordingly, and with the upgrading of the industrial system and supporting technologies, the GB market will become stable and undergo orderly development; in the long term, the government will tend to let the market regulate itself and gradually reduce the possibility of financial subsidies. On the other hand, increasing financial subsidies will increase the financial pressure on the government, which is not conducive to the stable development of the system and makes the rate of system evolution slower.

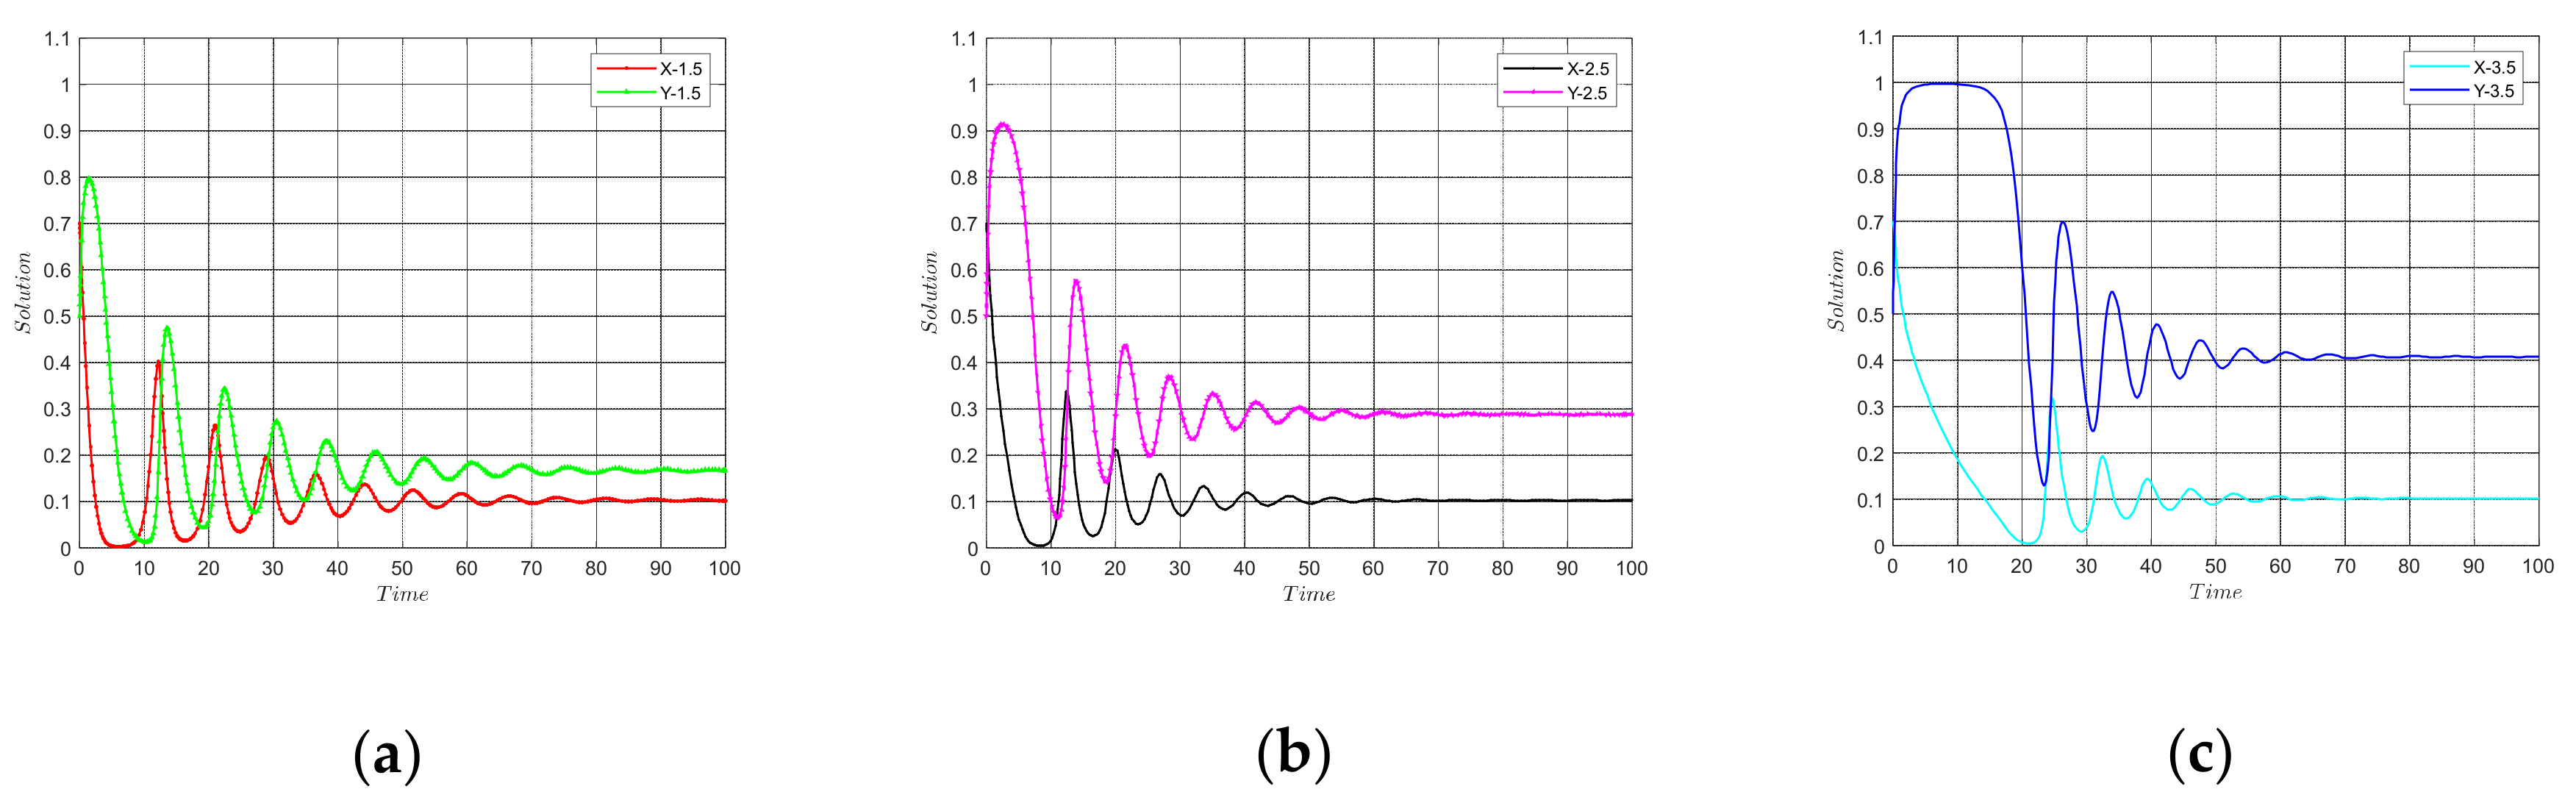
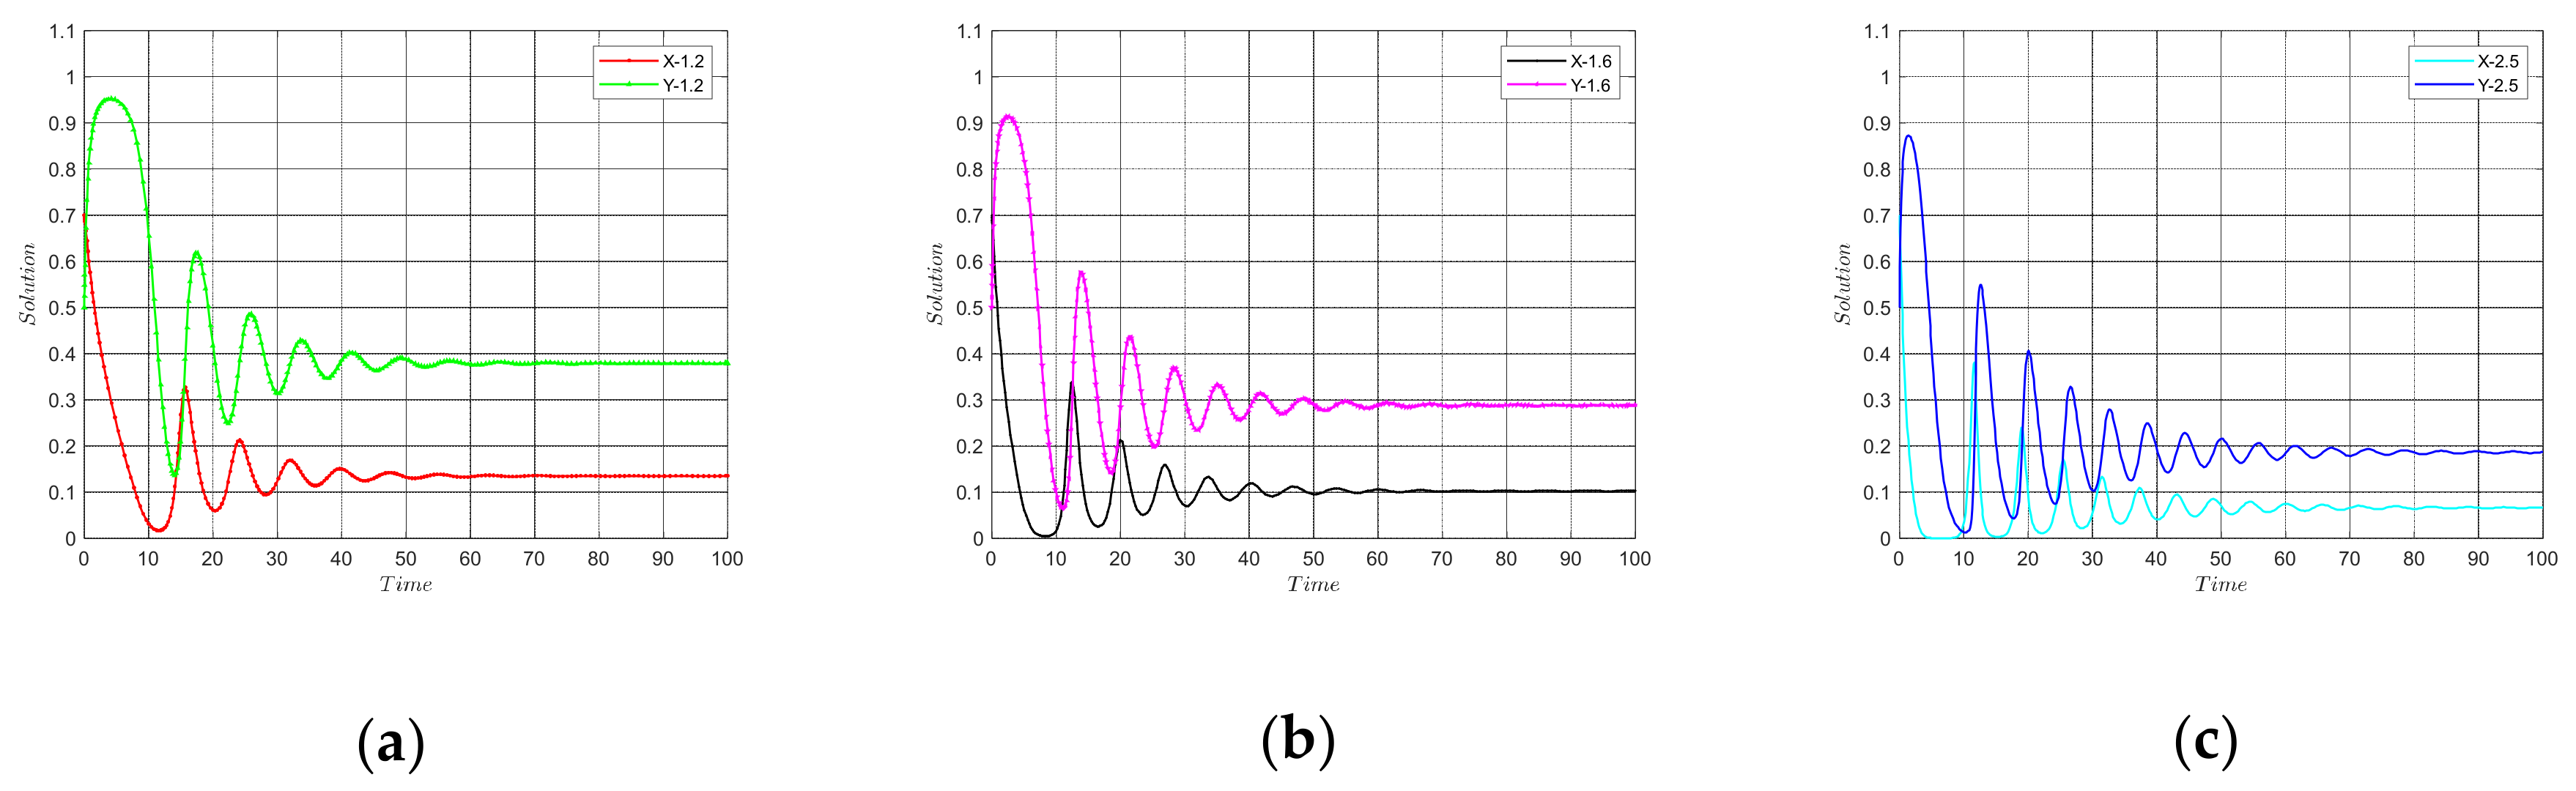
4.2.4. Phasing out Rate of Government Funding Subsidies

For the phasing out rate, α changed at 0.5 intervals in [3,7], while other parameters remained the same as those given in Table 6. For the initial state value of (0.7, 0.5), the evolution of the government and developer’s strategy is shown in Figure 9. As can be seen from Figure 9, the smaller the gradual cancellation rate, the faster and more stably the system converged to a stable state. When α was low, local governments certainly adopted funding strategies to guide the development of the GB industry (Figure 9a). From Figure 9d–f, when α was higher, the government had higher fiscal pressure, and the government’s enthusiasm for subsidizing developers with funds decreased. Specifically, the evolution speed of α = 5.5 was not much different from that of α = 5—that is, the incentive effect of financial subsidies had a diminishing marginal effect [36]. At present, without government policies and financial subsidies, along with other incentives, developers face higher development costs and will not actively choose to build GBs. When the government funding subsidy policy is withdrawn from the market too quickly, developer groups will be less likely to choose GBs if the supporting technology related to the GB industry does not receive continuous and stable development. Therefore, the government should take into account factors such as GB industry standards, the level of green technology, and carbon emissions, and set an appropriate rate of funding subsidy cancellation.

4.3. Countermeasures Based on Simulation Results

Carbon emissions in the GB operation phase were included in the analysis framework as a factor influencing government funding subsidies. This study first constructed an evolutionary game analysis model between the government and the developer. Then, it further explored the impact of the dynamic changes of government subsidies on the stability of the evolutionary system. Finally, through Matlab simulation, the sensitivity analysis of the main parameters in the government–developer evolution model was carried out to provide effective suggestions for the government to promote the large-scale development of GBs.
To realize the nationwide promotion of green buildings and to coordinate with all interested parties, this study put forward the following suggestions: (1) The government, as one of the key subjects of the construction market, should play an active role and establish a reasonable financial subsidy system. When formulating subsidy policies, the government should consider developers’ assessment of the utilization rate of green technologies or national standard materials and promote the development of national standard supporting technologies. Given the current situation, developers face high incremental costs for constructing green buildings. To overcome this, first, the government can implement financial and taxation support: set up special funds to support and at the same time provide certain taxation preferential policies for qualified demonstration projects to mobilize enterprises’ enthusiasm. Second, governments at all levels can build a carbon emission trading system in the regional-level construction market to motivate developers to actively build green buildings, which will eventually present the ideal state of zero government funding subsidies and developers actively choosing to build green buildings. (2) Developers, as important subjects in the construction market, should respond positively to government policies to invest in GBs, use GB materials, reduce carbon emissions, and promote the sustainable development of the construction industry by enhancing the reputation and recognition of enterprises in the public mind, and then improve the core competitiveness of enterprises.

5. Conclusions

Based on the evolution strategies of the participants of GBs under government supervision, this study compared and analyzed the evolution paths of government static and dynamic subsidies. For the first time, this study incorporated carbon emissions in the operation stage of GBs as a variable of the evolutionary system. The ideal state of the GB market was also proposed. This study found that (1) the probability of an ideal state was positively correlated with government supervision and punishment, and it was negatively correlated with government funding subsidies; (2) the carbon emissions, green technology, and GB materials usage rate of GBs should be considered when the government sets incentive policies; and (3) appropriate financial subsidies could effectively promote the development of GB.
Regarding carbon emissions during the operation of GBs as one of the influencing factors, this work was a new attempt to study dynamic government subsidies, and some conclusions could be drawn from this. However, there were still shortcomings: First, the calculation of carbon emissions during the operation of buildings was complicated. This article calculated the carbon emissions of GBs based on the carbon emissions factor method and the method to determine the subsidy level was relatively rough. Second, the main body that affects the development of GBs is not limited to the government and developers. Follow-up research should consider the strategic influence of other subjects.

Author Contributions

Methodology, Y.G.; software, Y.G.; writing—original draft preparation, Y.G.; writing—review and editing, Y.G., Y.Y., J.X., and R.J.; supervision, R.J.; final manuscript preparation, Y.G., Y.Y., and J.X. All authors have read and agreed to the published version of the manuscript.

Funding

This research received no external funding.

Institutional Review Board Statement

Not applicable.

Data Availability Statement

Data supporting the reported results can be found at the International Energy Agency (https://www.iea.org/data-and-statistics, accessed on 28 April 2020), Ministry of Housing and Urban-Rural Development of the People’s Republic of China (https://www.mohurd.gov.cn/ accessed on 28 April 2020), and Chinese Green Building Evaluation Label (http://www.cngb.org.cn/, accessed on 24 December 2021).

Conflicts of Interest

The authors have no conflict of interest to declare.

References

  1. Abdelhady, A.A. Phenotypic differentiation of the Red Sea gastropods in response to the environmental deterioration: Geometric morphometric approach. J. Afr. Earth Sci. 2016, 115, 191–202. [Google Scholar] [CrossRef]
  2. International Energy Agency. Data and Statistics. 2020. Available online: https://www.iea.org/data-and-statistics (accessed on 28 April 2020).
  3. International Energy Agency. Fuels and Technologies. 2020. Available online: https://www.iea.org/fuels-and-technologies (accessed on 28 April 2020).
  4. Fu, Y.; Dong, N.; Ge, Q.; Xiong, F.; Gong, C. Driving-paths of green buildings industry (GBI) from stakeholders’ green behavior based on the network analysis. J. Clean. Prod. 2020, 273, 122883. [Google Scholar] [CrossRef]
  5. Wu, X.; Peng, B.; Lin, B. A dynamic life cycle carbon emission assessment on green and non-green buildings in China. Energy Build. 2017, 149, 272–281. [Google Scholar] [CrossRef]
  6. Ministry of Housing and Urban-Rural Development of the People’s Republic of China. 2022. Available online: https://www.mohurd.gov.cn/gongkai/fdzdgknr/tzgg/201905/20190530_240717.html (accessed on 28 April 2020).
  7. Chen, L.; Chan, A.P.; Owusu, E.K.; Darko, A.; Gao, X. Critical success factors for green building promotion: A systematic review and meta-analysis. Build. Environ. 2021, 207, 108452. [Google Scholar] [CrossRef]
  8. Darko, A.; Zhang, C.; Chan, A.P. Drivers for green building: A review of empirical studies. Habitat Int. 2017, 60, 34–49. [Google Scholar] [CrossRef]
  9. Chinese Green Building Evaluation Label. Available online: http://www.cngb.org.cn/ (accessed on 24 December 2021).
  10. Ministry of Housing and Urban-Rural Development of the People’s Republic of China. Available online: https://www.mohurd.gov.cn/ (accessed on 24 February 2022).
  11. Ministry of Housing and Urban-Rural Development of the People’s Republic of China. Available online: https://www.mohurd.gov.cn/xinwen/gzdt/202101/20210119_248857.html (accessed on 28 April 2020).
  12. Cohen, C.; Pearlmutter, D.; Schwartz, M. A game theory-based assessment of the implementation of green building in Israel. Build. Environ. 2017, 125, 122–128. [Google Scholar] [CrossRef]
  13. Lu, W.; Du, L.; Tam, V.W.; Yang, Z.; Lin, C.; Peng, C. Evolutionary game strategy of stakeholders under the sustainable and innovative business model: A case study of green building. J. Clean. Prod. 2021, 333, 130136. [Google Scholar] [CrossRef]
  14. Yang, Z.; Chen, H.; Mi, L.; Li, P.; Qi, K. Green building technologies adoption process in China: How environmental policies are reshaping the decision-making among alliance-based construction enterprises? Sustain. Cities Soc. 2021, 73, 103122. [Google Scholar] [CrossRef]
  15. Gao, Y.; Yang, G.; Xie, Q. Spatial-Temporal Evolution and Driving Factors of Green Building Development in China. Sustainability 2020, 12, 2773. [Google Scholar] [CrossRef] [Green Version]
  16. Meng, Q.; Liu, Y.; Li, Z.; Wu, C. Dynamic reward and penalty strategies of green building construction incentive: An evolutionary game theory-based analysis. Environ. Sci. Pollut. Res. 2021, 28, 44902–44915. [Google Scholar] [CrossRef]
  17. Bansal, G.; Zahedi, F.M. Trust violation and repair: The information privacy perspective. Decis. Support Syst. 2015, 71, 62–77. [Google Scholar] [CrossRef]
  18. Feng, Q.; Chen, H.; Shi, X.; Wei, J. Stakeholder games in the evolution and development of green building s in China: Government-led perspective. J. Clean. Prod. 2020, 275, 122895. [Google Scholar] [CrossRef]
  19. Rana, A.; Sadiq, R.; Alam, M.S.; Karunathilake, H.; Hewage, K. Evaluation of financial incentives for green buildings in Canadian landscape. Renew. Sustain. Energy Rev. 2020, 135, 110199. [Google Scholar] [CrossRef]
  20. Al, A.E. The analysis of barriers in green building development in Libya. Int. J. Adv. Appl. Sci. 2020, 7, 15–20. [Google Scholar] [CrossRef]
  21. Song, Y.; Li, C.; Zhou, L.; Huang, X.; Chen, Y.; Zhang, H. Factors affecting green building development at the municipal level: A cross-sectional study in China. Energy Build. 2020, 231, 110560. [Google Scholar] [CrossRef]
  22. Li, Y.; Song, H.; Sang, P.; Chen, P.-H.; Liu, X. Review of Critical Success Factors (CSFs) for green building projects. Build. Environ. 2019, 158, 182–191. [Google Scholar] [CrossRef]
  23. Mustaffa, N.K.; Isa, C.M.M.; Ibrahim, C.K.I.C. Top-down bottom-up strategic green building development framework: Case studies in Malaysia. Build. Environ. 2021, 203, 108052. [Google Scholar] [CrossRef]
  24. Masia, T.; Kajimo-Shakantu, K.; Opawole, A. A case study on the implementation of green building construction in Gauteng province, South Africa. Manag. Environ. Qual. Int. J. 2020, 31, 602–623. [Google Scholar] [CrossRef]
  25. Fan, K.; Hui, E.C. Evolutionary game theory analysis for understanding the decision-making mechanisms of governments and developers on green building incentives. Build. Environ. 2020, 179, 106972. [Google Scholar] [CrossRef]
  26. Chen, L.Y.; Gao, X.; Hua, C.X.; Gong, S.T.; Yue, A.B. Evolutionary process of promoting green building technologies adoption in China: A perspective of government. J. Clean. Prod. 2021, 279, 123607. [Google Scholar] [CrossRef]
  27. Shen, Y.; Faure, M. Green building in China. Int. Environ. Agreem. Polit. Law Econ. 2020, 21, 183–199. [Google Scholar] [CrossRef]
  28. Yang, X.; Zhang, J.; Shen, G.Q.; Yan, Y. Incentives for green retrofits: An evolutionary game analysis on Public-Private-Partnership reconstruction of buildings. J. Clean. Prod. 2019, 232, 1076–1092. [Google Scholar] [CrossRef]
  29. Ma, Y.; Kong, L.; Yang, X.; Lin, C. Innovation Cooperation Network Evolution About Green Building Technology With Government Intervention: Based on Evolutionary Game Theory. IEEE Access 2021, 9, 142289–142301. [Google Scholar] [CrossRef]
  30. Onuoha, I.J.; Aliagha, G.U.; Rahman, M.S.A. Modelling the effects of green building incentives and green building skills on supply factors affecting green commercial property investment. Renew. Sustain. Energy Rev. 2018, 90, 814–823. [Google Scholar] [CrossRef]
  31. Xing, Z.; Cao, X. Promoting Strategy of Chinese GB Industry: An Evolutionary Analysis Based on the Social Network Theory. IEEE Access 2019, 7, 67213–67221. [Google Scholar] [CrossRef]
  32. Saka, N.; Olanipekun, A.O.; Omotayo, T. Reward and compensation incentives for enhancing green building construction. Environ. Sustain. Indic. 2021, 11, 100138. [Google Scholar] [CrossRef]
  33. Huang, N.; Bai, L.; Wang, H.; Du, Q.; Shao, L.; Li, J. Social Network Analysis of Factors Influencing Green Building Development in China. Int. J. Environ. Res. Public Health 2018, 15, 2684. [Google Scholar] [CrossRef] [Green Version]
  34. He, L.; Chen, L. The incentive effects of different government subsidy policies on green buildings. Renew. Sustain. Energy Rev. 2020, 135, 110123. [Google Scholar] [CrossRef]
  35. Adel, T.K.; Pirooznezhad, L.; Ravanshadnia, M.; Tajaddini, A. Global policies on green building construction from 1990 to 2019. J. Green Build. 2021, 16, 227–245. [Google Scholar] [CrossRef]
  36. Ji, S.-F.; Zhao, D.; Luo, R.-J. Evolutionary game analysis on local governments and manufacturers’ behavioral strategies: Impact of phasing out subsidies for new energy vehicles. Energy 2019, 189, 116064. [Google Scholar] [CrossRef]
  37. Fang, Y.; Wei, W.; Liu, F.; Mei, S.; Chen, L.; Li, J. Improving solar power usage with electric vehicles: Analyzing a public-private partnership cooperation scheme based on evolutionary game theory. J. Clean. Prod. 2019, 233, 1284–1297. [Google Scholar] [CrossRef]
  38. Su, Y. Multi-agent evolutionary game in the recycling utilization of construction waste. Sci. Total Environ. 2020, 738, 139826. [Google Scholar] [CrossRef]
  39. Sun, Y.; Liu, B.; Fan, J.; Qiao, Q. The multi-player evolutionary game analysis for the protective development of ecotourism. Environ. Sci. Policy 2021, 126, 111–121. [Google Scholar] [CrossRef]
  40. Wang, J.; Zhou, Z.; Botterud, A. An evolutionary game approach to analyzing bidding strategies in electricity markets with elastic demand. Energy 2011, 36, 3459–3467. [Google Scholar] [CrossRef]
  41. Wang, J.; Qin, Y.; Zhou, J. Incentive policies for prefabrication implementation of real estate enterprises: An evolutionary game theory-based analysis. Energy Policy 2021, 156, 112434. [Google Scholar] [CrossRef]
  42. Fan, Y.; Zhang, Z. Estimating Method of Carbon Emission in Construction Engineering. Constr. Technol. 2013, 42, 14–15+70. Available online: https://kns.cnki.net/kcms/detail/detail.aspx?FileName=SGJS201322007&DbName=CJFQ2013 (accessed on 24 February 2022).
  43. Kong, F.; Wang, X.; Tian, X. Comparative Study on Carbon Emission in Construction Phase between Prefabrication and Traditional Residence Based on Carbon Emission Factor Method. Ecol. Econ. 2017, 33, 81–84. Available online: https://kns.cnki.net/kcms/detail/detail.aspx?FileName=STJJ201708016&DbName=CJFQ2017 (accessed on 24 February 2022).
  44. Friedman, D. Evolutionary Games in Economics. Econometrica 1991, 59, 637–666. [Google Scholar] [CrossRef] [Green Version]
  45. Wang, Z.-Q.; Zhang, Q.-M.; You, W.-B. An Evolutionary Game and Simulation Study on Government Incentive Strategy of Prefabricated Buildings—From the Perspective of Government Subsidy. Syst. Eng. 2019, 37, 151–158. Available online: https://kns.cnki.net/kcms/detail/detail.aspx?FileName=GCXT201903016&DbName=CJFQ2019 (accessed on 24 February 2022).
  46. Morin, P.; Samson, C. Control of nonlinear chained systems: From the Routh-Hurwitz stability criterion to time-varying exponential stabilizers. IEEE Trans. Autom. Control 1997, 45, 141–146. [Google Scholar] [CrossRef] [Green Version]
  47. Liang, X.; Yang, F. Study on the Supply Side Evolutionary Game of Green Building under the Mechanism of Government Dynamic Reward and Punishment. Chin. J. Manag. Sci. 2021, 29, 184–194. [Google Scholar] [CrossRef]
  48. Wang, B.; Liao, F.; Zhang, J. Evolutionary Game and Simulation of Key Subjects in GB Development. J. Techn. Econ. Manag. 2021, 7, 109–114. Available online: https://kns.cnki.net/kcms/detail/detail.aspx?FileName=JXJG202107023&DbName=CJFQ2021 (accessed on 24 February 2022).
Figure 1. National distribution of GBs.
Sustainability 14 07294 g001
Figure 2. Number of GB labels by city in Jiangsu Province.
Sustainability 14 07294 g002
Figure 3. National GB cumulative area by 2020.
Sustainability 14 07294 g003
Figure 4. System (I): the dynamic evolution process of the main game player’s strategic choice, (a) is the dynamic evolution trajectory, and (b) is the time-varying strategy of both sides in the evolutionary game (in system I).
Sustainability 14 07294 g004
Figure 5. System (II): the dynamic evolution process of the main game player’s strategic choice, (a) is the dynamic evolution trajectory, and (b) is the time-varying strategy of both sides in the evolutionary game (in system II).
Sustainability 14 07294 g005
Figure 6. The evolution process of the main players of the game when the government supervision is different.
Sustainability 14 07294 g006
Figure 7. The evolution process of the game subject when the government’s punishment is different, (ac) is when the punishment is 1.5, 2.5, 3.5, the game strategy changes over time.
Sustainability 14 07294 g007
Figure 8. The evolution processes of the game subjects when the funding subsidy is different, (ac) is when the funding subsidy is 1.2, 1.5, 2.5, the game strategy changes over time.
Sustainability 14 07294 g008
Figure 9. The evolution processes of the game subjects when the government phasing out rate is different, (af) show the dynamic evolution path of both sides of the game when the phasing out rate changes from 3 to 5.5.
Sustainability 14 07294 g009
Table 1. Salient literature review.
SourceFSStRContextRemarks
[19] Financial incentivesThe financial incentives available for residential and commercial buildings in Canada were surveyed, followed by a comprehensive review of studies related to the assessment of the effectiveness of the financial incentives.
[7] Literature review on the critical success factorsThe roles of stakeholders and government are vital. Found that it is necessary to provide sufficient incentives and mandatory requirements at the statutory level.
[20] Research factors affecting GB development in LibyaThe aim was to address this lack of knowledge and awareness related to the impact of green building in Libya and to seek to identify the reasons for the lack of sustainable building and green building methods in Libya, thereby removing barriers to sustainable building in Libya.
[21] Research factors affecting GB developmentMandatory regulations have a stronger effect than incentive policies.
[22] Systematic review of critical success factors (CSFs) for GBThe contractors and owners were found to be more related to these identified CSFs.
[23] Evaluated green practices from several stakeholders’ perspectives.Found that the long-term economic benefits and government policies will be effective motivators toward encouraging behavioral change and organizational commitment to green practices, while perceived high costs are the greatest barrier to the implementation of green practices.
[16] Stakeholder games (government supervision department and contractors)As the intensity of subsidies and penalties increase, contractors tend toward green construction.
The probability of active supervision by the government is inversely proportional to subsidy and positively proportional to penalty.
[24] A case study on green building constructionIdentify the key green building principles considered by real estate developers, determine the benefits of implementing these principles, and identify barriers to their application.
[25] Stakeholder games (government and developer)The price premium of GB and the level and affordability of incentives were found to be the critical factors for the decision making of the leading players.
[26] GB technology (GBT)Government subsidies are essential for promoting GBT.
[27] The reason for the success of GB in China and the role of law in promoting GBFound that no single instrument in itself is optimal for promoting GB and government mandates.
[28] Stakeholder games (government groups and investment groups)The combination of positive and negative policy incentive measures will be the better way to promote green retrofits for PPP-BR.
[29] Evolutionary game models are constructed based on the GBT innovation cooperation networkFound that government intervention is reasonable and legitimate for GBT innovation cooperation.
[30] Modeled the effects of monetary green tax incentives and GB skills on supply factors affecting green commercial property investmentGovernment policies, green certification, developers’ expected rate of return motivations, and market strategy benefit motivations were significant.
[31] Stakeholder games (focal and marginal enterprises)Found that the government grant and financial support are deemed critical for promoting the development of GB products (GBP).
[32] A narrative review of academic and practitioner publications was obtained in a quasi-systematic manner to reveal the forms of rewardFound that scaling the forms of reward and compensation can be done on the bases of the phases of GB construction.
[33] Identified 28 GB influencing factors from two perspectives: the life cycle and stakeholdersFound that government supervision, incremental cost, property management experience, and the awareness of environmental protection in GBs are the critical influencing factors in promoting GB development.
[34] Examined the incentive effects of government subsidy policies to promote the development of GBsSimultaneously subsidizing both developers and consumers resulted in the greatest benefits.
The incentive effect of subsidies on consumers was superior to that of subsidies on developers.
[35] Global policies for green building construction from 1990 to 2019A scientometric analysis of several published articles on policies, incentives, and barriers to green building construction from 1990 to 2019 is reviewed.
Abbreviations: F: factors; S: static policy; St: stakeholders; R: review.
Table 2. Variable parameter symbols and meanings.
ParametersDescription
c 1 The construction cost required for developers to construct traditional buildings
c 2 Construction costs for developers to build GBs
r 1 Developers’ gains from constructing traditional buildings
r 2 Dev benefits from constructing GBs
r 3 Social benefits obtained by developers from constructing GBs
λThe supervision of developers when the government adopts incentive policies
M The government adopts policies to encourage developers to penalize when they violate the regulations in constructing GBs
σ GB grade factor
c 3 The cost of the government’s subsidy policy (including publicity funds and labor costs)
c 4 The environmental cost to the government caused by developers constructing traditional buildings
r 4 Developers taking the social benefits of constructing GBs
R The government adopting incentive policies to subsidize developers to build GBs
q The government adopts policies to encourage developers to penalize when they construct traditional buildings
α Phasing out rate of government funding subsidies
e Carbon emissions
Table 3. Payoff matrix for both players.
NumberDecision PortfolioPayoff Matrix
GovernmentDevelopers
1 { E , G C } r 4 σ R c 3 + λ M r 2 + r 3 c 2 + σ R λ M
2 { E , N G C } q c 3 c 4 r 1 c 1 q
3 { N E , G C } r 4 r 2 + r 3 c 2
4 { N E , N G C } c 4 r 1 c 1
Table 4. ESS analysis of both players.
Point d e t ( J ) Simple t r ( J ) SimpleResult
0 , 0 A 1 B 1 A 1 + B 1 UncertainSaddle point
0 , 1 A 1 + C 1 B 1 A 1 B 1 + C 1 UncertainSaddle point
1 , 0 A 1 B 1 C 1 A 1 + B 1 C 1 UncertainSaddle point
1 , 1 A 1 + C 1 ( B 1 C 1 ) A 1 B 1 UncertainSaddle point
x * , y * μ 1 μ 2 + 00Central point
where A 1 = q c 3 , B 1 = r 2 + r 3 r 1 + c 1 c 2 , C 1 = λ M q σ R μ 1 , 2 = ± x * ( 1 x * ) y * ( 1 y * ) ( q + σ R λ M ) .
Table 5. ESS analysis of both players.
Point d e t ( J ) Simple t r ( J ) SimpleResult
0 , 0 A 2 B 2 A 2 + B 2 UncertainSaddle point
0 , 1 A 2 + C 2 B 2 A 2 + C 2 B 2 UncertainSaddle point
1 , 0 A 2 B 2 C 2 A 2 + B 2 C 2 UncertainSaddle point
1 , 1 A 2 + C 2 B 2 C 2 A 2 B 2 UncertainSaddle point
x * , y * N + L + N L ESS
where A 2 = q c 3 , B 2 = r 2 + r 3 r 1 + c 1 c 2 , C 2 = λ M q σ R ( y ) and N = x * ( 1 x * ) [ c 2 σ R ( y * ) y * ] + y * ( 1 y * ) c 2 , L = y * ( 1 y * ) σ R ( y * ) x * .
Table 6. Initial assignment of model parameters.
ParameterValue
c11.6
c 2 2
c 3 0.14
c 4 2
λ0.3
σ 1
r 1 3
r 2 2.4
r 3 0.16
q 1.5
M 2.6
Note: λ is a coefficient in the range of 0~1, and the units of other parameters are in millions.
Publisher’s Note: MDPI stays neutral with regard to jurisdictional claims in published maps and institutional affiliations.

