Abstract
Science and technology innovation is an important driving force to promote the development of fishery industry, and is very important to improve the quality of fishery development. In this study, the Super-SBM model was used to evaluate the fishery science and technology innovation efficiency of 30 provinces and cities in China (excluding Hong Kong, Macao, Taiwan and Tibet) from 2011 to 2020. Combined with the kernel density estimation, the spatial and temporal differentiation characteristics were analyzed. Then, from the two dimensions of investment scale and innovation efficiency, the sustainable development types of fishery science and technology innovation were classified. The results show the following: (1) From the perspective of efficiency change, the overall efficiency of fishery science and technology innovation in China increased first and then decreased during 2011–2020, but the overall efficiency level was low, and the efficiency difference between regions gradually widened, and the eastern coastal regions became the development core of fishery science and technology innovation. (2) From the perspective of spatial differentiation characteristics, there was a large gap between the coastal and inland areas in China. The high-efficiency areas were mainly concentrated in the coastal provinces and cities, such as Guangdong, Jiangsu, Shandong, Shanghai and Tianjin, showing a decreasing trend from east to west. (3) From the perspective of investment scale and innovation efficiency, the study regions can be divided into four types: leading area, breakthrough area, catch-up area and backward area. This paper mainly calculates the efficiency of fishery science and technology innovation in various regions, and divides the type areas of fishery science and technology innovation and development. According to the advantages and problems of different types of areas, different development strategies and correction measures are proposed, which can effectively improve the efficiency of resource utilization, avoid resource waste and realize the sustainable development of fishery.
1. Introduction
China has the largest-scale fishery in the world. Since the founding of the People’s Republic of China, especially since the reform and opening-up, China’s fishery industry has developed rapidly and embarked on a road of development with distinctive Chinese characteristics, focusing on aquaculture, which has become a highlight of agricultural and rural economic development. Since 1989, China’s output of aquatic products has ranked first in the world for more than 30 consecutive years. In 2020, the total output of aquatic products in China reached 65.4902 million tons, of which the aquaculture output was 52.242 million tons, accounting for about 80% of the total output of aquatic products and more than 60% of the world’s aquaculture output [1]. The GDP of fishery increased from 318.96 million dollars in 1978 to 195.976 billion dollars in 2020, an increase of more than 600 times, accounting for 17% of the GDP of primary industry [2,3]. China has become a veritable fishing country.
The progress of fishery science and technology is an important driving force for the development of fishery. The great achievements of China’s fishery are inseparable from the strong support of fishery science and technology. In the past few years, China attaches great importance to the development of fishery science and technology. In January 2017, the Ministry of Agriculture issued “The 13th Five-year Plan for the Development of Fishery Science and Technology”, proposing that to build a modern fishery power, China must implement the strategy driven by science and technology innovation and follow the development concept of innovation, coordination, green, open and sharing, so as to achieve the development goals of improving quality and efficiency, reducing quantity and increasing income, green development and enriching fishermen, and the fishery development entered the deep water zone of transforming mode and adjusting structure [4]. In December 2021, the Ministry of Agriculture and Rural Affairs issued “The 14th Five-year Plan for National Fishery Development”, in which science and technology innovation was taken as the strategic support for fishery development, and proposed to make breakthroughs in key technology, innovate core equipment, strengthen technical services, and lead high-quality fishery development with innovation [5]. In the last 10 years, the supporting and leading role of fishery science and technology in modern fishery development has been significantly enhanced, and a series of technology innovation and breakthroughs have been made in the cultivation of new aquaculture varieties, aquaculture technology, fishery equipment engineering and other fields. In 2020, the fishery science and technology innovation contributed 63% to the economic development of fishery [6], playing an important role in ensuring national food security, increasing fishermen’s income and promoting green development of fishery.
On the other hand, the sustainable development of fishery has gradually attracted the attention of the world. In September 2015, the United Nations Summit on Sustainable Development adopted the 2030 Agenda for Sustainable Development, in which point 14 proposed the sustainable development of life below water [7], including fisheries. Improving the efficiency of fishery science and technology and dividing the types of sustainable development of fishery science and technology are very important to achieve the goal of sustainable development of fishery. Innovation efficiency of fishery science and technology is an important index to measure the relationship between input and output of fishery science and technology activities [8]. The improvement of fishery science and technology innovation efficiency is the key factor to promote the healthy development of fishery industry and improve fishery development quality.
In this study, the super-SBM model was used to measure the fishery science and technology innovation efficiency of 30 provinces and cities in China (excluding Hong Kong, Macao, Taiwan and Tibet) from 2011 to 2020, and the spatial–temporal differentiation characteristics were analyzed. Then, the fishery science and technology innovation development type areas were divided from two dimensions of input scale and innovation efficiency, and the development pattern of fishery science and technology innovation efficiency in China was revealed. It provides useful reference for improving the quality of fishery science and technology innovation development. In addition, according to the advantages and problems of different types of areas, this paper puts forward different development strategies and correction measures, which can effectively improve the efficiency of resource utilization, avoid resource waste and achieve sustainable development of fisheries.
2. Literature Review
Academic research on the development of fishery science and technology has never stopped. Scholars agree that the progress of fishery science and technology is very important to the development of fishery production. Japanese scholar Fujii et al. [9] stated that the progress of fishery science and technology was an important guarantee for the sustainable development of food and the stable supply of aquatic products, Liao’s research showed that the substantial increase in aquaculture production was mainly attributed to the significant progress of fishery science and technology [10]; Chang and Lee [11] believed that technological innovation was the catalyst to improve aquaculture productivity and sustainable development of capture fishery, and constructed an input-output evaluation system of fishery technological innovation to study the impact of technological innovation on fishery production; Bradley et al. [12] postulated that the level of fishery management could be effectively improved through technological innovation and improvement of fishery data system. The research on the development of fishery science and technology mainly involved the measurement of total factor productivity, the calculation of economic contribution rate and the calculation of technological innovation efficiency. Wang et al. [13] explored the impact of fishery science and technology development on improving fishery total factor productivity by using econometric model, and proposed to adjust the direction and focus of fishery science and technology transformation; Yu et al. [14] used the Cobb Douglas production function and the solo residual method to calculated the contribution rate of fishery scientific and technological progress to fishery economy; Kim et al. [15] constructed the Malmquist productivity index to estimate the changes of productivity growth and technological progress of offshore fisheries in South Korea in total factor productivity; Apreku et al. [16] combined Nerlovian and directional distance function methods to decompose the profit efficiency of fishery into technical efficiency and distribution efficiency, and explored the contribution of profit efficiency to fishery production; Zheng et al. [17] measured the total factor productivity of fishery economy in Chinese mainland and Taiwan coastal areas, and pointed out that the improvement in technological innovation efficiency and technological progress would promote the total factor productivity of fisheries.
Scientific and technological innovation efficiency is an important embodiment of scientific and technological innovation ability, and can comprehensively reflect the effective allocation, rational utilization and management level of regional scientific and technological innovation resources [18]. Scientific and technological innovation is a complex process with the characteristics of multi-input and multi-output. The transformation from innovation input to output runs through the whole process of innovation, so its efficiency is difficult to accurately measure. So far, there is no unified measurement method in the academic circle. The existing methods mainly include the production function method [19,20], comprehensive evaluation method [21], index method [22] and non-parametric method. Among them, the production function method has limitations in assuming complete market competition and evaluating single period data; Comprehensive evaluation method and index method have strong subjectivity in the selection of evaluation indicators and the distribution of weight. Non-parametric method (DEA) has prominent advantages in efficiency measurement and has been used more and more widely in empirical studies [23,24,25,26,27]. For example, Su and Zhang [28] used the super-efficiency DEA model to measure the efficiency of China’s green economy; Zhu et al. [29] applied DEA model to measure the scientific and technological innovation efficiency of Chinese industrial enterprises, and combined with spatial analysis method to investigate its spatial differentiation characteristics and change law; Kalapouti et al. [30] utilized the combination of DEA and structural equation modeling to estimate the efficiency of technological innovation in the EU; based on the data of patents and annual reports, Piao and Lin [31] used the DEA model and System GMM model to explore the efficiency and influencing factors of enterprise technological innovation.
At present, the research results on fishery science and technology were very rich, but most of them took fishery science and technology as a variable to study the total factor productivity and technical efficiency of fishery production, while there were few studies on measuring the efficiency of fishery science and technology innovation and analyzing the quality of fishery science and technology innovation from the perspective of efficiency. In addition, the research on the efficiency of scientific and technological innovation was very common, but there was no research on the efficiency of fishery scientific and technological innovation with fishery as the research object. Fishery science and technology innovation efficiency refers to the ratio of output value created by input factors to input value in the process of exploitation and utilization of fishery science and technology innovation resources under certain production technology conditions, it can clearly reflect the effective allocation and utilization level of innovative resources and reflect the quality of fishery science and technology innovation development [32].
In this paper, by referring to the research method and index construction method of marine scientific and technological innovation efficiency [33], input indicators were selected from three aspects of capital, labor and resource input, and output indicators were selected from three aspects of papers, patents and scientific research achievements to construct an evaluation index system of fishery scientific and technological innovation efficiency. The Super-SBM model was used to calculate the fishery science and technology innovation efficiency of 30 provinces and cities in China from 2011 to 2020, and the spatial–temporal differentiation characteristics and dynamic evolution process of fishery science and technology innovation efficiency in China were analyzed combined with kernel density estimation. On this basis, the input scale and efficiency of fishery science and technology innovation were taken as the entry point. In order to provide useful reference for improving the quality of fishery science and technology innovation development, this paper divided the types of innovative development modes and revealed the development pattern of fishery science and technology innovation efficiency in China.
3. Materials and Methods
3.1. Regions for This Study
China is located in eastern Asia and the west coast of the Pacific Ocean. The territory is vast, with a total land area of about 9.6 million square kilometers, ranking third in the world after Russia and Canada, and it has a long coastline of 18,000 km and a jurisdictional sea area of 3 million square kilometers [34]. It is the second largest economy in the world and continues to be the largest contributor to world economic growth. In 2020, the total economic volume will exceed 14.6 trillion US dollars [35]. The research area of this paper includes 30 provinces (autonomous regions and municipalities) in China. Due to the large amount of missing data in Tibet, Taiwan, Hong Kong and Macau, they were not included in the research scope. The following are collectively referred to as 30 provinces. The study area is shown in Figure 1.
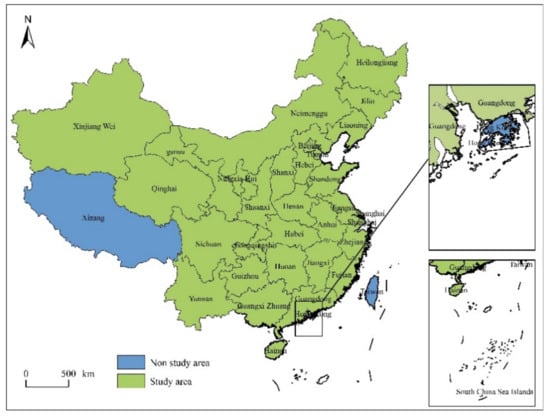
Figure 1.
Geographical location map of provinces and cities in China. The map was carefully drawn by the author using ArcGIS.
3.2. Research Methods
3.2.1. Super-SBM Model
The Super-SBM model not only solves the problem of slack variables that the traditional DEA model does not solve, but also makes a further comparison of effective decision-making units, so that all decision making units can be completely sorted, and inter-period comparison can be carried out to analyze the variation of efficiency [36,37]. It is more accurate than the traditional DEA model [38]. Therefore, the non-radial and non-angular average oriented Super-SBM model is selected in this paper to measure the fishery scientific and technological innovation efficiency of 30 provinces in China. The model is set as follows:
In the Equation: ρ represents the efficiency value of fishery science and technology innovation, xij represents the i-th input data of the j-th indicator, yrj represents the r-th output data of the j-th indicator, m is the number of input indicators, and q is the number of output indicators, s− and s+ represent the slack of input and output; θ represents scale benefit, n represents the total number of indicator systems; k represents the evaluated decision-making unit excluded from the j-th indicator.
3.2.2. Kernel Density Estimation
Kernel density estimation is used to estimate the unknown density functions in probability theory, and is one of the nonparametric testing methods [39,40,41]. For the data w1, w2,…, wu, the density is expressed as:
In the Equation, the kernel function K is a weighting function, the Gaussian function is used in this paper; u is the number of samples; h is the bandwidth; w-wi is the distance between w and wi.
Use Eviews 8.0 to evaluate the evolution process of fishery innovation efficiency, its function expression is as follows:
3.2.3. The Entropy Method
The entropy method is a method of objectively weighting various indicators by calculating the degree of dispersion between data [42,43]. The smaller the entropy value, the bigger the difference between the sample data, the more important the indicator in the evaluation system, the larger the corresponding weight. The calculation steps are as follows:
In the Equation, Yij represents the dimensionless processing of the indicator data, Pij represents the contribution of the j-th indicator in the i-th region, Ej represents the entropy value of the indicator, and ωi represents the weight of the indicator.
3.3. Index and Data Sources
This paper takes 30 provinces in China as the research object, and measures the innovation efficiency of fishery science and technology from 2011 to 2020. Since innovation investment takes a certain amount of time to accumulate to be transformed into innovation results, the lag effect has a greater impact on the accuracy of evaluating innovation efficiency. In view of this, this paper refers to the existing research experience and combines the data conditions of fishery science and technology innovation, and sets the lag period of innovation input as 1a, the input index selects the data from 2011 to 2020, and the output index selects the data from 2012 to 2021. In terms of index selection, the index system of fishery science and technology innovation efficiency is constructed from the aspects of input and output. Input indicators mainly reflect the input status of fishery science and technology activities from three aspects: capital input, labor input and material resource input; output indicators mainly reflect different types of fishery science and technology innovation achievements from three aspects: scientific research papers, patents, and project results. The index system is as shown in Table 1.

Table 1.
Quantitative evaluation index system of fishery science and technology innovation efficiency.
The paper data were retrieved through web of Science by literature analysis, enter the retrieval formula “CU = China and PY = (2011–2021) and PS = Provinces and cities in China and TS = (Fisheries or fishing or fishery or fishery industry or Aquatic products or Aquaculture)”, statistics on the number of articles related to fishery published by various provinces and cities in China from 2012 to 2021. Patent data were analyzed using incoPat global Patent Database website (www.incopat.com). The key words were limited to “fishery” and “aquatic products”, and the categories of applicants were limited to institutions and research institutions, the patent output of fishery scientific and technological innovation in each province was counted year by year. Fishery science and technology project data from China project of science and technology innovation achievements appraisal Suggestions database (https://kns.cnki.net/kns8?dbcode=SNAD, accessed on 12 April 2022), in the category of “topic” search settings “fishing”, were used to collect all the “fishing” related projects in 2012–2021, and according to the unit location by province statistics, gain fishery science and technology project achievement data. The data of the input index were all from “China Fishery Statistics Yearbook (2012–2021)”.
4. Analysis on the Development of Fishery Science and Technology Innovation Efficiency
4.1. Analysis on the Overall Development of Fishery Science and Technology Innovation Efficiency
According to Formulas (1)–(4), the DEA-solver software was used to calculate the fishery science and technology innovation efficiency of China’s 30 provinces from 2011 to 2020, as shown in Figure 2.
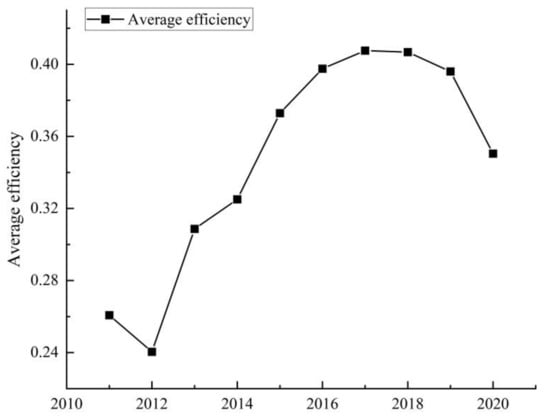
Figure 2.
The overall change of China’s fishery science and technology innovation efficiency. Data source: calculated by the author according to the data in China fishery statistical yearbook 2012–2021.
From 2011 to 2020, the overall level of China’s fishery science and technology innovation efficiency was low, showing a development trend of first rising and then falling. The efficiency value fluctuated between 0.24 and 0.41, from 0.26 in 2011 to 0.35 in 2020, and the efficiency value increased by 35%. The maximum efficiency value appeared in 2017 and was 0.4076. The minimum efficiency value appeared in 2012 and was 0.24. From 2012 to 2017, the efficiency of fishery science and technology innovation continued to improve, which was due to the rapid improvement of the agglomeration capacity and technical level of fishery science and technology innovation, and the coordinated and balanced development of fishery science and technology innovation activities during this period. After 2017, due to the decline in the level of science and technology, innovation efficiency showed a downward trend. Overall, the level of fishery science and technology innovation is relatively low, indicating that fishery science and technology innovation has insufficient resource allocation capabilities and utilization levels in terms of human, capital and material resources, which hinders the development of fishery science and technology innovation.
4.2. Temporal Evolution Analysis of Fishery Science and Technology Innovation Efficiency
In order to analyze the temporal evolution of fishery science and technology innovation, according to the measurement results of fishery science and technology innovation efficiency from 2011 to 2020, the first and last years of 2011 and 2020 and the two middle years of 2014 and 2017, four representative nodes were selected, and Eviews 8.0 was applied, the corresponding Kernel density curve was drawn as Figure 3, combined with the distribution position, situation and ductility of the Kernel density curve [44], in order to give a comprehensive description of the dynamic evolution of the development level of fishery science and technology innovation efficiency from 2011 to 2020. The ordinate is the nuclear density, reflecting the regional agglomeration, and the abscissa is the efficiency of fishery science and technology innovation.
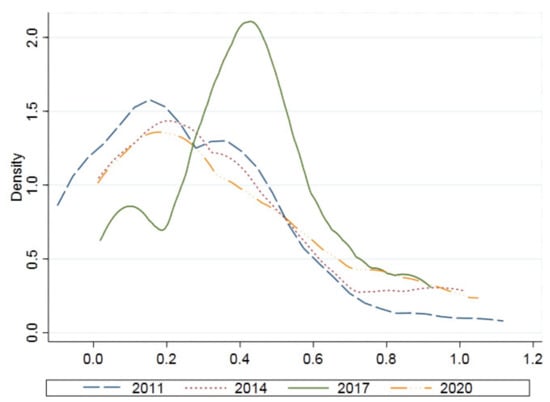
Figure 3.
The Kernel density distribution of China’s fishery science and technology innovation efficiency. Data source: calculated by the author according to the data in China fishery statistical yearbook 2012–2021.
- (1)
- From the point of view of distribution position, during the sample observation period, the Kernel density curve of fishery science and technology innovation efficiency showed a characteristic of right shift-left shift. Compared with 2011, 2014 shifted to the right slightly, compared with 2014, 2017 shifted to the right, and 2020 shifted to the left significantly compared to 2017. This means that before 2017, the efficiency of fishery science and technology innovation in various regions continued to move towards a higher level. After 2017, the efficiency of fishery science and technology innovation began to decline, showing a trend of continuous convergence to the low-efficiency range. Before 2017, with the adjustment of fishery policy and the upgrading of fishery industry structure, fishery industry had coordinated development with technology innovation, which was improved continuously. After 2017, due to the intensified conflict between the development of the fishery industry and the environment, the rising cost of human and material resources, and the COVID-19 pandemic, the efficiency of fishery science and technology innovation has shown a downward trend.
- (2)
- In terms of distribution, the peak value of the Kernel density curve has experienced the evolution process of down-up-down, and the width is characterized by shrinking-expanding, indicating that the absolute gap in the efficiency of fishery science and technology between provinces in China is increasing, and the concentration trend is weakened. After 2017, the peak value of the curve dropped significantly, and the width became more and more flat, indicating that the absolute gap between regions showed signs of further expansion.
- (3)
- From the perspective of polarization trend and distribution ductility, the Kernel density curve of fishery science and technology innovation efficiency showed a double-peak shape in 2011 and 2020. The side peak in 2017 was prominent, indicating that the polarization was more serious during this period, while it disappeared in 2020, indicating that the polarization phenomenon was gradually alleviated. The overall Kernel density curve has a certain degree of right tailing, indicating that there are some provinces and cities with high science and technology innovation efficiency in the study area. Although the curves in 2014 and 2020 showed a single peak shape, the interval span gradually increased, indicating that the dispersion degree of fishery science and technology innovation efficiency continuously increased.
4.3. Spatial–Temporal Analysis of Fishery Science and Technology Innovation Efficiency
According to the changes in fishery science and technology efficiency in 30 provinces in China from 2011 to 2020, the natural discontinuity classification method (Jenks) [45,46] was used to divide the efficiency values into high efficiency (>0.6), medium efficiency (0.3~0.6) and low efficiency (<0.3). The distribution map of fishery science and technology innovation efficiency was drawn to examine the spatial differentiation characteristics of fishery science and technology innovation efficiency in the study area. In order to directly reflect the temporal and spatial evolution characteristics of fishery science and technology innovation efficiency, ArcGIS was used to draw the distribution map of fishery science and technology innovation efficiency in 30 provinces in China. Due to space limitations, the start and end years and two intermediate years within the research period were selected as representatives, and the distribution maps of innovation efficiency in 2011, 2014, 2017 and 2020 were shown as Figure 4. to explore the spatial–temporal evolution of fishery science and technology innovation efficiency in China.
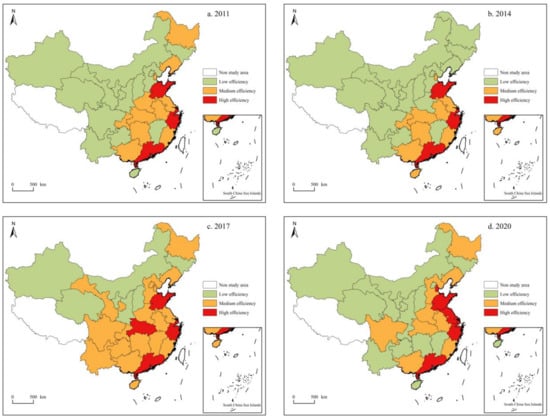
Figure 4.
Temporal and spatial distribution of China’s fishery science and technology innovation efficiency from 2011 to 2020. The map was carefully drawn by the author using ArcGIS.
By comparing the values of fishery science and technology efficiency between regions, it can be found that the high-efficiency areas from 2011 to 2020 are mainly located in the eastern coastal area and develop rapidly. In 2011, Shanghai, Zhejiang, Guangdong, Shandong and other economically developed provinces benefited from advanced technology level and economic advantages, which made the value of fishery science and technology innovation in that year higher than that of other provinces and cities. The efficiency values of central provinces such as Jiangsu, Fujian, Anhui, Hubei, Hunan and Henan were between 0.3 and 0.6, while Ningxia, Inner Mongolia, Qinghai, Xinjiang, Shaanxi, Yunnan and other economically underdeveloped areas were affected by the natural conditions of fishery development, the level of economic development and the low efficiency of science and technology innovation agglomeration, their values were all less than 0.3, which was in the low-efficiency area, so the efficiency gap between the eastern and western provinces was very significant. In 2014, the overall fishery science and technology innovation efficiency level was lower than that in 2011. There were fewer provinces and cities in the high and medium efficiency range, and most areas were in the low efficiency range. The high efficiency areas were still Shanghai, Zhejiang, Guangdong and Shandong, and other economically developed provinces, while Henan, Liaoning and Heilongjiang dropped from medium efficiency to low efficiency due to the decline in the level of science and technology. Hainan Province was affected by the support of national policies and the improvement of its own economic strength, so its fishery science and technology efficiency increased rapidly, rising up to the medium efficiency range. In 2017, the national overall fishery science and technology innovation efficiency level increased significantly, and the upward trend was consistent with Figure 1. The high-efficiency areas increased from 4 in 2014 to 5, with the fishery industry in Hubei Province developing rapidly, and its level of science and technology also improving rapidly, which increased from 0.44 in 2011 to 0.63 in 2017, with an increase of 43%. The medium-efficiency areas increased from 9 in 2014 to 18, Heilongjiang, Liaoning, Beijing, Hebei, Henan, Gansu, Sichuan, Yunnan, Guizhou and Jiangxi moved from low-efficiency areas to medium-efficiency areas, and only 7 provinces were still in low-efficiency areas, which included Ningxia, Inner Mongolia, Qinghai, Xinjiang, Shaanxi, Shanxi and Jilin. In the meantime, the government paid great attention to the driving role of fishery science and technology progress on fishery economic development, formulated the “13th Five-Year Plan for Fishery Science and Technology Development”, encouraged regions to implement the strategy of driving science and technology innovation, vigorously develop fishery science and technology innovation, transform extensive fishery development methods, and promote fishery sustainable and healthy development. In 2020, the overall fishery science and technology innovation efficiency began to decline, but the efficiency difference between regions gradually increased. The number of high-efficiency areas increased to six, mainly in the eastern coastal areas, and the number of low-efficiency areas increased from seven in 2017 to 14 in 2020, mainly located in the western and southern regions, while the nine medium-efficiency regions were mainly in the central and northeast regions. The reason is that the eastern coastal provinces have continuously made breakthroughs in the field of marine fishery by virtue of their own advantages, marine fishery science and technology innovation has become an important factor leading the improvement of the innovation efficiency [47], so the eastern coastal area has become the core of the fishery science and technology innovation across the country. Overall, China’s fishery science and technology innovation efficiency shows obvious spatial differentiation characteristics, and the inter-provincial differences are large. The overall spatial pattern is that the eastern region has better fishery science and technology efficiency than the central region, the central region better than the northeast region, the northeast region better than the western region, showing a decreasing trend from east to west as well as from coastal to inland.
5. Classification of Fishery Science and Technology Innovation Sustainable Development Types
Investment scale and innovation efficiency are the decisive factors for the quality of innovation [48]. The former reflects the regional support for the development of fishery science and technology and the abundance of local fishery science and technology innovation resources. The latter reflects the effective allocation and utilization of innovation resources in the region. Generally speaking, the higher investment scale and efficiency level, the better the development quality of innovation. Therefore, combining the investment scale and efficiency of fishery science and technology innovation, dividing the types of China’s fishery science and technology innovation development can more scientifically reveal the development laws of China’s fishery science and technology innovation, and provide reference for the national fishery science and technology development strategy and regional fishery science and technology innovation development.
5.1. Differentiation Characteristics and Classification of Fishery Science and Technology Innovation Investment Scale
5.1.1. Differentiation Characteristics
The investment scale reflects the regional support for fishery science and technology innovation and the abundance of local fishery science and technology innovation resources [49]. Comparing the investment scale of 30 provinces and cities in China in 2011 and 2020, which includes funding, labor and material resources, it can be found that the investment in fishery science and technology innovation has changed significantly, and the funding in fishery science and technology has increased greatly. In 2020, the investment in fishery science and technology reached 546 million dollars, an increase of 67.34% over 2011. The funding in fishery science and technology in Jiangsu Province has increased the most, reaching 34.79 million dollars. In terms of scientific research labor, the number of fishery science and technology practitioners in 2020 was 29,900, a decrease of 23.13% from 36,800 in 2011. Hunan and Hubei provinces have experienced the worst decline, reaching 75.89%, while Guizhou and Guangxi are on the rise. During the study period, the level of investment in scientific research material resources also increased to a certain extent. In 2020, the number of aquatic technology promotion institutions reached 11,283, an increase of 17.56% compared with 2011. Guizhou Province increased the largest amount of investment in fishery science and technology material resources. The investment in fishery science and technology innovation varies greatly among provinces, and there is a trend of further expansion. It is mainly concentrated in Jiangsu, Shandong, Sichuan and Guangdong. During the study period, the scientific research funding investment in Jiangsu, Shandong, Sichuan and Guangdong accounted for 30.29% of the total investment, the labor investment accounted for 29.56%, and the material resources investment accounted for 32.57%. In contrast, Shanxi, Xinjiang, Ningxia, Hainan and Qinghai, where the investment in fishery science and technology innovation is relatively weak, accounted for 3.5%, 2.6% and 1.5% of the total investment in the three aspects of funding, labor and material resources respectively. Compared with 2011, the difference in the inter-provincial investment scale expanded in 2020, and there is a trend of further expansion.
5.1.2. Classification of Sustainable Development Types
In order to further analyze the characteristic similarity of the investment scale of fishery science and technology innovation in various provinces in China, according to Equations (7)–(10), the entropy method [50,51] was used to calculate the investment scale indicators of fishery production and innovation from the three aspects of funding, labor and resources by weighted sum calculation, to obtain the comprehensive score of each region in the investment scale, as shown in Table 2. Because the detailed calculation process takes up a lot of space, it is omitted here.
Table 2.
Scores and rankings of investment scale in fishery science and technology innovation by region.
Using the systematic clustering analysis function of SPSS 28.0, this paper took 30 provinces in China as cases, and the investment scale of fishery science and technology innovation of each province as one of the cases, carried out a systematic clustering analysis. The clustering method adopts the Wald method, the Chebyshev distance is selected as the measurement interval [52,53], and the Z-value score is standardized to obtain the dendrogram shown in Figure 5. According to the results, the investment scale of fishery science and technology in 30 provinces is divided into three levels: high, medium and low. The high-level investment scale includes 4 provinces of Jiangsu, Shandong, Sichuan and Guangdong, the medium-level includes 12 provinces of Guangxi, Hunan, Jiangxi, Hubei, Jilin, Zhejiang, Fujian, Anhui, Shaanxi, Yunnan, Guizhou and Chongqing, and the low-level includes 14 provinces of Henan, Liaoning, Heilongjiang, Inner Mongolia, Shanghai, Hebei, Gansu, Tianjin, Beijing, Shanxi, Xinjiang, Ningxia, Hainan and Qinghai.
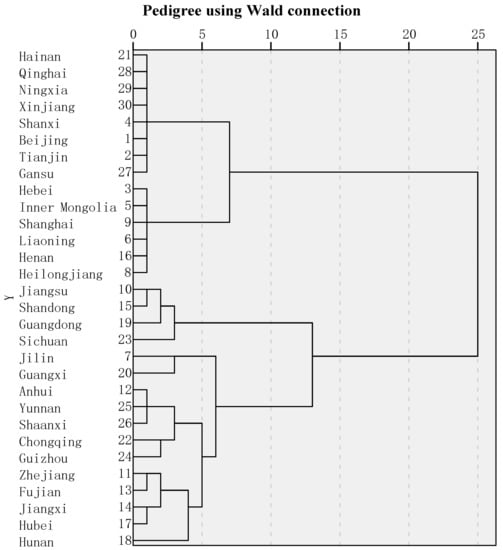
Figure 5.
Cluster dendrogram of fishery science and technology innovation investment scale in 30 provinces of China. Data source: calculated by the author according to the data in China fishery statistical yearbook 2012–2021.
5.2. Classification of Fishery Science and Technology Innovation Sustainable Types
The investment scale reflects the resource endowment and importance of the development of fishery science and technology innovation in the region, and the innovation efficiency shows the effective allocation and utilization level of fishery science and technology innovation resources. In this study, from the two dimensions of fishery science and technology innovation investment scale and innovation efficiency, it divided the types of fishery science and technology innovation development in 30 provinces, and further explored the development laws of fishery science and technology innovation in China. According to the calculation results of fishery science and technology innovation efficiency, the quantile classification method was used to classify the average efficiency values of each province from 2011 to 2020, and three types of fishery science and technology innovation efficiency types of high, medium and low were obtained. The high-efficiency areas include Shanghai, Shandong, Zhejiang, Guangdong, Hubei, Jiangsu, Tianjin, Fujian, Anhui and Guangxi; the medium-efficiency areas include Heilongjiang, Liaoning, Hunan, Chongqing, Hainan, Sichuan, Beijing, Jiangxi, Henan and Gansu; the low-efficiency areas include Hebei, Yunnan, Jilin, Guizhou, Shanxi, Shaanxi, Xinjiang, Qinghai, Inner Mongolia and Ningxia.
According to the investment scale and efficiency level, the study areas are divided into eight types of fishery science and technology innovation input-efficiency types, as shown in Figure 6. It can be seen that there are three provinces of Shandong, Guangdong and Jiangsu in the high-input-high-efficiency type, five provinces of Guangxi, Hubei, Zhejiang, Fujian and Anhui in the medium-input-high-efficiency type, two cities of Shanghai and Tianjin in the low-input-high-efficiency type, only Sichuan province in the high-input-medium-efficiency type, three provinces of Hunan, Jiangxi and Chongqing in the medium-input-medium-efficiency type, six provinces of Henan, Liaoning, Heilongjiang, Gansu, Beijing and Hainan in the low-input-medium-efficiency type, four provinces of Jilin, Shaanxi, Yunnan and Guizhou in the medium-input-low-efficiency type, and six provinces of Inner Mongolia, Hebei, Shanxi, Xinjiang, Qinghai and Ningxia in the low-input-low-efficiency type.
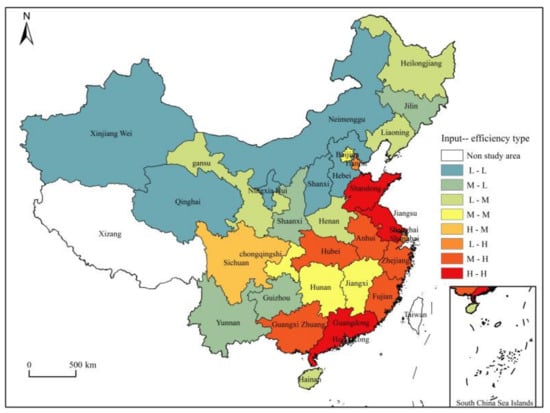
Figure 6.
Types of fishery science and innovation investment and efficiency in China. The map was carefully drawn by the author using ArcGIS.
There is a close relationship between the innovation efficiency of China’s fishery science and technology and the investment scale. Generally speaking, the innovation efficiency of high-input areas is significantly higher than that of low-input areas. According to the investment scale in fishery science and technology innovation and the level of innovation efficiency, an innovation evaluation matrix is established, as shown in Table 3. Comprehensively considering the regional development conditions and development momentum, China’s fishery science and technology innovation model can be divided into four types of fishery science and technology innovation leading area, fishery science and technology innovation breakthrough area, fishery science and technology innovation catch-up area, and fishery science and technology innovation backward area. The above classification can provide support for formulating and optimizing regional strategies for fishery science and technology innovation.
Table 3.
China’s fishery science and technology innovation evaluation matrix.
- (1)
- The fishery science and technology innovation leading area is composed of two types of high-input-high-efficiency, low-input-high-efficiency areas, including Shandong, Guangdong, Jiangsu, Shanghai and Tianjin. The efficiency level of fishery science and technology innovation in this type of area is higher than that of other provinces, and it is the core area of fishery science and technology development in China. Due to the small area of Shanghai and Tianjin, the investment in fishery production is relatively small, but their economy is relatively developed, and there are many scientific research institutions and scientific research labor with rich innovation achievements, so they have formed their low-input-high-efficiency efficiency type. Shandong, Guangdong and Jiangsu vigorously develop both freshwater and marine fisheries due to their superior geographical conditions, and rely on the vast area of the Beijing-Tianjin-Hebei, Pearl River Delta and Yangtze River Delta, with Bohai Sea, South China Sea and Yellow Sea as the sea basis, and they also have complete fishery industry system, as well as a large number of innovative capital and high-tech talents in the field of fishery, so their innovation level leads the whole country in the fishery industry, and it is the core area of China’s fishery science and technology innovation development.
- (2)
- The fishery science and technology innovation breakthrough area is composed of medium-input-high-efficiency, high-input-medium-efficiency types, including Guangxi, Hubei, Zhejiang, Fujian, Anhui and Sichuan provinces. Most of them are located along the Yangtze River and the southeastern coastal areas. The science and technology innovation capability of this area is second only to the leading area. It has rich natural resources for fishery and superior geographical location. It also has certain advantages in fishery science and technology foundation and fishery industry, which provide great potential for innovation development. However, the innovation level of breakthrough area is still low, resulting in the low level of innovation resource allocation and utilization ability, which has hindered the development of regional fishery science and technology innovation. Therefore, the future development of these provinces should be based on the current science and technology innovation foundation, vigorously develop the fishery innovation and technology capabilities, improve the innovation level and make breakthroughs in the transformation of science and technology achievements in key innovation fields. Moreover, the fishery science and technology innovation breakthrough area is mainly distributed in the Yangtze River Economic Belt and the southeastern coastal areas. It has the function of connecting the east and the west as well as connecting the north and the south in China. Therefore, it can be built into an important development axis for the transfer of fishery science and technology innovation in the south coastal developed areas to the inland, and realize linked development among regions.
- (3)
- The fishery science and technology innovation catch-up area is composed of medium-input-medium-efficiency and low-input-medium-efficiency types, including Hunan, Jiangxi, Chongqing, Henan, Liaoning, Heilongjiang, Gansu, Beijing and Hainan. This area has a relatively solid scientific and technological foundation and has a strong potential for the improvement of fishery science and technology innovation. However, due to the relatively small investment in science and technology innovation resources, the backward innovation environment, the unreasonable industry structure, and the difficulty of enterprise transformation, the overall performance of these regions is low innovation efficiency. In the future, they should increase investment in fishery science and technology innovation resources, increase the construction of fishery science and technology achievement transformation bases, support and promote the formation of innovation chains in key industries, strengthen industry-university-research cooperation to achieve complementary advantages, improve supporting policies for industry-university-research integration, pay attention to cultivating the environment for innovation of fishery science and technology enterprises, to stimulate the innovation vitality of enterprises, improve innovation efficiency and the development of innovation culture.
- (4)
- The fishery science and technology innovation backward area is composed of low-input-low-efficiency and medium-input-low-efficiency types, including Jilin, Shaanxi, Yunnan, Guizhou, Inner Mongolia, Hebei, Shanxi, Xinjiang, Qinghai and Ningxia. This area is mainly distributed in the inland areas of northern China and the Yunnan-Guizhou region, which are located north of the 800 mm precipitation line. Limited by natural conditions, these regions belong to traditional fishery area with backward economic development. The fishery industry structure is seriously unbalanced. In addition, the regional economic conditions are weaker than other study areas. Therefore, the basic conditions for the development of fishery science and technology innovation are weak, and the development of fishery science and technology innovation is simultaneously constrained by the low degree of innovation scale and the weak technical management ability, and its scale constraints are more obvious. In the future, the development of fishery science and technology innovation in this region should be based on its own resource conditions, develop the fishery economy according to the actual conditions, improve the fishery industry structure, accelerate the development of innovative technology and use innovation achievement to improve the local fishery industry and regional economic development.
6. Conclusions and Implications
6.1. Conclusions
Based on the Super-SBM model, this paper calculated the efficiency of fishery science and technology innovation in China from 2011 to 2020, and combined the kernel density estimation to analyze the spatial–temporal differentiation characteristics of China’s fishery science and technology innovation efficiency. The main conclusions are as follows:
First, from the perspective of efficiency changes, from 2011 to 2020, China’s fishery science and technology innovation efficiency showed a fluctuating development trend of first falling, then rising and then falling. Before 2017, the efficiency value rose rapidly, and after 2017, the efficiency value showed a downward trend, and the overall innovation efficiency was at low level. In terms of temporal changes, the overall efficiency level of China’s fishery science and technology innovation did not show significant changes from 2011 to 2020. However, from the changes in the shape and kurtosis of the Kernel density curve, it can be seen that the efficiency differences between regions first decreased and then expanded, and a new agglomeration distribution has emerged. In terms of spatial evolution, from 2011 to 2020, the fishery science and technology innovation was mainly based on the eastern coastal provinces such as Jiangsu, Shandong, Zhejiang, Guangdong and Shanghai, whose core position of fishery science and technology innovation development was more prominent.
Second, from the perspective of the investment scale in fishery science and technology innovation efficiency, eight types of innovation input-efficiency zones can be identified in 30 provinces in China. Based on the above classification, as well as considering the regional conditions, four types of fishery science and technology innovation areas are summarized, including fishery science and technology innovation leading area, fishery science and technology innovation breakthrough area, fishery science and technology innovation catch-up area, and fishery science and technology innovation backward area. The leading area includes Shandong, Guangdong, Jiangsu, Shanghai and Tianjin, which have a good natural environment for fishery production, industrial environment and the most advanced innovative technology across the country. They are the core area for the innovation and development of fishery science and technology in China. The breakthrough area includes Guangxi, Hubei and Zhejiang, Fujian, Anhui and Sichuan, which have superior natural conditions, a good foundation for the development of traditional fishery industry, a high degree of innovation scale agglomeration and a high level of fishery science and technology innovation and resource management capabilities. These factors have driven the rapid development of innovation in the fishery industry of this area. The catch-up area includes Hunan, Jiangxi, Chongqing, Henan, Liaoning, Heilongjiang, Gansu, Beijing and Hainan, of which the traditional fishery development is relatively weak, and the low investment scale and low level of innovation capabilities hinder the development of regional fishery science and technology innovation. The innovation capacity still needs to be further improved. The backward area includes Jilin, Shaanxi, Yunnan, Guizhou, Inner Mongolia, Hebei, Shanxi, Xinjiang, Qinghai and Ningxia, of which the regional economic conditions are poorer than other study areas. Limited by natural conditions, the development of traditional fishery economy is backward, fishery innovation scale is lack, coupled with poor innovation capabilities, resulting in lagging behind other regions in fishery science and technology innovation.
Third, from the practical significance of the research, this paper measured the innovation efficiency of fishery science and technology in 30 provinces of China, analyzed its temporal and spatial evolution characteristics, and divided the innovation and development type areas of fishery industry based on the two dimensions of investment scale and innovation efficiency. The conclusion shows that the overall efficiency of fishery science and technology innovation in China is low, and the development of fishery science and technology innovation shows a serious imbalance in space, especially the huge gap between the investment and efficiency of fishery science and technology innovation among regions. Science and technology innovation efficiency is an important embodiment of science and technology innovation ability, which can comprehensively reflect the effective allocation, rational utilization and management level of regional science and technology innovation resources. According to the characteristics, advantages and difficulties of different types of areas, this study puts forward different development strategies and specific measures, which will help the government functional departments to solve the problems faced by different regions and allocate resources more scientifically, formulate public policies more in line with the development of fishery industry. In short, this study reflects the differences in the efficiency of fishery scientific and technological innovation between regions, provides a reference for the government to formulate investment planning and management measures, and contributes to the effective utilization of resources and the sustainable development of fisheries.
6.2. Implications
According to the evaluation results and analysis of the fishery science and technology innovation efficiency in 30 provinces in China, combined with the current status of fishery science and technology development, it can be seen that the efficiency of fishery science and technology innovation and the investment scale are the two factors that affect the quality of regional fishery science and technology innovation. There are four pieces of advice on achieving the coordinated development between these two factors. First, strengthen the demonstration role of the leading area. The leading area can be a demonstration area for the coordinated development of high efficiency and high investment in China. Shandong, Guangdong and Jiangsu should strengthen the connection with other provinces, develop into a national fishery innovation hub, so as to drive the development of regional fishery science and technology innovation. Other areas should benchmark the leading area, learn the successful development experience of the leading area, and improve the deficiencies in the development of the local fishery science and technology innovation. Second, improve the development structure of the breakthrough area. For provinces such as Guangxi, Hubei, Zhejiang, Fujian and Anhui, where the efficiency of science and technology innovation is higher than the level of investment scale, they should make full use of their advantageous natural conditions, increase investment based on existing science and technology advantages, improve the scale and structure of fishery science and technology innovation, consolidate regional science and technology innovation, make it more stable on the existing basis, strengthen industry-university-research cooperation, realize complementary advantages, attach importance to the cultivation of the environment for innovation of fishery science and technology enterprises, and stimulate the innovation vitality of enterprises, so as to improve innovation efficiency. Third, improve the level of fishery science and technology in the catch-up area. It is necessary to further increase investment in fishery innovation resources in this area, improve the level of regional science and technology innovation, raise the transformation rate of scientific and technological achievements, and at the same time strengthen the environmental construction of technological transformation, including hardware infrastructure and soft environment construction such as policies, regulations and related services, improve the fishery science and technology management capabilities, so as to continuously improve the efficiency of science and technology innovation, and achieve coordinated development with the investment scale. Fourth, increase investment and technical support in the backward area. To seek national policy support and improve the fishery industry structure, it is necessary for this area to develop the fishery economy based on its own resource conditions and according to the actual conditions, introduce aquatic product varieties and high-tech suitable for the development of the local fishery industry, improve the efficiency of science and technology innovation, improve the quality of regional fishery scientific research and innovation, and promote the development of regional fishery economy.
Although this paper evaluated the fishery science and technology innovation efficiency in 30 provinces in China, and divided the types of fishery innovation development zones based on the two dimensions of investment scale and innovation efficiency, there are still the following deficiencies to be further explored. First, due to the limitation of relevant data of the fishery industry, the research on fishery science and technology innovation can only measure the overall efficiency, but cannot measure the efficiency from different aspects of knowledge acquisition, technological innovation and value transformation, so the analysis and evaluation of the development of innovation efficiency is not detailed enough. Second, this paper analyzed the temporal and spatial evolution process of fishery science and technology innovation efficiency in China, and divided the types of innovation development zones, but the development mechanism of fishery science and technology innovation efficiency was not analyzed. In future research, the method of spatial measurement can be used to make in-depth analysis of the reasons for the evolution of fishery science and technology innovation efficiency.
Author Contributions
W.Z.: Conceptualization, investigation, visualization, formal analysis and writing—original draft. D.L.: methodology, data curation, software, writing—review and editing, funding acquisition. L.H.: resources, project administration, supervision and validation. All authors have read and agreed to the published version of the manuscript.
Funding
This research was funded by the National Natural Science Foundation of China (42176218) and a Major Project of the National Social Science Foundation of China (21&ZD100).
Institutional Review Board Statement
Not applicable.
Informed Consent Statement
Not applicable.
Data Availability Statement
The data presented in this study are available from the authors on request.
Conflicts of Interest
The authors declare no conflict of interest.
References
- FAO. The State of World Fisheries and Aquaculture 2020, Sustainability in Action. 2020. Available online: http://www.fao.org/fishery/publications/sofia/en (accessed on 10 February 2022).
- Peng, D.; Mu, Y.; Zhu, Y. Evaluating the level of coordinated development of fisheries economic growth and environmental quality in selected Chinese regions. Environ. Impact Assess. Rev. 2021, 89, 106605. [Google Scholar] [CrossRef]
- Zhao, W.; Shen, H. A statistical analysis of China’s fisheries in the 12th five-year period. Aquac. Fish. 2016, 1, 41–49. [Google Scholar] [CrossRef]
- Ministry of Agriculture and Rural Affairs, PRC. Fishery Science and Technology Development Plan in the 13th Five-Year Plan. 2017. Available online: http://www.moa.gov.cn/gk/ghjh_1/201701/t20170123_5462599.htm?djmohlfknglnglno (accessed on 31 February 2022). (In Chinese)
- Ministry of Agriculture and Rural Affairs, PRC. National Fishery Development Plan in the 14th Five-Year Plan. 2021. Available online: http://www.moa.gov.cn/govpublic/YYJ/202201/t20220106_6386439.htm (accessed on 31 February 2022). (In Chinese)
- Lin, X.; Zheng, L.; Li, W. Measurement of the contributions of science and technology to the marine fisheries industry in the coastal regions of China. Mar. Policy 2019, 108, 103647. [Google Scholar] [CrossRef]
- United Nations. Transforming Our World: The 2030 Agenda for Sustainable Development; United Nations: New York, NY, USA, 2014; pp. 1–41. [Google Scholar]
- MacLennan, D. Reflections on technology and science in fishery research. ICES J. Mar. Sci. 2017, 74, 2069–2075. [Google Scholar] [CrossRef][Green Version]
- Fujii, H.; Sakakura, Y.; Hagiwara, A.; Bostock, J.; Soyano, K.; Matsushita, Y. Research and development strategy for fishery technology innovation for sustainable fishery resource management in North-East Asia. Sustainability 2018, 10, 59. [Google Scholar] [CrossRef]
- Liao, I.C. Roles and contributions of fisheries science in Asia in the 21(st) century. Fish. Sci. 2002, 68, 3–13. [Google Scholar] [CrossRef][Green Version]
- Chang, J.B.; Lee, Y. The effects of technological development on fisheries production. Fish. Sci. 2018, 85, 259–269. [Google Scholar] [CrossRef]
- Bradley, D.; Merrifield, M.; Miller, K.; Lomonico, S.; Wilson, J.; Gleason, M. Opportunities to improve fisheries management through innovative technology and advanced data systems. Fish Fish. 2019, 20, 564–583. [Google Scholar] [CrossRef]
- Wang, B.; Han, L.; Zhang, H. Analysis on the structure effect of marine fishery total factor productivity under high-quality development in China. PLoS ONE 2021, 16, e0259853. [Google Scholar] [CrossRef]
- Yu, J.; Han, Q. Exploring the management policy of distant water fisheries in China: Evolution, challenges and prospects. Fish. Res. 2021, 236, 105849. [Google Scholar] [CrossRef]
- Kim, D.; Seo, J.; Kim, H.; Lee, K. Estimation of productivity growth, technical progress, and efficiency changes in the Korean offshore fisheries. Fish. Sci. 2012, 78, 743–751. [Google Scholar] [CrossRef]
- Kofi, O.; Mcwhinnie, S. Profit efficiency of the South Australian rock lobster fishery: A Nerlovian and directional distance function approach. Mar. Policy 2020, 117, 103962. [Google Scholar]
- Zheng, S.; Wang, S.; Liang, Q. Total factor productivity and decomposition of fisheries economy in coastal areas of mainland China and Taiwan: Using the DEA-Malmquist index. J. Coast. Res. 2019, 93, 371–380. [Google Scholar] [CrossRef]
- Xia, K.; Guo, J.; Han, Z.; Dong, M.; Xu, Y. Analysis of the scientific and technological innovation efficiency and regional differences of the land-sea coordination in China’s coastal areas. Ocean. Coast. Manag. 2019, 172, 157–165. [Google Scholar] [CrossRef]
- Wang, J.; Song, H.; Tian, Z.; Bei, J.; Ni, J. A method for estimating output elasticity of input factors in Cobb-Douglas production function and measuring agricultural technological progress. IEEE Access 2021, 9, 26234–26250. [Google Scholar] [CrossRef]
- Enaami, M.E.; Mohamed, Z.; Ghani, S.A. Model development for wheat production: Outliers and multicollinearity problem in Cobb-Douglas production function. Emir. J. Food Agric. 2013, 25, 81–88. [Google Scholar] [CrossRef]
- Wang, J.; Deng, X. Comprehensive economic benefit evaluation method of coastal enterprises based on AHP. J. Coast. Res. 2020, 103, 24–28. [Google Scholar] [CrossRef]
- Fang, S.; Xue, X.; Ge, Y.; Fang, H.; Li, J.; Zhang, Y. Evaluation and improvement of technological innovation efficiency of new energy vehicle enterprises in China based on DEA-Tobit model. Sustainability 2020, 12, 7509. [Google Scholar] [CrossRef]
- Huang, J.; Xia, J.; Yu, Y.; Zhang, N. Composite eco-efficiency indicators for China based on data envelopment analysis. Ecol. Indic. 2018, 85, 674–697. [Google Scholar] [CrossRef]
- Kang, L.; Song, Z. Input-output efficiency of economic growth: A multielement system perspective. Sustainability 2020, 12, 4624. [Google Scholar] [CrossRef]
- Shen, N.; Zhou, J.; Zou, W. Energy efficiency measures and convergence in China, taking into account the effects of environmental and random factors. Pol. J. Environ. Stud. 2015, 24, 257–267. [Google Scholar] [CrossRef]
- Kao, C. Efficiency decomposition and aggregation in network data envelopment analysis. Eur. J. Oper. Res. 2016, 255, 778–786. [Google Scholar] [CrossRef]
- Jiang, L.; Folmer, H.; Bu, M. Interaction between output efficiency and environmental efficiency: Evidence from the textile industry in Jiangsu Province, China. J. Clean. Prod. 2016, 113, 123–132. [Google Scholar] [CrossRef]
- Su, S.; Zhang, F. Modeling the role of environmental regulations in regional green economy efficiency of China: Empirical evidence from super efficiency DEA-Tobit model. J. Environ. Manag. 2020, 261, 110227. [Google Scholar]
- Zhu, Y.; Wang, Z.; Qiu, S.; Zhu, L. Effects of environmental regulations on technological innovation efficiency in China’s industrial enterprises: A spatial analysis. Sustainability 2019, 11, 2186. [Google Scholar] [CrossRef]
- Kalapouti, K.; Petridis, K.; Malesios, C. Measuring efficiency of innovation using combined data envelopment analysis and structural equation modeling: Empirical study in EU regions. Ann. Oper. Res. 2017, 294, 297–320. [Google Scholar] [CrossRef]
- Piao, Z.; Lin, T. Financing innovation and enterprises’ efficiency of technological innovation in the internet industry: Evidence from China. PLoS ONE 2020, 15, e0239265. [Google Scholar] [CrossRef]
- Chen, Z.; Ma, L. Research on spatial pattern and spatial effect of marine science and technology innovation efficiency in China’s coastal provinces. J. Coast. Res. 2020, 115, 42–45. [Google Scholar] [CrossRef]
- Li, G.; Zhou, Y.; Liu, F.; Tian, A. Regional difference and convergence analysis of marine science and technology innovation efficiency in China. Ocean. Coast. Manag. 2021, 205, 105581. [Google Scholar] [CrossRef]
- Chuai, X.; Lai, L.; Huang, X.; Zhao, R.; Wang, W.; Chen, Z. Temporospatial changes of carbon footprint based on energy consumption in China. J. Geogr. Sci. 2012, 22, 110–124. [Google Scholar] [CrossRef]
- Zheng, X.; Wu, S.; Li, F. Changes in the economic structure and trends in China’s future energy demands. Soc. Sci. China 2021, 42, 116–137. [Google Scholar]
- Du, J.; Liang, L.; Joe, Z. A slacks-based measure of super-efficiency in data envelopment analysis: A comment. Eur. J. Oper. Res. 2010, 204, 694–697. [Google Scholar] [CrossRef]
- Lee, H. An integrated model for SBM and Super-SBM DEA models. J. Oper. Res. Soc. 2021, 72, 1174–1182. [Google Scholar] [CrossRef]
- Meng, M.; Qu, D. Understanding the green energy efficiencies of provinces in China: A Super-SBM and GML analysis. Energy 2021, 239, 121912. [Google Scholar] [CrossRef]
- Dai, J.; Liu, Y.; Chen, J.; Liu, X. Fast feature selection for interval-valued data through kernel density estimation entropy. Int. J. Mach. Learn. Cybern. 2020, 11, 2607–2624. [Google Scholar] [CrossRef]
- Wang, S.; Hua, G.; Li, C. Urbanization, air quality, and the panel threshold effect in China based on Kernel density estimation. Emerg. Mark. Financ. Trade 2019, 55, 3575–3590. [Google Scholar] [CrossRef]
- Li, P.; Lv, Y.; Zhang, C.; Yun, W.; Yang, J.; Zhu, D. Analysis and planning of ecological networks based on Kernel density estimations for the Beijing-Tianjin-Hebei region in Northern China. Sustainability 2016, 8, 1094. [Google Scholar] [CrossRef]
- Benedetto, F.; Giunta, G.; Mastroeni, L. On the predictability of energy commodity markets by an entropy-based computational method. Energy Econ. 2016, 54, 302–312. [Google Scholar] [CrossRef]
- Na, W.; Zhao, Z. The comprehensive evaluation method of low-carbon campus based on analytic hierarchy process and weights of entropy. Environ. Dev. Sustain. 2021, 23, 9308–9319. [Google Scholar] [CrossRef]
- Dong, J.; Peng, J.; Liu, Y.; Qu, S.; Han, Y. Integrating spatial continuous wavelet transform and kernel density estimation to identify ecological corridors in megacities. Landsc. Urban Plan. 2020, 299, 103815. [Google Scholar] [CrossRef]
- Lu, Y.; He, T.; Xu, X.; Qiao, Z. Investigation the robustness of standard classification methods for defining urban heat islands. IEEE J. Sel. Top. Appl. Earth Obs. Remote Sens. 2021, 14, 11386–11394. [Google Scholar] [CrossRef]
- Cao, C.; Zhu, K.; Cai, F.; Qi, H.; Liu, J. Vulnerability evolution of coastal erosion in the Pearl River estuary Great Bay area due to the influence of human activities in the past forty years. Front. Mar. Sci. 2022, 9, 847655. [Google Scholar] [CrossRef]
- Li, Y.; Kong, J.; Ji, j. Environmental regulation, technological innovation and development of marine fisheries-evidence from ten coastal regions in China. Fishes 2022, 7, 20. [Google Scholar] [CrossRef]
- Liu, W.; Bai, Y. An analysis on the influence of R&D fiscal and tax subsidies on regional innovation efficiency: Empirical evidence from China. Sustainability 2021, 13, 12707. [Google Scholar]
- Bostock, J.; Lane, A.; Hough, C.; Yamamoto, K. An assessment of the economic contribution of EU aquaculture production and the influence of policies for its sustainable development. Aquacult. Int. 2016, 24, 699–733. [Google Scholar] [CrossRef]
- Song, L.; Liu, F. An improvement in DEA cross-efficiency aggregation based on the Shannon entropy. Int. Trans. Oper. Res. 2018, 25, 705–714. [Google Scholar] [CrossRef]
- Sengupta, J. Information theory approach in efficiency measurement. Appl. Stoch. Models Data Anal. 2010, 10, 91–102. [Google Scholar] [CrossRef]
- Boshoff, W.; Jaarsveld, R. Market definition using consumer characteristics and cluster analysis. S. Afr. J. Econ. 2019, 87, 302–325. [Google Scholar] [CrossRef]
- Kim, J.; Shah, A.; Kang, H. Dynamic risk assessment with bayesian network and clustering analysis. Reliab. Eng. Syst. Saf. 2020, 201, 106959. [Google Scholar] [CrossRef]
Publisher’s Note: MDPI stays neutral with regard to jurisdictional claims in published maps and institutional affiliations. |
© 2022 by the authors. Licensee MDPI, Basel, Switzerland. This article is an open access article distributed under the terms and conditions of the Creative Commons Attribution (CC BY) license (https://creativecommons.org/licenses/by/4.0/).