Article

Research on the Destruction Resistance of Giant Urban Rail Transit Network from the Perspective of Vulnerability

School of Management, Shanghai University, Shanghai 200444, China
*
Authors to whom correspondence should be addressed.
Sustainability 2022, 14(12), 7210; https://doi.org/10.3390/su14127210
Submission received: 17 April 2022 / Revised: 4 June 2022 / Accepted: 9 June 2022 / Published: 13 June 2022

Abstract

:
Giant urban rail transit (GURT) systems have been formed in many metropolises and play a critical role in addressing serious traffic congestion. Unfortunately, as a dynamic and complex system, the vulnerability of GURT networks under various failure scenarios will be more prominent as the network expansion continues. Thus, it is imperative to explore the complex structural characteristics of the network and improve the ability to deal with the disturbance of emergencies. In this study, the destruction resistance of GURT networks with scale growth is illustrated from a vulnerability perspective. Specifically, taking Shanghai rail transit (SHRT) system as an example, the network topology model is constructed using the Space L method, and the network structure characteristics are analyzed based on the complex network theory. In addition, five attack strategies are developed to represent random and targeted attacks during the simulation of network failure, and two metrics are determined to evaluate the network vulnerability. Some meaningful results have been obtained: (i) The Shanghai rail transit planning network (SHRTPN) has increased the network efficiency by more than 10% over the Shanghai rail transit operating network (SHRTON) and has effectively enhanced the network destruction resistance. (ii) The SHRT network is a small-world network and shows significant vulnerability under the targeted attacks. The failure of only 3% high betweenness stations in SHRTON can lead to a 66.2% decrease in the network efficiency and a 75.8% decrease in the largest connected component (LCC) ratio. (iii) Attacking stations will cause more severe network failures than attacking edges, and it is necessary to focus on preventing catastrophic network failure caused by the critical station’s failure breaking the threshold. Finally, the strategies for improving the destruction resistance of GURT networks are proposed. The findings of this research can provide an essential reference for the rational planning, safety protection, and sustainable construction of GURT systems.

1. Introduction

Urban rail transit is critical to modern public transportation services and attractive to the public because of their advantages such as fast speed, comfort experience, low carbon, and environmental protection. Many metropolises such as New York, London, Moscow, and Shanghai have continually increased investments in the construction of rail transit systems, including the urban metro and suburban railway. Giant urban rail transit (GURT) networks are already primed in these metropolises, and play a significant role in solving traffic congestion and improving commuting efficiency [1,2]. The GURT network will move from the exploration phase to the densification phase, where the network becomes denser through the addition of edges between already existing lines [3]. However, with the growth of the network scale, GURT presents networked, complex, and systematic characteristics; any accident impacting this large system would affect not only the serviceability of this critical infrastructure, but also the safety of passengers [4].
As an open and complex system, the GURT network is vulnerable to potential risk events such as terrorist attacks, signal failures, and train door failure [5,6]. Unfortunately, GURT systems have also been the targets of sabotages and terrorist attacks. For example, the recent 2022 New York City Subway attack [7], injured approximately 29 people and killed 10. Service on several lines was partially suspended following the attack. These catastrophic events not only bring huge economic losses, but also have negative impacts on society or the country. Moreover, random disruptive events occur frequently during the operation of GURT. According to incomplete statistics, there were more than 103 incidents of train delays occurring in Shanghai metro in 2019 [8], which were as short as a few minutes or as long as tens of hours, causing great inconvenience to passengers. Hence, an enhanced understanding of the topological characteristics of GURT systems is crucial for improving the destruction resistance of them against both accidental failures and targeted attacks.
Compared with the general urban rail transit network, the GURT network is larger in scale, involving more lines and stations. Furthermore, the GURT network is more complex because it has a broader degree distribution and stronger network connectivity [9]. The importance of nodes and the characteristics of a global network will change with the network scale growth [10]. Taking Shanghai rail transit (SHRT) as an example, this study focuses on GURT to explore its complex network topology characteristics, and comprehensively analyzes the impact of network scale growth on the vulnerability. Firstly, the topology models of the Shanghai rail transit operating network (SHRTON) and Shanghai rail transit planning network (SHRTPN) are constructed by using the Space L method, respectively. The topology characteristics of the two different scale networks are compared based on the complex network theory. Secondly, the network failure processes under multiple attack strategies are simulated to analyze the vulnerability of the SHRT network, and the critical stations and edges are also identified. Finally, the strategies for raising the destruction resistance of GURT networks are submitted, which provide a reference for the security protection and construction planning of the GURT networks.
The rest of this research is organized as follows. The second section provides a comprehensive review about the previous studies related to the destruction resistance of urban rail transit networks. The third section introduces network modeling methods, network performance metrics, and network failure simulation strategies. The fourth section empirically investigates the destruction resistance of the two SHRT networks with different topological characteristics under different attack strategies. Finally, discussions are made, and conclusions are presented.

2. Literature Review

Complex network theory is widely adopted to analyze the complex systems such as the power grid, social networks, and transportation networks [11,12]. Scholars have analyzed the complex topological properties of transportation networks by abstracting them into graphs composed of nodes and edges based on complex network theory. For the empirical study of topological characteristics of urban rail transit networks, Latora and Marchiori [13] took the Boston underground transportation system as an example to verify that the urban rail transit network has small-world characteristics. Zhang et al. [14] measured the topological characteristics and functional properties of the Shanghai metro system by complex network theory. Chopra et al. [15] presented a comprehensive and multi-pronged framework to analyze the topological information of the London metro system. To evaluate the network performance, scholars have defined some network characteristic metrics such as the average degree, the network diameter, and the average path length (APL) [16]. For instance, the lower the APL, the shorter the average network distance, and the lower the travel costs will be.
In recent decades, the vulnerability of the urban rail transit network has attracted considerable attention from researchers and practitioners. Berdica [17] introduced vulnerability to road traffic networks, defining vulnerability as the susceptibility of a transportation system to anomalous events. Pagani et al. [18] employed topological indicators to assess network vulnerability for the London urban rail network. Zhang et al. [14] evaluated the vulnerability of urban rail transit networks based on both network topology and functionality. Further, the network efficiency [19], the size of the maximum cluster [20], and the reciprocal of the sum of the shortest paths [21] were used to measure destructiveness extent and the connectivity of networks after attacking networks. The vulnerability of urban rail transit networks varies under deliberate and random attacks [22]. As a comparison, scholars have applied different attack scenarios to analyze the vulnerability of theoretical networks. It is found that a WS small-world network [23] is the most robust network compared to the ER random network [24] and the BA scale-free network [20] under random attacks. Most rail transit networks are found to be tolerant under random attacks because they all belong to a small-world network or a scale-free network. Liu et al. [25] compared the failure process of theoretical networks and actual networks under different attack strategies and concluded that rail transit networks have better robustness under random attacks. Crucitti et al. [26] revealed that rail transit networks have a high robustness index under random attack but a low robustness index under targeted attacks. Malicious attacks are devastating to urban rail transit networks because they mainly damage critical hubs (nodes with high degree or betweenness) [27]. Some meaningful studies have identified key nodes in complex networks based on topological measurements such as degree, betweenness centrality, and node clustering [28]. Zhang et al. [29] considered the degree and cluster coefficient to evaluate the node importance in the whole network. Meng et al. [30] added the consideration of closeness centrality and eigenvector centrality of nodes for the identification of critical stations in rail transit networks. Yang et al. [31] quantitatively analyzed the topological characteristics of the Beijing subway system and suggested a node importance assessment method for locating hub stations. For the identification of network critical edges, Gauthier et al. [32] identified and ranked the links most critical to the overall performance of the road network, taking into account the dynamic properties of road traffic. By the empirical study of the rail network, it was concluded that edge failure does not always cause node failure, and critical nodes have a greater impact on network stability than edges [33].
The rapid fragmentation of urban rail networks under targeted attacks reflects the important role of critical stations and lines, and the network vulnerability can be reduced by implementing protection at critical stations. The researchers also provided other recommendations for increasing the destruction resistance of rail transit networks. Dunn and Wilkinson [34] found that the destruction resistance of the network can be improved by changing the network structure (add nodes and edges). Jenelius and Cats [35] emphasized that new links increase robustness, making intuitive sense. Cao et al. [36] introduced three link-adding strategies to cope with cascading failures and found that the high-betweenness linking strategy is more effective than the random linking strategy to strengthen the network robustness. Ding et al. [37] concluded that increasing the connection of nodes with the maximum path length will seriously affect the efficiency and characteristics of the network. Derrible and Kennedy [38] analyzed the complexity and robustness of 33 metro systems and suggested that smaller networks should focus on creating transfer stations, thereby generating cycles to offer alternative routes.
Previous studies have revealed the complex characteristics of urban rail transit networks and have also provided methods and references for exploring the destruction resistance of urban rail transit networks. However, it should be noted that few studies have been conducted on the destruction resistance of GURT networks from the perspective of network scale growth. The scale growth of GURT will change the distribution of critical nodes and the network structure, which has a significant impact on network performance. The analysis of the destruction resistance of GURT networks under scale growth remains to be explored. Most previous studies have attacked the nodes sequentially according to the node importance within the initial network, which ignored the effect of network topology changes on the importance of the remaining nodes. To fill this gap, this study updates the network topology after each node removal in the simulation, and the critical node in the remaining network is identified for the next attack. Taking SHRT as an example, the change of GURT network topology characteristics is analyzed from the perspective of network scale growth, which fits the current background of the continuous and rapid development of urban rail transit network. Moreover, the influence of the network scale changes on network performance is discussed based on the network failure simulations, and the strategies to enhance the network destruction resistance are proposed. It is of great practical significance to ensure the safe operation and construction planning of GURT systems.

3. Methodology

3.1. GURT Network Modeling

Network modeling is the prerequisite for analyzing the topological characterization of rail transit systems. Space P, Space B, Space C, and Space L are four commonly used methods to construct the topological model of rail transit network [39,40]. Space P method constructs the network model by treating stations as nodes, and an arbitrary pair of stations is connected by an edge when at least one train stops at both stations [41]. It is widely used to explore transfer properties such as the role of the metro line on transfer times. Space B method is constructed by representing both lines and stations as nodes of different types, whereas the corresponding projection of the Space B model to the set of lines results in a complementary Space C model. Space L method constructs the network model by taking stations as nodes and rail lines as edges. Among them, the network model constructed by the Space L method can visualize the actual connectivity pattern and facilitate the analysis of rail transit network characteristics [42]. Hence, this research adopts the Space L method to construct the GURT network model.
To facilitate modeling, some assumptions are proposed as follows:
  • Assumption (1): The GURT network is regarded as an unweighted, undirected, and no self-loop network, that is, the direction and weight are not considered;
  • Assumption (2): There are no duplicate edges between nodes. If adjacent station a and station b are connected by tracks, only one edge is drawn regardless of the number of track lines;
  • Assumption (3): The GURT network is considered as a self-loop-free network, where nodes are not connected to themselves;
  • Assumption (4): Failure repair of the GURT is not considered during the network attacks.

3.2. Network Metrics Analysis

Based on graph theory, the GURT network is defined as G, which consists of n nodes and m edges. In the graph, the topological connection between node i and node j is denoted by a i j . If there is a direct edge between node i and node j, then a i j = 1 ; otherwise, a i j = 0 . A path consists of edges between the two targeted nodes, and the length of the path is equal to the number of edges along this path [19]. If there is no path between a selected pair of nodes, the distance between the two nodes is infinite.

3.2.1. Global Network Characteristic Indexes

(1)
Average path length and network diameter
In complex networks, the shortest path between nodes i and j is the one that connects these two nodes with the least number of edges. The distance between nodes i and j, d i j , is equal to the number of edges on the shortest path between node i and j [25]. The average path length l is the average distance between any two nodes in the network, calculated by Equation (1):
l = 2 n ( n 1 ) i j d i j
The network diameter D is the maximum distance between all nodes in the network, which is calculated by D = max ( d i j ) .
(2)
Network connectivity
The network connectivity γ is a commonly-used metric to describe network density, which is defined as the ratio between the number of edges and the maximum number of edges in the network [9]:
γ = e 3 ( n 2 )
where e means the number of edges in the network, n indicates the number of nodes in the network. A larger γ represents higher network connectivity and means more alternative routes between any pairs of nodes.

3.2.2. Local Characteristic Indexes

(1)
Degree and average degree
The degree k i is the number of edges directly connected to node i in the network, calculated by Equation (3). The average degree k is the mean value of the degree of all nodes, calculated by Equation (4).
k i = j = 1 n a i j
k = 1 n i = 1 n k i
Degree and average degree are important indicators of network sparsity. The degree shows the importance of a node in the network. The greater the degree of a node, the greater the number of nodes directly connected to it, indicating that the node is more important. However, nodes with small degree may have an important role, such as nodes with small degree but large betweenness [33].
(2)
Betweenness
Betweenness is the abbreviation of betweenness centrality, which includes node betweenness and edge betweenness. Node betweenness is the ratio of the number of the shortest paths passing through this node to the total number of the shortest paths; edge betweenness is the ratio of the number of shortest paths passing through that edge to the total number of shortest paths [40]. The betweenness of node i is calculated by Equation (5).
B i = i j k σ j k ( i ) σ j k
where σ j k means the number of shortest paths between nodes j and k. σ j k ( i ) denotes the number of shortest paths between nodes j and k that are passing through node i.
In complex networks, studies always assume that the network flows are only transported along the shortest path [43]. Betweenness is considered as an important parameter for reflecting the nodes’ significance, and a node with high betweenness usually plays a critical role in maintaining effective communication among various nodes in a network [31].
(3)
Clustering coefficient
Clustering coefficient is an important parameter that reflects the closeness of network connections [30]. The clustering coefficient of node i is defined as the ratio of the actual edge number to the maximum possible edge number between the neighboring nodes of node i, calculated by Equation (6).
C i = 2 e i k i ( k i 1 )
where e i means the number of actual edges between the neighboring nodes of node i.
The network clustering coefficient is expressed as the average of the clustering coefficients of all nodes. A larger clustering coefficient indicates that the network has a strong fault tolerant. Even if individual nodes fail, network performance can still be achieved.
(4)
Closeness centrality
In a connected graph, the closeness centrality of a node is a measure of centrality in a network, calculated as the reciprocal of the average length of the shortest paths [44]. For a node i, its closeness centrality C C i is defined by Equation (7).
C C i = n 1 j = 1 , i j n d i j
The value of C C i reflects the relative importance of node i in the whole network, and the higher closeness centrality a node is, the closer it is to all other nodes.

3.2.3. Network Vulnerability Metrics

A GURT network has complex network characteristics and exhibits obvious vulnerabilities under the disruptive events, such as rainstorm disasters, terrorist attacks, or vehicle failures [15]. When the network is attacked, the failure of a node will cause the failure of the edges connected to that node, which will in turn trigger a change in the network topology and affect the network efficiency. To examine these changes, the following two metrics are chosen to evaluate the vulnerability of a GURT network.
(1)
Network efficiency
The shortest path length d i j has large implications for the transport and communication in a network. The smaller the shortest path length, the more efficient the network delivery. We use the inverse of the shortest path length between nodes i and j to express the node efficiency ε i j , as indicated in Equation (8).
ε i j = 1 d i j
Network efficiency is an important indicator to characterize the whole network performance, and a higher network efficiency indicates a better network connectivity. Network efficiency E is defined as the average value of the node efficiency of all nodes in the network, as indicated in Equation (9) [45].
E = 1 n ( n 1 ) i j ε i j = 1 n ( n 1 ) i j 1 d i j
(2)
Largest connected component ratio
As more nodes are deleted because of network failures, the entire network will be fragmented into multiple clusters. It is generally assumed that the cluster containing the most nodes in these clusters, called the largest connected component (LCC), will replace the performance of the remaining network [46]. The size of the LCC denotes the number of nodes included in LCC. A smaller change in LCC indicates that the network performance is less affected by the interference. As a result, we assess the vulnerability of the GURT network by the variation of LCC, which is called the largest connected component ratio C , as defined in Equation (10).
C = LCC s LCC i
where LCC s denotes the current size of LCC after network failure occurs. LCC i denotes the initial size of LCC when the network is intact. C is a metric that represents the magnitude and severity of network failure. In the initial state of the network (no failures), C = 1 . When system failure occurs, C will gradually decrease until the network has totally collapsed or fallen apart, C = 0 .

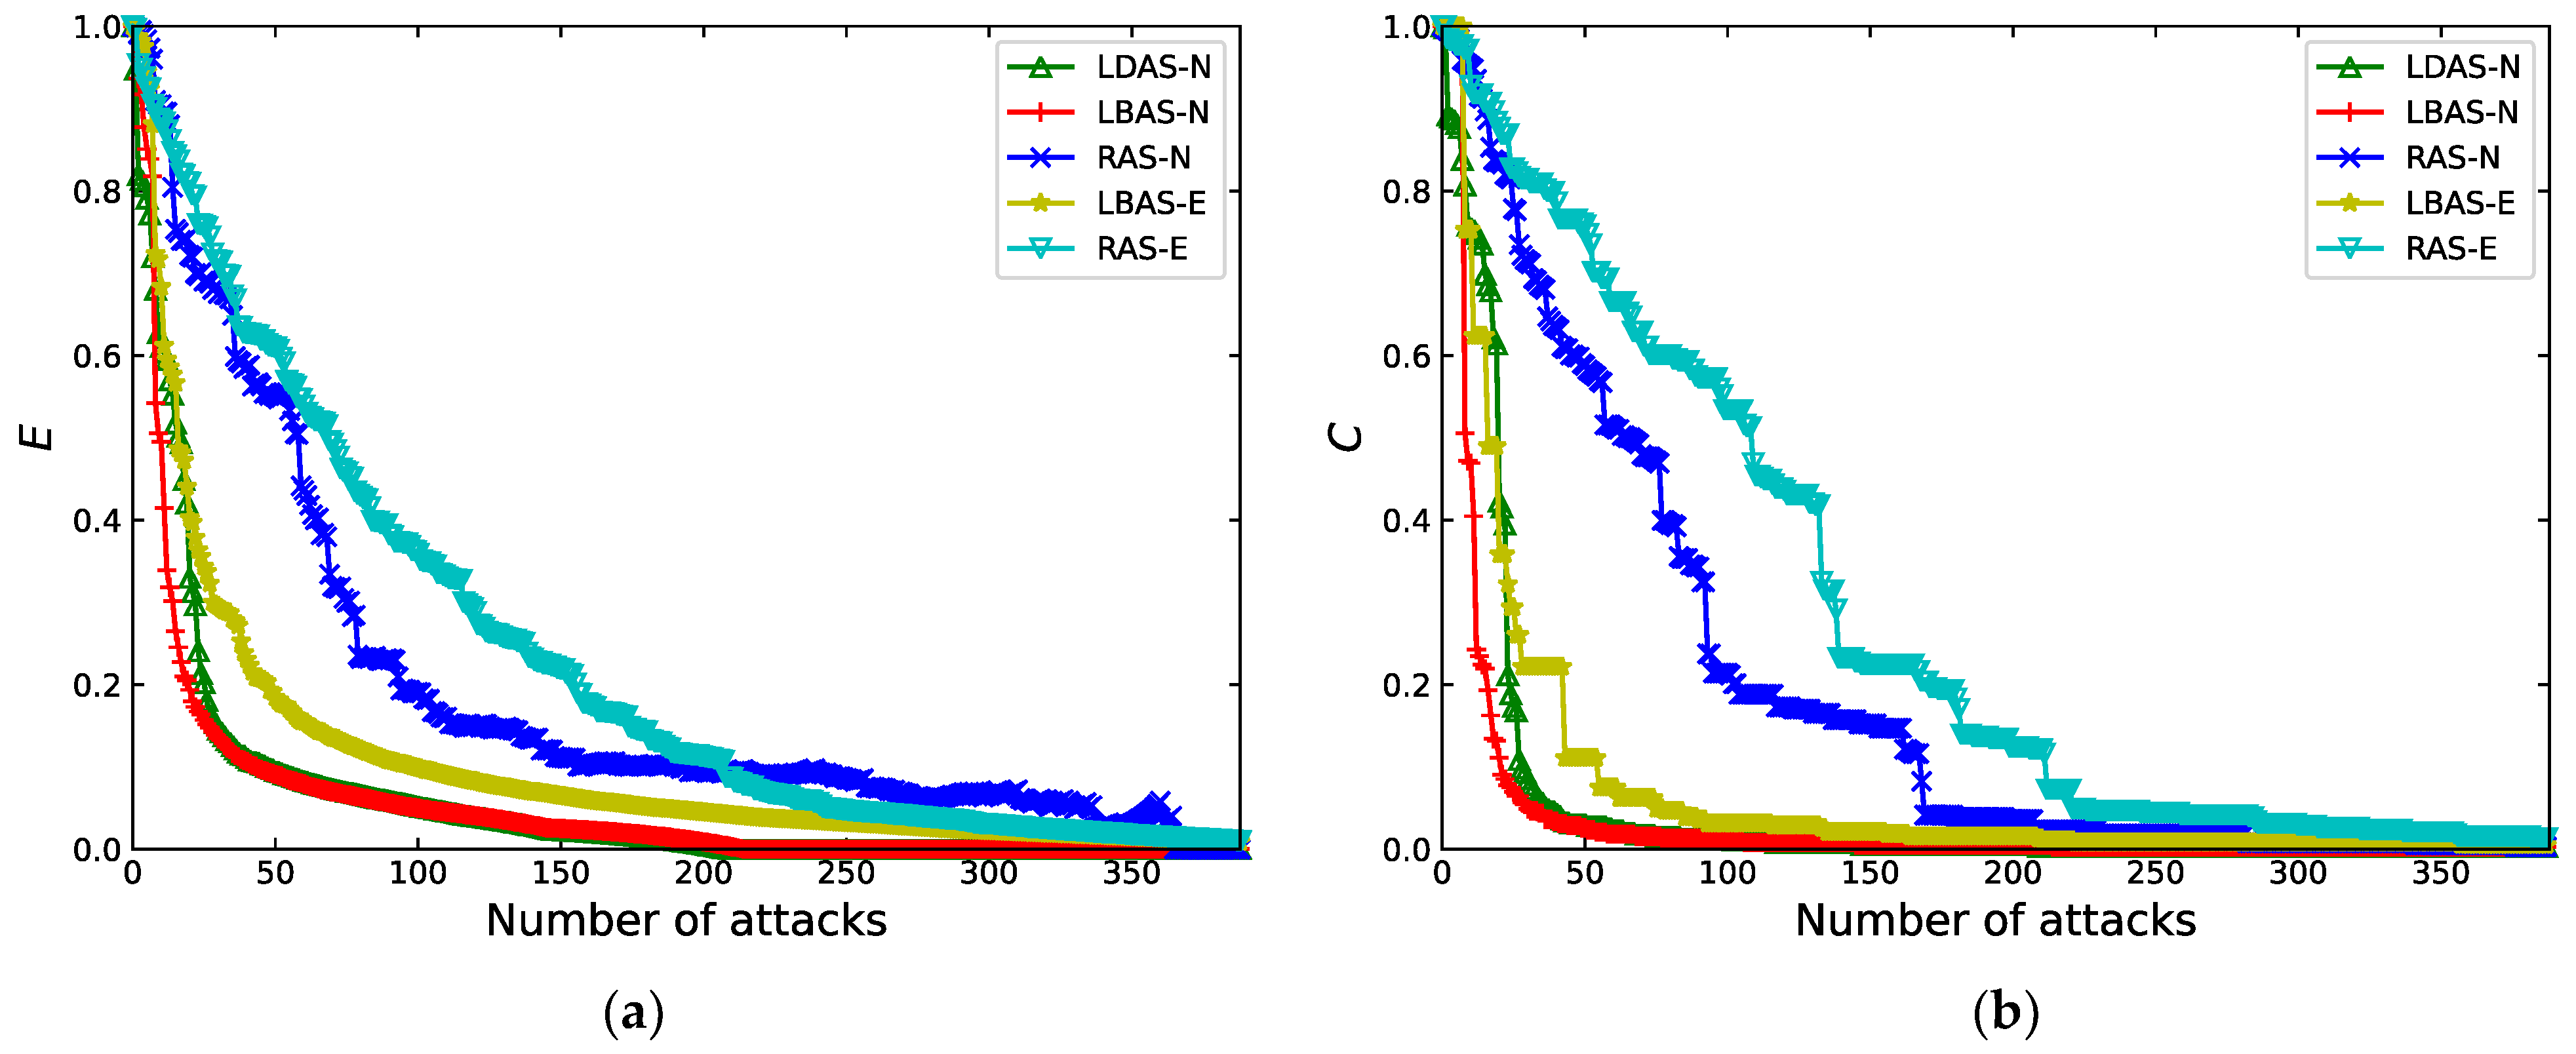
3.3. Network Attack Strategies

There is significant risk of nodes and edges suffering from random failures due to the complexity of the GURT network. The failure of nodes with different degree and betweenness has various impacts on network performance. The station with a larger degree and betweenness has a significantly greater impact on network performance than a general node and is more likely to be a target of malicious attacks. In this research, five different attack strategies are developed to further understand the failure process of the GURT network under different scenarios, specifically including random failures and targeted attacks. The strategies are summarized as follows:
  • Random attack strategy based on node (RAS-N);
  • The largest degree first attack strategy based on node (LDAS-N);
  • The largest betweenness first attack strategy based on node (LBAS-N);
  • Random attack strategy based on edge (RAS-E);
  • The largest betweenness first attack strategy based on edge (LBAS-E).
In the failure simulation process, one node or edge is attacked at a time. Each node is removed with equal probability in the random attack strategy, while the node with the largest characteristic parameter (betweenness or degree) is selected for an attack each time in the targeted attack strategy. Taking the LDAS-N strategy as an example, the node with the largest degree in the initial network is selected to attack for the first time. Then, the network is updated and the node with the highest degree among the remaining nodes is selected for the next attack. The attack ends until the network is completely paralyzed. This attack strategy is more devastating compared to the strategy of attacking nodes sequentially in a fixed order. Figure 1 is the flow chart of the network node attack simulation process, and the main steps of the failure simulation procedure for the GURT network under different attack strategies are briefly introduced as follows:
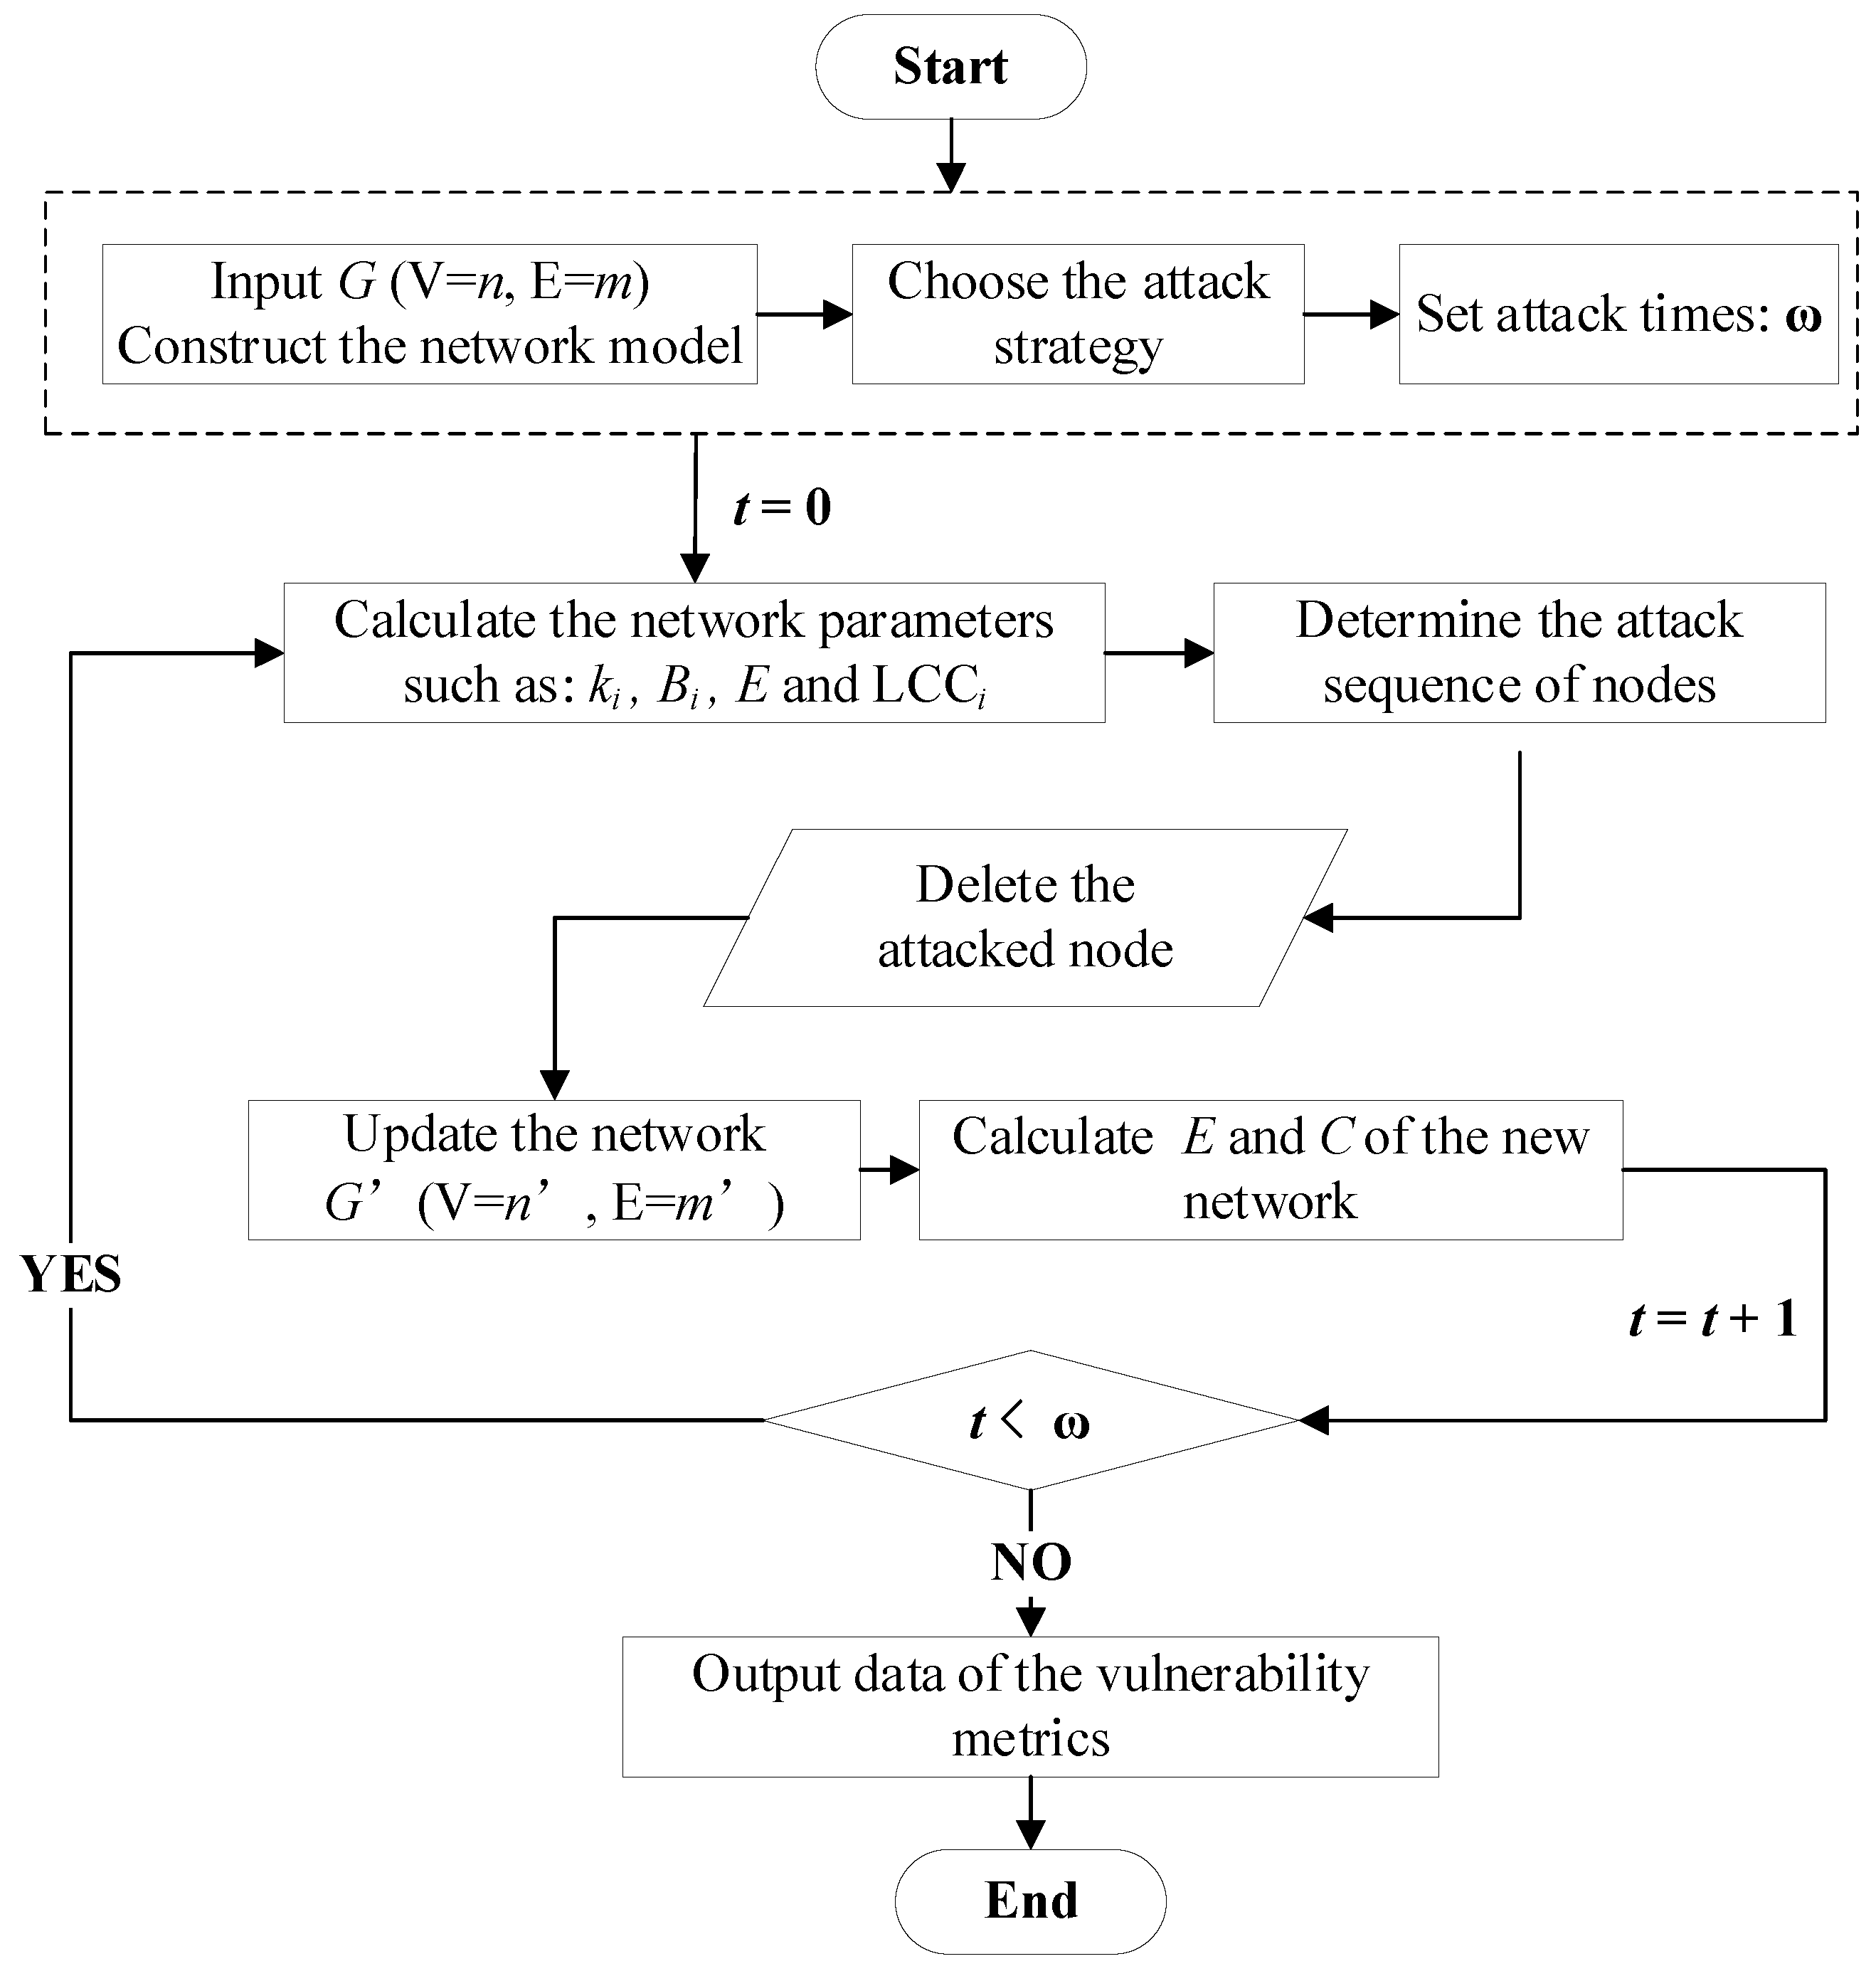
  • Step (1): Construct the model of GURT network, with the stations as nodes and the rail lines as edges;
  • Step (2): Calculate the network efficiency E and largest connected component ratio C in the initial state;
  • Step (3): Choose an attack strategy, calculate the characteristic metrics of network nodes and edges, and determine the attack sequence;
  • Step (4): Remove the attacked node or edge. When the node is removed, the edges connected to this node are removed at the same time. Then, update the network;
  • Step (5): Compute the network efficiency E and the largest connected component ratio C after node or edge is deleted;
  • Step (6): Go back to Step (3) and continue with the next attack until the GURT network is completely collapsed;
  • Step (7): Attack ends.

4. Results

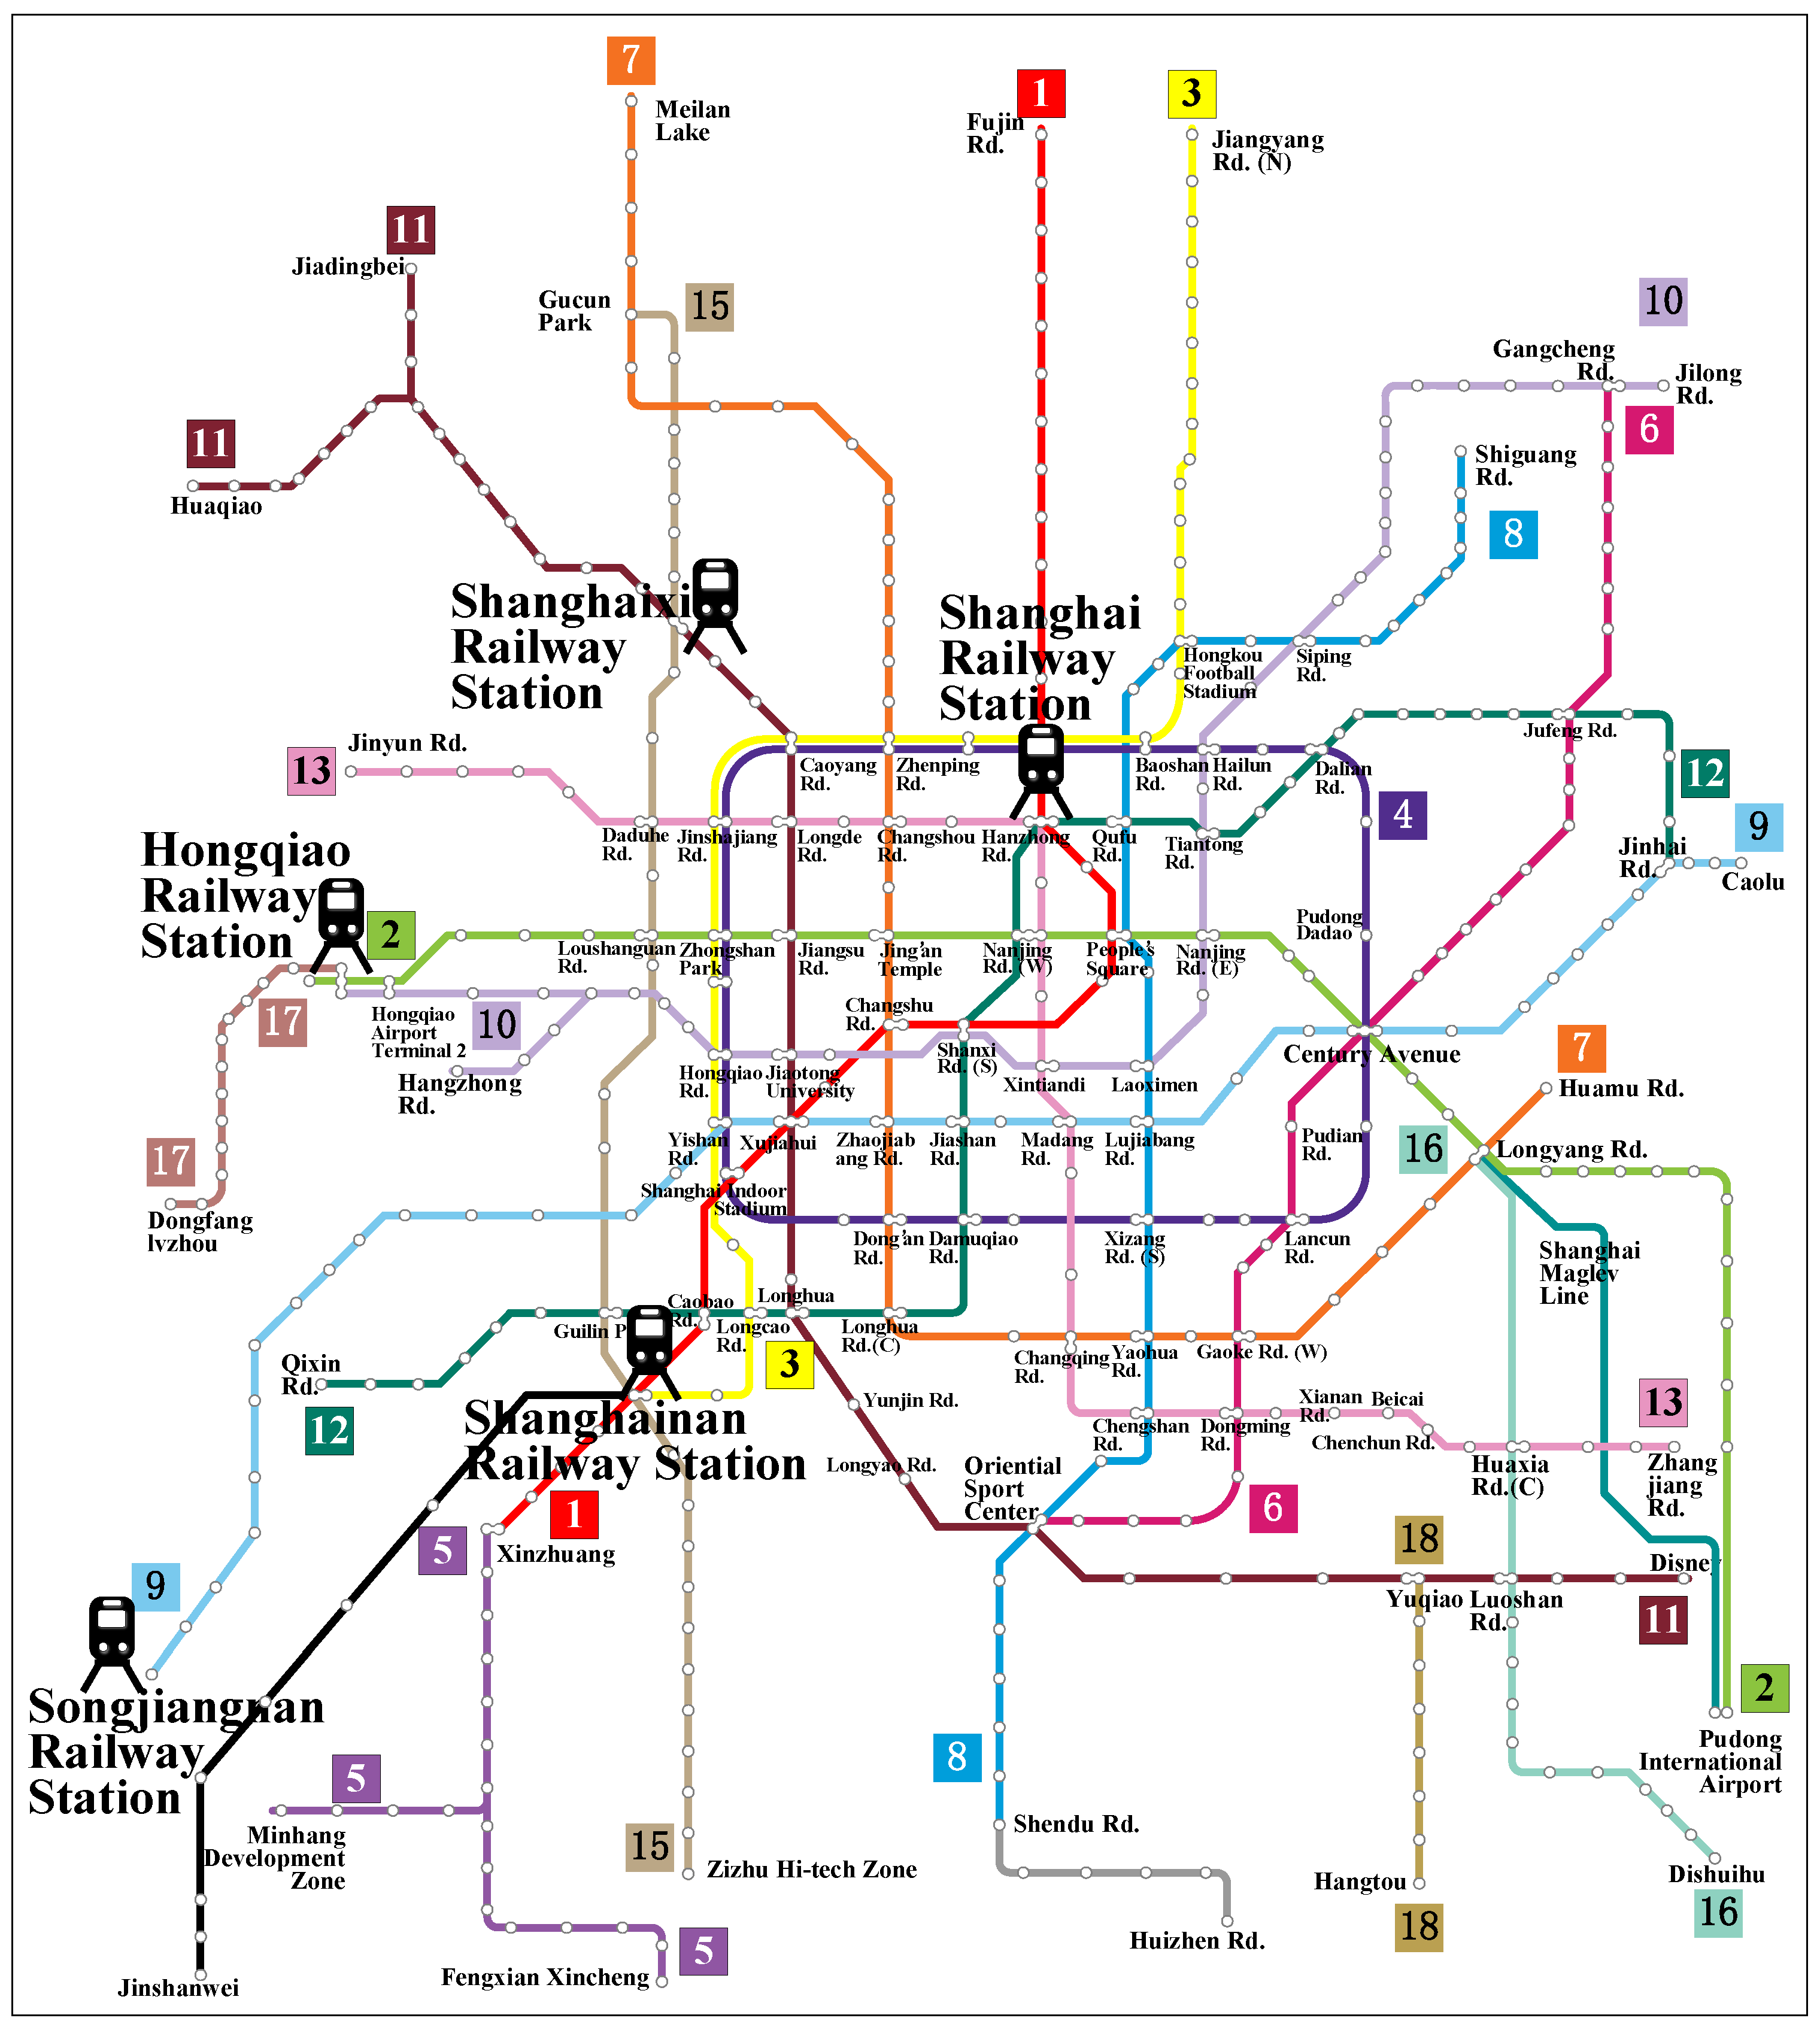
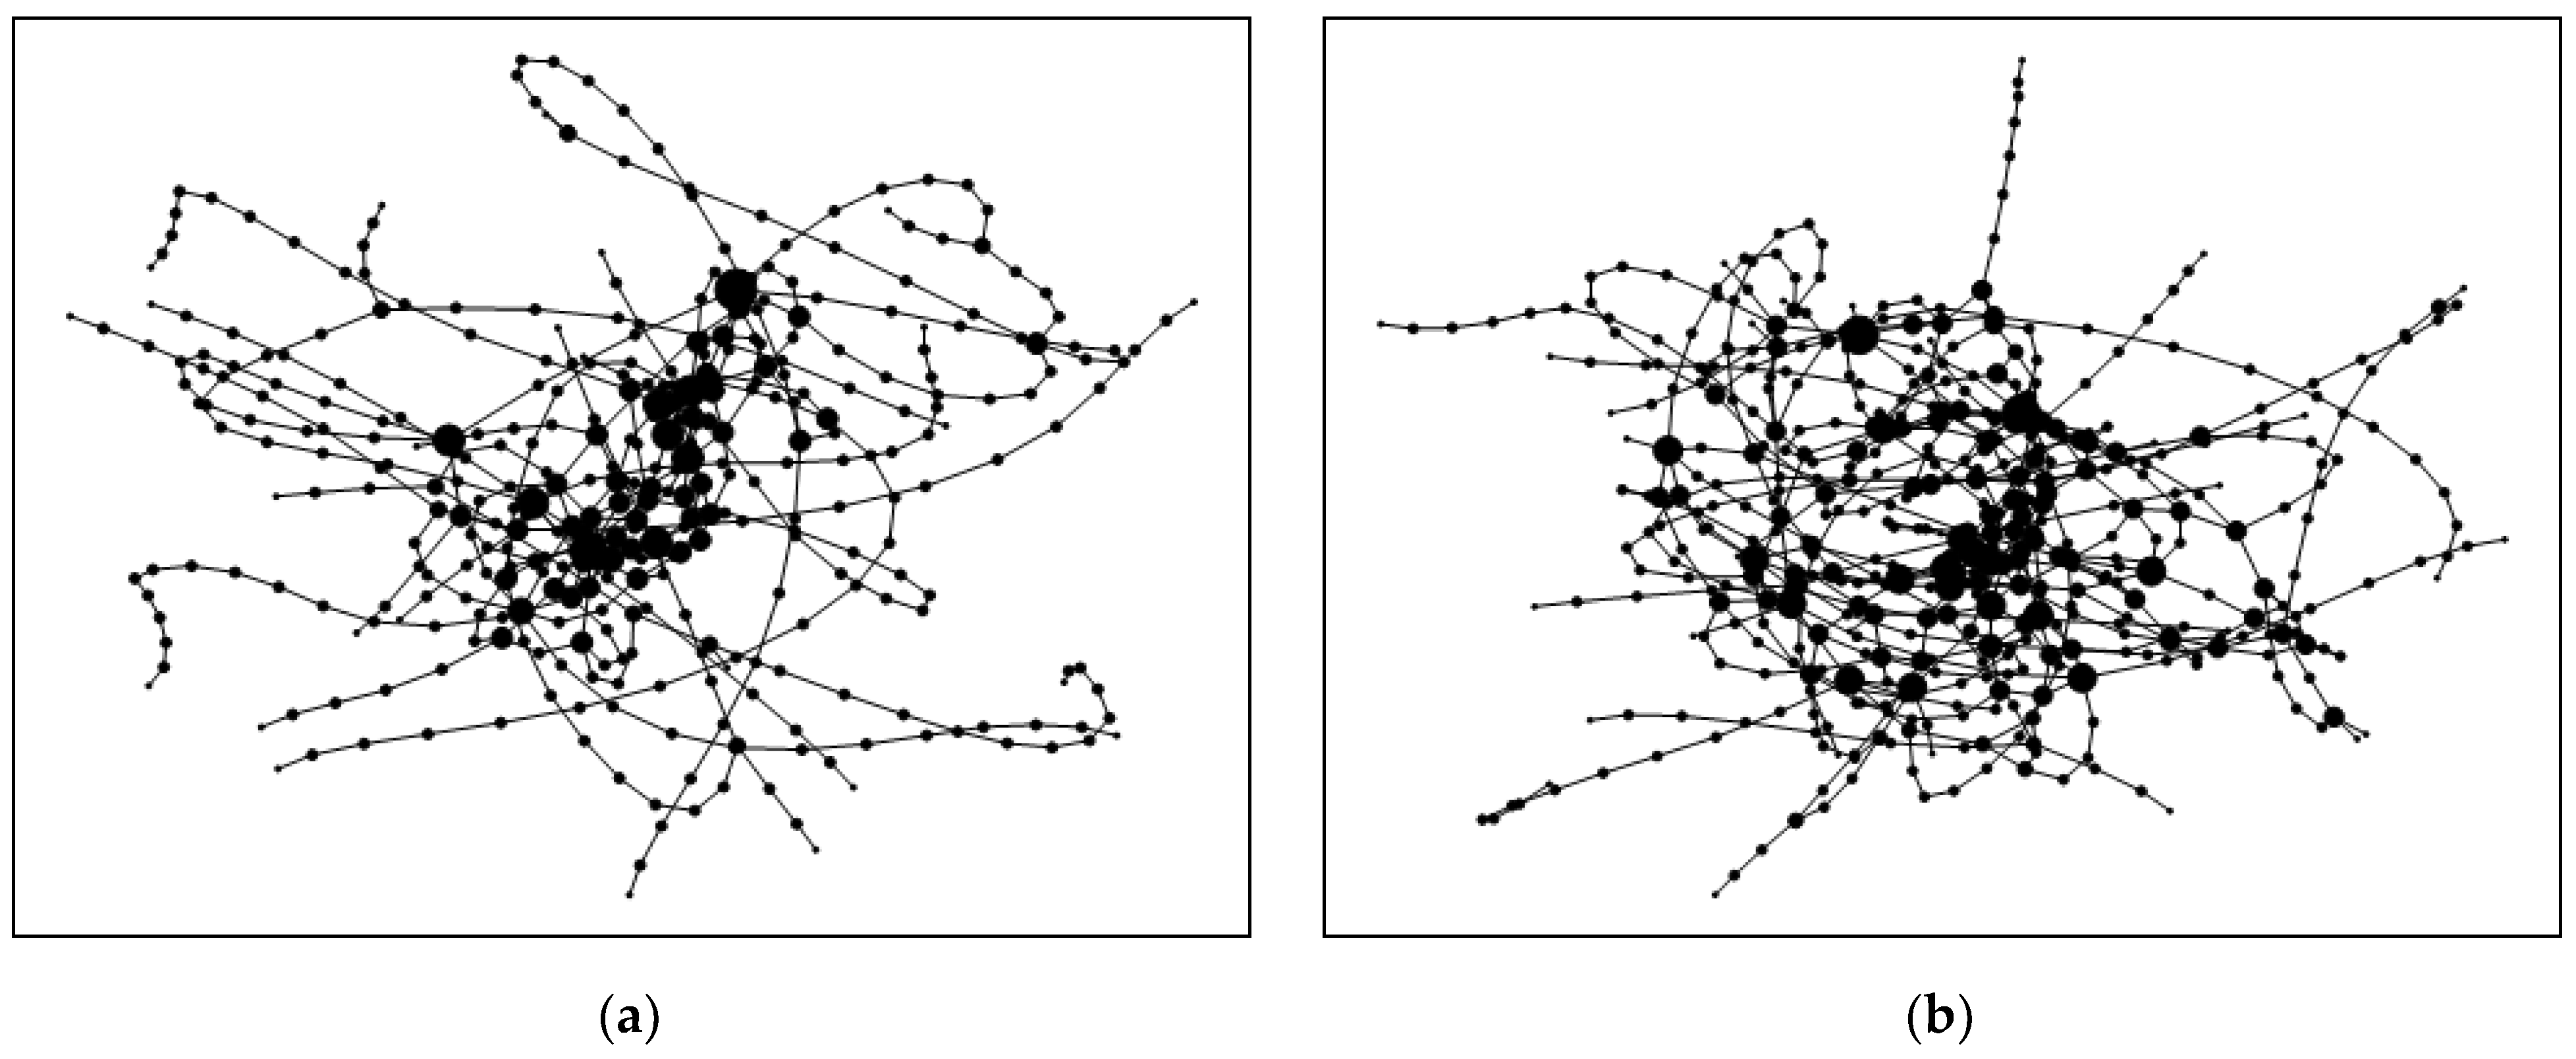
4.1. Modeling of SHRT Network

Shanghai is the most populous urban area in China and the most populous city proper in the world, with a population of 24.87 million as of 2020 [47]. As a typical representative of metropolises, Shanghai also has severe urban traffic congestion which needs to be solved. To promote the capacity and accessibility of public transportation, Shanghai has been vigorously promoting the construction of urban rail transit, and a massive network including metro and suburban railway has been constructed. Since the first Shanghai rail transit line 1 was opened in 1993, SHRT has opened many lines one after another. Up to 31 October 2021, SHRT currently consists of twenty lines which are line 1, line 2, line 3, line 4, line 5, line 6, line 7, line 8, line 9, line 10, line 11, line 12, line 13, line 15, line 16, line 17, line 18, Maglev line, Pujiang line, and Jinshan line, respectively. We used the Space L method to construct a schematic diagram of the SHRT network, as shown in Figure 2. According to the statistics, SHRT has 468 stations in operation and a total operating mileage of 828.4 km, which ranks the first largest rail transit system by route length in the world [48]. It is also one of the most representative GURT systems. Hence, the SHRT network is chosen as an empirical research object to analyze the destruction resistance of GURT networks from the perspective of vulnerability.
Dedicated to deeply analyze the topological characteristics and the destruction resistance of SHRT, the Python programming language, combined with the NetworkX package, is used to build the network model. In the model, stations are defined as nodes and rail lines connecting stations are defined as edges. The transfer station is considered as one node, and multiple rail lines between the two stations are considered as one edge. In SHRT system, line 3 and line 4 partially share the same edges and stations along the line. Those shared stations and lines are considered only once in the network, as described in this study. The topology model of SHRTON is constructed based on those principles, as shown in Figure 3a.
SHRTON in Figure 3a contains a total of 388 nodes and 448 edges. Node size in the diagram is proportional to the corresponding node degree, and the larger node degree, the larger node size. To analyze the different impacts of stations on the network, the rule for numbering the stations is developed. First, the top ten important stations obtained from the questionnaire are numbered, and the other stations are numbered sequentially in the order of the lines. As a consequence, the Shanghai Hongqiao Railway Station is numbered M1, Xujiahui Station is numbered M7, Qibao Station is numbered M211, and the overall network is digitally coded.
The scale of the SHRT network continues to grow, being driven by urban development. Currently, there are nine rail transit lines under construction in SHRT, including line 14, line 18, Jiamin line, etc. According to the third phase of Shanghai urban rail transit construction plan (2018–2023), more than six rail transit lines will be built, including line 19 and line 20. By that time, SHRT will add 102 stations and 166 edges, forming a more complete GURT network. Different from previous studies, this study explores the destruction resistance of SHRT networks in the context of scale growth. To this end, the topology model of SHRTPN is constructed based on the planning data, as shown in Figure 3b. The destruction resistance enhancement strategies for GURT will be explored by comparing the topology characteristic and analyzing the vulnerability of the two networks.

4.2. Comparison of Topology Characteristics in SHRTON and SHRTPN

The characteristic indexes of SHRTON and SHRTPN are calculated based on the network model, as shown in Table 1. It illustrates that the average degree, average betweenness, average clustering coefficient, average closeness centrality, network connectivity, and network efficiency of SHRTPN have significantly improved than SHRTON, while the APL and network diameter are reduced accordingly. Specifically, the average clustering coefficient of SHRTPN almost doubled compared to SHRTON. Combined with the increase in the average degree and average betweenness, it shows that the local connectivity of SHRTPN is stronger. Furthermore, the increase in the average closeness centrality means that the nodes in SHRTPN are closer to each other. Along with the smaller average path length and network diameter, the global network connectivity of SHRTPN is also enhanced by 8.3%. This is consistent with the results showing over 10% improvement in network efficiency for SHRTPN.
The node degree distribution of SHRTON and SHRTPN is shown in Figure 4. The average degree of SHRTON with 388 stations is 2.309, while the average degree increases to 2.506 in SHRTPN with 490 stations. The ratio of stations with lower degree ( k 2 ) in SHRTPN is reduced accordingly, among which the ratio of stations with a degree equal to two decreased by 11.5%. However, the increase in stations with a higher node degree ( k 3 ) is ever more obvious, which nearly doubled from 68 to 130.
The degree and betweenness of the 388 selected stations in SHRTON and SHRTPN are calculated, as shown in Figure 5a,b, respectively. As can be seen from Figure 5a, with the increase in network scale, the degree of some stations remains unchanged, while the others increased. Among them, the station with the largest degree in SHRTON is Century Avenue Station, with a degree of eight; 295 stations with degree of two, accounting for 77%; 68 stations with the degree greater than and equal to three, accounting for less than 18%. New rail lines added in SHRT make a significant increase in the degree of some stations, such as Qibao Station and Hulan Road Station. In SHRTPN, the stations with a degree of eight increased by one for Longyang Road Station; 329 stations with degree of two, the proportion dropped to 67%; 130 stations with a degree greater than and equal to three, approximately 27%.
In Figure 5b, the betweenness of the same station fluctuates greatly in SHRTON and SHRTPN. Unlike the trend of degree change, the betweenness of some stations increased while that of others decreased. In SHRTON, the station with the largest betweenness is Xujiahui Station, with betweenness of 16,174; 68 stations with betweenness over 5000, accounting for about 17.5%; there are also 26 stations with betweenness of zero. In SHRTPN, the station with the largest betweenness is Qibao Station, with betweenness of 30,578; there are 92 stations with the betweenness over 5000, accounting for about 18.7%; the number of stations with betweenness of zero is reduced to 19.
Moreover, some special stations are selected to deeply analyze the relevance of the characteristic metric changes, and the information for each station is shown in Table 2. It is found that the degree and betweennesses of Hongqiao Railway Station, Shanghaixi Railway Station, Jing’an Temple Station, and Qibao Station have been increased. In particular, the degree of Qibao Station in SHRTPN is triple that of SHRTON, and the betweenness almost increases ten-fold. The reason is that Qibao Station in SHRTPN is a core transfer station for Line 9, Jiamin Line, and Airport Link Line. Overall, the added rail lines greatly shorten the distance between the east and west of Shanghai, and Qibao Station will become a critical transportation hub. In terms of Hongqiao Railway Station, the degree is doubled and its betweenness almost correspondingly quintuples after scale growth, which also shows its important hub position in the future development planning. Several other stations maintained the same degree but different betweenness. The degree of Century Avenue Station is unchanged while the betweenness has increased, suggesting that its pivotal position in SHRTPN remains important. The betweenness of the other stations has a general decline, of which Shanghainan Railway Station has the largest decrease of about 53%. This shows that the additional stations or lines are not connected to these stations, and that the distance between other stations is shortened with the change of network structure, which reduces the passenger transport pressure of these stations.

4.3. Analysis of Network Vulnerability under Different Attack Strategies

In this section, the failure process of the SHRT network will be simulated under different attack strategies, and the destruction resistance of the SHRT network will be analyzed based on the developed vulnerability metrics.

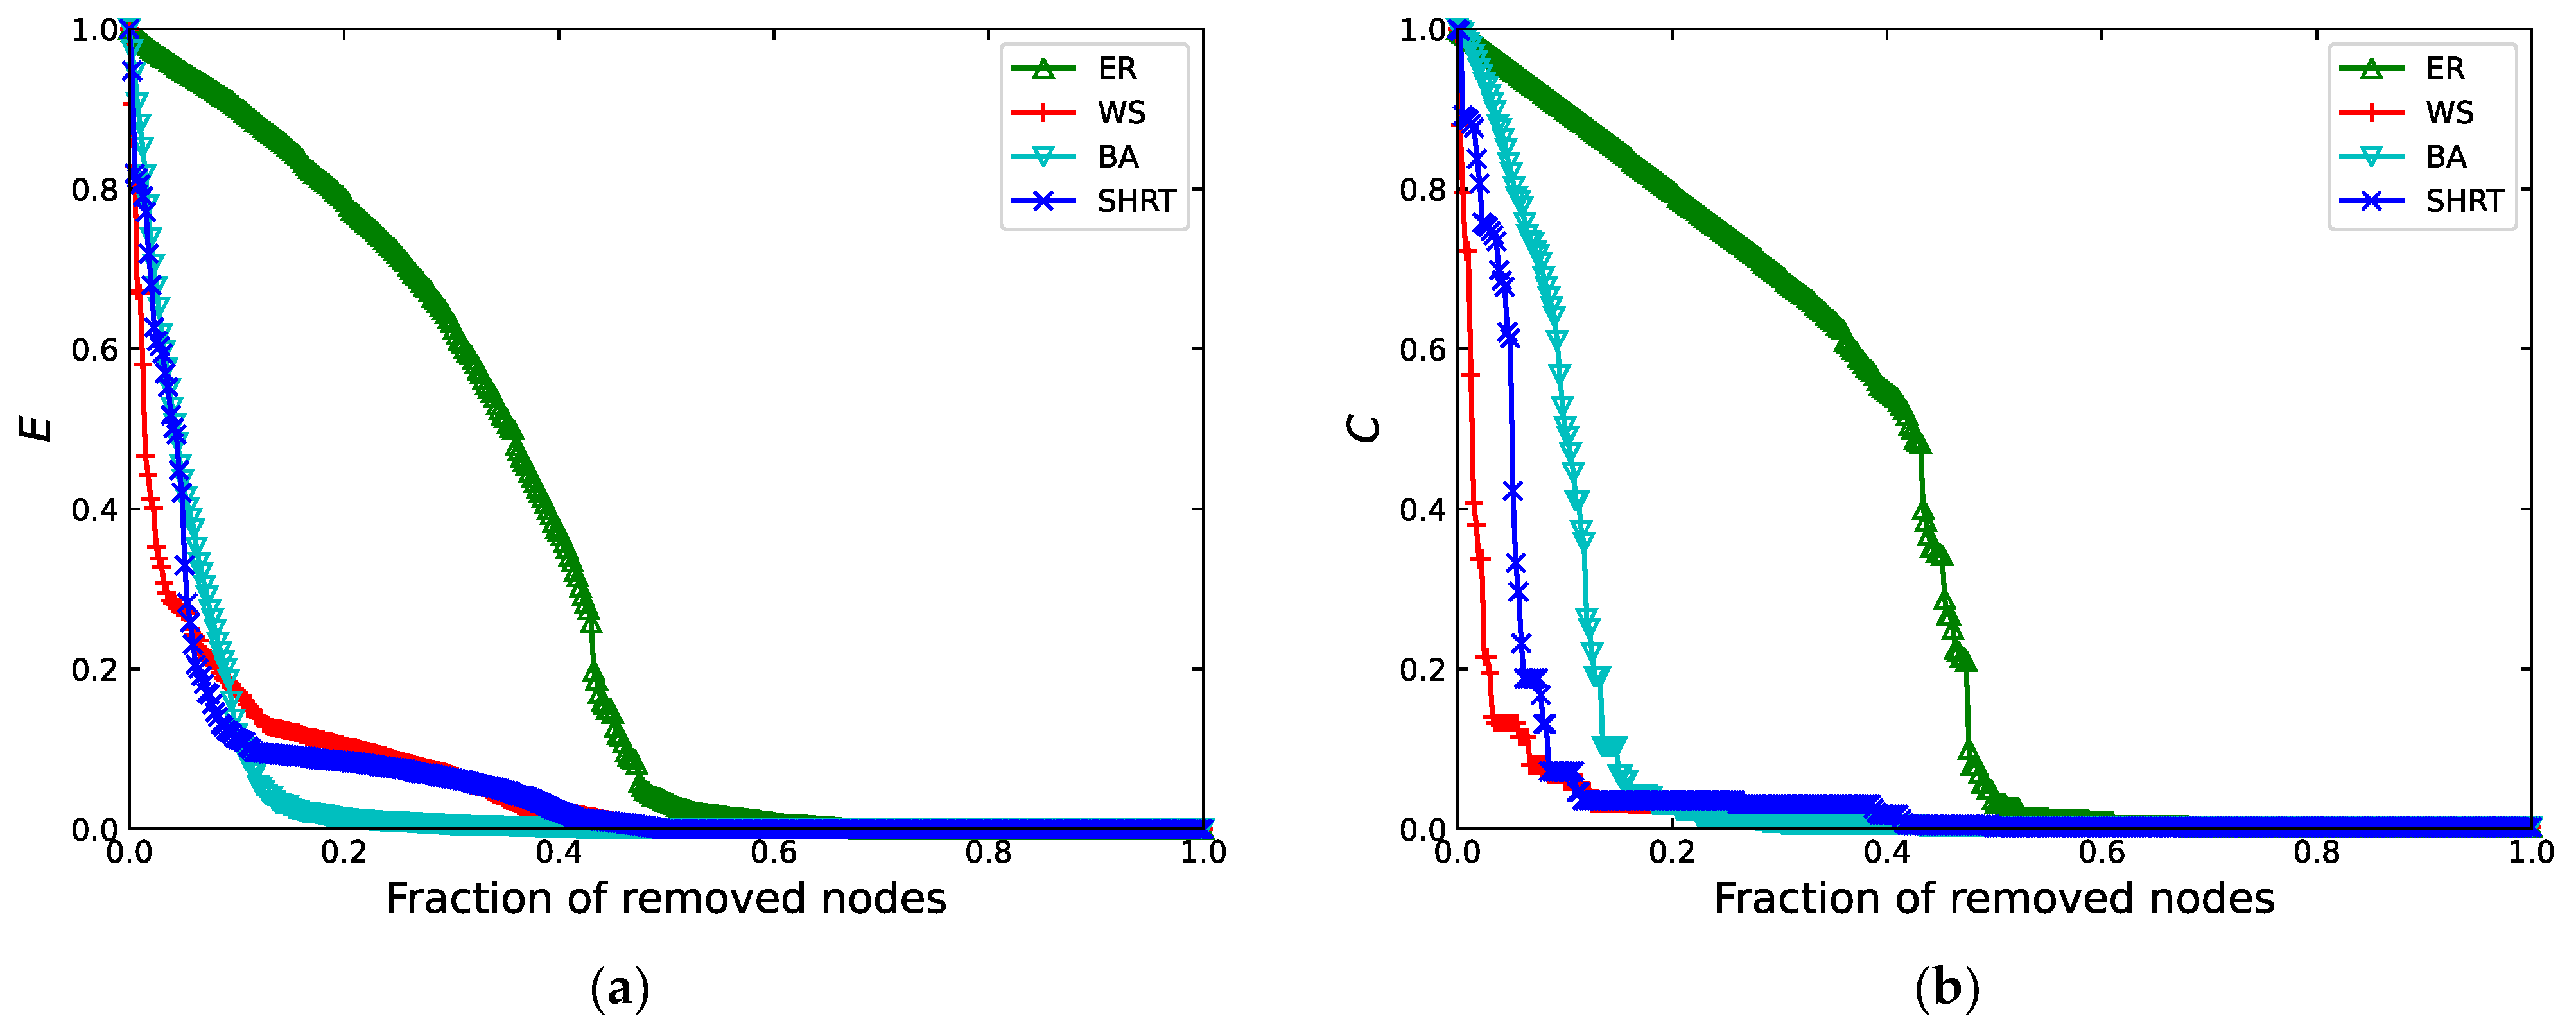
4.3.1. Vulnerability Comparison of the Theoretical Networks and SHRTON

For simplicity and without loss of generality, we consider three theoretical networks (ER network, WS network, and BA network) with the same number of nodes (N = 400) as a similar size to SHRTON for vulnerability comparison. For the ER network, the randomness of the added edges is p = 0.02 . For the WS network, the randomness of the reconnected edges is set to be p = 0.3 , and the average degree is set as k W S n e t w o r k = 2.32 . For the BA network, each new node has two edges connected to the existing nodes. The attack strategy RAS-N, LDAS-N, and LBAS-N are used to simulate the failure process of the theoretical network and SHRTON. The edge attack strategies are not considered due to the randomness of edge connectivity in the theoretical network.
The simulation results demonstrate that the WS network, BA network, and SHRT networks all exhibit stronger robustness under RAS-N, which is consistent with previous studies [14]. However, these three networks show significant vulnerability under LDAS-N and LBAS-N, and only a few nodes failure will cause a large loss of network efficiency and LCC ratio. Taking the network failure under LDAS-N as an example, the vulnerability of the networks is compared, as illustrated in Figure 6. During the simulation, the attacked node is selected from the node, with a maximum degree in the LCC of the remaining network, then the network is updated after each attack.
It can be seen that, under the LDAS-N strategy, the downward trend of the ER network curve is slower, while E and C of the other three networks have decreased rapidly. The vulnerability of the WS network is the most obvious, where the failure of only 13 nodes causes the network efficiency to drop to 30.8% and the LCC ratio to drop to 14%, and the network is almost completely fragmented. The network efficiency of SHRTON decreases to 20.5% and the LCC ratio decreases to 18.8% when 24 stations failed because of the attacks. The failure process of SHRTON is similar to that of the WS network, and combining a shorter APL and a larger average clustering coefficient suggests that the SHRTON also has the characteristics of a small-world network.

4.3.2. Vulnerability Comparison of SHRTON under Multiple Attack Strategies

Taking SHRTON as an example to analyze the network vulnerability under different attack strategies, the results are shown in Figure 7. It indicates that the decreasing trend of network efficiency and LCC ratio under the random attacks is more moderate than that under targeted attacks. Specifically, the vulnerability of SHRTON is most obvious under the LBAS-N. As can be seen from Figure 7, the LCC ratio of SHRTON remains above 98.2% after the seventh attack, although there is a decrease. However, the LCC ratio of SHRTON suddenly drops to 50.5% after the 8th attack, while the network efficiency drops from 81.7% to 54.2%. The overall connectivity of the network is destroyed. When there are 21 failed nodes, the network efficiency drops to 17.9% and the LCC ratio drops to 9%. Thus, the network has basically collapsed.
Comparing the failure process of SHRTON under different attack strategies, it can be found that attack edges may lead to slower network failure than attack nodes. Under the attack against edges, the network efficiency continues to decrease, while the LCC ratio shows a stepwise decreasing trend, indicating that the removal of edges does not always lead to network breakdowns. Under the LBAS-E strategy, network topology changes due to the gradual removal of critical edges, associated with the shortest path changes, cause a rapid decrease in network efficiency [28]. During the initial seven attacks, the network efficiency gradually decreases while the LCC ratio remains at 100%. However, the LCC ratio drops to 75.2% and the network efficiency drops to 72.3% after the eighth attack, indicating that the overall network connectivity is damaged.

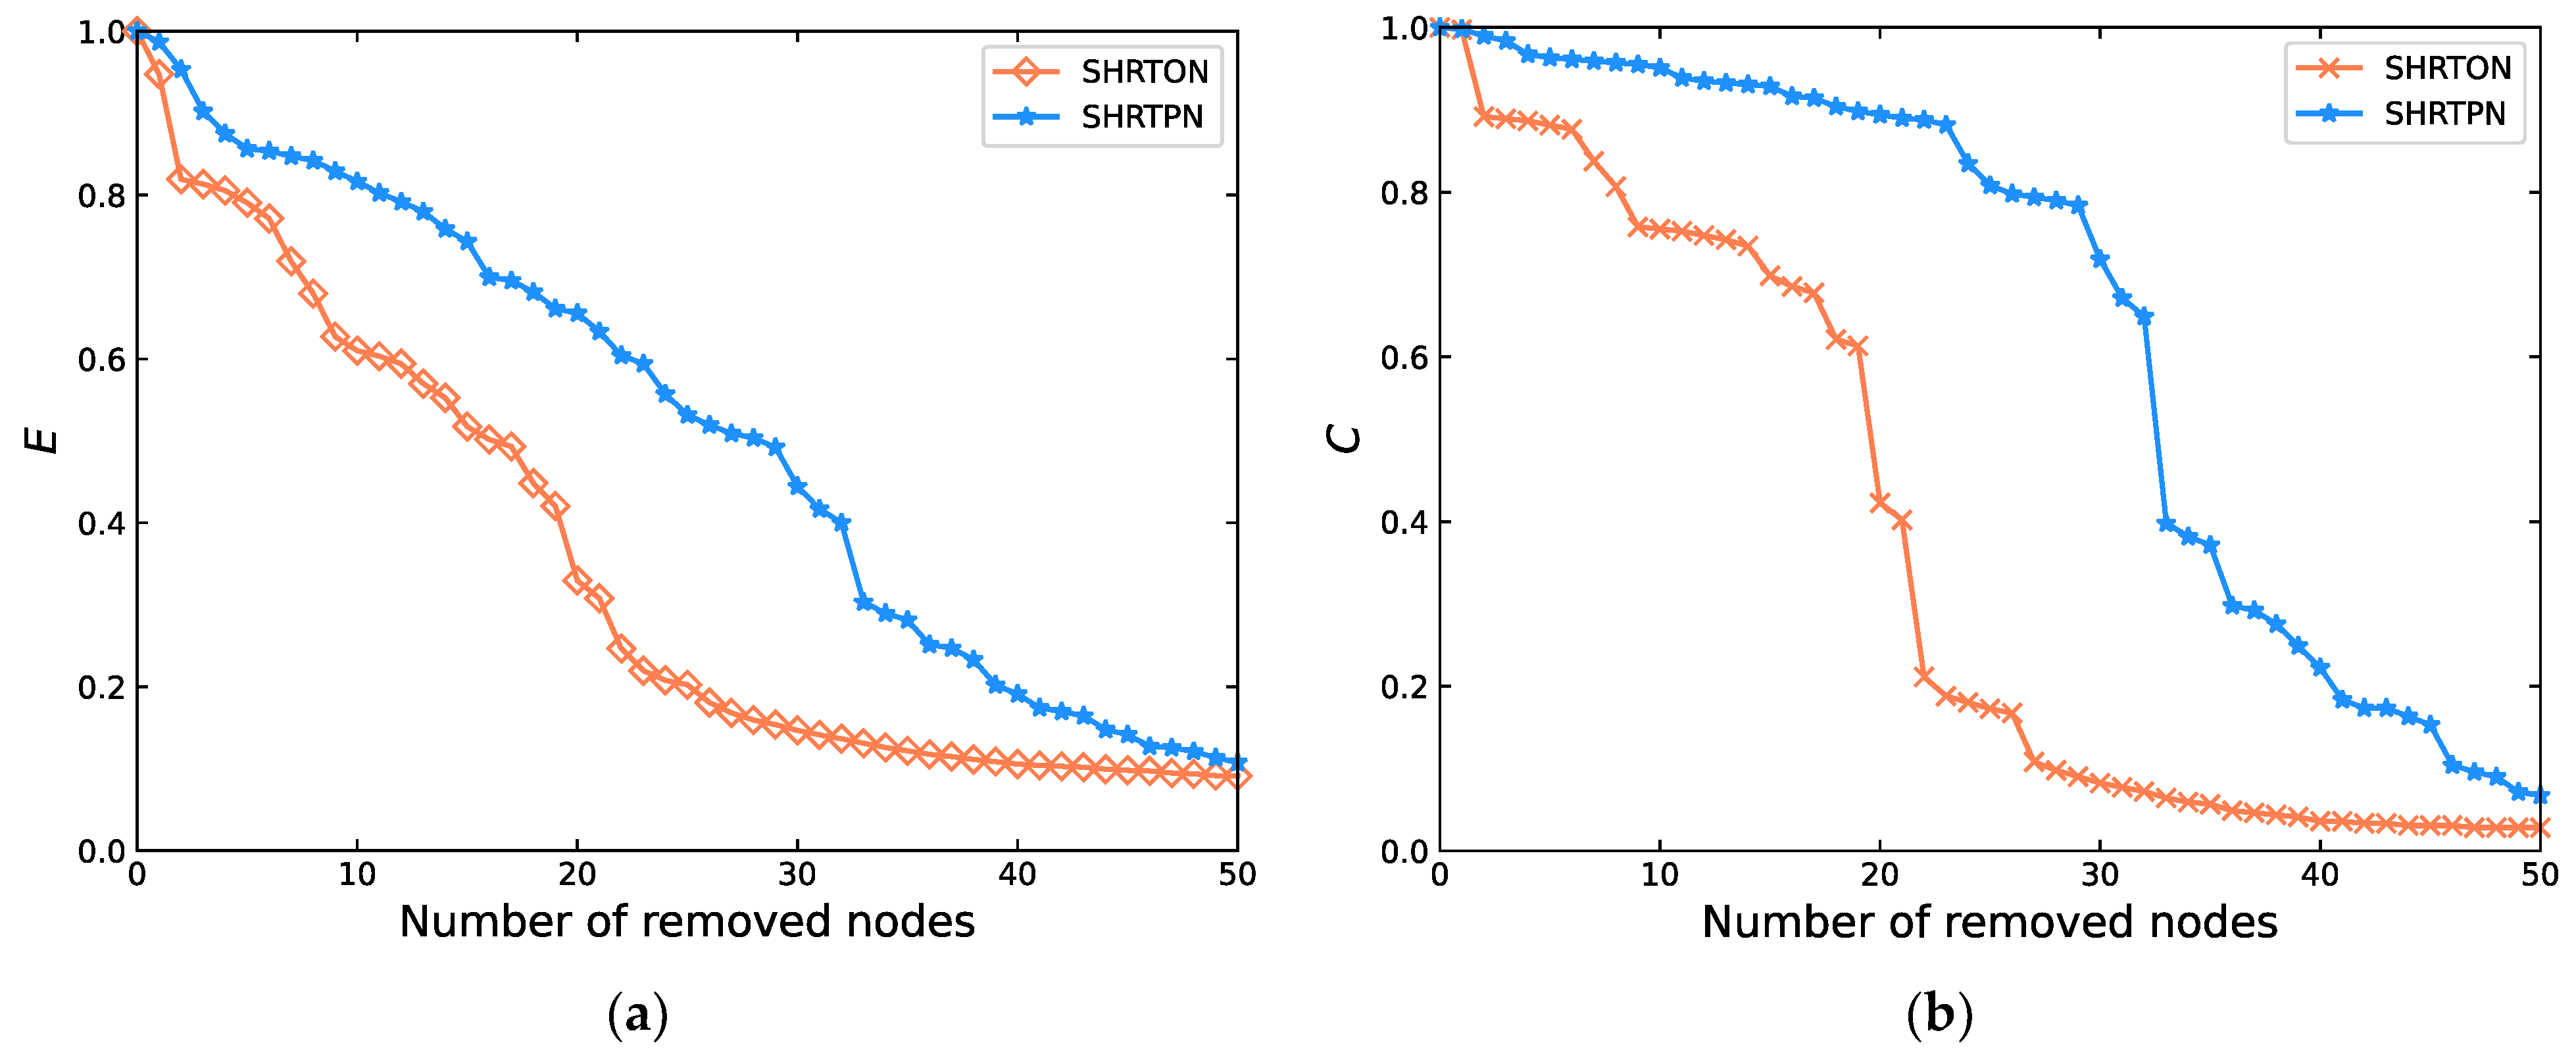
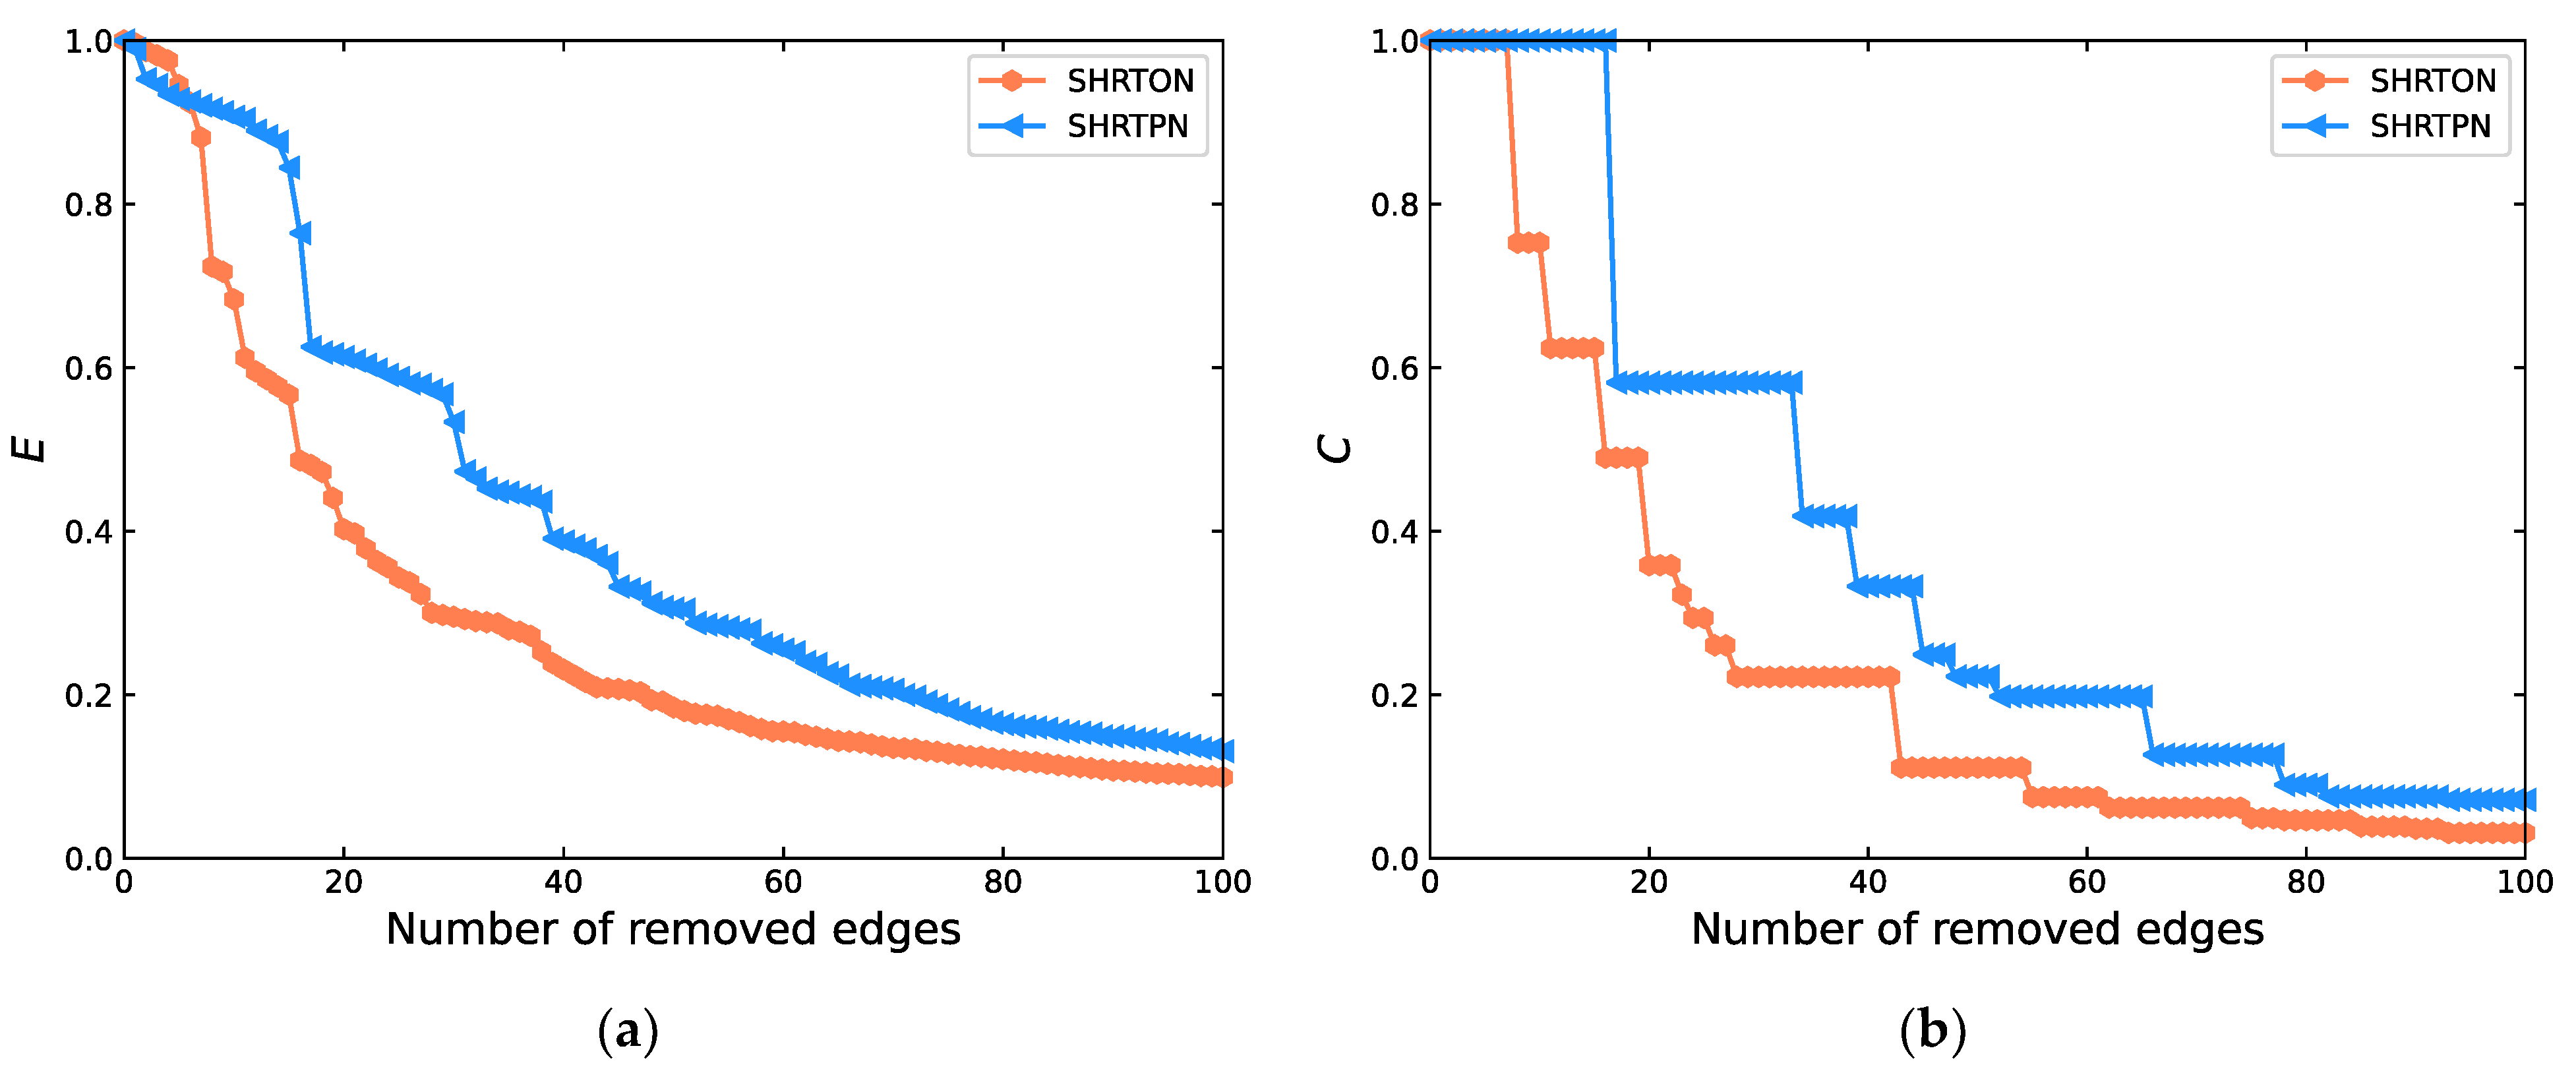
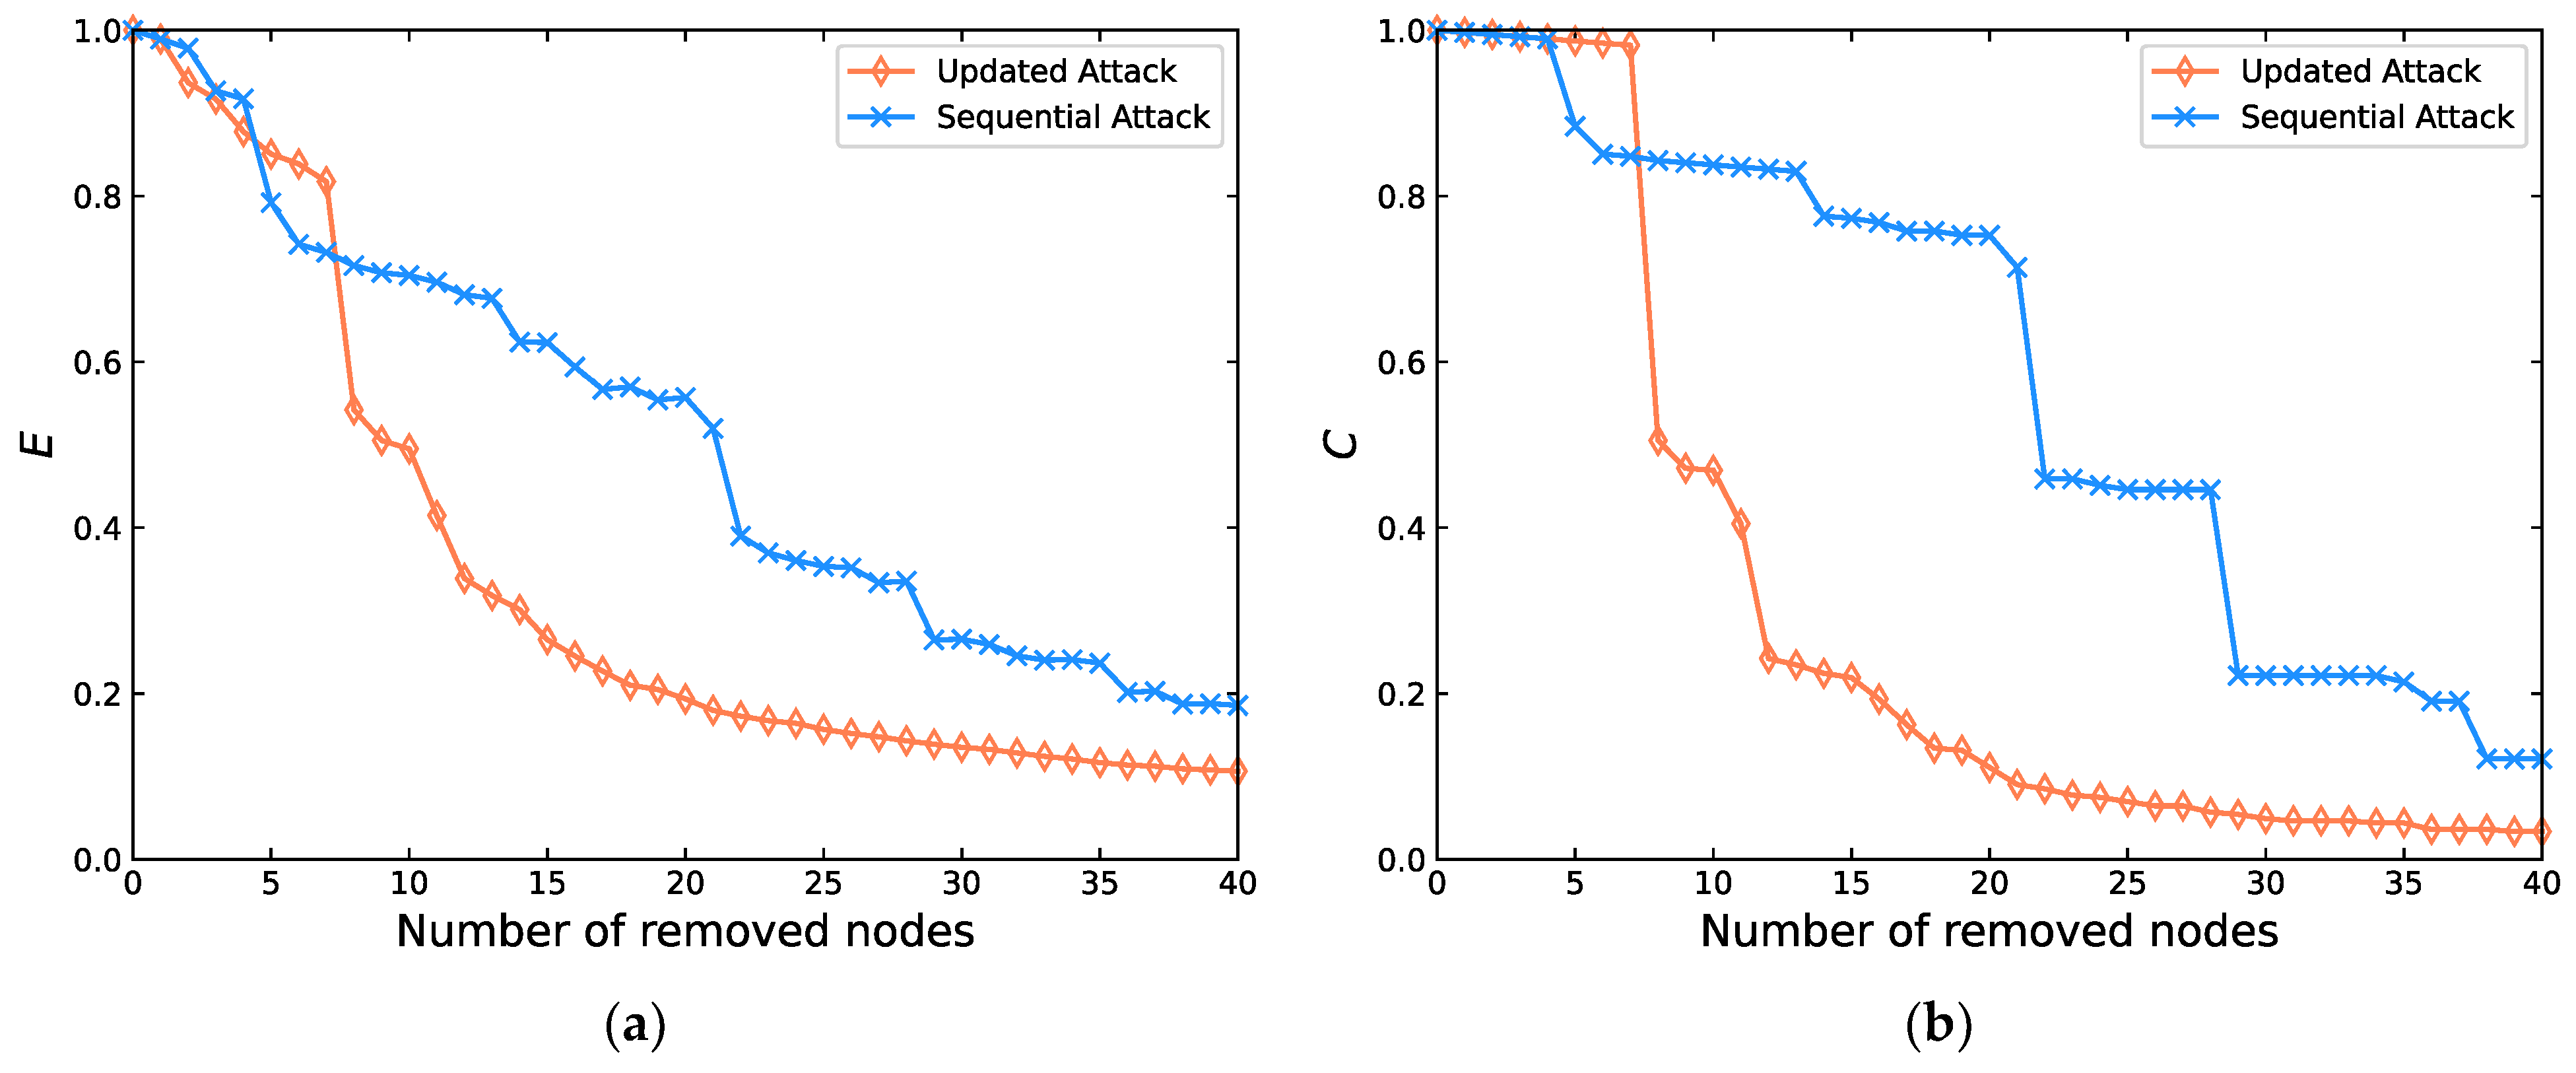
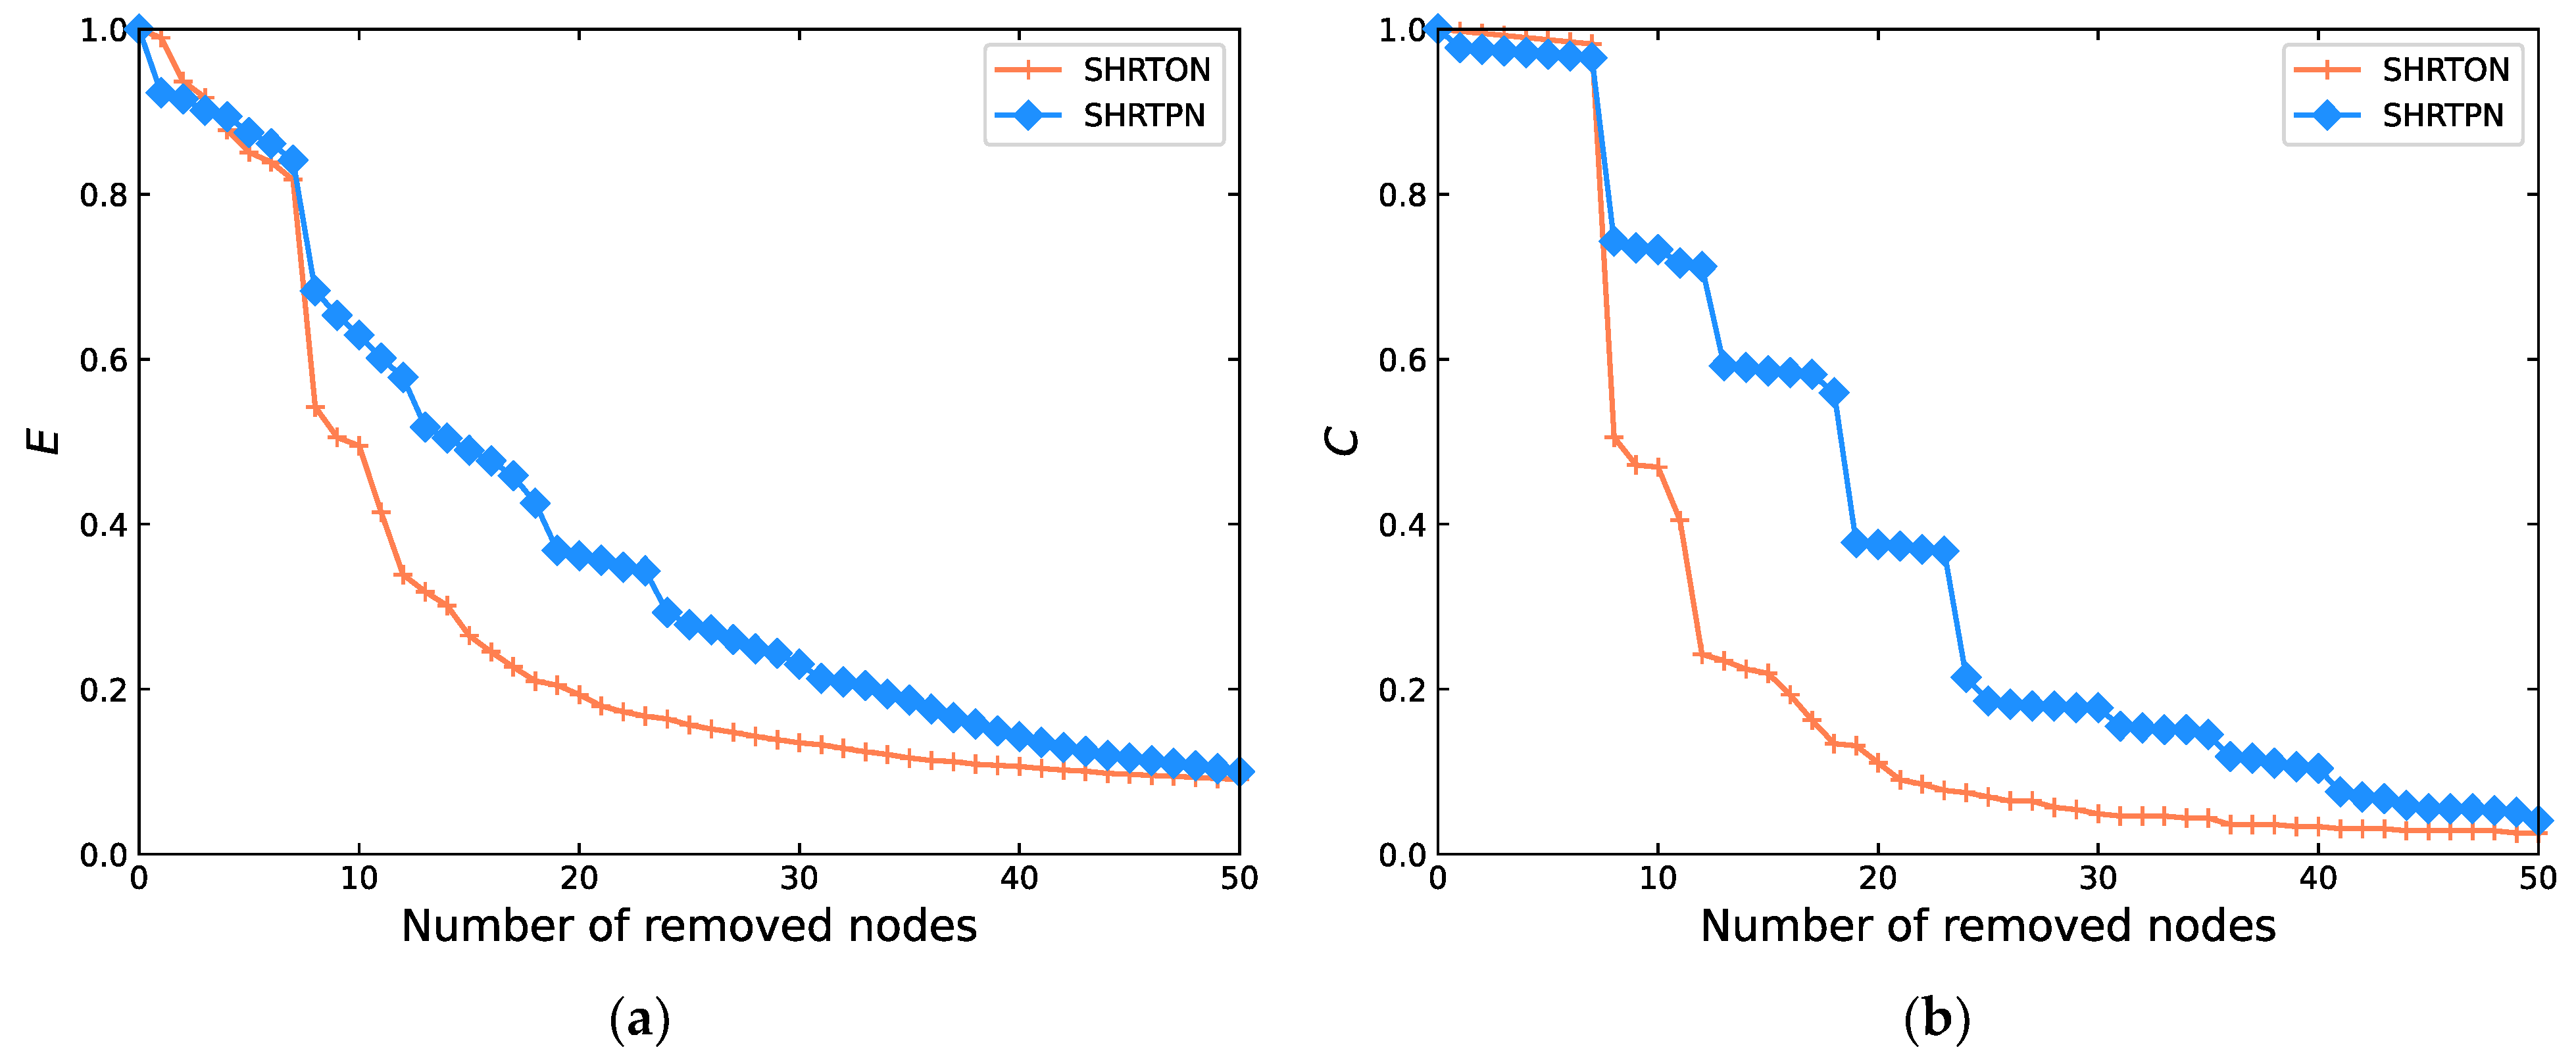
4.3.3. Vulnerability Comparison of SHRTON and SHRTPN

The different degree distributions of SHRTON and SHRTPN lead to various network topologies, and the network vulnerability under various attack strategies also differs. In this section, several attack strategies against nodes or edges are used to explore the destruction resistance of networks with different scales.
(1)
Attack network nodes
For the attack on network nodes, the strategies of LDAS-N, LBAS-N, and RAS-N are selected to simulate the network failure process, respectively. The results show that both SHRTON and SHRTPN exhibit strong robustness under the RAS-N strategy; however, both indicate obvious vulnerability under the targeted attacks. The simulation results under LDAS-N and LBAS-N are shown in Figure 8 and Figure 9, respectively. To clearly present the attack effect, only the first fifty attacks are plotted in the figure, where the horizontal axis indicates the number of failed nodes and the vertical axis indicates the network efficiency or the LCC ratio.
In Figure 8, the network efficiency and the LCC ratio of SHRTPN decrease more slowly than that of SHRTON, and the disparity in LCC ratio is particularly significant. At the beginning of network attacks, both the network efficiency and the LCC ratio decrease as the largest degree nodes are continuously removed, and the network efficiency decreases significantly faster than the LCC ratio. Nevertheless, the network efficiency and the LCC ratio of both networks are below 13% after the 50th attack, and the networks are basically paralyzed. In the initial stage of the network under attack, the LCC ratio can be maintained at a high level; however, once it exceeds the threshold [49], the network connectivity suddenly decreases. For example, the LCC ratio is 61.4% after the 19th station failure of SHRTON, which plummets to 23.5% after the 21st attack. The LCC ratio is 63.8% after the 32nd station failure of SHRTPN and drops to 39.9% after the next attack. The SHRTPN has a larger average clustering coefficient; therefore, when some stations fail at the beginning of the attacks, the neighboring stations of these stations still maintain normal operation and the network connectivity is virtually unaffected. When the 25th station fails, the LCC ratio of SHRTPN is still above 80%, while the LCC ratio of SHRTON is already less than 20%.
The simulation results of SHRTON and SHRTPN under LBAS-N strategy are shown in Figure 9. It can be seen that the network efficiency and the LCC ratio of both networks decrease rapidly. After the 50th attack, the vulnerability metrics of both networks are below 13%, and the networks are basically paralyzed. Specifically, the network efficiency of SHRTON decreases to 33.8% and the LCC ratio decreases to 24.2% with just 12 station failures. In contrast, after the failure of 12 largest betweenness stations in SHRTPN, the network efficiency remains above 60% and the LCC ratio is still up to 71.2%, which is a significant enhancement to the network destruction resistance. Compared with Figure 8, the attacks against the top 50 largest betweenness nodes show a significantly faster decrease in network efficiency and LCC ratio. Overall, the decrease rates of two vulnerability indicators in SHRTPN are significantly smaller than those in SHRTON, indicating that the vulnerability of SHRTPN is significantly improved.
It is worth noting that, for the first few attacks in Figure 9, both the network efficiency and the LCC ratio of SHRTPN decrease more rapidly than those of SHRTON. These three stations with the largest betweenness in SHRTPN are Qibao Station, West Huajing Station, and Hongqiao Railway Station, respectively. Their sequential failure leads to a more rapid decrease in network efficiency and LCC ratio than SHRTON (the failure of Xujiahui Station, Jiangsu Road Station, and Century Avenue Station). Among them, the failure of Xujiahui station (with betweenness of 16,174) causes a 1% decrease in the network efficiency of SHRTON, and the failure of Qibao station (with betweenness of 30,578) causes an 8% decrease in the network efficiency of SHRTPN. It indicates that, as the network scale increases, the station with the largest betweenness is more important in the network [36].
In addition, the specific attacks against SHRTON result in severe network damage. For example, the 8th and 12th attacks caused a loss of 48% and 16% of LCC ratio, respectively. Nevertheless, the problem of a sudden and large network break such as this was well solved in SHRTPN. Due to the change of network topology, the widespread damage caused by a single failure is transformed into a multi-stage and small-scale network failure, which effectively improves the destruction resistance of the SHRT network.
(2)
Attack network edges
For the attack on network edges, the strategies of LBAS-E and RAS-E are selected to simulate the network failure process, respectively. The results show that both SHRTON and SHRTPN exhibit strong destruction resistance under the RAS-E strategy, while they show a significant vulnerability under the LBAS-E strategy. The simulation results under the LBAS-E strategy are shown in Figure 10.
Overall, the destruction resistance of SHRTPN still performs better than SHRTON based on the network efficiency and the LCC ratio. The network efficiency continuously decreases with the removal of the largest betweenness edge, while the LCC ratio shows a stepwise decreasing trend, indicating that the removal of some edges does not necessarily lead to network breakdown, but definitely affects the network efficiency. Specifically, the network efficiency of SHRTON constantly decreases while the LCC ratio still remains 100% during the first seven attacks. In SHRTPN, the network efficiency consistently decreases in the first 16 attacks, while the size of LCC still remains the same. It illustrates that the network possesses strong robustness under small-scale attacks against edges. Comparing the attack against the largest betweenness nodes in Figure 9, it is found that the attack against largest betweenness nodes leads to faster and aggressive network failures than the attack against largest betweenness edges. Similar to the largest betweenness node attack, the initial few attacks under LBAS-E still lead to a more rapid decrease in the network efficiency of SHRTPN. The betweenness of edges in SHRTPN increases greatly with the network scale growth, and the failure of largest betweenness edges leads to the change of the network topology and shortest path, which affects the network efficiency on a larger scale. However, once the number of failed edges breaks through a certain threshold, the LCC ratio will show a fractured decline. As the network integrity suffers serious damage, the network efficiency will also drop rapidly. For example, the eighth attack on SHRTON results in a 24.7% decrease in the LCC ratio and a 15.8% decrease in network efficiency. In SHRTPN, the 17th attack also resulted in a 41.9% decrease in the LCC ratio and a 13.9% decrease in network efficiency.

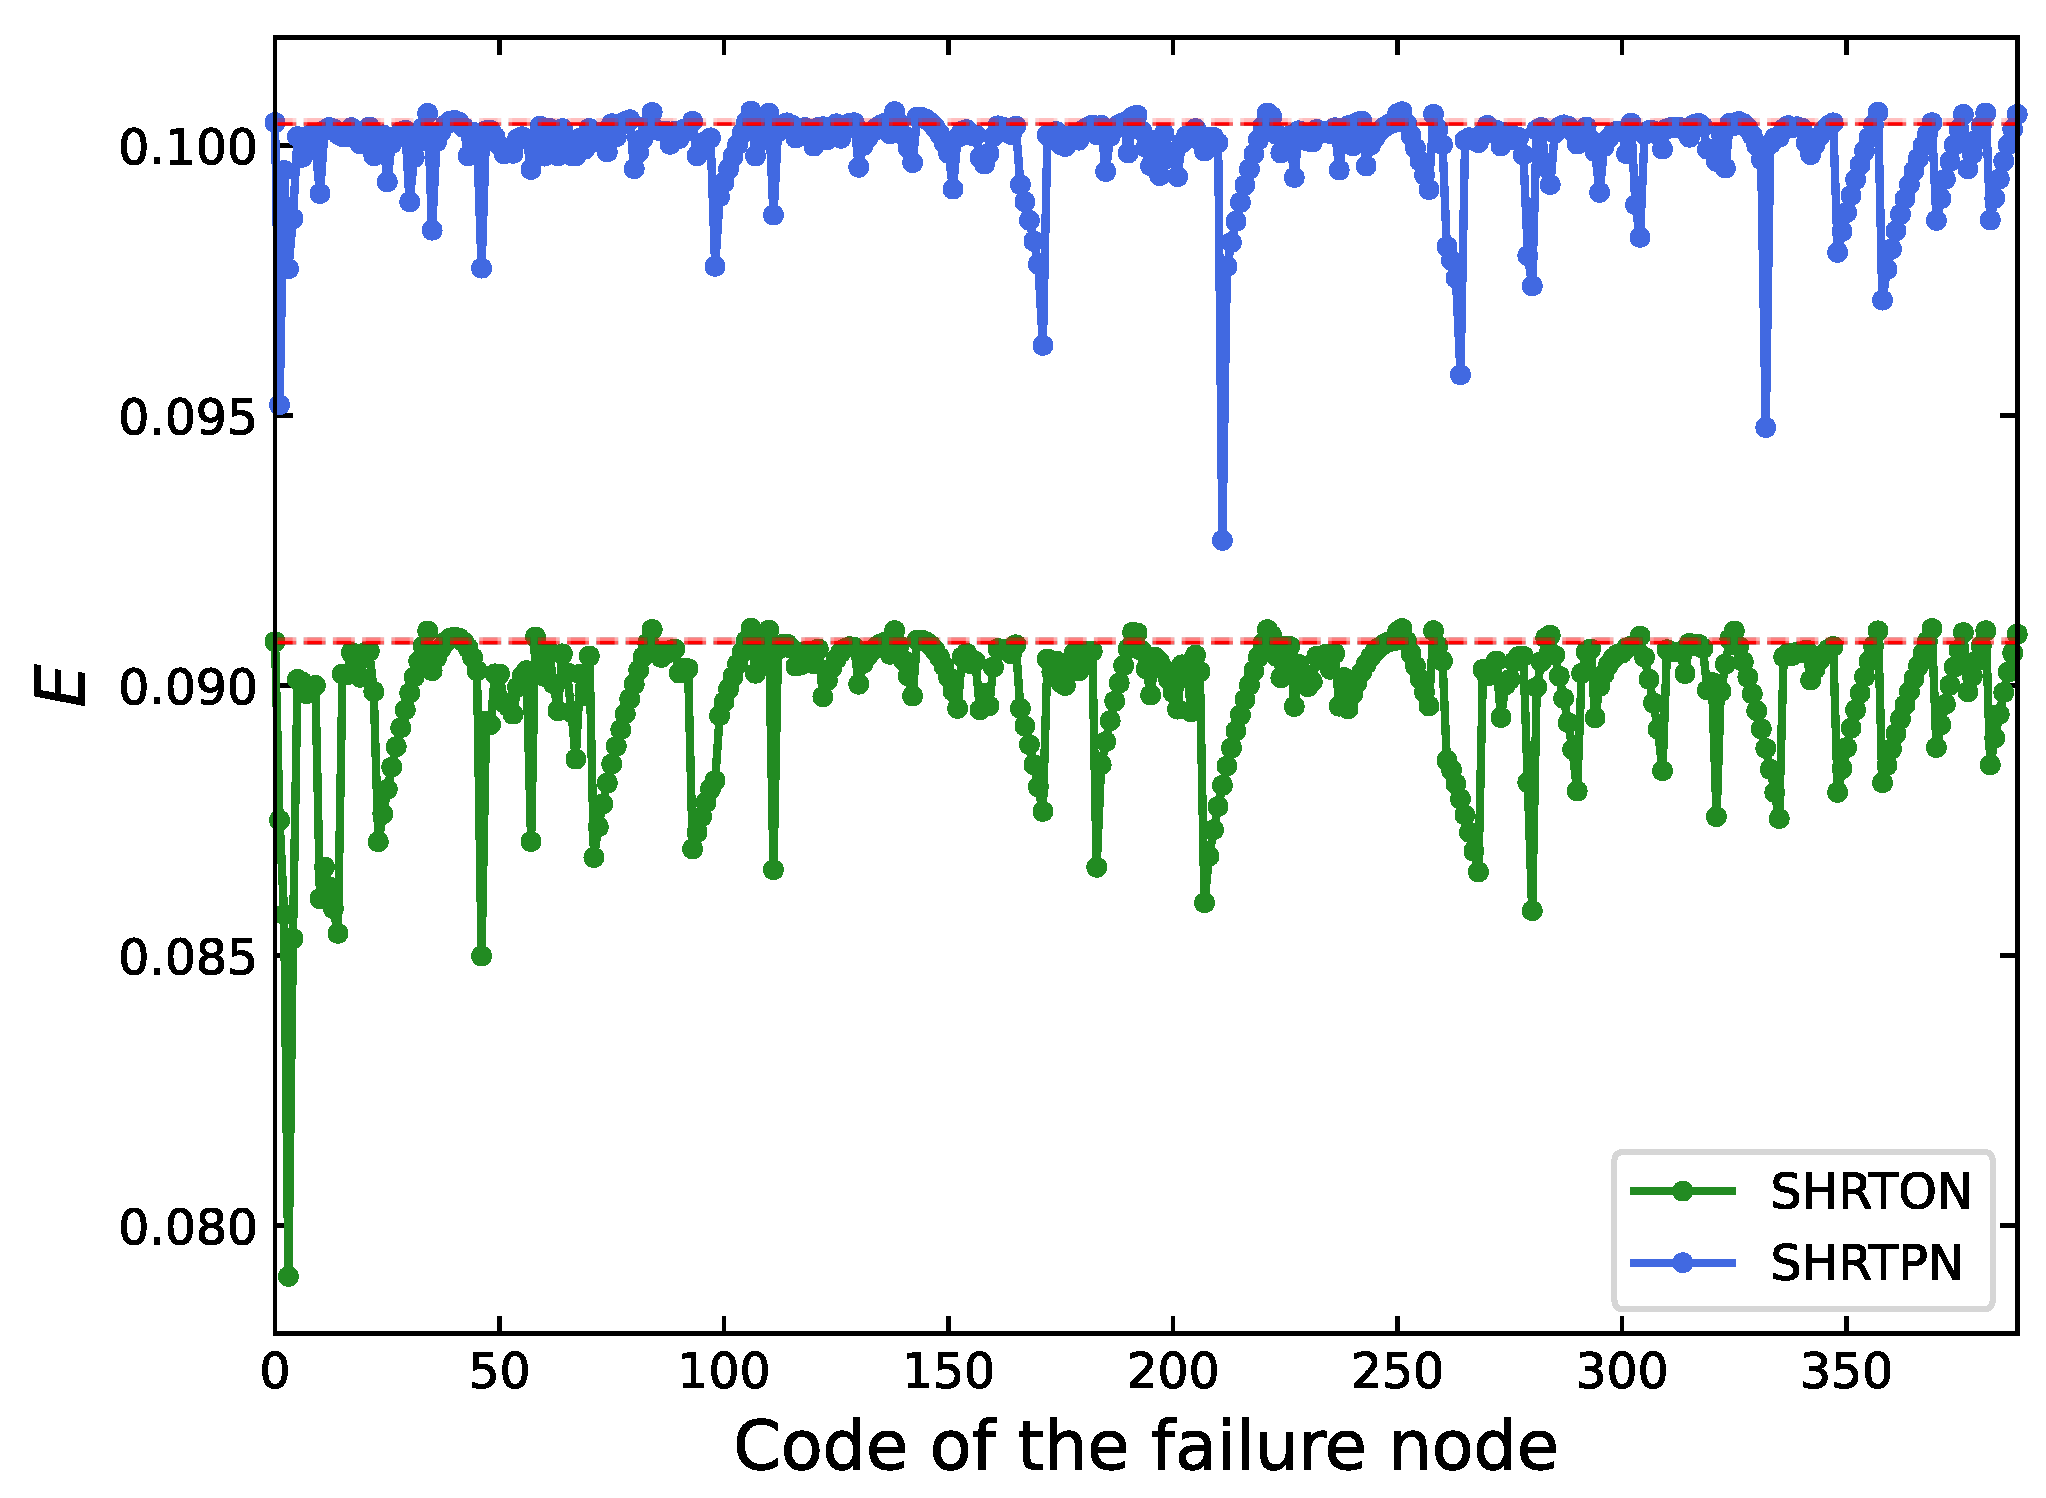
4.4. Identification of Critical Stations and Lines of SHRT Network

The simulation results show that the WS network, BA network, and SHRT network exhibit significant vulnerability under targeted attack strategies. This is because the failure of these nodes and edges leads to profound changes in the network topology, such as the shortest path length and connected cluster size. It also reflects the important role of critical nodes and edges in the network [50]. In addition, there are nodes and edges in the network that are not prominent in their degree or betweenness; however, the failure of a single node can have a large impact on the overall network performance [38]. Therefore, the impact of single node and edge failure on network efficiency is considered to identify critical stations and lines.

4.4.1. Identification of Critical Stations

The critical stations in the rail transit network should be the nodes that have a greater impact on the vulnerability of the network [51]. This study uses the decrease rate of network efficiency after node removal to indicate the importance of the node, and the single station traversal attack (SSTA) strategy is used to identify critical stations in SHRTON and SHRTPN [4]. First, attack the station that numbered one, calculate the network efficiency after the node removal, and restore the network to its initial state. Then, attack the next station that numbered two, and calculate the network efficiency. Attack one station at a time until all stations in the network have been traversed and the attack is over. The simulation results are shown in Figure 11.
Figure 11 shows that the removal of a single station mostly leads to a decrease in network efficiency. Nonetheless, there are some station removals that can make the network more integral and cause a small increase in network efficiency, such as the failure of an origin stop or a terminal station with a degree of one. Overall, the variable quantity of network efficiency caused by the failure of a single station in SHRTPN is smaller than in SHRTON, indicating that the vulnerability of SHRTPN is improved. Furthermore, there is a great difference in the decline of network efficiency caused by the failure of different stations. In SHRTON, the station that causes the largest decrease in network efficiency is the Shanghainan Railway Station, with a network efficiency decline rate of 12.94%; the second ranked station is Longyang Road Station, with a network efficiency decline rate of 6.41%. In SHRTPN, the largest decline in network efficiency is Qibao Station, with a network efficiency decline rate of 7.68%; the second ranked station is West Huajing Station, with a network efficiency decline rate of 5.61%. The information of the top five stations with the greatest impact on SHRTON and SHRTPN is identified, as shown in Table 3.
Comparing the data in Table 3, we find that the vulnerability of the SHRT network is not positively correlated with the degree or betweenness of stations. Shanghainan Railway Station does not have the largest degree or betweenness in SHRTON, but that its failure has the largest impact on the global network efficiency. Combined with the network topology, the Shanghainan Railway Station, Longyang Road Station, and Shanghaixi Railway Station have a great impact on SHRTON because these stations are in the key positions of the network. Once these stations fail, most of stations associated with them will be cut off from the network. In SHRTPN, the addition of new rail lines has changed the network topology, resulting in an overall network with better connectivity [37]. Critical stations that have a significant impact on network efficiency have also been changed. For example, the addition of the western extension of Line 1, Jiamin Line, and Airport Link Line in SHRTPN has reduced the impact of Shanghainan Railway Station on network efficiency from 12.94% to 2.67%. In addition, the greatest impact on network efficiency in SHRTPN is Qibao station, with a network efficiency decline rate of 7.68%. However, the degree and betweenness of Qibao Station in SHRTON are very small, and the network efficiency decline rate is only 2.93%. The importance of Qibao Station in SHRTPN has increased because it is a transfer station for Line 9, Jiamin Line, and Airport Link Line. The degree of Qibao Station is increased to six, and the betweenness jumps to the maximum value of 60,578, which has a great meaning for the secure operation of the network.

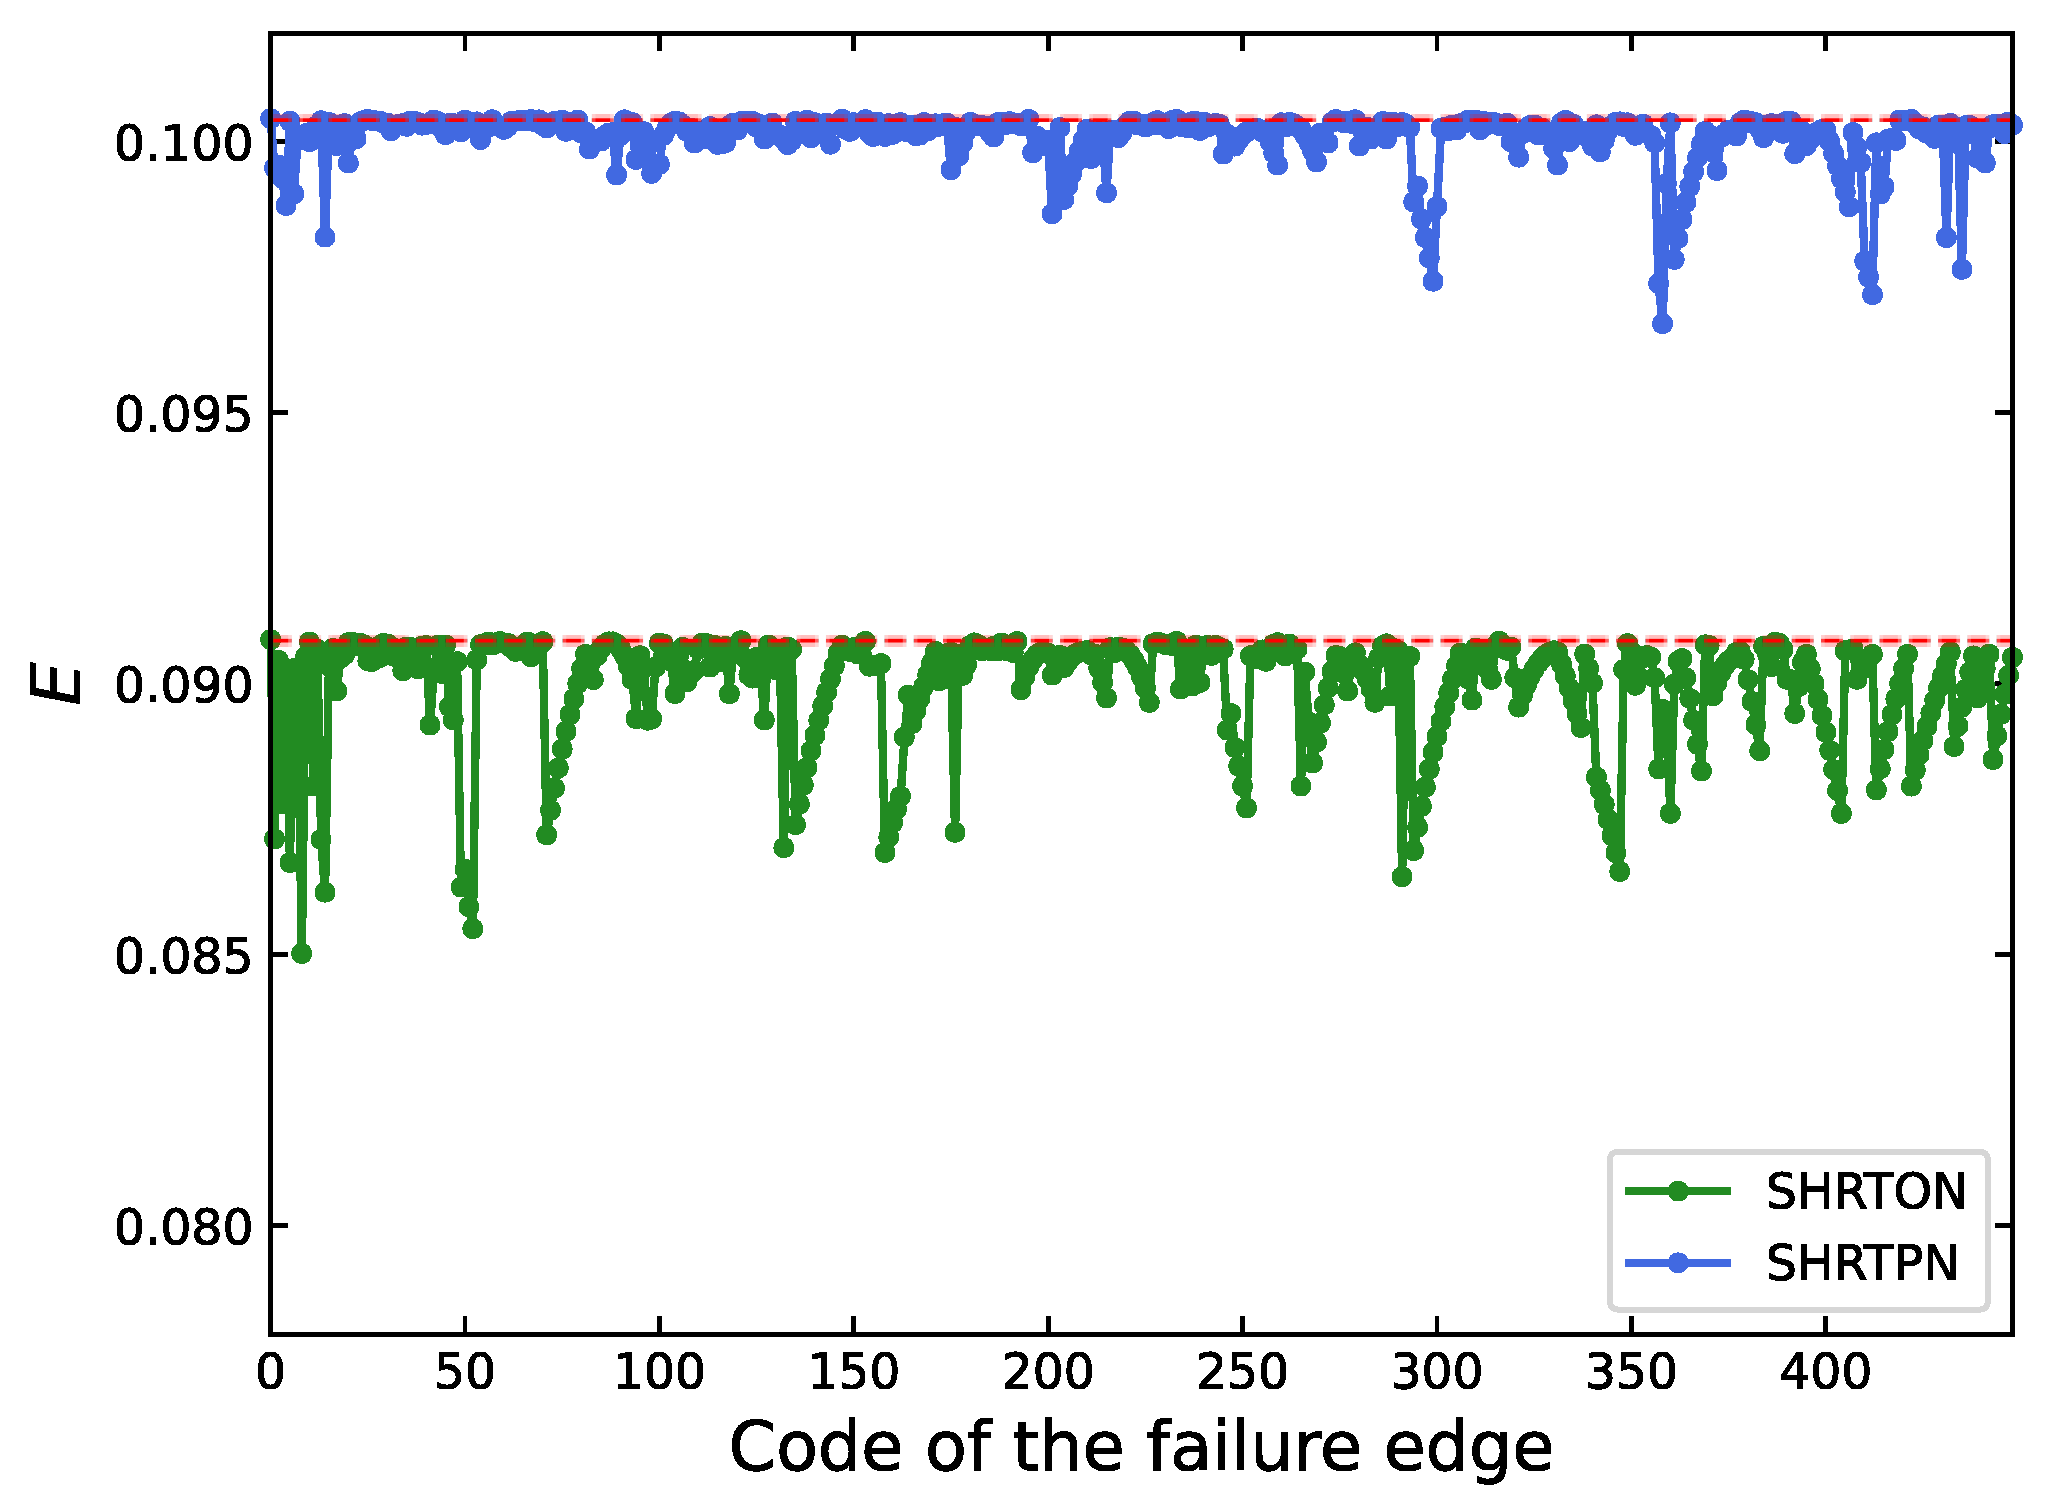
4.4.2. Identification of Critical Lines

Similar to the identification method of critical stations, we use the decrease rate of network efficiency to indicate the importance of the edge and attack the edges of SHRTON and SHRTPN by the single line traversal attack (SLTA) strategy. The simulation results are shown in Figure 12.
Comparing the Figure 11 with Figure 12, it is found that the magnitude of the change in network efficiency under line failure is significantly smaller than that under station failure. However, the network efficiency corresponding to the failure of lines are all below the standard, indicating that the failure of any line will lead to a decrease in network efficiency. As show in Figure 12, the network efficiency change magnitude of SHRTPN is smaller than that of SHRTON, indicating that the performance of SHRTPN is more stable under the SLTA strategy. Specifically, the rail line with the greatest impact on network efficiency in SHRTON is Shanghainan Railway Station to Jinjiang Park Station, with a network efficiency decline rate of 6.38%; the second ranked rail line is Lianhua Road Station to Jinjiang Park Station, with a network efficiency decline rate of 5.87%. In SHRTPN, the rail line that leads to the greatest decrease in network efficiency is Luoshan Road Station to Xiuyan Road Station, with a network efficiency decrease rate of 3.74%; the second ranked is Fengxiang Road Station to Jinqiu Road Station, with a network efficiency decrease rate of 3.21%. The five edges that have the greatest impact on network efficiency are identified, and their index information is shown in Table 4.
Table 4 illustrates that, among the five edges with the most obvious impact on network efficiency in SHRTON, except that of Shanghaixi Railway Station to Liziyuan Station, which still has a large impact on network efficiency in SHRTPN, the decrease rate of the network efficiency of the other four edges is reduced to less than 0.5%. Combined with the network topology, we find that these four edges are on Line 1 and are connected in sequence, and the additional Airport Link Line in SHRTPN reduces the impact of their failure on the network efficiency. Moreover, the location of critical edges in SHRTON is associated with the critical stations in Table 3. For example, both Shanghainan Railway Station and Jinjiang Park Station have a large impact on network efficiency, and the edge between the two stations also has a large impact on network efficiency. Combined with the network topology, we found that the failure of either Shanghainan Station or Jinjiang Park Station, or the edge between the two stations, will lead to the separation of more than twenty stations from the SHRTON, which is a serious detriment to network efficiency.

5. Discussion

5.1. Characteristics Analysis of SHRT Network

According to the topology parameters of SHRTON and SHRTPN, the structural properties of the two SHRT networks are analyzed by comparing the average shortest path length l S H R T and the clustering coefficient C S H R T of the random network. The results show that the two networks satisfy conditions l S H R T > ln ( n r a n d o m ) / ln ( k r a n d o m ) and C S H R T > k r a n d o m / n r a n d o m . The SHRTON and SHRTPN are both small-world networks [23]. Nevertheless, the differences in the specific topology parameters of the two SHRT networks lead to disparities in network performance. The small-world index [52] S M I for each of the two SHRT networks were calculated by using the formula S M I S H R T = ( C S H R T × l r a n d o m ) / ( C r a n d o m × l S H R T ) . Combined with the average shortest path length and the clustering coefficient in SHRTON and SHRTPN, we can deduce that the small-world index is 0.654 in SHRTON and 1.676 in SHRTPN. It can be concluded that SHRTPN has a higher connection strength, shorter average path length, and stronger connection density.
Furthermore, the stations with high centrality parameters in the SHRT network have changed with the network scale growth. As described in Section 4.2, most of the stations become more significant in SHRTPN. Nonetheless, there are some stations with reduced centrality, such as Xujiahui Station, People’s Square Station, and East Nanjing Road Station. This is because the addition of the Jiamin Line and Airport Link Line effectively reduces the dependence of the SHRT network on these central hubs. As a typical GURT network, the SHRT network is in the densification phase, where the network becomes denser through the addition of edges between already existing lines [9]. This is different from the general scale urban rail transit network that is still going through the exploration phase of expanding network coverage and regional accessibility.

5.2. Destruction Resistance of SHRT Network to Failures and Attacks

Considering the previous research findings, five attack strategies are designed to simulate the failure process of the SHRT networks under random failures and malicious attacks. The results show that both SHRTON and SHRTPN have strong robustness under the random attacks no matter if it against nodes or edges, and that there is a similar conclusion in Ref. [53]. However, both the SHRTON and SHRTPN exhibit significant vulnerability to targeted attacks. It should be noted that the deliberate attack strategy in our research is to attack one node with the greatest importance in the remaining network each time. This attack strategy is more devastating than the strategy of attacking one or more nodes at a time in the order of node importance in the initial network [31]. The simulations of the targeted attack against SHRT network according to the updated attack mode and the sequential attack mode are conducted, respectively. Taking the LBAS-N strategy as an example, the results are shown in Figure 13.
Figure 13 shows that the network efficiency and LCC ratio of the SHRT network under both attack modes are reduced to below 20% after the removal of approximately 10% of critical nodes. However, the network efficiency and LCC ratio of the SHRT network decrease significantly faster under the updated attack mode. It illustrates that each attack targets the most critical node in the remaining network triggers a more devastating network failure. The nodes with relatively large importance metrics play a key role in maintaining the network performance, which provides a complementary approach to the identification of critical nodes.
The protection of critical nodes and edges in GURT networks should be enhanced to avoid catastrophic failure of the network under deliberate attacks. The stations with significant degree and betweenness are key components of the SHRT network, such as Xujiahui Station, Century Avenue Station, and People’s Square Station. Meanwhile, the stations with relatively large degree and betweenness also have a significant impact on the network performance based on the simulation results, such as Middle Longhua Road Station, and South Xizang Road Station. This is because the degree and betweenness of these stations become significant due to network topology updates after each attack. Furthermore, it was found that stations connected radial lines and core areas usually result in serious network performance loss, such as Shanghainan Railway Station and Longyang Road Station. These critical nodes and edges must be carefully guarded.
The destruction resistance of SHRTPN is better than that of the SHRTON from the simulation results. As the network scale grows, there are more hub stations formed in the SHRT network. These stations show a wider distribution in the network so that a local disruption cannot cause catastrophic damage to the global structure. In addition, sufficient transfer stations and alternative routes are generated with the scale growth of the GURT network, which enhances the destruction resistance of the network.

5.3. Strategies to Improve the Destruction Resistance of GURT Network

To strengthen the ability for coping with disturbances and to guarantee the secure operation of the SHRT system, the strategies are proposed by considering the topological characteristics and vulnerability analysis results.
(1)
Strengthen the protection of critical stations and lines
From the simulation results of SHRTON, it is clear that the failure of critical stations and edges identified by using SSTA or SLTA strategies, such as the node of Shanghainan Railway Station, the rail line of Shanghainan Railway Station to Jinjiang Park Station, will immediately lead to a large network efficiency loss. The protection of these stations and edges should be promoted to assure the operational security of the SHRT system [50]. In terms of the hub stations in the SHRT network such as Century Avenue Station and Xujiahui Station, their individual failures do not lead to a sudden drop in LCC ratio; however, they have a more prominent impact on network efficiency. More seriously, once the number of hub station failures exceeds a certain threshold, the occurrence of the percolation phenomenon will lead to a catastrophic network failure [49]. Therefore, the critical stations and lines identified by those two scenarios should pay more attention to protection. In case of unexpected disturbances, the SHRT system can still maintain normal operation to ensure people’s travel safety.
(2)
Control the APL and network diameter
During the scale growth of urban rail transit network, the new added lines will drive the economic development of the surrounding areas [1]; however, they will have a negative impact on the network efficiency and may reduce the ability of destruction resistance. By comparing the network characteristic of SHRTON and SHRTPN, it is found that, with the increase in network scale, the APL and diameter of SHRT network decreases instead, and the network integrity has improved significantly, which plays a key role in the improvement of network vulnerability. For example, the Jiamin Line and Airport Link Line in SHRTPN have not only shortened the distance between the east and west of Shanghai, but also shortened the APL and diameter of the network. Furthermore, the impact of critical station and line failures on the network is effectively reduced, such as in Shanghainan Railway Station and the rail line of Shanghainan Railway Station to Jinjiang Park Station. Hence, a reasonable control of APL and network diameter during network scale growth can effectively improve the network integrity and play an important role in enhancing the destruction resistance of GURT network.
(3)
Increase the proportion of transfer station
Comparing the characteristics of SHRTON and SHRTPN, we find that SHRTPN has a larger average degree than SHRTON. The proportion of transfer stations and the average clustering coefficient both increase significantly. More importantly, the increase in transfer stations optimize the connectivity of the network [50], and the increase in the average clustering coefficient improves the fault tolerance of the network. When a station or a line is removed, there are alternative paths in the network to maintain normal operation, making SHRTPN show better destruction resistance than SHRTON. Thus, we should pay attention to increase the proportion of the transfer station and improve the network clustering coefficient in the process of network scale growth. When the stations or lines are under attack, there are more alternative routes to ensure the normal operation of the network. This will effectively improve the network destruction resistance. In particular, the improvement of the clustering coefficient for critical stations will reduce the negative impact of failures at critical stations on network performance. It is also an effective way to protect critical stations against targeted attacks.

6. Conclusions

This study explored the destruction resistance of the GURT network from the perspective of vulnerability. The Space L method is selected to construct the network topology model. Based on the complex network theory, five network characteristic indicators and two network vulnerability metrics are determined to analyze the network properties. Moreover, five attack strategies are submitted to simulate different network failure scenarios, and the SHRT system is used as an example to conduct empirical research. Some conclusions can be drawn:
Compared with SHRTON, the network efficiency of SHRTPN is improved by more than 10%, the average clustering coefficient is doubled, and the average degree is improved, while the APL and network diameter are reduced. The simulation results show that the vulnerability of SHRTPN is greatly improved than that of SHRTON. The SHRT network has the characteristic of a small-world network, and it is obviously vulnerable to the targeted attacks, though has good resistance to random attacks. The attack against the stations of the SHRT network leads to faster network failure than the attack against the edges. On the whole, the reliability of SHRTPN is better than that of SHRTON under different attack strategies.
In SHRTPN, there are 130 stations with a degree greater than and equal to three, which is nearly double in SHRTON, and the betweenness of the stations also increases with the growth of the degree. The network topology will be changed with network scale growth, thereby causing different impacts of stations and edges on network performance. The degree and betweenness of stations such as Qibao Station and Hongqiao Railway Station have increased significantly in SHRTPN, showing that these stations still occupy an important hub position in the future development. The Shanghainan Railway Station has the greatest impact on the network efficiency in SHRTPN; however, the negative impact of its failure can be reduced by adding new rail lines, which provides an effective approach to improve the destruction resistance of GURT networks.
As an important hub of the GURT network, the failures of stations with high degree and high betweenness will seriously affect the network performance. Once the number of failed stations exceeds a certain threshold, the occurrence of the percolation phenomenon will lead to a catastrophic network failure. For example, a failure of 3% high betweenness stations in SHRTON can almost lead to the paralysis of the network. In addition, the stations that are not prominent in terms of degree and betweenness have a large impact on network efficiency under the SSTA strategy. In SHRTON, the degree of Jinjiang Park Station is two; however, its failure can lead to a 5.95% decrease in network efficiency. As a result, the above two methods should be comprehensively considered during the identification of critical stations and lines.
In our future research, the weighted network model should be constructed by considering realistic data such as passenger flow and commuting time. The mechanism of cascading propagation in the GURT network should also be studied based on the redistribution of passenger flow after the station failure. Further study is needed to analyze the destruction resistance of GURT networks under specific scale growth patterns which are influenced by geological factors and business distribution in the city. To more comprehensively evaluate the robustness of different network designs, a global sensitivity analysis method that can reveal failure modes leading to severe negative impacts on the GURT network will be emphatically explored [54]. Another direction for further research is the restoration of GURT systems after a large-scale network collapse caused by uncertainty attacks. It is important to develop strategies to restore the network to normal or partial performance by integrating factors such as repair cost and repair time.

Author Contributions

The authors confirm their contributions to this study as follows: X.X. and C.X. conceived and designed the study. C.X. performed the simulation experiments and wrote the paper. C.X. and W.Z. reviewed and edited the manuscript. All authors have read and agreed to the published version of the manuscript.

Funding

This research received no external funding.

Institutional Review Board Statement

Not applicable.

Informed Consent Statement

Not applicable.

Data Availability Statement

Not applicable.

Conflicts of Interest

The authors declare no conflict of interest.

References

  1. Shi, J.G.; Wen, S.P.; Zhao, X.B.; Wu, G.D. Sustainable development of urban rail transit networks: A vulnerability perspective. Sustainability 2019, 11, 1335. [Google Scholar] [CrossRef] [Green Version]
  2. Cats, O.; Krishnakumari, P. Metropolitan rail network robustness. Phys. A 2020, 549, 124317. [Google Scholar] [CrossRef]
  3. Roth, C.; Kang, S.M.; Batty, M.; Barthelemy, M. A long-time limit for world subway networks. J. R. Soc. Interface 2012, 9, 2540–2550. [Google Scholar] [CrossRef] [PubMed]
  4. Zhang, D.M.; Du, F.; Huang, H.W.; Zhang, F.; Ayyub, B.M.; Beer, M. Resiliency assessment of urban rail transit networks: Shanghai metro as an example. Saf. Sci. 2018, 106, 230–243. [Google Scholar] [CrossRef]
  5. Saadat, Y.; Ayyub, B.M.; Zhang, Y.J.; Zhang, D.M.; Huang, H.W. Resilience-based strategies for topology enhancement and recovery of metrorail transit networks. ASCE-ASME J. Risk Uncertain. Eng. Syst. Part A-Civ. Eng. 2020, 6, 04020017. [Google Scholar] [CrossRef]
  6. Sun, L.S.; Huang, Y.C.; Chen, Y.Y.; Yao, L.Y. Vulnerability assessment of urban rail transit based on multi-static weighted method in Beijing, China. Transp. Res. Part A-Policy Pract. 2018, 108, 12–24. [Google Scholar] [CrossRef]
  7. 2022 New York City Subway Attack. Available online: https://en.wikipedia.org/wiki/2022_New_York_City_Subway_attack (accessed on 18 May 2022).
  8. Shanghai Metro Official Weibo. Available online: https://weibo.com/shmetro (accessed on 16 April 2020).
  9. Cats, O. Topological evolution of a metropolitan rail transport network: The case of Stockholm. J. Transp. Geogr. 2017, 62, 172–183. [Google Scholar] [CrossRef] [Green Version]
  10. Cats, O.; Vermeulen, A.; Warnier, M.; van Lint, H. Modelling growth principles of metropolitan public transport networks. J. Transp. Geogr. 2020, 82, 102567. [Google Scholar] [CrossRef]
  11. Lin, J.Y.; Ban, Y.F. Complex network topology of transportation systems. Transp. Rev. 2013, 33, 658–685. [Google Scholar] [CrossRef]
  12. Xie, F.; Levinson, D. Modeling the growth of transportation networks: A comprehensive review. Netw Spat. Econ. 2009, 9, 291–307. [Google Scholar] [CrossRef] [Green Version]
  13. Latora, V.; Marchiori, M. Is the Boston subway a small-world network. Phys. A 2002, 314, 109–113. [Google Scholar] [CrossRef] [Green Version]
  14. Zhang, J.H.; Xu, X.M.; Hong, L.; Wang, S.L.; Fei, Q. Networked analysis of the Shanghai subway network, in China. Phys. A 2011, 390, 4562–4570. [Google Scholar] [CrossRef]
  15. Chopra, S.S.; Dillon, T.; Bilec, M.M.; Khanna, V. A network-based framework for assessing infrastructure resilience: A case study of the London metro system. J. R. Soc. Interface 2016, 13, 20160113. [Google Scholar] [CrossRef] [PubMed] [Green Version]
  16. Seaton, K.A.; Hackett, L.M. Stations, trains and small-world networks. Phys. A 2004, 339, 635–644. [Google Scholar] [CrossRef] [Green Version]
  17. Berdica, K. An introduction to road vulnerability: What has been done, is done and should be done. Transp. Policy 2002, 9, 117–127. [Google Scholar] [CrossRef]
  18. Pagani, A.; Mosquera, G.; Alturki, A.; Johnson, S.; Jarvis, S.; Wilson, A.; Guo, W.S.; Varga, L. Resilience or robustness: Identifying topological vulnerabilities in rail networks. R. Soc. Open Sci. 2019, 6, 181301. [Google Scholar] [CrossRef] [Green Version]
  19. Zhou, J.; Coit, D.W.; Felder, F.A.; Wang, D. Resiliency-based restoration optimization for dependent network systems against cascading failures. Reliab. Eng. Syst. Saf. 2020, 207, 107383. [Google Scholar] [CrossRef]
  20. Barabasi, A.L.; Albert, R. Emergence of scaling in random networks. Science 1999, 286, 509–512. [Google Scholar] [CrossRef] [Green Version]
  21. Opsahl, T.; Agneessens, F.; Skvoretz, J. Node centrality in weighted networks: Generalizing degree and shortest paths. Soc. Netw. 2010, 32, 245–251. [Google Scholar] [CrossRef]
  22. Liu, J.; Lu, H.P.; Ma, H.; Liu, W.Z. Network vulnerability analysis of rail transit plans in Beijng-Tianjin-Hebei region considering connectivity reliability. Sustainability 2017, 9, 1479. [Google Scholar] [CrossRef] [Green Version]
  23. Watts, D.J.; Strogatz, S.H. Collective dynamics of ‘small-world’ networks. Nature 1998, 393, 440–442. [Google Scholar] [CrossRef] [PubMed]
  24. Erdos, P.; Rényi, A. On the evolution of random graphs. Publ. Math. Inst. Hung. Acad. Sci. 1960, 5, 17–60. [Google Scholar]
  25. Liu, S.; Yin, C.; Chen, D.; Lv, H.; Zhang, Q. Cascading failure in multiple critical infrastructure interdependent networks of syncretic railway system. IEEE Trans. Intell. Transp. Syst. 2021, 23, 5740–5753. [Google Scholar] [CrossRef]
  26. Crucitti, P.; Latora, V.; Marchiori, M. Model for cascading failures in complex networks. Phys. Rev. E 2004, 69, 045104. [Google Scholar] [CrossRef] [Green Version]
  27. Huang, X.; Gao, J.; Buldyrev, S.V.; Havlin, S.; Stanley, H.E. Robustness of interdependent networks under targeted attack. Phys. Rev. E 2011, 83, 065101. [Google Scholar] [CrossRef] [Green Version]
  28. Lopez, F.A.; Paez, A.; Carrasco, J.A.; Ruminot, N.A. Vulnerability of nodes under controlled network topology and flow autocorrelation conditions. J. Transp. Geogr. 2017, 59, 77–87. [Google Scholar] [CrossRef]
  29. Zhang, X.; Zhang, W.; Lee, P.T.W. Importance rankings of nodes in the China Railway Express network under the Belt and Road Initiative. Transp. Res. Part A-Policy Pract. 2020, 139, 134–147. [Google Scholar] [CrossRef]
  30. Meng, Y.Y.; Tian, X.L.; Li, Z.W.; Zhou, W.; Zhou, Z.J.; Zhong, M.H. Exploring node importance evolution of weighted complex networks in urban rail transit. Phys. A 2020, 558, 124925. [Google Scholar] [CrossRef]
  31. Yang, Y.H.; Liu, Y.X.; Zhou, M.X.; Li, F.X.; Sun, C. Robustness assessment of urban rail transit based on complex network theory: A case study of the Beijing subway. Saf. Sci. 2015, 79, 149–162. [Google Scholar] [CrossRef]
  32. Gauthier, P.; Furno, A.; El Faouzi, N.E. Road network resilience: How to identify critical links subject to day-to-day disruptions. Transp. Res. Rec. 2018, 2672, 54–65. [Google Scholar] [CrossRef] [Green Version]
  33. Dui, H.; Chen, S.; Wang, J. Failure-oriented maintenance analysis of nodes and edges in network systems. Reliab. Eng. Syst. Saf. 2021, 215, 107894. [Google Scholar] [CrossRef]
  34. Dunn, S.; Wilkinson, S.M. Increasing the resilience of air traffic networks using a network graph theory approach. Transp. Res. Part E-Logist. Transp. Rev. 2016, 90, 39–50. [Google Scholar] [CrossRef] [Green Version]
  35. Jenelius, E.; Cats, O. The value of new public transport links for network robustness and redundancy. Transp. A 2015, 11, 819–835. [Google Scholar] [CrossRef]
  36. Cao, X.B.; Hong, C.; Du, W.B.; Zhang, J. Improving the network robustness against cascading failures by adding links. Chaos Solitons Fractals 2013, 57, 35–40. [Google Scholar] [CrossRef]
  37. Ding, R.; Zhang, T.; Zhou, T.; Zhang, Y.L.; Li, T.F.; Wu, J.J. Topologic characteristics and sustainable growth of worldwide urban rail networks. Int. J. Mod. Phys. B 2021, 35, 2150151. [Google Scholar] [CrossRef]
  38. Derrible, S.; Kennedy, C. The complexity and robustness of metro networks. Phys. A 2010, 389, 3678–3691. [Google Scholar] [CrossRef]
  39. Ferber, C.; Holovatch, T.; Holovatch, Y.; Palchykov, V. Network harness: Metropolis public transport. Phys. A 2007, 380, 585–591. [Google Scholar] [CrossRef] [Green Version]
  40. Sienkiewicz, J.; Holyst, J.A. Statistical analysis of 22 public transport networks in Poland. Phys. Rev. E 2005, 72, 046127. [Google Scholar] [CrossRef] [PubMed] [Green Version]
  41. Sen, P.; Dasgupta, S.; Chatterjee, A.; Sreeram, P.A.; Mukherjee, G.; Manna, S.S. Small-world properties of the Indian railway network. Phys. Rev. E 2003, 67, 036106. [Google Scholar] [CrossRef] [PubMed] [Green Version]
  42. von Ferber, C.; Holovatch, T.; Holovatch, Y.; Palchykov, V. Public transport networks: Empirical analysis and modeling. Eur. Phys. J. B 2009, 68, 261–275. [Google Scholar] [CrossRef] [Green Version]
  43. Zhou, J.; Huang, N.; Coit, D.W.; Felder, F.A. Combined effects of load dynamics and dependence clusters on cascading failures in network systems. Reliab. Eng. Syst. Saf. 2018, 170, 116–126. [Google Scholar] [CrossRef]
  44. Wang, X.F.; Li, X.; Chen, G.R. Network Science: An Introduction; Higher Education Press: Beijing, China, 2012; pp. 139–161. [Google Scholar]
  45. Latora, V.; Marchiori, M. Efficient behavior of small-world networks. Phys. Rev. Lett. 2001, 87, 198701. [Google Scholar] [CrossRef] [PubMed] [Green Version]
  46. Newman, M.E. Mixing patterns in networks. Phys. Rev. E 2003, 67, 026126. [Google Scholar] [CrossRef] [Green Version]
  47. Shanghai. Available online: https://en.wikipedia.org/wiki/Shanghai (accessed on 30 March 2021).
  48. Shanghai Metro. Available online: https://en.wikipedia.org/wiki/Shanghai_Metro (accessed on 8 November 2021).
  49. Zeng, G.; Li, D.; Guo, S.; Gao, L.; Gao, Z.; Stanley, H.E.; Havlin, S. Switch between critical percolation modes in city traffic dynamics. Proc. Natl. Acad. Sci. USA 2019, 116, 23–28. [Google Scholar] [CrossRef] [PubMed] [Green Version]
  50. Du, Z.Y.; Tang, J.J.; Qi, Y.; Wang, Y.W.; Han, C.Y.; Yang, Y.F. Identifying critical nodes in metro network considering topological potential: A case study in Shenzhen city-China. Phys. A 2020, 539, 122926. [Google Scholar] [CrossRef]
  51. Xu, H.; Jiao, L.D.; Chen, S.L.; Deng, M.L.; Shen, N.X. An innovative approach to determining high-risk nodes in a complex urban rail transit station: A perspective of promoting urban sustainability. Sustainability 2018, 10, 2456. [Google Scholar] [CrossRef] [Green Version]
  52. Humphries, M.D.; Gurney, K. Network ‘Small-World-Ness’: A quantitative method for determining canonical network equivalence. PLoS ONE 2008, 3, e0002051. [Google Scholar] [CrossRef]
  53. Sun, D.; Zhao, Y.H.; Lu, Q.C. Vulnerability analysis of urban rail transit networks: A case study of Shanghai, China. Sustainability 2015, 7, 6919–6936. [Google Scholar] [CrossRef] [Green Version]
  54. Lempert, R.J.; Groves, D.G.; Popper, S.W.; Bankes, S.C. A general, analytic method for generating robust strategies and narrative scenarios. Manag. Sci. 2006, 52, 514–528. [Google Scholar] [CrossRef]
Figure 1. Flow chart of the network node attack simulation process.
Sustainability 14 07210 g001
Figure 2. Schematic diagram of SHRT network. (Relevant data were acquired from the Shanghai Shentong Metro official website. http://www.shmetro.com/).
Sustainability 14 07210 g002
Figure 3. Shanghai rail transit network topology models: (a) the topology model of SHRTON with 388 nodes and 448 edges; (b) the topology model of SHRTPN with 490 nodes and 614 edges.
Sustainability 14 07210 g003
Figure 4. Node degree distribution of SHRTON and SHRTPN.
Sustainability 14 07210 g004
Figure 5. Characteristic index value of the selected nodes in two Shanghai rail transit networks: (a) Degree of the 388 stations in two Shanghai rail transit networks. (b) Betweenness of the 388 stations in two Shanghai rail transit networks.
Sustainability 14 07210 g005
Figure 6. Vulnerability of the networks under LDAS-N: (a) Network efficiency of four networks under LDAS-N. (b) LCC ratio of four networks under LDAS-N. The horizontal axis in the figure represents the proportion of failed nodes, and the vertical axis represents the network efficiency or the LCC ratio. The initial network efficiency and LCC ratio are both transformed to one.
Sustainability 14 07210 g006
Figure 7. Vulnerability of SHRTON under different attack strategies: (a) Network efficiency of SHRTON under different attack strategies. (b) LCC ratio of SHRTON under different attack strategies. The result of the random attack is the average value of 20 random attacks. The horizontal axis in the figure represents the number of attacks, and the first 388 attacks against nodes and edges are shown in the figure. The vertical axis represents the network efficiency or the LCC ratio.
Sustainability 14 07210 g007
Figure 8. Vulnerability of two SHRT networks under LDAS-N: (a) Network efficiency of two SHRT networks under LDAS-N. (b) LCC ratio of two SHRT networks under LDAS-N.
Sustainability 14 07210 g008
Figure 9. Vulnerability of two SHRT networks under LBAS-N: (a) Network efficiency of two SHRT networks under LBAS-N. (b) LCC ratio of two SHRT networks under LBAS-N.
Sustainability 14 07210 g009
Figure 10. Vulnerability of two SHRT networks under LBAS-E: (a) Network efficiency of two SHRT networks under LBAS-E. (b) LCC ratio of two SHRT networks under LBAS-E. The figure shows the results of the first 100 attacks. The horizontal axis indicates the number of failed edges, and the vertical axis indicates the network efficiency or the LCC ratio.
Sustainability 14 07210 g010
Figure 11. Efficiency changes of station failure in two SHRT networks. The horizontal axis in the figure represents the code of failure node, and the vertical axis represents the network efficiency. The red dashed line in the figure indicates the initial network efficiency value.
Sustainability 14 07210 g011
Figure 12. Efficiency changes of line failure in two SHRT networks. The horizontal axis in the figure represents the code of failure edge, and the vertical axis represents the network efficiency. The red dashed line in the figure indicates the initial network efficiency value.
Sustainability 14 07210 g012
Figure 13. Vulnerability of SHRT network based on different attack modes under LBAS-N: (a) Network efficiency of SHRT network based on different attack modes under LBAS-N. (b) LCC ratio of SHRT network based on different attack modes under LBAS-N. The figure shows the results of the first 40 attacks.
Sustainability 14 07210 g013
Table 1. Basic parameters of SHRTON and SHRTPN.
Network ParametersSHRTONSHRTPN
Nodes388490
Edges448614
Average degree2.3092.506
Average betweenness28883083
Average path length15.92613.608
Network diameter4441
Average clustering coefficient0.0080.017
Average closeness centrality0.0670.077
Network connectivity0.3870.419
Network efficiency0.09080.1004
Table 2. Detailed parameters of the selected stations in two Shanghai rail transit networks.
CodeStationSHRTONSHRTPN
DegreeBetweennessDegree’Betweenness’
M1Hongqiao Railway Station34874622,723
M2Shanghai Railway Station413,812412,461
M3Shanghainan Railway Station614,39666817
M4Shanghaixi Railway Station410,420610,680
M5People’s Square Station6904166967
M6Jing’an Temple Station410,564611,392
M7Xujiahui Station616,17469135
M8East Nanjing Road Station4787744690
M10Century Avenue Station815,073815,820
M211Qibao Station23770630,578
Note: Degree’ means the degree of stations in SHRTPN. Betweenness’ means the betweenness of stations in SHRTPN.
Table 3. Indicator values after the failure of critical station in two SHRT networks.
No.CodeStationSHRTONSHRTPN
kBE (%)Er (%)k′B′E′ (%)Er′ (%)
1M3Shanghainan Railway Station614,3967.90612.94668179.7722.67
2M46Longyang Road Station688878.4996.41818,5069.7732.66
3M4Shanghaixi Railway Station410,4208.5316.06610,6809.8651.74
4M14Jinjiang Park Station276868.5415.952212510.0210.19
5M2Shanghai Railway Station413,8118.5765.56412,4619.9540.86
1M211Qibao Station237708.8152.93630,5789.2687.68
2M332West Huajing Station226608.8832.18627,7969.4775.61
3M1Hongqiao Railway Station348748.7503.64622,7239.5195.18
4M264Chenxiang Highway Station248628.7903.20411,4729.5754.63
5M171Lingzhao Xincun Station237708.7673.45312,4069.6294.09
Note: The upper part of the table is sorted based on SHRTON, while the lower part of the table is sorted based on SHRTPN. k means the degree of stations. B means the betweenness of stations. E means the network efficiency after the station failure. Er means the efficiency decline rate after the station failure.
Table 4. Indicator values after the failure of critical line in two SHRT networks.
No.CodeRail LinesSHRTONSHRTPN
BE (%)Er (%)B′E′ (%)Er′ (%)
1M3, M14Shanghainan Railway Station,
Jinjiang Park Station
80528.5026.38255410.0060.34
2M13, M14Lianhua Road Station,
Jinjiang Park Station
77078.5485.87218410.0360.04
3M12, M13Waihuanlu Station,
Lianhua Road Station
73608.5885.43200410.0300.10
4M4, M268Shanghaixi Railway Station,
Liziyuan Station
66608.6155.1361389.8242.15
5M11, M12Xinzhuang Station,
Waihuanlu Station
70118.6245.03202410.0180.22
1M280, M281Luoshan Road Station,
Xiuyan Road Station
11558.9521.4214399.6643.74
2M346, M347Fengxiang Road Station,
Jinqiu Road Station
22119.0530.3028929.7173.21
3M279, M370Yuqiao Station,
Kangqiao Station
26678.8422.6333819.7383.01
4M213, M214Jiuting Station,
Sijing Station
30408.8732.2938569.7422.96
5M345, M346Nanda Road Station,
Fengxiang Road Station
25699.0470.3733569.7502.88
Note: The upper part of the table is sorted based on SHRTON, while the lower part of the table is sorted based on SHRTPN. B means the betweenness of stations. E means the network efficiency after the station failure. Er means the efficiency decline rate after the station failure.
Publisher’s Note: MDPI stays neutral with regard to jurisdictional claims in published maps and institutional affiliations.

