Article

Stability of the Anaerobic Digestion Process during Switch from Parallel to Serial Operation—A Microbiome Study

1
Department of Biotechnology & Food Engineering, MCI—The Entrepreneurial School, Maximilianstraße 2, 6020 Innsbruck, Austria
2
Department of Microbiology, University of Innsbruck, Technikerstraße 25d, 6020 Innsbruck, Austria
3
Department of Waste Treatment and Resource Management, University of Innsbruck, Technikerstraße 13a, 6020 Innsbruck, Austria
*
Authors to whom correspondence should be addressed.
Sustainability 2022, 14(12), 7161; https://doi.org/10.3390/su14127161
Submission received: 16 May 2022 / Revised: 2 June 2022 / Accepted: 8 June 2022 / Published: 10 June 2022
(This article belongs to the Section Sustainable Water Management)

Abstract

:
Anaerobic digestion is a common procedure of treating sewage sludge at wastewater treatment plants. However, plants differ in terms of the number of reactors and, in case of several reactors, their operation mode. To confirm the flexibility of well adapted, full-scale anaerobic digestion plants, we monitored the physicochemical process conditions of two continuously stirred tank reactors over one hydraulic retention time before and after the operation mode was switched from parallel to serial operation. To investigate changes in the involved microbiota, we applied Illumina amplicon sequencing. The rapid change between operation modes did not affect the process performance. In both parallel and serial operation mode, we detected a highly diverse microbial community, in which Bacteroidetes, Firmicutes, Proteobacteria and Claocimonetes were high in relative abundance. While a prominent core microbiome was maintained in both configurations, changes in the involved microbiota were evident at a lower taxonomical level comparing both reactors and operation modes. The most prominent methanogenic Euryarchaeota detected were Methanosaeta and cand. Methanofastidiosum. Volatile fatty acids were degraded immediately in both reactors, suggesting that the second reactor could be used to produce methane on demand, by inserting easily degradable substrates.

1. Introduction

Wastewater treatment plants have a long tradition of treating sewage sludge anaerobically to reduce the amount of sludge and to produce biogas as an energy carrier [1,2]. The anaerobic digestion (AD) process, carried out by a diverse consortium of bacteria and archaea, can be divided into four main phases: In the first phase, hydrolyzing and fermenting microorganisms are degrading the incoming material, including polymers like lipids, polysaccharides and proteins, into more easily degradable monomers such as fatty acids, sugars and amino acids by the excretion of hydrolytic enzymes [3,4,5]. During acidogenesis, these components are broken down to volatile fatty acids (VFAs), alcohols, H2 and CO2 [3,4]. In a third phase, acetogenic bacteria convert the fatty acids and alcohols into acetate, H2 and CO2. In the final phase, methanogenic archaea produce methane (CH4) from these intermediates under strictly anoxic conditions [6]. While the microbes carry out the AD process, ultimately producing biogas including the desired CH4, both the process kinetics and microbial community are also determined by physical and chemical conditions. For example, theoretical models were able to accurately predict CH4 production and biogas quality, and even suggested the main CH4 producing organism for aceticlastic methanogenesis [7]. Moreover, the nutrient composition has been shown to affect the AD process, thereby allowing for targeted optimization of its performance [8].
Changing the operational conditions from parallel to serial operation is an interesting option to increase the biogas production in an already existing infrastructure. During parallel operation, reactors are operated independently from each other, whereas during serial operation, reactors are connected in a cascade (Figure 1).
Therefore, reactor 1 (R1) receives all fresh materials and reactor 2 (R2) obtains predigested material from R1 and has therefore a much lower intake of organic material in serial operation. Kaparaju et al. [9], Boe and Angelidaki [10] and Li et al. [11] showed that in bench scale reactors, serial operation resulted in 17%, 11% and 15% higher biogas productivity, respectively, compared to parallel operation. They also found that process stability of the serial reactors was as robust as that of the single reactor. Further advantages of serial operation are increased mineralization of organic matter and better effluent quality in terms of VFA concentration compared to a single reactor [9,10,12]. The second reactor in serial configuration can utilize excessive VFAs produced from overloading in the first reactor, thus improving the effluent quality [10]. In addition, substrate, which would pass without being utilized in a single digester, can be metabolized to CH4 in the second reactor through serial operation [13]. Hence, the loss of unmetabolized material due to short circuits can be reduced in a serial process [14]. Microbial community observation by fluorescence in situ hybridization showed that the syntrophic relationship between bacteria and methanogens was not disrupted by operational switch [9]. Intermediate inhibition was reduced and the process remained stable [10]. Despite these promising results, to our knowledge no information on full-scale reactors is available.
The aim of this study was to assess the functional stability of the full-scale process during a sudden switch from parallel to serial operation. In particular, we studied (i) the ability of the reactors’ microbiome to meet this operational changeover, i.e., the effect of switching on the physicochemical properties of the process, and (ii) the change in microbiome composition following the switch. The physicochemical process conditions were monitored using standard equipment and protocols; the microbiome was studied using 16S rRNA based amplicon sequencing, to reveal both the bacterial and archaeal diversity and composition. Based on current knowledge, we hypothesized (i) the process to be stable in the critical first hydraulic retention time (HRT) of operational switch, and (ii) a high microbial diversity, a stable core community, and moderate compositional effects on the overall microbiome composition.

2. Materials and Methods

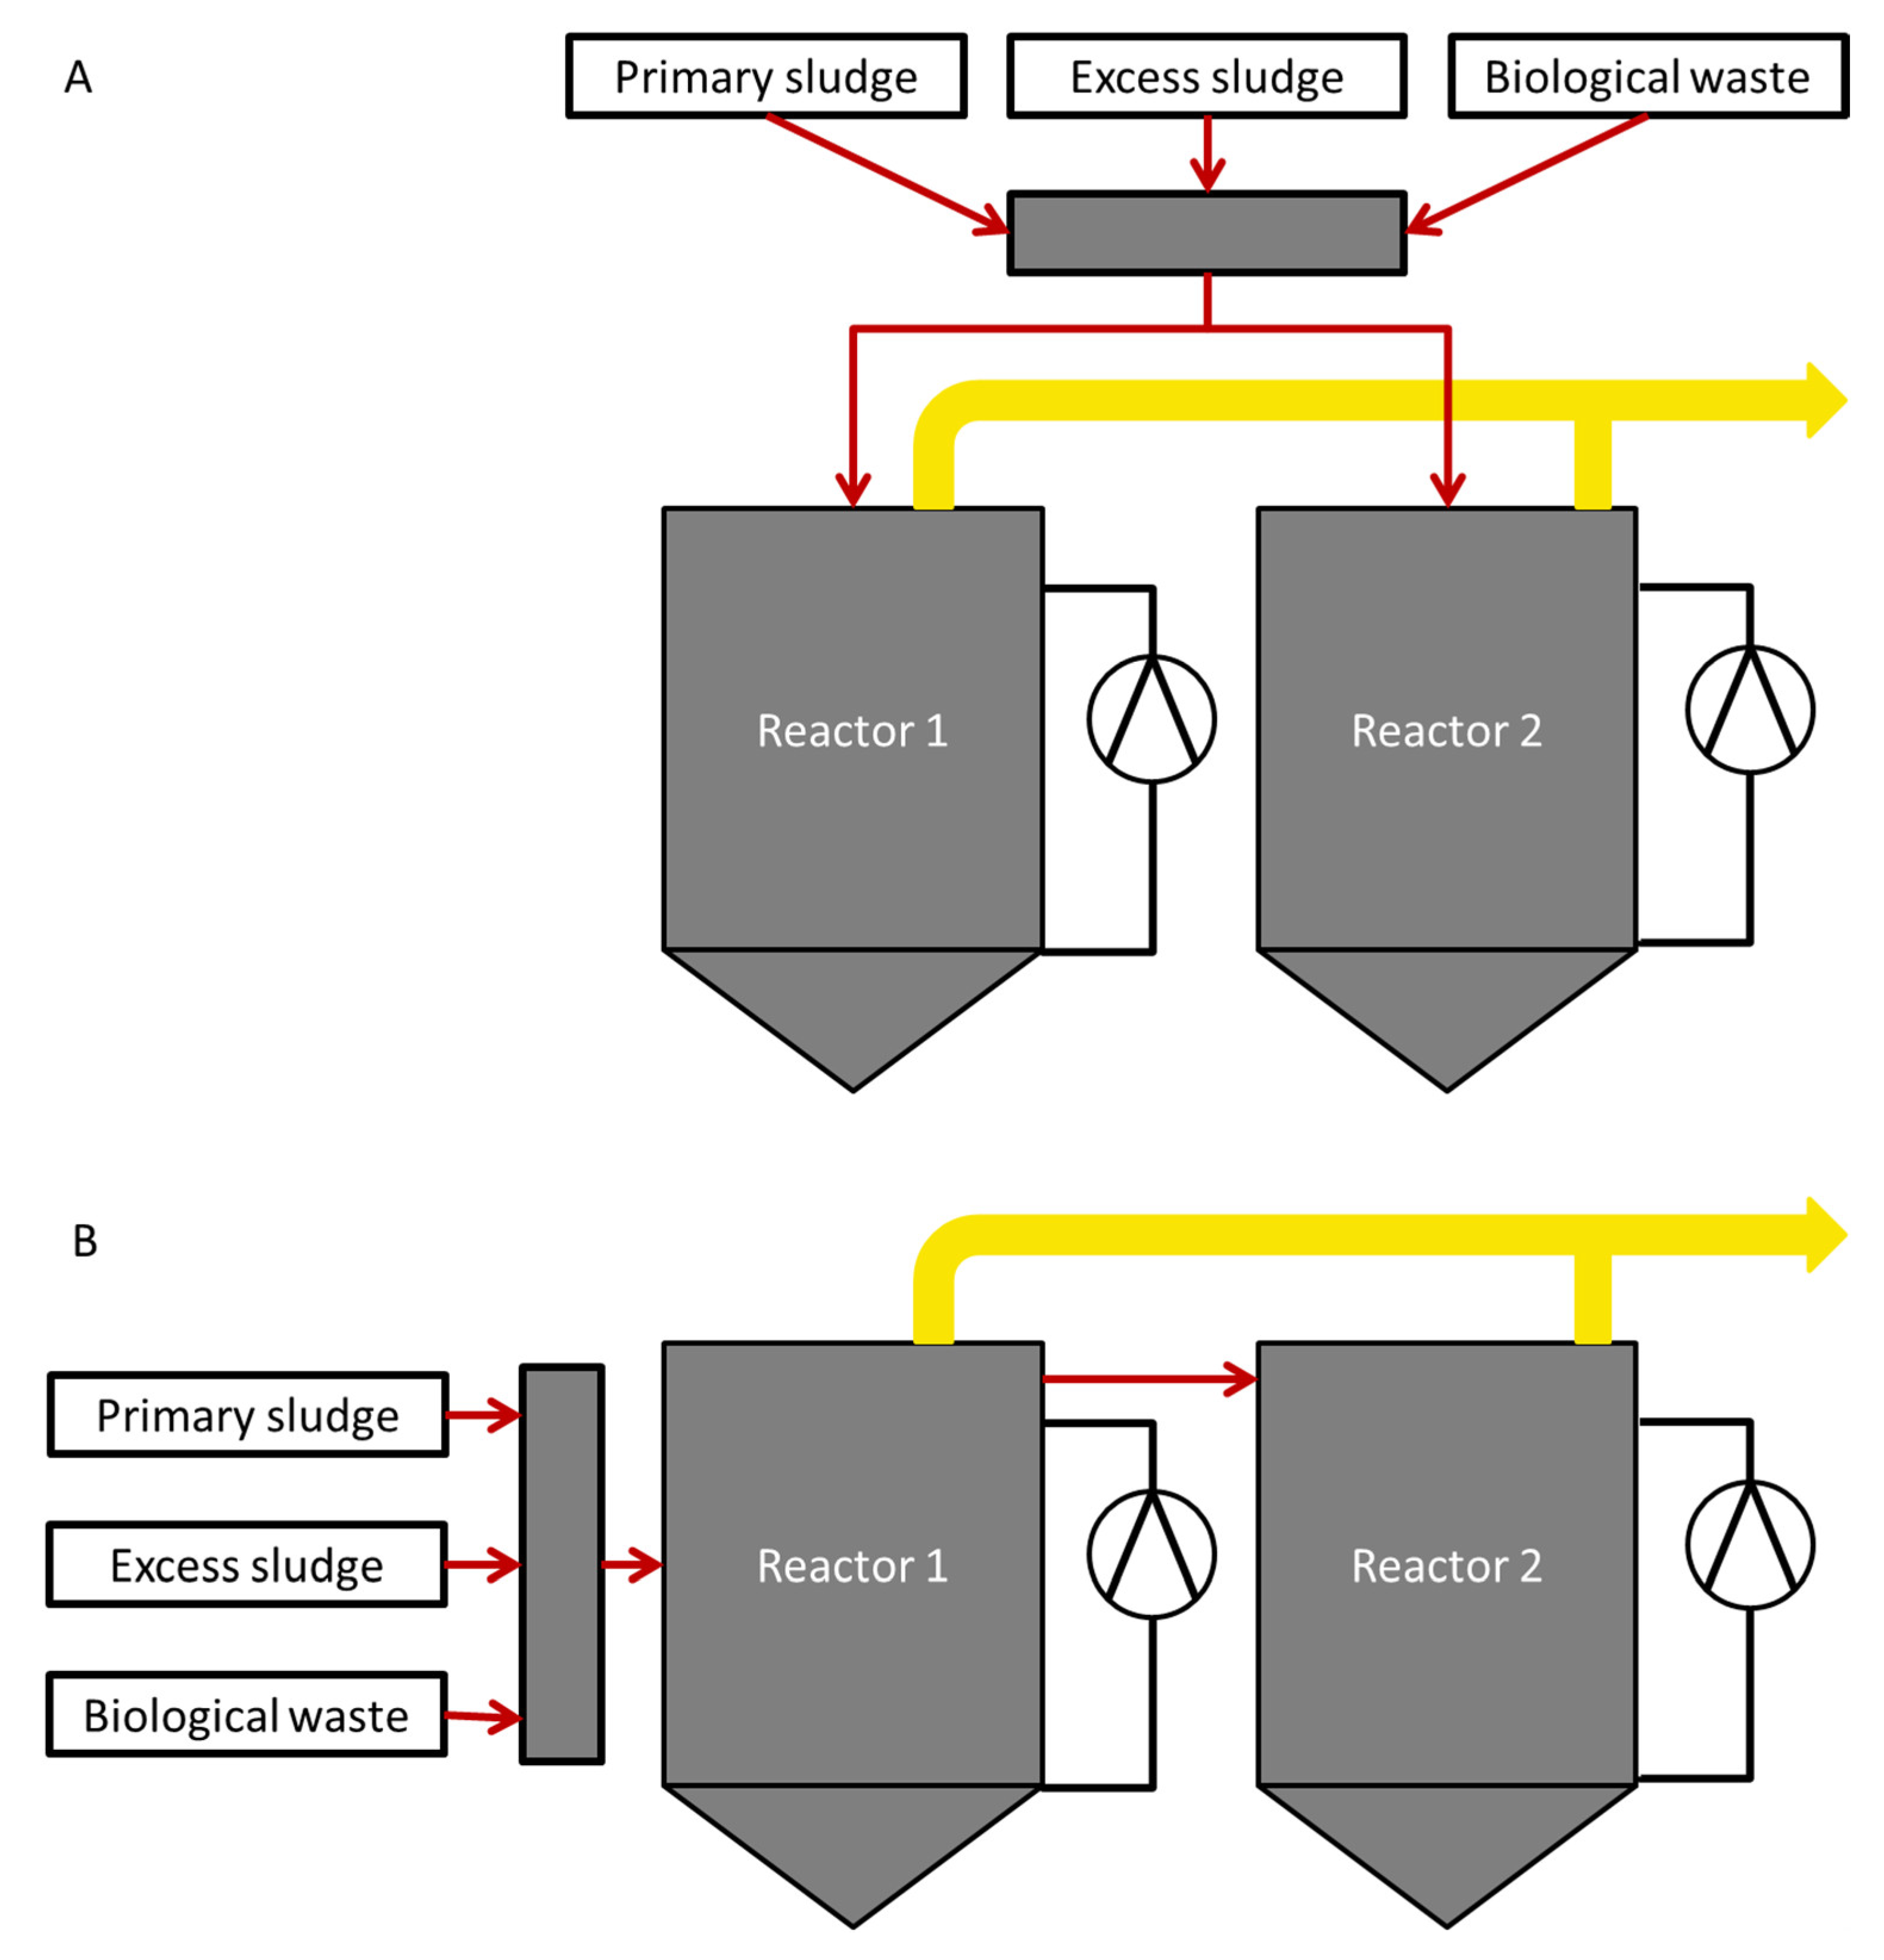
2.1. Reactor Setup and Operation

Two conventional continuously stirred tank reactors with working volumes of 3929 m3 in R1 and 4150 m3 in R2 were closely monitored for one HRT before and one HRT after changing the operation mode from parallel to serial without any transition period. Before the start of the experiment, the reactor conditions were stable and comparable to the long-applied, stable reactor conditions. The feed consisted of excess sludge (45.7% ± 0.04% organic dry matter), primary sludge (40.3% ± 0.03% organic dry matter) and biological waste (14.0% ± 0.03% organic dry matter). Reactors were fed every other day in a rotating manner during parallel operation. Parallel reactors were operated with HRTs of 20.4 (±6.0) d and 21.6 (±6.3) d, respectively. The corresponding HRT in serial operation was 9.8 (±1.9) d in R1 and 10.3 (±2.1) d in R2. In the course of the serial operation, organic loading rates (OLRs) were doubled in R1 (1.9 ± 0.5 kg organic dry solids m−3 d−1) and discontinued in R2.

2.2. Sampling and Physicochemical Analysis

During parallel operation, pH, temperature, dry matter, organic dry matter, ammonium nitrogen (NH4-N), CH4 and VFA were measured once a week to characterize the initial operation. After process change to serial operation, between 1 December and 14 December, measurement frequency was increased to five times a week to capture physicochemical changes as accurately as possible, followed by a final measurement on 22 December. All physicochemical properties, except VFAs, were measured directly at the facility every working day from a homogenized, representative sample. NH4-N was measured with LCK 303 ammonium cuvette tests (Hach, Düsseldorf, Germany), dry matter and organic dry matter were determined according to DIN 38414 part 1 and part 2, respectively. Complementing VFA measurements, determination of volatile organic acids was executed according to DIN 38414-19. pH was measured online with a pH 161 T pH-meter (WTW, Weilheim, Germany), conductivity with an inoLab® conductivity meter (Xylem Analytics, Weilheim, Germany) and temperature with an SITRANS TW online sensor (Siemens, Munich, Germany). CH4 and CO2 were determined using an online AwiFLEX Cool+ process analysis system (AWITE, Langenbach, Germany) and biogas was observed using a SITRANS P transmitter for differential pressure and flow (Siemens, Munich, Germany). VFAs were analyzed using HPLC, as described in Wagner et al. [15]. For molecular analysis, 12 mL samples were taken from a representative, larger sample simultaneously with measuring physicochemical properties. Samples were kept at −20 °C until further analysis.

2.3. DNA Extraction

Triplicate samples were immediately frozen at −20 °C, and DNA was extracted immediately after thawing using a NucleoSpin®Soil extraction kit (Macherey-Nagel, Düren, Germany) including the following changes: 1 mL of the sample material was transferred to a Nucleospin®Bead Tube and was centrifuged for 2 min at 11,000× g. The flow-through was discarded and Buffer SL1 and Enhancer were added to the pellet. Steps 1–4 were repeated 3 times with the same sample in the Nucleospin®Bead Tube in order to increase the amount of DNA extracted from each sample. For sample lysis, the extraction reactions including beads were shaken in a horizontal shaker for 1 min. For quality check, 2 µL of extracts were loaded onto a 1% agarose gel and DNA amounts in the extracts were measured using Nanodrop 2000c (Peqlab Biotechnologie GmbH, Erlangen, Germany). For the samples of 18 and 30 November all three replicates were sequenced, showing similar community patterns. For the further samples, community similarity was checked by PCR-DGGE [16] (data not shown). As there was no difference among triplicates, we further used only one randomly chosen sample of the triplicates for Illumina sequencing.

2.4. Community Profiling

The microbiota was profiled using the Illumina 2 × 250 bp system (Microsynth, Balgach, Switzerland). Amplicon sequencing of the 16S rRNA V4 region was conducted on an Illumina MiSeq Sequencer, using primers 515f (GTG CCA GCM GCC GCG GTA A) and 806r (GGA CTA CHV GGG TWT CTA AT). Raw sequences were deposited in the NCBI Sequence Read Archive (SRA) under the BioProject number PRJNA786779. Processing of the raw reads to amplicon sequence variants (asvs) was performed using dada2 v 1.16 [17] following the general instructions. Briefly, data were filtered by quality phred score. Sequences with ambiguous bases were removed. Sequencing error profiles were predicted using randomly selected forward and reverse sequence reads from several samples of the dataset. Sequence reads were filtered according to the predicted error profiles, resulting in unique asvs. Chimeric asvs were removed using implemented RemoveBimeraDenovo command. The taxonomy of the asvs was assigned using SILVA v132 as a reference. Eventually an asv frequency table was generated giving the number of times an asv was observed in a sample. This final matrix had a dimension of 7316 asvs and 30 samples.

2.5. Statistical Analyses

Differences between both reactors and between parallel and serial operation were tested based on both physicochemical variables and microbial community profiles. In a univariate manner, physicochemical data, i.e., pH, temperature, NH4-N, (organic) dry matter, CH4 yield and concentration, and VFA concentrations, were tested for normal distribution and homogeneity of variance using Shapiro-Wilk normality test and Levene’s test. Physicochemical conditions between parallel and serial operation and between R1 and R2 during serial operation were tested using analysis of variance (ANOVA) for normally distributed data and Kruskal test for not normally distributed variables. For the microbiome data, the Adonis function of the vegan package was used to determine the effect of operation mode and reactors. In order to compress the multidimensional character of amplicon sequence variants, principal coordinate analysis (PCoA) was performed to visualize the Bray Curtis dissimilarities between samples. The relation between the microbial composition and physicochemical properties was calculated using envfit. Analyses were performed in R v.4.0.2 [18] using packages vegan [19], labdsv and car. In order to identify organisms with selective occurrence within reactors or operation modes, Venn diagrams were drawn using the deepvenn.com tool [20] and asvs were categorized according to Venn sets. An asv was defined present in a sample group (reactors R1 and R2 under either parallel or serial operation, respectively), if its abundance exceeded six reads in at least six time points. These conditions are rather strict, but provide valuable information as they are most distinctive. Other, less stringent filtering conditions were tested, without any substantial changes in the results (Supplementary Table S1; Supplementary Figure S1).

3. Results and Discussion

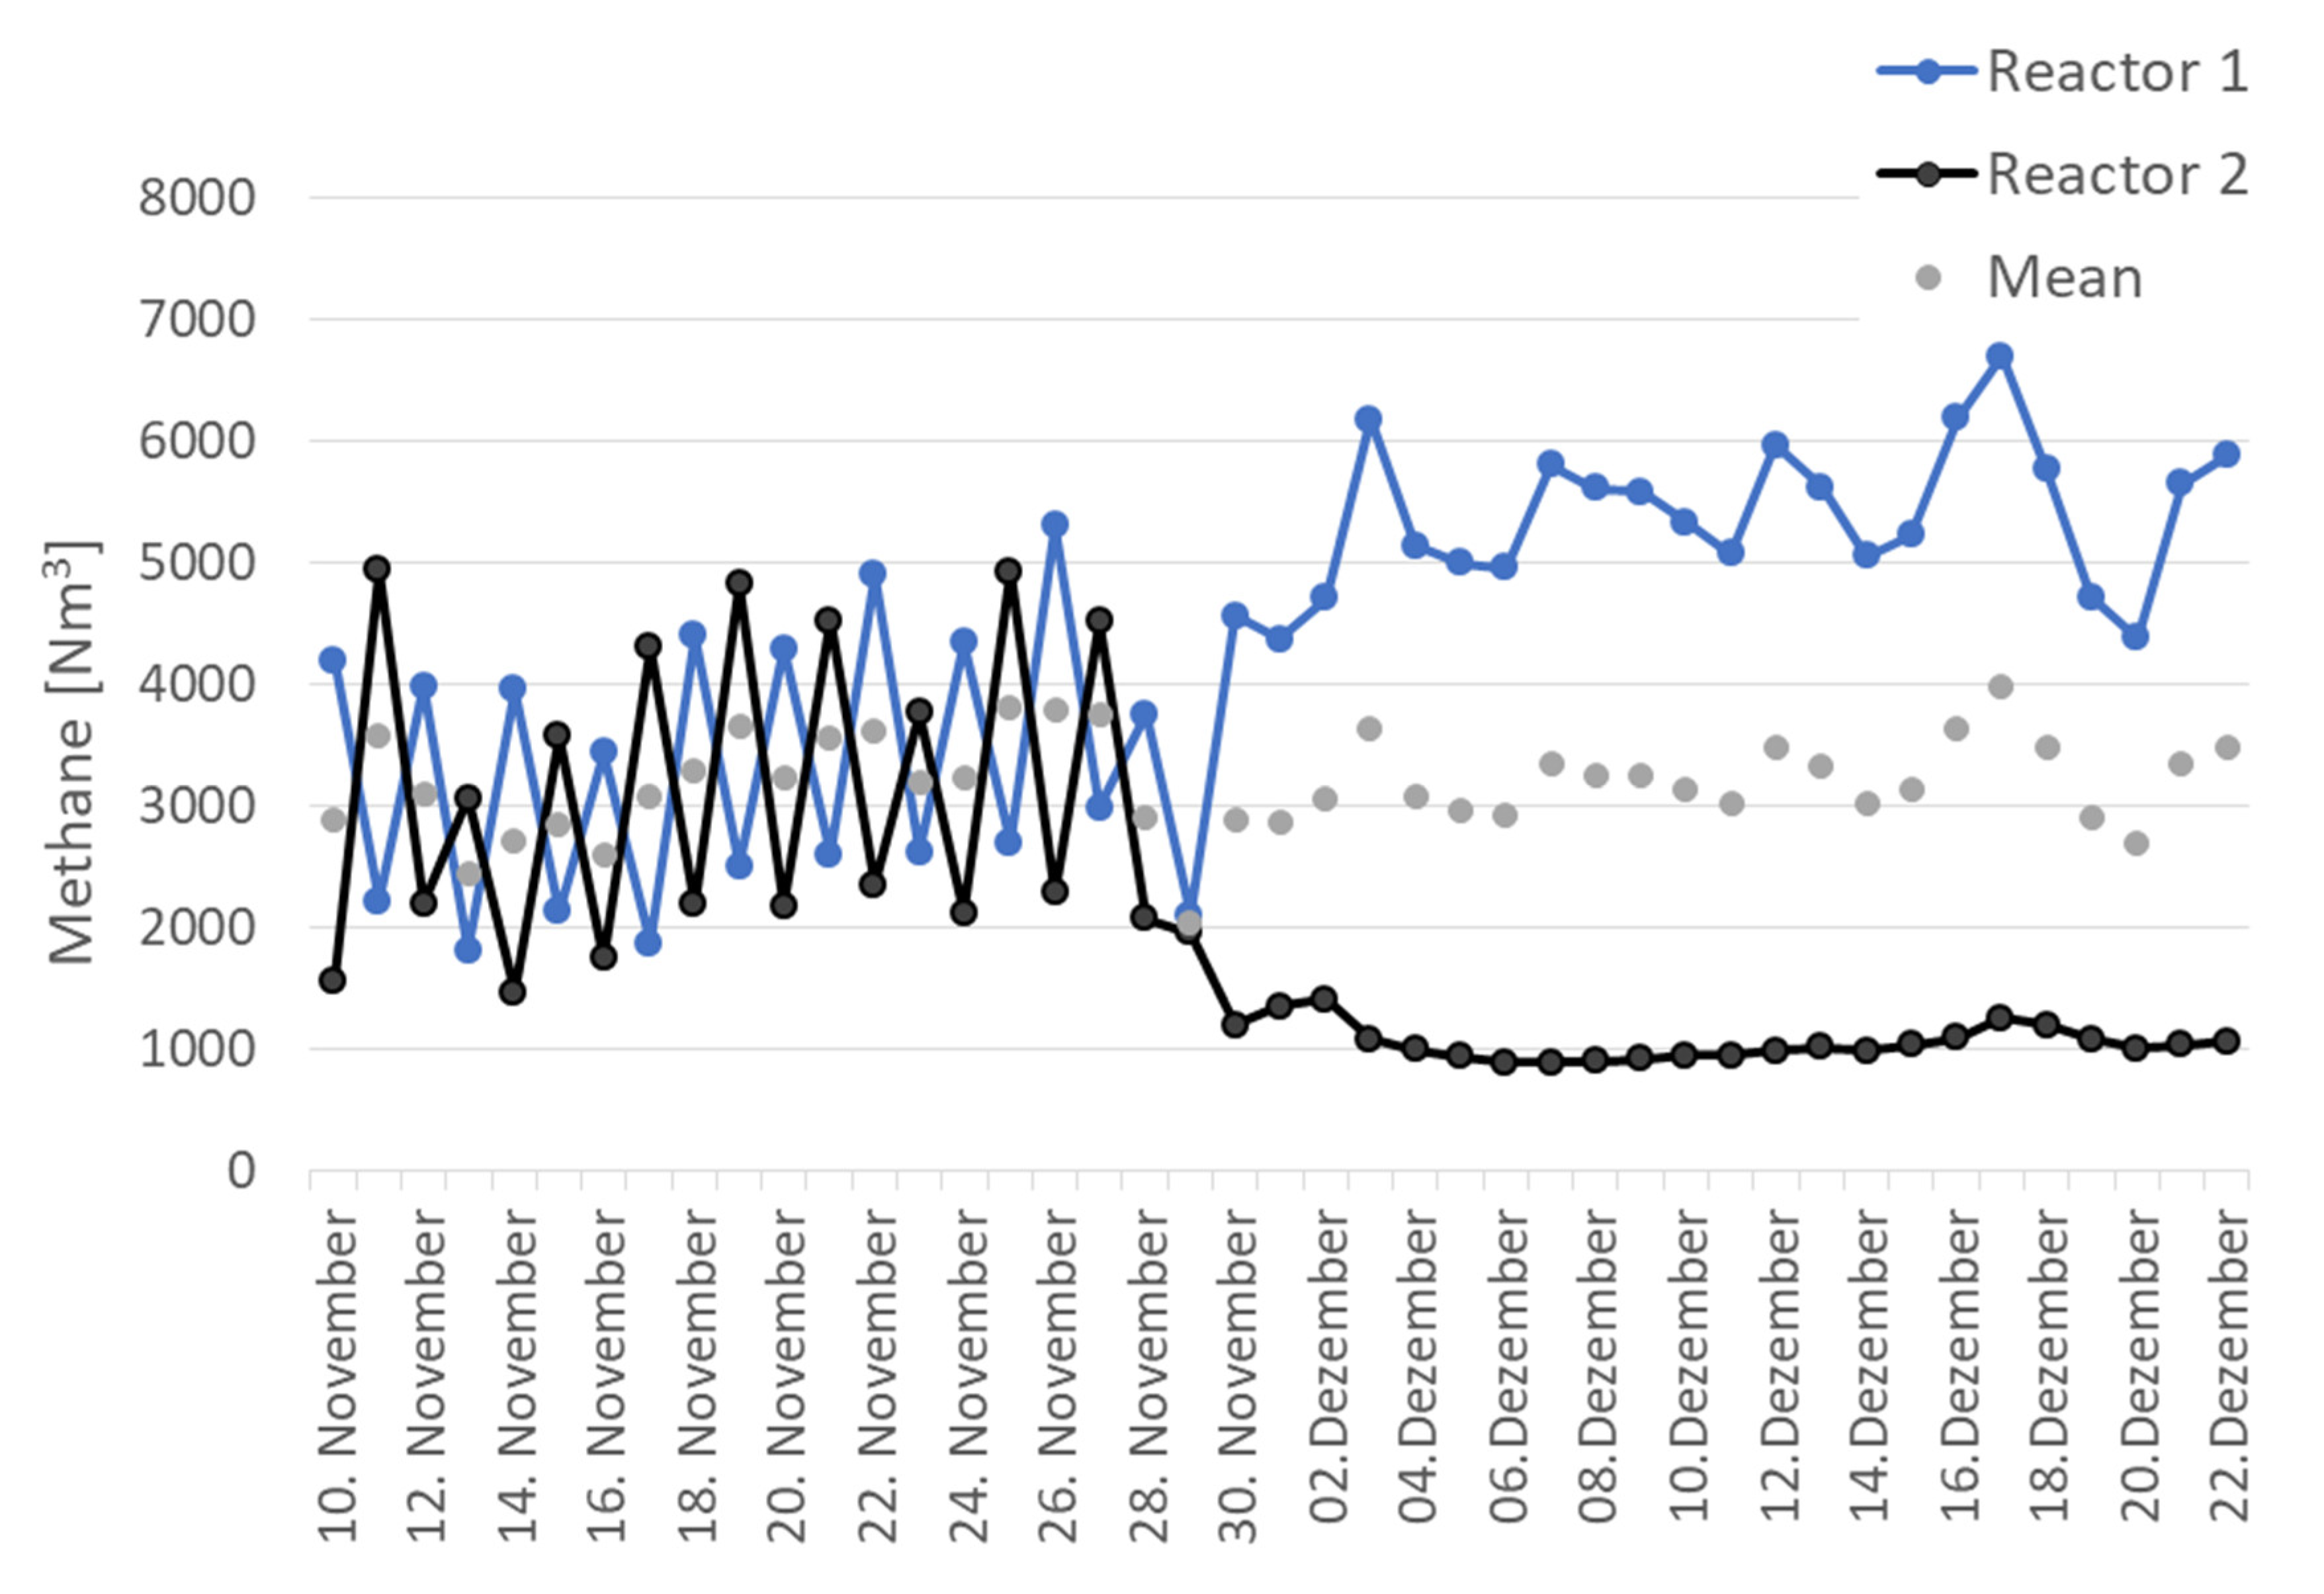
3.1. Process Characteristics in Parallel and Serial Operation

Despite several advantages of serial operation, this is, to our knowledge, the first investigation concerning process performance, stability and microbiota when switching the AD operation mode from parallel to serial in full-scale reactors.
The references [21,22] define desirable values of physicochemical process conditions that are recommended for well-functioning AD reactors and, therefore, efficient biomethanization. In the following, we will compare the process parameters of the system investigated here to these reference thresholds. Overall, during both parallel and serial operation, all observed physicochemical properties were usually within the thresholds for stable reactor conditions specified in [21,22]. At the start of the experiment while the reactors were operated in parallel, both reactors R1 and R2 provided similar conditions. The pH of both reactors was neutral (mean ± standard deviation = 7.0 ± 0.1), which is within the recommended range of 7–8 [22]. Two days after the switch from parallel to serial operation, the pH in R1 dropped to 5.7 and 6.5, respectively. This is considered unfavorable for methanogens, but favorable for hydrolyzing bacteria [21,22], indicating that there was enhanced hydrolysis in R1 directly after the switch to serial mode. There was no pH change from the initial neutral pH in R2 within the first two days, indicating that methanogenesis continued in R2. After the initial two-day period, similar pH values of 7.0 ± 0.1 were found in both reactors and operation modes, highlighting that both reactors operated efficiently in terms of CH4 production. This short-term pH drop is probably coming with the system adapting to unusually high feeding rates now faced in serial operation as also reported before [23,24,25].
The temperature ranged between 35.7 °C and 37.2 °C during the monitoring period and fluctuations were not affected by operational change. According to [5,21], the microbial community in AD reactors generally tolerates temperature fluctuations of ±3 °C under mesophilic conditions.
According to [21,22], NH4-N concentrations < 5 g L−1 are indicative for an efficient AD process. In the system studied here, NH4-N concentrations were significantly higher, but still noncritical, in R2 during serial operation (1213 mg L−1 ± 68.6 mg L−1) compared to R1 (1034 mg L−1 ± 56.3 mg L−1; p < 0.01).
Dry matter (2.8% ± 0.06%) and organic dry matter (67.3% ± 0.98% of dry matter) were similar in both reactors during the time of parallel operation. Both process parameters were well below the critical limits of 8% and 9% for dry matter and 6% and 7% for organic dry matter (referring to fresh weight) recommended in [21,22], respectively. As expected, significantly higher dry matter (mean ± standard deviation: R1 = 2.95% ± 0.1%, R2 = 2.63% ± 0.05%) and organic dry matter contents (R1 = 70.1%dry matter ± 0.74%dry matter, R2 = 67.1%dry matter ± 0.99%dry matter) were found in R1 during serial operation compared to R2 (p < 0.01), due to higher feeding rates in this reactor.
Stable CH4 concentrations of 61.3% ± 1.25% (mean ± standard deviation) were measured in both reactors during both parallel and serial operation. Across all measurements taken during parallel operation, average CH4 yields of 3359 m3 ± 1059 m3 and 2935 m3 ± 1250 m3 were measured for R1 and R2, respectively (Figure 2). The fluctuations of the CH4 yields among R1 and R2 in parallel mode are likely caused by the feeding regime as the reactors were fed every other day in an interchanging manner, so the day R1 was fed, R2 did not get new substrate and vice versa. The feeding resulted in an immediate rise of CH4 production. As hypothesized, average CH4 yields of 5399 m3 ± 592 m3 produced in R1 exceeded the yields from R2 (1040 m3 ± 140 m3, p < 0.01) in serial operation. The overall CH4 production was slightly increased by 2.29% compared to parallel mode (Figure 2). Due to a lack of a true replication, this figure should be considered as a trend that would need to be confirmed by longer operation or a replicated setup. However, a change in operation mode resulted in an increase of CH4 production as soon as the reactor was fed fresh substrate: Gas was produced immediately in R1 after feeding fresh substrate at mode change on 1 December (Figure 2). The CH4 yields showed stable values during serial operation. The immediate CH4 production after insertion of fresh input material indicates that reactors were not operated at or close to maximum OLR conditions. This rapid adjustment may allow for using the advantages of both operation modes, because the change between serial and parallel does not seem to cause instable reactor conditions. In addition, in serial operation, R2 could be used for demand driven biogas production during peak periods of energy consumption, for example via addition of input material, as described before in full- and pilot-scale reactors using glycerol [26,27].
Low levels of all analyzed VFAs were found: acetate (mean ± standard deviation = 9.05 mg L−1 ± 6.95 mg L−1) and propionate (10.6 mg L−1 ± 19.4 mg L−1) were predominant in both reactors during both parallel and serial operation. The reference values for acetate and propionate are <1000 mg L−1 and <250 mg L−1, respectively, according to [21,22]. Both accumulating acetate and propionate can disturb the AD process, in the worst case impeding CH4 production. Here, the concentrations of both VFAs were well within the recommended range. Other VFAs (valerate, formate, phenylpropionate, phenylbutyrate, i-butyrate, butyrate) were found at very low concentrations, indicating a stable process [28]. Taken together, these results show that despite the reactors were not used to highest possible capacity (high OLR), the resulting CH4 was slightly higher in serial than in parallel operation. This supports the hypothesis that switching the mode does not cause process instability or stress to the microbial community by VFA accumulation [28]. It may further be argued that serial operation would allow an increased OLR.
Both, hydrolysis and methanogenesis are considered the rate-limiting steps in AD [29]. Here, neither of them seemed to be a bottleneck in process performance since CH4 yield in R1 immediately increased after operation change and VFAs did not accumulate in the reactors

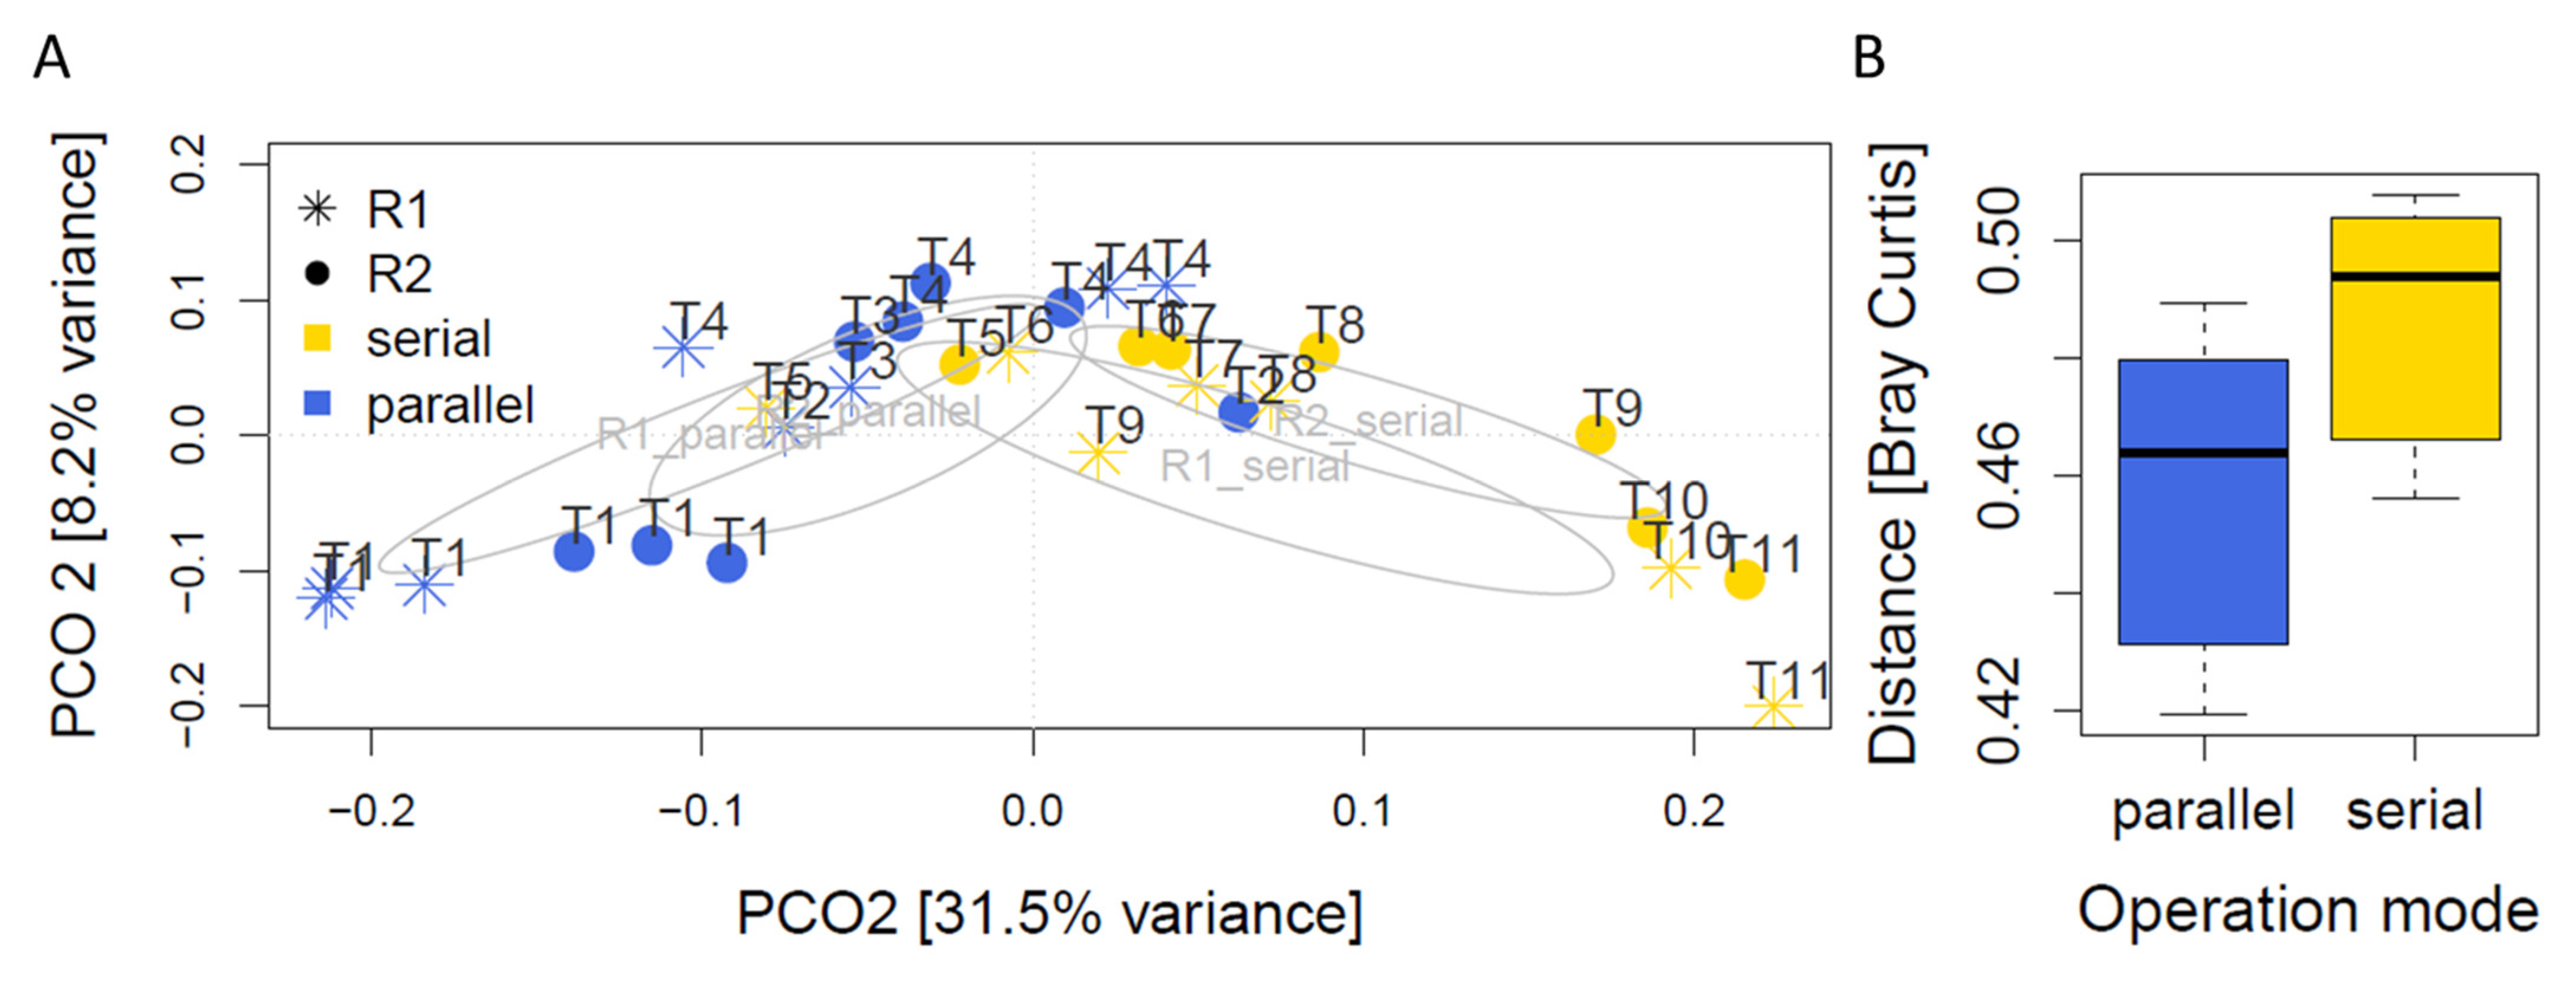
3.2. Microbial Community Profiles in Parallel and Serial Operation

The microbiota in the reactors was identified based on 45,278 ± 6313 (mean ± standard deviation) archaeal and bacterial sequence reads per sample obtained from Illumina MiSeq sequencing. To reveal the influence of changing the operation mode from parallel to serial on the composition of microbes in the digesters, 1,358,344 sequences were clustered into 7298 archaeal and bacterial asvs. Rarefaction curves nearly reached saturation, indicating sufficient sampling depth and, therefore, a representative picture of the microbial community.
The ordination based on Principal Coordinates extracted from Bray-Curtis distances among the microbial communities suggested an influence of all experimental factors time, operation mode and reactor (Figure 3A). The microbial communities of the reactors clearly followed a time trajectory. There was also a separation of parallel and serial operation in the first dimension (31.5% variance), whereas the second dimension (8.2% variance) tended to separate the two reactors during serial, but not during parallel operation. In parallel operation, the communities within the two reactors were comparable and followed the same time trajectory. A dynamic change over time in both reactors had been expected due to the influence of the heterogeneous input material over time. The variation between reactors in parallel operation is potentially a result of being fed every other day: At the same sampling point for both reactors, one reactor is more advanced in fermenting the substrate compared to the freshly fed one. Adonis analysis supported this picture and indicated differences in community structure between parallel and serial mode (p = 0.002) and between reactors (p = 0.05). However, the variance explained by these factors was low (7% and 5%, respectively). A high portion of variance remained unexplained, from which the majority is likely due to differences over time (Figure 3A). Also, the changes in substrate composition are likely to have introduced variance and affect the microbiota. There were no significant differences in within group homogeneity as indicated by betadiver analysis (p = 0.37), which can be interpreted as homogeneity of variances. After the switch to serial operation, the communities of R1 and R2 became more dissimilar in comparison to those communities present in parallel operation (Figure 3B) (p < 0.001).
In order to relate the microbial community to the physicochemical process parameters, we fitted the pH, temperature, NH4-N concentration, dry matter, organic dry matter, biogas yield, and CH4 concentration of the biogas produced to the microbial ordination. With the exception of the organic dry matter, none of the parameters had a significant correlation with the microbial community (p > 0.14). The organic dry matter explained 30% of the variance within the ordination (p = 0.009), thereby underlining the relevance of the organic feed in the AD process. Using the same approach for fitting VFA concentrations to the ordinations, only acetate had a significant correlation to the microbial community in the AD process (R2 = 0.69, p = 0.026), while propionate, butyrate, iso-butyrate and valerate were all insignificant (p > 0.22). Extending our hypothesis that both reactors were not fed to their highest capacity, higher loading rates might have caused a more pronounced change in the microbial community.
Given the high relevance of physical and chemical process conditions and their interdependency with the involved microbial community for AD, it surprises that there were almost no correlations among the AD process parameters and the microbial community. It should be kept in mind that all the process parameters (i) stayed well within the recommended range and (ii) either did not change significantly or changed only slightly given a much wider range of possible scenarios. Consequently, the kinetics of the process following the switch from serial to parallel mode did not appear to be affected on the level of the entire process.

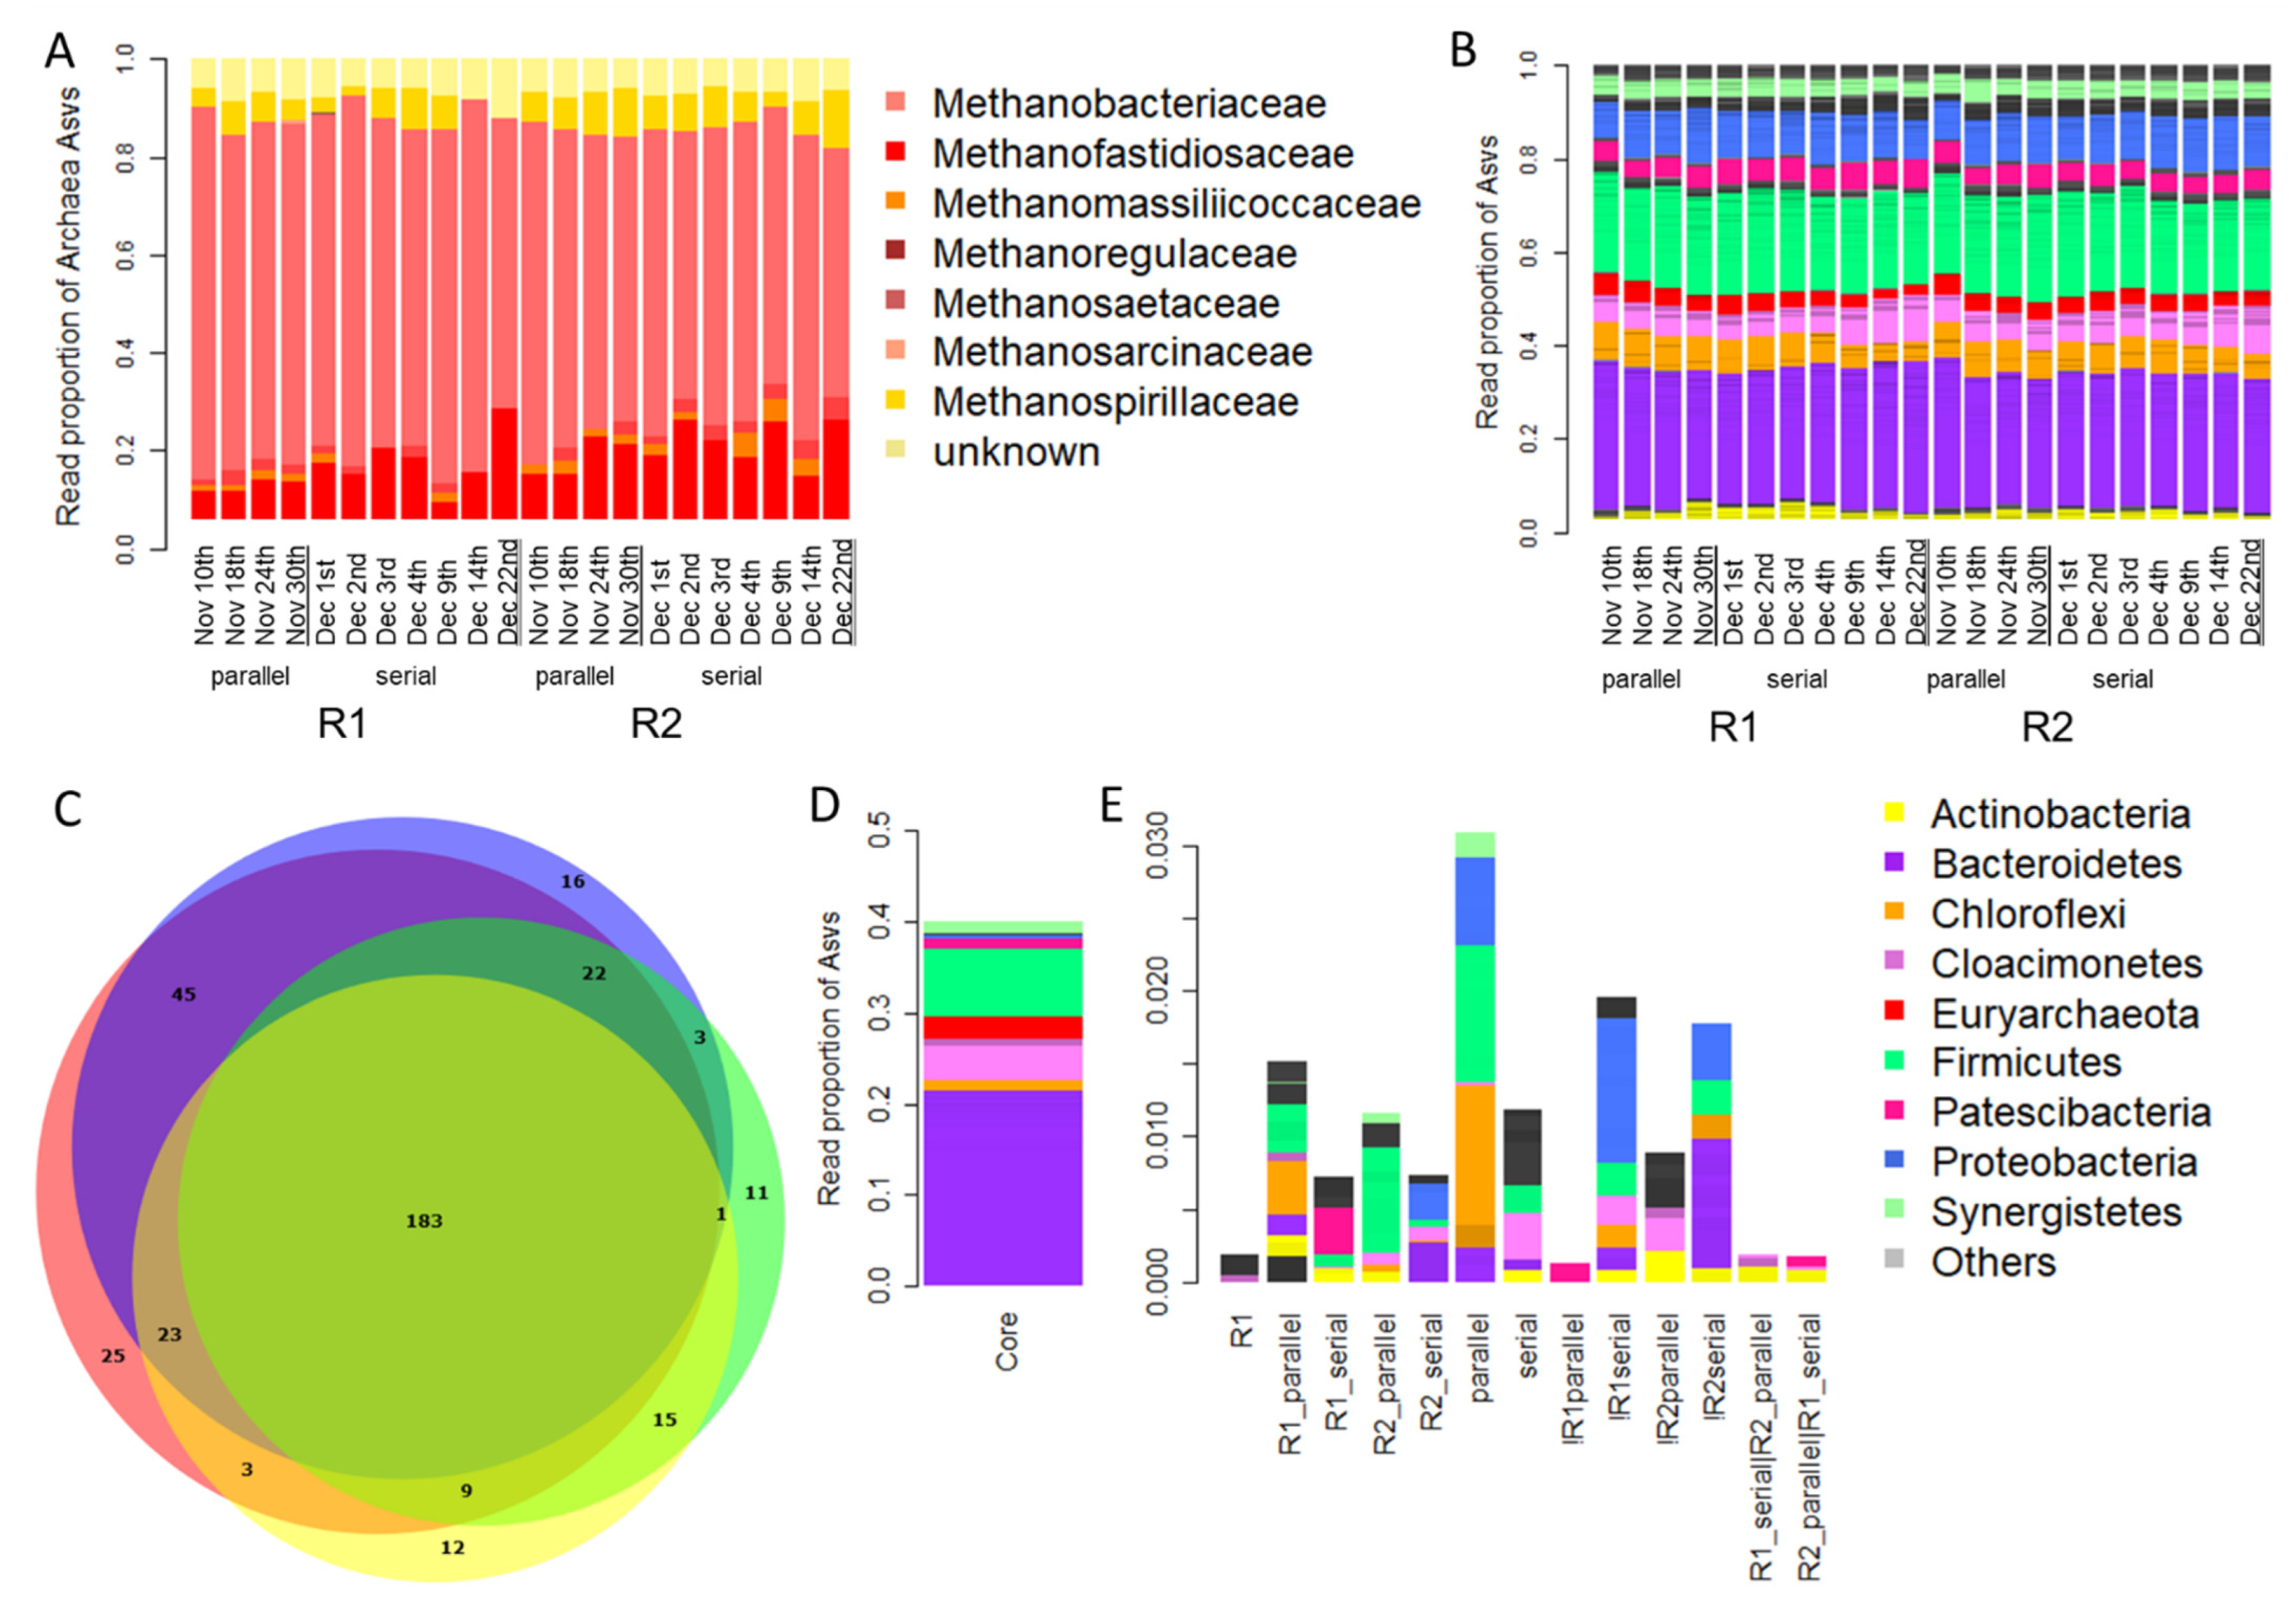
3.3. Taxonomic Composition of the Microbial Community Present in Parallel and Serial Operation

Independent of sample group, bacteria were the dominant domain in all anaerobic sludge samples accounting for 95.3% to 97.9% of all sequences (Figure 4B). In our samples, archaeal sequences accounted for 2.1% to 4.7% of the total sequences (Figure 4A), which is in accordance with previous findings from e.g., [30], who reported percentages of 2.7% to 4.1% archaeal sequences within their samples collected from an AD plant treating sewage sludge. On higher taxonomic level, in all AD samples, a consortium of Bacteroidetes (27.4% to 32.7%), Firmicutes (19.2% to 22.9%), Proteobacteria (7.9% to 12.3%) and Cloacimonetes (4.7% to 10.4%) was found to dominate the bacterial community as also reported in other studies [30,31,32,33,34].
In every sample group, Bacteroidetes were detected in at least six (out of 11) samples. Consequently, they were members of the core community, defined as those asvs present in all sample groups. Within the core community, asvs taxonomically annotated as Bacteroidetes accounted for the highest percentage of all phyla detected (Figure 4C,D, Supplementary Table S1). Although several of those Bacteroidetes asvs detected in the core could not be annotated beyond the class Bacteroidales, a high number belonged to the families of Prolixibacteraceae (29 asvs) and Rickenellaceae (16 asvs). Members of Bacteroidetes are well-known fermentative bacteria, able to hydrolyze and ferment organic materials and produce organic acids, CO2 and H2 during AD [35]. The relative abundance of Bacteroidetes was decreased in R2 during serial operation (Figure 4E) probably due to a decreased hydrolytic activity in this reactor receiving only pre-hydrolyzed substrate from R1 in this operation mode. Those Bacteroidetes asvs detected in all sample groups except R2 under serial operation mode (Figure 4E) primarily belonged to the family of Dysgonomonadaceae (13/22 asvs); several of them were annotated to the genus Proteiniphilum (5 asvs) (Supplementary Table S1).
As in the overall dataset, the phylum of Firmicutes constituted the second highest proportion of core asvs (Figure 4C,D). In contrast to Bacteroidetes, they were more frequent in parallel compared to serial operation mode (Figure 4E). The vast majority of these asvs both in the core and overrepresented in the parallel operation mode belonged to the order of Clostridiales. Other Firmicutes lineages only accounted for small minorities, which contrasts to the results of Guo et al. [31] and Yang et al. [30], who both reported significant percentages of Bacilli among those Firmicutes detected. Most members belonging to the phylum Firmicutes are well-known fermenters and syntrophic bacteria able to degrade various VFAs [36]. In line with the results of Guo et al. [31], however, the predominance of Clostridiales could be associated with a much higher rate of hydrolysis and VFA fermentation in R1, i.e., serial operation. Jaenicke et al. [37] and Mudhoo et al. [38] assigned members of the phylum Firmicutes, represented by the classes of Clostridia and Bacilli, the phylum Bacteroidetes and the phylum Proteobacteria as most important for polysaccharide degradation. Here, the increase of these hydrolyzing and fermenting bacteria in R1 goes hand in hand with the increased CH4 production in this reactor compared to parallel operation and R2 under serial conditions. These findings are in accordance with Kaparaju et al. [9], who observed a large number of fermenting bacteria in the main reactor of serial digestion but a relatively low abundance of these microorganisms in R2.
In the present study, Proteobacteria did not account for high percentages of reads and they were not detected in the core. Members of this phylum appeared to be associated with parallel operation; during serial operation they were detected in R2 rather than R1 (Figure 4E). Proteobacteria detected here were annotated as Syntrophaceae or Syntrophorhabdaceae (Supplementary Table S1), which also supports that here they were more involved with the later stages of the process. Members of these families are strictly anaerobic fermenters that live in close interaction with H2-scavanging syntrophic organisms [39,40]. The low abundance of hydrolytic Proteobacteria in this dataset is surprising. Guo et al. [31] reported Proteobacteria percentages of 9.5% to 13.5%; Yang et al. [30] reported Proteobacteria abundances of roughly 30%. The lower abundances observed here might be related to the (changing) substrates fed to the reactors. The compositional differences observed among the system studied here, by Guo et al. [31], and by Yang et al. [30] suggests that in the AD system observed here, Firmicutes overtook the role of VFA use performed by Proteobacteria in the studies of Guo et al. and Yang et al.
With regards to Archaea, we expected their abundances to be comparable in both reactors under parallel operation mode and higher in R2 under serial operation mode. In fact, the read abundances of archaea detected in both reactors were comparable under parallel operation mode (R1 = 4.1%, R2 = 3.9%). Under serial conditions, the read abundances in R1 (3.1%) were in fact lower compared the R2 (3.6%). Moreover, the archaeal read abundances were lower under serial conditions compared to parallel conditions. However, it has to be noted that NGS sequencing does not allow for drawing conclusions on true archaeal abundances here. First, relative read abundances cannot be compared using parametric statistics (ANOVA) as these assumptions of the Euclidean space are violated (compositional data). Second, sequencing read abundances do not necessarily reflect active cell abundances. Consequently, these findings only pose a speculative trend, which is nevertheless in line with our hypothesis and points towards methanogens accumulating in R2 under serial operation mode. This preference is likely caused by R2 receiving predigested material, VFAs and nutrients through the effluent of R1, which could be used by methanogens.
With regards to the community composition of archaea, the main producers of CH4 in the AD process, the phylum Euryarchaeota accounted for 91.1% to 98.9% of all archaeal sequences. The remaining sequences belonged to the phyla Crenarchaeota (≤1.3%) and Pacearchaeota (1.1% to 7.6%). The majority of reads of the archaeal community could be annotated to seven different families (Figure 4A). Methanosaetaceae accounted for 51.2% to 76.2% of all archaeal sequences, followed by Methanofastidiosaceae (9.5–28.7%) and Methanospirillaceae (up to 11.5%) (Figure 4B). The two most prevalent genera were Methanosaeta (51.2–76.2%), candidatus Methanofastidiosum (9.5–28.7%) and Methanospirilillum (up to 11.5%), all belonging to the class Methanomicrobia. The dominance of Methanosaeta indicates the importance of acetotrophic methanogenesis as the main metabolic pathway in this AD system, which is in full agreement with acetate being the only VFA with significant correlation to the bacterial and archaeal community involved here. Members of this genus have a high affinity for acetate but a relatively low maximum acetate utilization rate [41]. Thus, Methanosaeta is competitive in environments with low acetate concentrations, as was the case in all our samples. Methanosarcina on the other hand showed very low abundance in all samples, likely because Methanosarcina is favored in an environment with high acetate concentrations [41]. These findings are in accordance with previous studies [42,43,44], where Methanosaeta dominated in low acetate sludge samples. The second most abundant genus in this AD system was cand. Methanofastidiosum. This genus was described originally from several high quality draft genomes and not from isolated pure cultures [45]. The draft genomes of Methanofastidiosum neither code proteins for CO2 nor acetate metabolism. Methanofastidiosum also lacks genes coding for methyltransferases essential methanol and methylamine utilization. In fact, Nobu et al. [45] hypothesized that this taxon produces CH4 solely by demethylation of methylated thiols, which in turn might be limiting, but could also pose an adaptation to gut and AD habitats, such as anaerobic reactors. As based on its genome, Methanofastidiosum is not competing with Methanosaeta for energy sources. This might explain both their high relative abundances in this AD system. Therefore, the low acetate concentrations in the reactors might have hampered the growth of other methanogens, and could have promoted both Methanosaeta and Methanofastidiosum.
All these results, especially the low VFA concentrations in the reactors, support the hypothesis that reactors were not used to high capacity. Higher feeding rates, and therefore CH4-production might have been possible by higher feeding rates. However, the reactors’ microbiomes changed and adapted to the new feeding regime. The higher CH4 yield in R1 under serial operation suggests either a higher number of microbial producers or increased microbial activity in this reactor. As the changes in microbial composition differed slightly, an increase in microbial producers is unlikely, because it would have affected all microbial groups similarly and not only the CH4 producers. Therefore, we think that the shortage of nutrients might have kept the microbial numbers constant, thereby also explaining the relatively small compositional changes in the reactors’ microbiomes. In this case, the significantly higher CH4 yields in R1 during serial operation might indicate that microbial activity was higher in this reactor. Overall, it should be kept in mind that the findings presented here result from a relatively short, one-time pilot study performed at one operating plant. Nevertheless, they provide first time, large-scale results, which clearly indicate that changes in operation modes could be both feasible and beneficial for the process. In this sense, this study might motivate a higher number of full-scale experiments regarding changes in operation mode, based on which a better understanding of the AD process and its microbial adaptation can be achieved.

4. Conclusions

In order to determine the short-term influence of changing the process from parallel to serial operation mode on reactor performance and functional stability in full-scale reactors, the reactors’ microbiomes and physicochemical properties were analyzed. After operational switch, physicochemical properties remained below thresholds for stable reactor conditions. Slightly increased CH4 yields (+2.29% for R1 and R2) and slightly lower dry mater contents (−0.17% in R2) could be detected in serial operation regime. Physicochemical results were supported by amplicon sequencing, where moderate changes in the microbiota were detected. Findings indicate a highly diverse and thus flexible microbiota, dominated by Bacteroidetes, Firmicutes, Proteobacteria and Cloacimonetes. The most prominent member of the Euryarchaeota was Methanosaeta. These findings suggest that a rapid change from parallel to serial operation and vice versa is possible in large-scale reactors without causing process instability if reactors are not used to high capacity. The option of suddenly switching between serial and parallel without negative effects on the AD process might be beneficial for biogas plants suffering from seasonal input changes. This way, the advantages of both modes can be used depending on the substrate situation the plant is facing: e.g., during stable substrate income, serial operation might optimize the overall CH4 yield. Infrequent and unpredictable peaks in substrate income can be fed to the downstream reactor (R2), thereby increasing the overall gas yield. Furthermore, spontaneous feeding of R2 could also be used to produce CH4 on demand during energy consumption peaks. In times of high substrate availability or during process instability, the mode can be switched to parallel, which increases the robustness and stability of the AD process and, therefore, prevents process failure.
Furthermore, our results suggest that reactors were not fully exploited and OLRs typically used at wastewater treatment plants can probably be increased. Even after doubling the OLR in R1 during serial operation, the AD process remained stable and VFAs were degraded immediately.

Supplementary Materials

The following supporting information can be downloaded at: https://www.mdpi.com/article/10.3390/su14127161/s1, Table S1: List of Venn asvs, including their taxonomic annotation and overall relative read abundance. The strict conditions correspond to the Venn diagram illustrated in Figure 4, the non-strict conditions correspond to the Venn diagram illustrated in the Supplementary Figure S1. Figure S1: Overview of the microbiomes taxonomical composition. (A) Venn diagram categorizing the asvs detected according to sample. Asvs > 6 reads in at least 4 samples of each sample group were considered for categorization. (B) Taxonomic composition of the core Venn set. (C) Taxonomic composition of the non-core Venn sets.

Author Contributions

Conceptualization, C.E., R.M. and M.P.; methodology, A.W., M.H., C.E., H.I., R.M., and M.P.; software, M.P.; validation, A.W. and M.P.; formal analysis, M.H. and M.P.; investigation, M.H. and M.P.; resources, C.E. and H.I.; data curation, A.W. and M.P.; writing—original draft preparation, A.W., M.H. and M.P.; writing—review and editing, A.W., M.H., C.E., H.I., R.M., S.H. and M.P.; visualization, M.H. and M.P.; supervision, M.P. and H.I.; project administration, H.I. and S.H.; funding acquisition, H.I., A.W. and S.H. All authors have read and agreed to the published version of the manuscript.

Funding

This research was funded, and publication fees were covered, by the AUSTRIAN SCIENCE FUND (FWF; project number: P 33163-B).

Institutional Review Board Statement

Not applicable.

Informed Consent Statement

Not applicable.

Data Availability Statement

Data is contained within the article.

Acknowledgments

This work was supported by the “Nachwuchsförderung” of the University of Innsbruck. We thank the IKB WTP employees for their close collaboration and support, as well as for providing all the needed information.

Conflicts of Interest

The authors declare no conflict of interest.

References

  1. Fountoulakis, M.S.; Petousi, I.; Manios, T. Co-digestion of sewage sludge with glycerol to boost biogas production. Waste Manag. 2010, 30, 1849–1853. [Google Scholar] [CrossRef]
  2. Murto, M.; Björnsson, L.; Mattiasson, B. Impact of food industrial waste on anaerobic co-digestion of sewage sludge and pig manure. J. Environ. Manag. 2004, 70, 101–107. [Google Scholar] [CrossRef] [PubMed]
  3. Appels, L.; Baeyens, J.; Degrève, J.; Dewil, R. Principles and potential of the anaerobic digestion of waste-activated sludge. Prog. Energy Combust. Sci. 2008, 34, 755–781. [Google Scholar] [CrossRef]
  4. Deublein, D.; Steinhauser, A. Biogas from Waste and Renewable Resources: An Introduction; John Wiley & Sons: Hoboken, NJ, USA, 2011; ISBN 3527643710. [Google Scholar]
  5. Weiland, P. Biogas production: Current state and perspectives. Appl. Microbiol. Biotechnol. 2010, 85, 849–860. [Google Scholar] [CrossRef] [PubMed]
  6. Insam, H.; Franke-Whittle, I.; Goberna, M. Microbes in aerobic and anaerobic waste treatment. In Microbes at Work; Springer: Berlin/Heidelberg, Germany, 2010; pp. 1–34. [Google Scholar]
  7. de Crescenzo, C.; Marzocchella, A.; Karatza, D.; Molino, A.; Ceron-Chafla, P.; Lindeboom, R.E.F.; van Lier, J.B.; Chianese, S.; Musmarra, D. Modelling of autogenerative high-pressure anaerobic digestion in a batch reactor for the production of pressurised biogas. Biotechnol. Biofuels Bioprod. 2022, 15, 1–14. [Google Scholar] [CrossRef] [PubMed]
  8. Zhou, Y.; Su, X.; Zhao, W.; Xia, D.; Fu, H.; Wang, G. Culture medium optimization for producing biomethane by coal anaerobic digestion. J. Biotechnol. 2022, 348, 26–35. [Google Scholar] [CrossRef]
  9. Kaparaju, P.; Ellegaard, L.; Angelidaki, I. Optimisation of biogas production from manure through serial digestion: Lab-scale and pilot-scale studies. Bioresour. Technol. 2009, 100, 701–709. [Google Scholar] [CrossRef]
  10. Boe, K.; Angelidaki, I. Serial CSTR digester configuration for improving biogas production from manure. Water Res. 2009, 43, 166–172. [Google Scholar] [CrossRef]
  11. Li, Y.; Liu, C.; Wachemo, A.C.; Yuan, H.; Zou, D.; Liu, Y.; Li, X. Serial completely stirred tank reactors for improving biogas production and substance degradation during anaerobic digestion of corn stover. Bioresour. Technol. 2017, 235, 380–388. [Google Scholar] [CrossRef]
  12. Bensmann, A.; Hanke-Rauschenbach, R.; Sundmacher, K. Reactor configurations for biogas plants—A model based analysis. Chem. Eng. Sci. 2013, 104, 413–426. [Google Scholar] [CrossRef]
  13. Angelidaki, I.; Boe, K.; Ellegaard, L. Effect of operating conditions and reactor configuration on efficiency of full-scale biogas plants. Water Sci. Technol. 2005, 52, 189–194. [Google Scholar] [CrossRef]
  14. Boe, K.; Karakashev, D.; Trably, E.; Angelidaki, I. Effect of post-digestion temperature on serial CSTR biogas reactor performance. Water Res. 2009, 43, 669–676. [Google Scholar] [CrossRef]
  15. Wagner, A.O.; Markt, R.; Puempel, T.; Illmer, P.; Insam, H.; Ebner, C. Sample preparation, preservation, and storage for volatile fatty acid quantification in biogas plants. Eng. Life Sci. 2017, 17, 132–139. [Google Scholar] [CrossRef]
  16. Podmirseg, S.M.; Waldhuber, S.; Knapp, B.A.; Insam, H.; Goberna, M. Robustness of the autochthonous microbial soil community after amendment of cattle manure or its digestate. Biol. Fertil. Soils 2019, 55, 565–576. [Google Scholar] [CrossRef]
  17. Callahan, B.J.; McMurdie, P.J.; Rosen, M.J.; Han, A.W.; Johnson, A.J.A.; Holmes, S.P. DADA2: High-resolution sample inference from Illumina amplicon data. Nat. Methods 2016, 13, 581–583. [Google Scholar] [CrossRef]
  18. R Core Team. R: A Language and Environment for Statistical Computing; R Foundation for Statistical Computing: Vienna, Austria, 2018; Available online: https://www.R-project.org (accessed on 7 January 2022).
  19. Oksanen, J.; Blanchet, F.J.; Friendly, M.; Kindt, R.; Legendre, P.; McGlinn, D. Community Ecology Package, R Package, version 2.4-2. 2017. Available online: https://cran.r-project.org/web/packages/vegan/index.html (accessed on 7 January 2022).
  20. Hulsen, T. BioVenn–an R and Python package for the comparison and visualization of biological lists using area-proportional Venn diagrams. Data Sci. 2021, 4, 51–66. [Google Scholar] [CrossRef]
  21. Schöftner, R.; Valentin, K.; Schmiedinger, B.; Trogisch, S.; Haberbauer, M.; Katzlinger, K.; Schnitzhofer, W.; Weran, N. Best Biogas Practise. Rep. Energy Environ. Res. 2007, 45, 2006. [Google Scholar]
  22. Drosg, B. Process Monitoring in Biogas Plants; IEA Bioenergy: Paris, France, 2013. [Google Scholar]
  23. Blume, F.; Bergmann, I.; Nettmann, E.; Schelle, H.; Rehde, G.; Mundt, K.; Klocke, M. Methanogenic population dynamics during semi-continuous biogas fermentation and acidification by overloading. J. Appl. Microbiol. 2010, 109, 441–450. [Google Scholar] [CrossRef]
  24. Zuo, Z.; Wu, S.; Zhang, W.; Dong, R. Effects of organic loading rate and effluent recirculation on the performance of two-stage anaerobic digestion of vegetable waste. Bioresour. Technol. 2013, 146, 556–561. [Google Scholar] [CrossRef]
  25. Babaee, A.; Shayegan, J. Effect of organic loading rates (OLR) on production of methane from anaerobic digestion of vegetables waste. In World Renewable Energy Congress-Sweden; Linköping University Electronic Press: Linköping, Sweden, 2011. [Google Scholar]
  26. Mauky, E.; Weinrich, S.; Jacobi, H.-F.; Nägele, H.-J.; Liebetrau, J.; Nelles, M. Demand-driven biogas production by flexible feeding in full-scale–Process stability and flexibility potentials. Anaerobe 2017, 46, 86–95. [Google Scholar] [CrossRef]
  27. Nghiem, L.D.; Nguyen, T.T.; Manassa, P.; Fitzgerald, S.K.; Dawson, M.; Vierboom, S. Co-digestion of sewage sludge and crude glycerol for on-demand biogas production. Int. Biodeterior. Biodegrad. 2014, 95, 160–166. [Google Scholar] [CrossRef]
  28. Athanasoulia, E.; Melidis, P.; Aivasidis, A. Optimization of biogas production from waste activated sludge through serial digestion. Renew. Energy 2012, 47, 147–151. [Google Scholar] [CrossRef]
  29. Adekunle, K.F.; Okolie, J.A. A review of biochemical process of anaerobic digestion. Adv. Biosci. Biotechnol. 2015, 6, 205. [Google Scholar] [CrossRef]
  30. Yang, Y.; Yu, K.; Xia, Y.; Lau, F.T.K.; Tang, D.T.W.; Fung, W.C.; Fang, H.H.P.; Zhang, T. Metagenomic analysis of sludge from full-scale anaerobic digesters operated in municipal wastewater treatment plants. Appl. Microbiol. Biotechnol. 2014, 98, 5709–5718. [Google Scholar] [CrossRef]
  31. Guo, J.; Peng, Y.; Ni, B.-J.; Han, X.; Fan, L.; Yuan, Z. Dissecting microbial community structure and methane-producing pathways of a full-scale anaerobic reactor digesting activated sludge from wastewater treatment by metagenomic sequencing. Microb. Cell Factories 2015, 14, 33. [Google Scholar] [CrossRef]
  32. Li, A.; Chu, Y.; Wang, X.; Ren, L.; Yu, J.; Liu, X.; Yan, J.; Zhang, L.; Wu, S.; Li, S. A pyrosequencing-based metagenomic study of methane-producing microbial community in solid-state biogas reactor. Biotechnol. Biofuels 2013, 6, 3. [Google Scholar] [CrossRef]
  33. Treu, L.; Kougias, P.G.; de Diego-Díaz, B.; Campanaro, S.; Bassani, I.; Fernández-Rodríguez, J.; Angelidaki, I. Two-year microbial adaptation during hydrogen-mediated biogas upgrading process in a serial reactor configuration. Bioresour. Technol. 2018, 264, 140–147. [Google Scholar] [CrossRef] [PubMed]
  34. Calusinska, M.; Goux, X.; Fossépré, M.; Muller, E.E.L.; Wilmes, P.; Delfosse, P. A year of monitoring 20 mesophilic full-scale bioreactors reveals the existence of stable but different core microbiomes in bio-waste and wastewater anaerobic digestion systems. Biotechnol. Biofuels 2018, 11, 196. [Google Scholar] [CrossRef]
  35. Traversi, D.; Villa, S.; Lorenzi, E.; Degan, R.; Gilli, G. Application of a real-time qPCR method to measure the methanogen concentration during anaerobic digestion as an indicator of biogas production capacity. J. Environ. Manag. 2012, 111, 173–177. [Google Scholar] [CrossRef]
  36. Garcia-Peña, E.I.; Parameswaran, P.; Kang, D.W.; Canul-Chan, M.; Krajmalnik-Brown, R. Anaerobic digestion and co-digestion processes of vegetable and fruit residues: Process and microbial ecology. Bioresour. Technol. 2011, 102, 9447–9455. [Google Scholar] [CrossRef]
  37. Jaenicke, S.; Ander, C.; Bekel, T.; Bisdorf, R.; Dröge, M.; Gartemann, K.-H.; Jünemann, S.; Kaiser, O.; Krause, L.; Tille, F. Comparative and joint analysis of two metagenomic datasets from a biogas fermenter obtained by 454-pyrosequencing. PLoS ONE 2011, 6, e14519. [Google Scholar] [CrossRef] [PubMed]
  38. Mudhoo, A. Biogas Production: Pretreatment Methods in Anaerobic Digestion; John Wiley & Sons: Hoboken, NJ, USA, 2012; ISBN 1118404076. [Google Scholar]
  39. Kuever, J. The Family Syntrophaceae. In The Prokaryotes: Deltaproteobacteria and Epsilonproteobacteria; Rosenberg, E., DeLong, E.F., Lory, S., Stackebrandt, E., Thompson, F., Eds.; Springer Berlin Heidelberg: Berlin/Heidelberg, Germany, 2014; pp. 281–288. ISBN 978-3-642-39044-9. [Google Scholar]
  40. Kuever, J. The Family Syntrophorhabdaceae. In The Prokaryotes: Deltaproteobacteria and Epsilonproteobacteria; Rosenberg, E., DeLong, E.F., Lory, S., Stackebrandt, E., Thompson, F., Eds.; Springer Berlin Heidelberg: Berlin/Heidelberg, Germany, 2014; pp. 301–303. ISBN 978-3-642-39044-9. [Google Scholar]
  41. Yu, Y.; Lee, C.; Hwang, S. Analysis of community structures in anaerobic processes using a quantitative real-time PCR method. Water Sci. Technol. 2005, 52, 85–91. [Google Scholar] [CrossRef] [PubMed]
  42. McMahon, K.D.; Zheng, D.; Stams, A.J.M.; Mackie, R.I.; Raskin, L. Microbial population dynamics during start-up and overload conditions of anaerobic digesters treating municipal solid waste and sewage sludge. Biotechnol. Bioeng. 2004, 87, 823–834. [Google Scholar] [CrossRef] [PubMed]
  43. Walter, A.; Probst, M.; Franke-Whittle, I.H.; Ebner, C.; Podmirseg, S.M.; Etemadi-Shalamzari, M.; Hupfauf, S.; Insam, H. Microbiota in anaerobic digestion of sewage sludge with and without co-substrates. Water Environ. J. 2019, 33, 214–222. [Google Scholar] [CrossRef]
  44. Bedoya, K.; Hoyos, O.; Zurek, E.; Cabarcas, F.; Alzate, J.F. Annual microbial community dynamics in a full-scale anaerobic sludge digester from a wastewater treatment plant in Colombia. Sci. Total Environ. 2020, 726, 138479. [Google Scholar] [CrossRef]
  45. Nobu, M.K.; Narihiro, T.; Kuroda, K.; Mei, R.; Liu, W.-T. Chasing the elusive Euryarchaeota class WSA2: Genomes reveal a uniquely fastidious methyl-reducing methanogen. ISME J. 2016, 10, 2478–2487. [Google Scholar] [CrossRef]
Figure 1. Reactor set-up during parallel (A) and serial (B) operation. The two reactors were operated independently from each other during parallel operation, whereas during serial operation, reactors were connected in a cascade. Thin arrows indicate substrate supply and thick arrows the obtained biogas.
Sustainability 14 07161 g001
Figure 2. Methane yield (Nm3) during parallel and serial operation. The operation mode was switched from parallel to serial on 1 December.
Sustainability 14 07161 g002
Figure 3. (A) Principal coordinate analysis on Bray-Curtis dissimilarity displaying asv compositional differences amongsamples. (B) Pairwise Bray-Curtis differences among microbiomes detected in samples collected from the two reactors R1 and R2 during parallel and serial operation mode, respectively.
Sustainability 14 07161 g003
Figure 4. Overview of the microbiomes’ taxonomical compositions. (A) Taxonomic composition of Illumina reads annotated to the kingdom of Archaea. (B) Taxonomic composition of all Illumina sequencing reads across all samples. (C) Venn diagram categorizing the asvs detected according to sample. (D) Taxonomic composition of the core Venn set. (E) Taxonomic composition of the non-core Venn sets.
Sustainability 14 07161 g004
Publisher’s Note: MDPI stays neutral with regard to jurisdictional claims in published maps and institutional affiliations.

