Article

The Household Context of In Situ Conservation in a Center of Crop Diversity: Self-Reported Practices and Perceptions of Maize and Phaseolus Bean Farmers in Oaxaca, Mexico

by
Daniela Soleri
1,*,
Flavio Aragón Cuevas
2,
Humberto Castro García
3,
David A. Cleveland
4 and
Steven E. Smith
5
1
Geography Department, University of California, Santa Barbara, CA 93106-4060, USA
2
Instituto Nacional de Investigaciones Forestales, Agrícolas y Pecuarias, Villa de Etla 68200, Oaxaca, Mexico
3
Centro Regional Universitario Sur, Universidad Autónoma Chapingo, Texcoco 56230, Estado de México, Mexico
4
Environmental Studies Program, University of California, Santa Barbara, CA 93106-4160, USA
5
School of Renewable Natural Resources, University of Arizona, Tucson, AZ 85721, USA
*
Author to whom correspondence should be addressed.
Sustainability 2022, 14(12), 7148; https://doi.org/10.3390/su14127148
Submission received: 19 April 2022 / Revised: 28 May 2022 / Accepted: 7 June 2022 / Published: 10 June 2022

Abstract

:
Crop diversity conservation in situ is an ecosystem service with benefits at household, community, and global scales. These include risk reduction and adaptation to changing physical and sociocultural environments—both important given the accelerating changes in climate, human migration, and the industrialization of agriculture. In situ conservation typically occurs as part of small-scale, traditionally based agriculture and can support cultural identity and values. Although decisions regarding crop diversity occur at the household level, few data detail the household context of in situ crop diversity management. Our research addressed this data gap for maize and Phaseolus bean in Oaxaca, Mexico, a major center of diversity for those crops. We defined diversity as farmer-named varieties and interviewed 400 farming households across eight communities in two contrasting socioecological regions. Our research asked, “In a major center of maize and Phaseolus diversity, what are the demographic, production, and consumption characteristics of the households that are stewarding this diversity?” We describe the context of conservation and its variation within and between communities and regions and significant associations between diversity and various independent variables, including direct maize consumption, region, and marketing of crops. These results provide a benchmark for communities to understand and strengthen their maize and bean systems in ways they value and for scientists to support those communities in dynamically stewarding locally and globally significant diversity.

1. Introduction

Research has shown that traditionally based agriculture remains an essential source of food and together with other traditional livelihoods (e.g., fishing, hunting) provides sustenance for as much as 70% of the global population [1], although this estimate is contested [2]. Here, the term “traditionally based” agriculture indicates small-scale production, often managed and worked by households, that uses traditional practices but may incorporate inputs such as commercial chemical fertilizers or tractors. For example, of those employed in maize cultivation in Mexico, an estimated 92% work in traditionally based farms of <5 ha, using low inputs, with most being rainfed [3]. Especially in centers of crop origin and diversity, this agriculture dynamically conserves crop genetic diversity in situ through management practices and ongoing adaptation to changing conditions and is recognized as a complement to ex situ conservation as the genetic foundation for the global food systems we all rely upon [4]. Crop diversity conservation in situ is recognized as an ecosystem service of agriculture [5,6] with benefits at the household, community, and global scales. Key benefits include harvest risk reduction, that is, decreasing the potential for poor harvests over time, and enhanced ability to adapt to changing physical and sociocultural environments [6], which are especially important with accelerating changes in climate, migration, and the industrialization of agriculture. As in situ conservation typically occurs as part of small-scale, traditionally based agriculture, it also supports cultural identity and values [7]. This agriculture can also be the basis for developing future food systems that are environmentally, economically, and socially sustainable, and just [8].
While there have been studies of the regions or communities where crop varietal diversity is maintained in situ, e.g., [9], detailed investigations of household production and consumption of crop diversity are rare, even though it is the unit of decision making for in situ crop diversity conservation [10]. Our research helps to fill this critical gap in two regions of significant crop diversity in Oaxaca, Mexico, by documenting and describing the household characteristics of in situ crop conservation. We followed the definition of the household as a group that is often family-based and shares “production,… distribution,…transmission,…biological and social reproduction, and co-residence” from early work [11] investigating the production and environmental benefits of small scale agriculture managed by the household.
Mexico is the center of origin, domestication, and the primary center of diversity for maize [12] and Phaseolus vulgaris (common bean) [13], and at least two other Phaseolus species (P. coccineus, P. dumosus) [14]. Within Mexico, topographic variation and cultural diversity combine to make the state of Oaxaca a major center of maize and Phaseolus diversity, with wild relatives of both crops present. Oaxacan farmers maintain 35 (59%) of the 59 maize races native to Mexico [15] (referred to as “landraces” in that reference) [16,17] in the form of hundreds of farmer-named varieties. Maize races are groupings first based on morphological, physiological, genetic, and other criteria [18]; varieties are subgroups within races, often identified with an area, that share distinguishing characteristics.
Oaxaca is also the most culturally diverse state in Mexico, with 16 ethnic groups and five indigenous linguistic families comprising 176 language variants. The majority of maize farming households in the state and in the two regions included in this study are at least partially self-provisioning for their maize food needs [9]. In addition to having high levels of crop and cultural diversity, Oaxaca also has high levels of poverty, low levels of formal education, and, in some communities, low masculinity indices due to male outmigration (Table 1).
Our study builds on an extensive survey of maize racial diversity in the state of Oaxaca primarily conducted during 2004–2005 which included phenotypic and agronomic characterizations [16]. In 2007, we interviewed farmers in eight communities in the Sierra Juárez (SJ) and Valles Centrales (VC), two of the eight regions of Oaxaca documented in that earlier survey. Our research was intended to complement the maize survey and had two goals. First, describing basic household characteristics (including labor migration, farming practices, farmer-named maize and Phaseolus bean diversity, farmers’ attitudes toward risk in agriculture, and their hopes for the future). Our second goal was to use these data to test the null hypotheses that household characteristics (a) do not vary significantly between communities in a region or between regions, and (b) that there is no association between the number of farmer-named maize and bean varieties maintained by the household and other household characteristics. This data article provides a broad picture of traditionally based farming households facing both social and environmental changes in an important center of crop diversity, as well as insights into the practices households use to meet their farming goals. The characteristics and practices documented here and the local empirical knowledge they are built on are critical elements of the “complexity of local situations”—the combination of biophysical and sociocultural factors that require adaptations to the challenges of the Anthropocene that are distinct, participatory, and locally crafted [22]. Our results can serve as a baseline for future research with communities into practices they may wish to pursue to achieve their own goals for these adaptations.

2. Materials and Methods
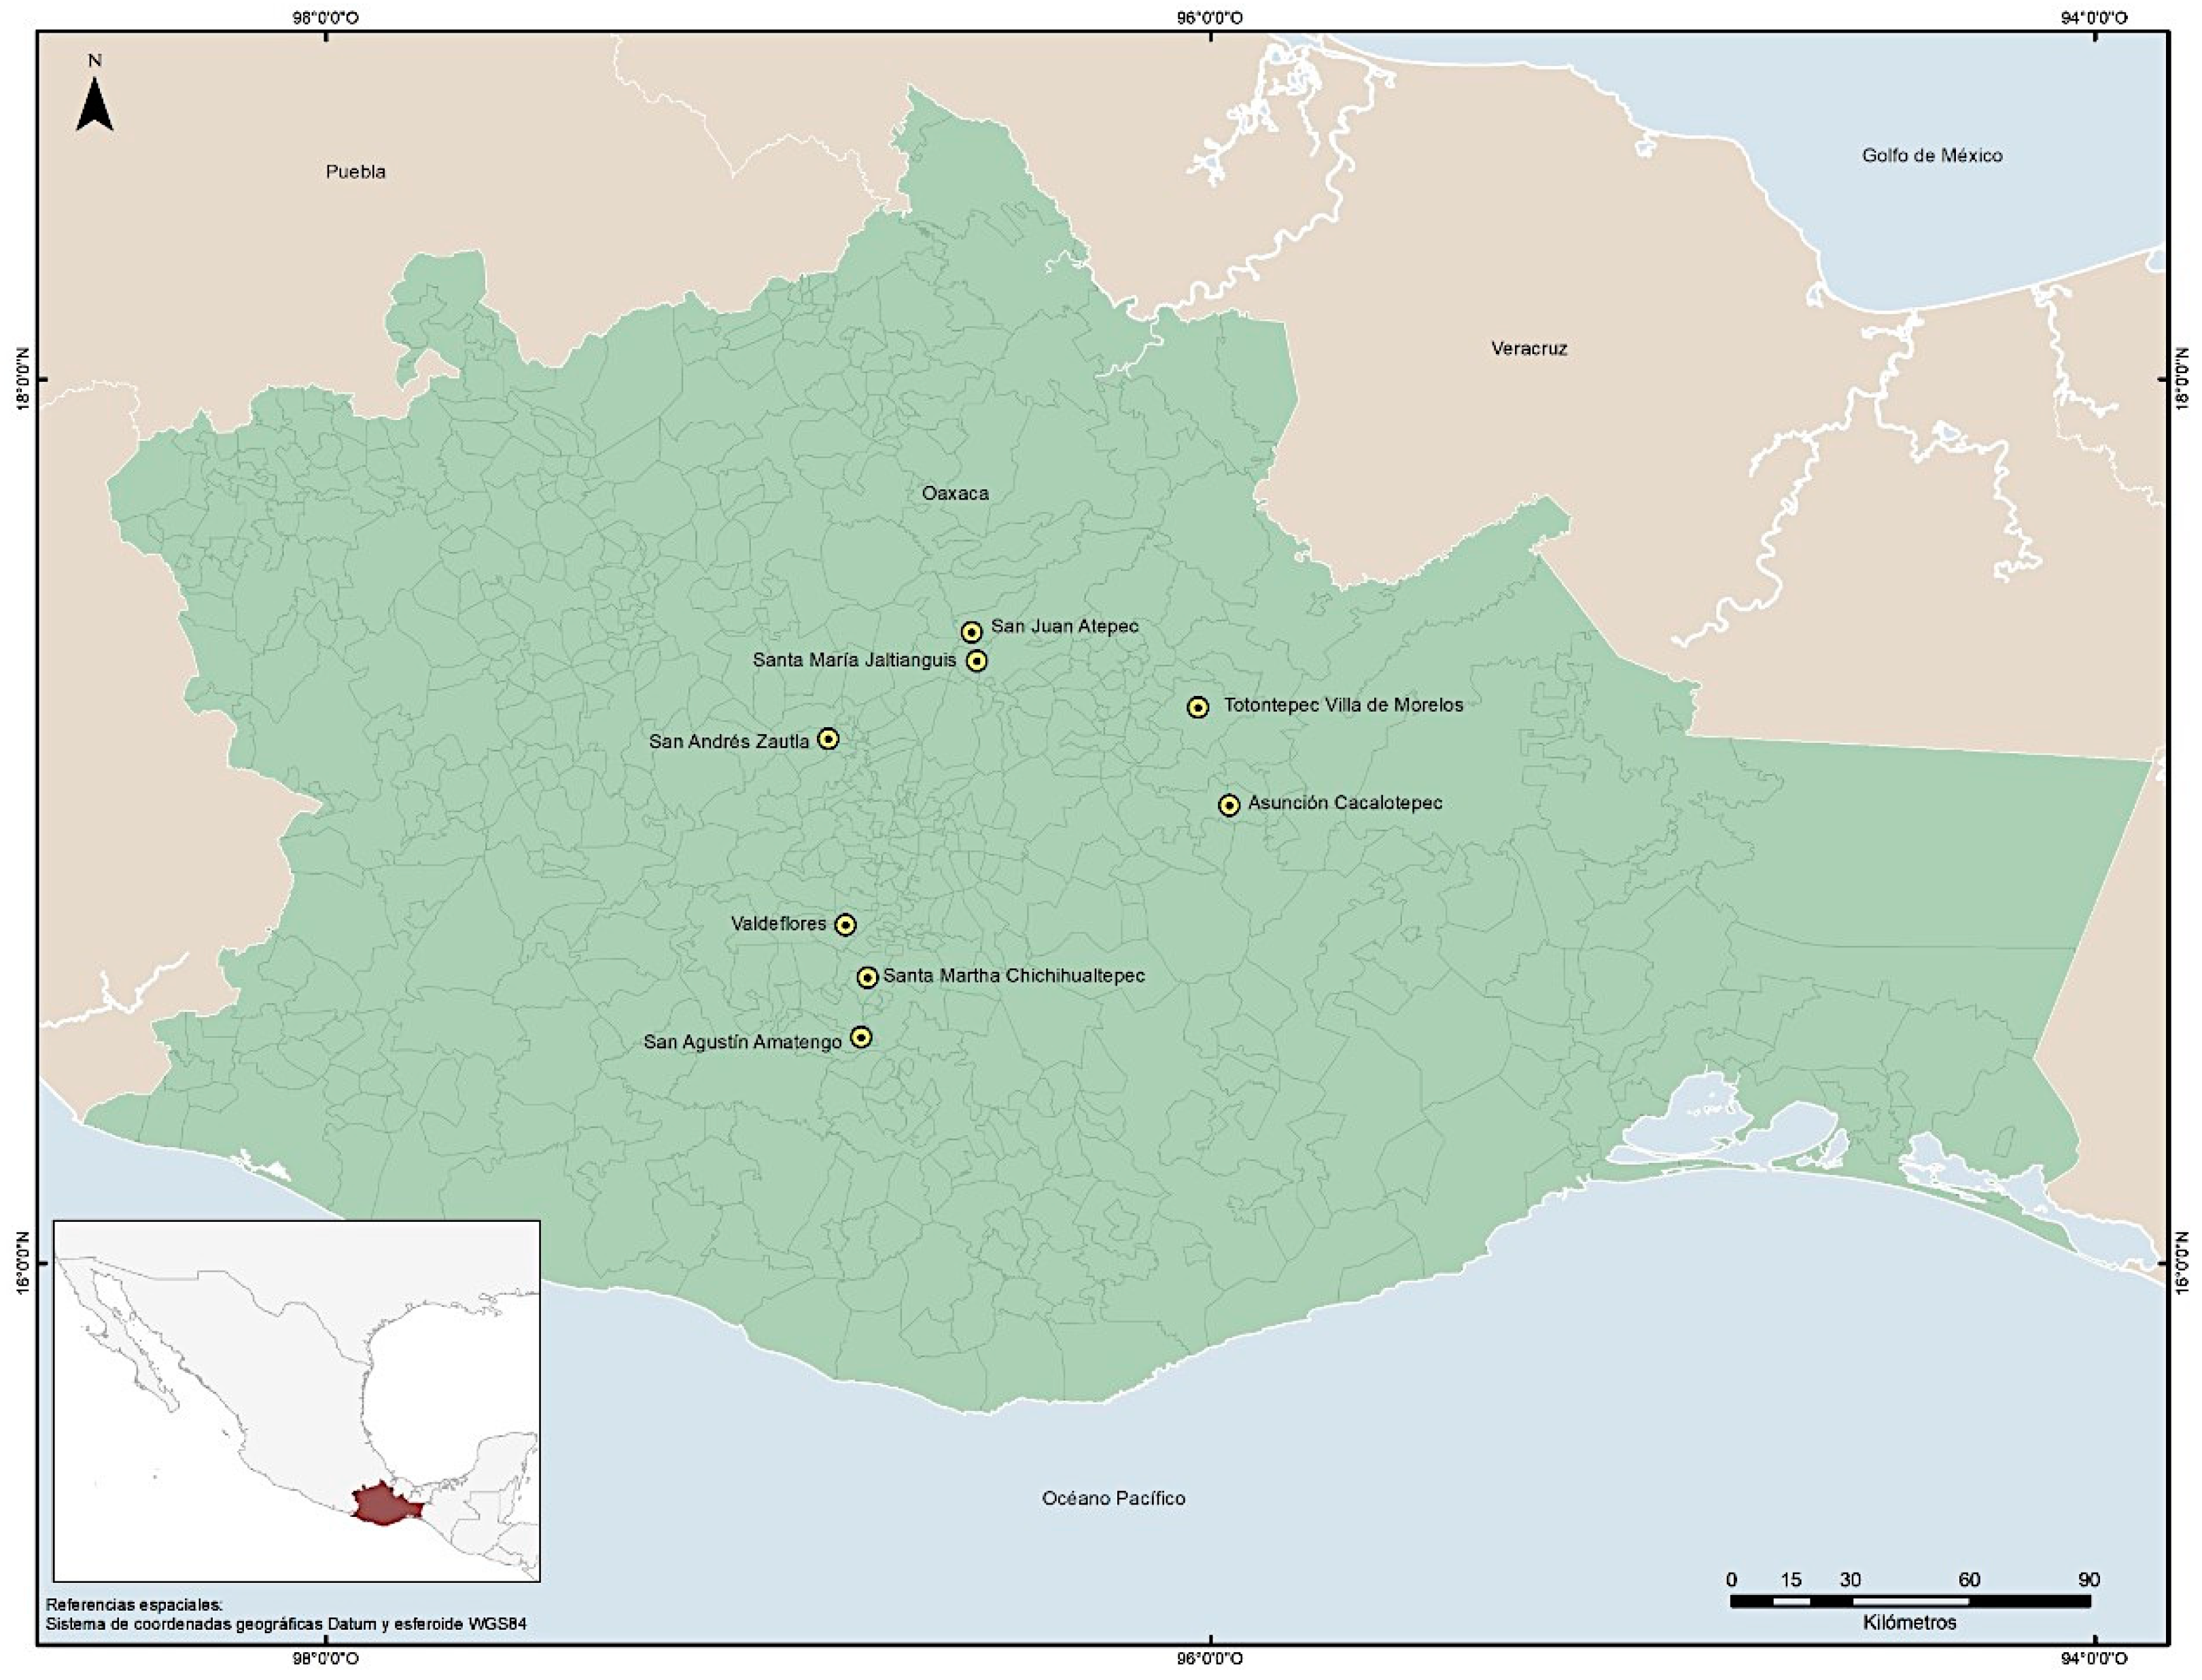
2.1. Study Sites

We conducted our study in two of the eight regions of Oaxaca documented by Aragón Cuevas et al. in their survey of Oaxacan maize racial diversity [16]. Based on that previous work, we selected the SJ region, which had the highest maize racial diversity (n = 7 primary races present), and the VC region, which had the greatest total area planted with traditional or farmers’ maize varieties (maices criollos, 120,000 ha). Within each of those regions, we selected four communities that were in the original maize survey and that represented contrasting growing environments within the region (Figure 1, Table 1), as well as the primary cultural groups in each region: Mixe and Zapotec in SJ, and mestizo in the VC.
The IRB of the University of California, Santa Barbara, approved our research protocol and survey instrument—an interview questionnaire—after which we received permission from municipal authorities to work in each community. We obtained complete lists of adult residents, by household and, where relevant, by neighborhood, from the local health clinics and created a random sample of adult household heads (male or female, as appropriate) in Santa María Jaltianguis and Asunción Cacalotepec, which did not have defined neighborhoods, and a stratified random sample, including all neighborhoods in the six other communities. In each community we interviewed 50 households. All households in our samples grew either maize or bean, or both. Published government data provide a general overview of those communities (Table 1). Although 50 households community−1 were interviewed, the sample size differed for some variables due to lack of response or for variables that were nested, for example, the amount of maize sold relative to household consumption was only relevant to households selling maize.

2.2. Interview Questions

The interview questions addressed five topics. First, farmer-reported maize and bean diversity in terms of named varieties. Second, household demographics, including age, sex, education, and primary language of the interviewee, household composition, and labor migration. Third, maize and bean farming practices, including seed sources, planting environments, production inputs, and yield estimates. Fourth, household use of maize and bean harvests, including direct consumption as food or feed, and sales. Fifth, values in farming, specifically attitudes toward risk and expectations for the future.

2.2.1. Farmer-Reported Maize and Bean Diversity

We used three indicators for region- and community-level maize and bean diversity: (a) richness or the number of farmer-named varieties being grown in 2007; (b) the proportional abundance of farmer-named varieties and the derivative calculation of divergence; and (c) maize population size, measured in kilograms of seed planted of a farmer-named variety in 2007.
All three indicators are based on farmer-named varieties, a commonly used metric in surveys of farmer crop diversity, both because it is relatively easy to document and because it reflects farmers’ own understanding of their crop diversity [10]. Other research has demonstrated that farmer-named varieties can underestimate genotypic diversity, combining distinct genotypes, varieties, or even species (homonymy or “lumping”), for example, in self-pollinated crops, including rice in Guinea, West Africa [23], and bean in Oaxaca [24,25]. However, the opposite (synonymy or “splitting”) has also been documented. For example, genetic analyses of farmer-named bean varieties or varietal groups in Oaxaca demonstrated that they can sometimes be more specific and complex than those of outside “experts,” even encompassing distinctions at the level of subpopulations of an ecogeographic race [24]. One bean study in Oaxaca found variation in varietal classifications among farmers within a community [25], and varietal classifications are likely to be even more variable and complex in maize because it is cross-pollinating, in contrast to the predominantly self-pollinating P. vulgaris. For example, Pressoir and Berthaud [26] found that variation in flowering duration and anthesis silking interval in local maize populations in the VC created within-population structure (e.g., excess homozygosity and a Wahlund effect) not anticipated based on seed system practices or molecular markers. Undoubtedly, both homonymy and synonymy are present in the classifications we report here.
Our first indicator, richness or number of farmer-named varieties, is a count of those varieties at the household, community, and regional levels. Since farmers’ varietal names are an imprecise measure of crop genetic diversity (see, e.g., [25]), we were conservative with our counts based on these names both within and between communities in the same region. For example, if the yellow maize planted in high- and low-altitude fields was given the same generic name (local yellow maize, amarillo criollo), we did not distinguish these as different, despite evidence that farmers often allocate different maize and bean varieties to differently named elevational environments [24,27]. This makes our estimates especially conservative for SJ communities in cases where farmers did not report different names for the seed lots planted at different elevations. On the other hand, if farmers told us that they grew two types of high-altitude, local white maize that have distinct names, we classified these as two different varieties. Similarly, for regional totals we counted crop varieties with the same name from different communities in the same region as the same, even though they may be different. For example, we counted as one variety a small, black-seeded P. vulgaris of the Mesoamerican ecogeographic race with a bush growth habit grown in all four SJ communities; in the two SJ Mixe communities (Cacalotepec and Totontepec) it is referred as Möötsk xëjk and is known in the two Zapotec SJ communities (Atepec and Jaltianguis) as Daá güin-nii but it is also called by the Spanish name Delgado by some members of each of these communities. Thus, both community and regional named variety counts reported here are deliberately conservative.
Our second indicator of crop diversity, proportional varietal abundance, was calculated as Simpson’s Index of Heterogeneity (SI) (where SI = 1 − D) [28], estimated using the number of farmer-named varieties and their frequencies (see Section 2.3 for details). We also measured a derivative of SI, the divergence of diversity, or the allocation of varieties among and between study units, e.g., in a community vs. in households there, and in a region vs. in communities there [10,29].
Our third indicator of diversity was crop population size measured as mean kilograms of maize seed sown variety−1 in 2007 and as the change in total kilograms of maize sown between 1987 and 2007. The amount of seed sown is a better basis for comparing crop population sizes than area sown because of the range of planting densities across different environments, with no sowing rate area−1 being consistent across locations in this study. Maize seed sown was often reported in almudes, a volumetric measure common in Oaxaca and other areas invaded and occupied by Spain. We converted almudes to kilograms based on standard conversions unique to each community which ranged from 4–6 kg almud−1 due to differences in the seed size of the maize varieties grown.

2.2.2. Interviewee Characteristics and Household Demographics

In addition to basic information about the interviewee, who was most often the head of household, we also documented household composition and labor migration over the previous 10 years.

2.2.3. Maize and Bean Seed Sources and Farming Practices

We asked farmers where they obtained maize and bean planting seed, whether they planted modern varieties, and about other potential sources of geneflow, as well as about their use of agrochemicals and organic fertilizers. Farmer yield estimates were used to calculate yields kg−1 seed sown using the triangulation method [30,31]. Yield calculations for bean were separated into bush- and vining-type growth habit.

2.2.4. Use of Maize and Bean Harvests

We asked farmers about the amount of maize and bean their households consumed, whether or not either crop was sold, and, if sold, the amount sold relative to household consumption.

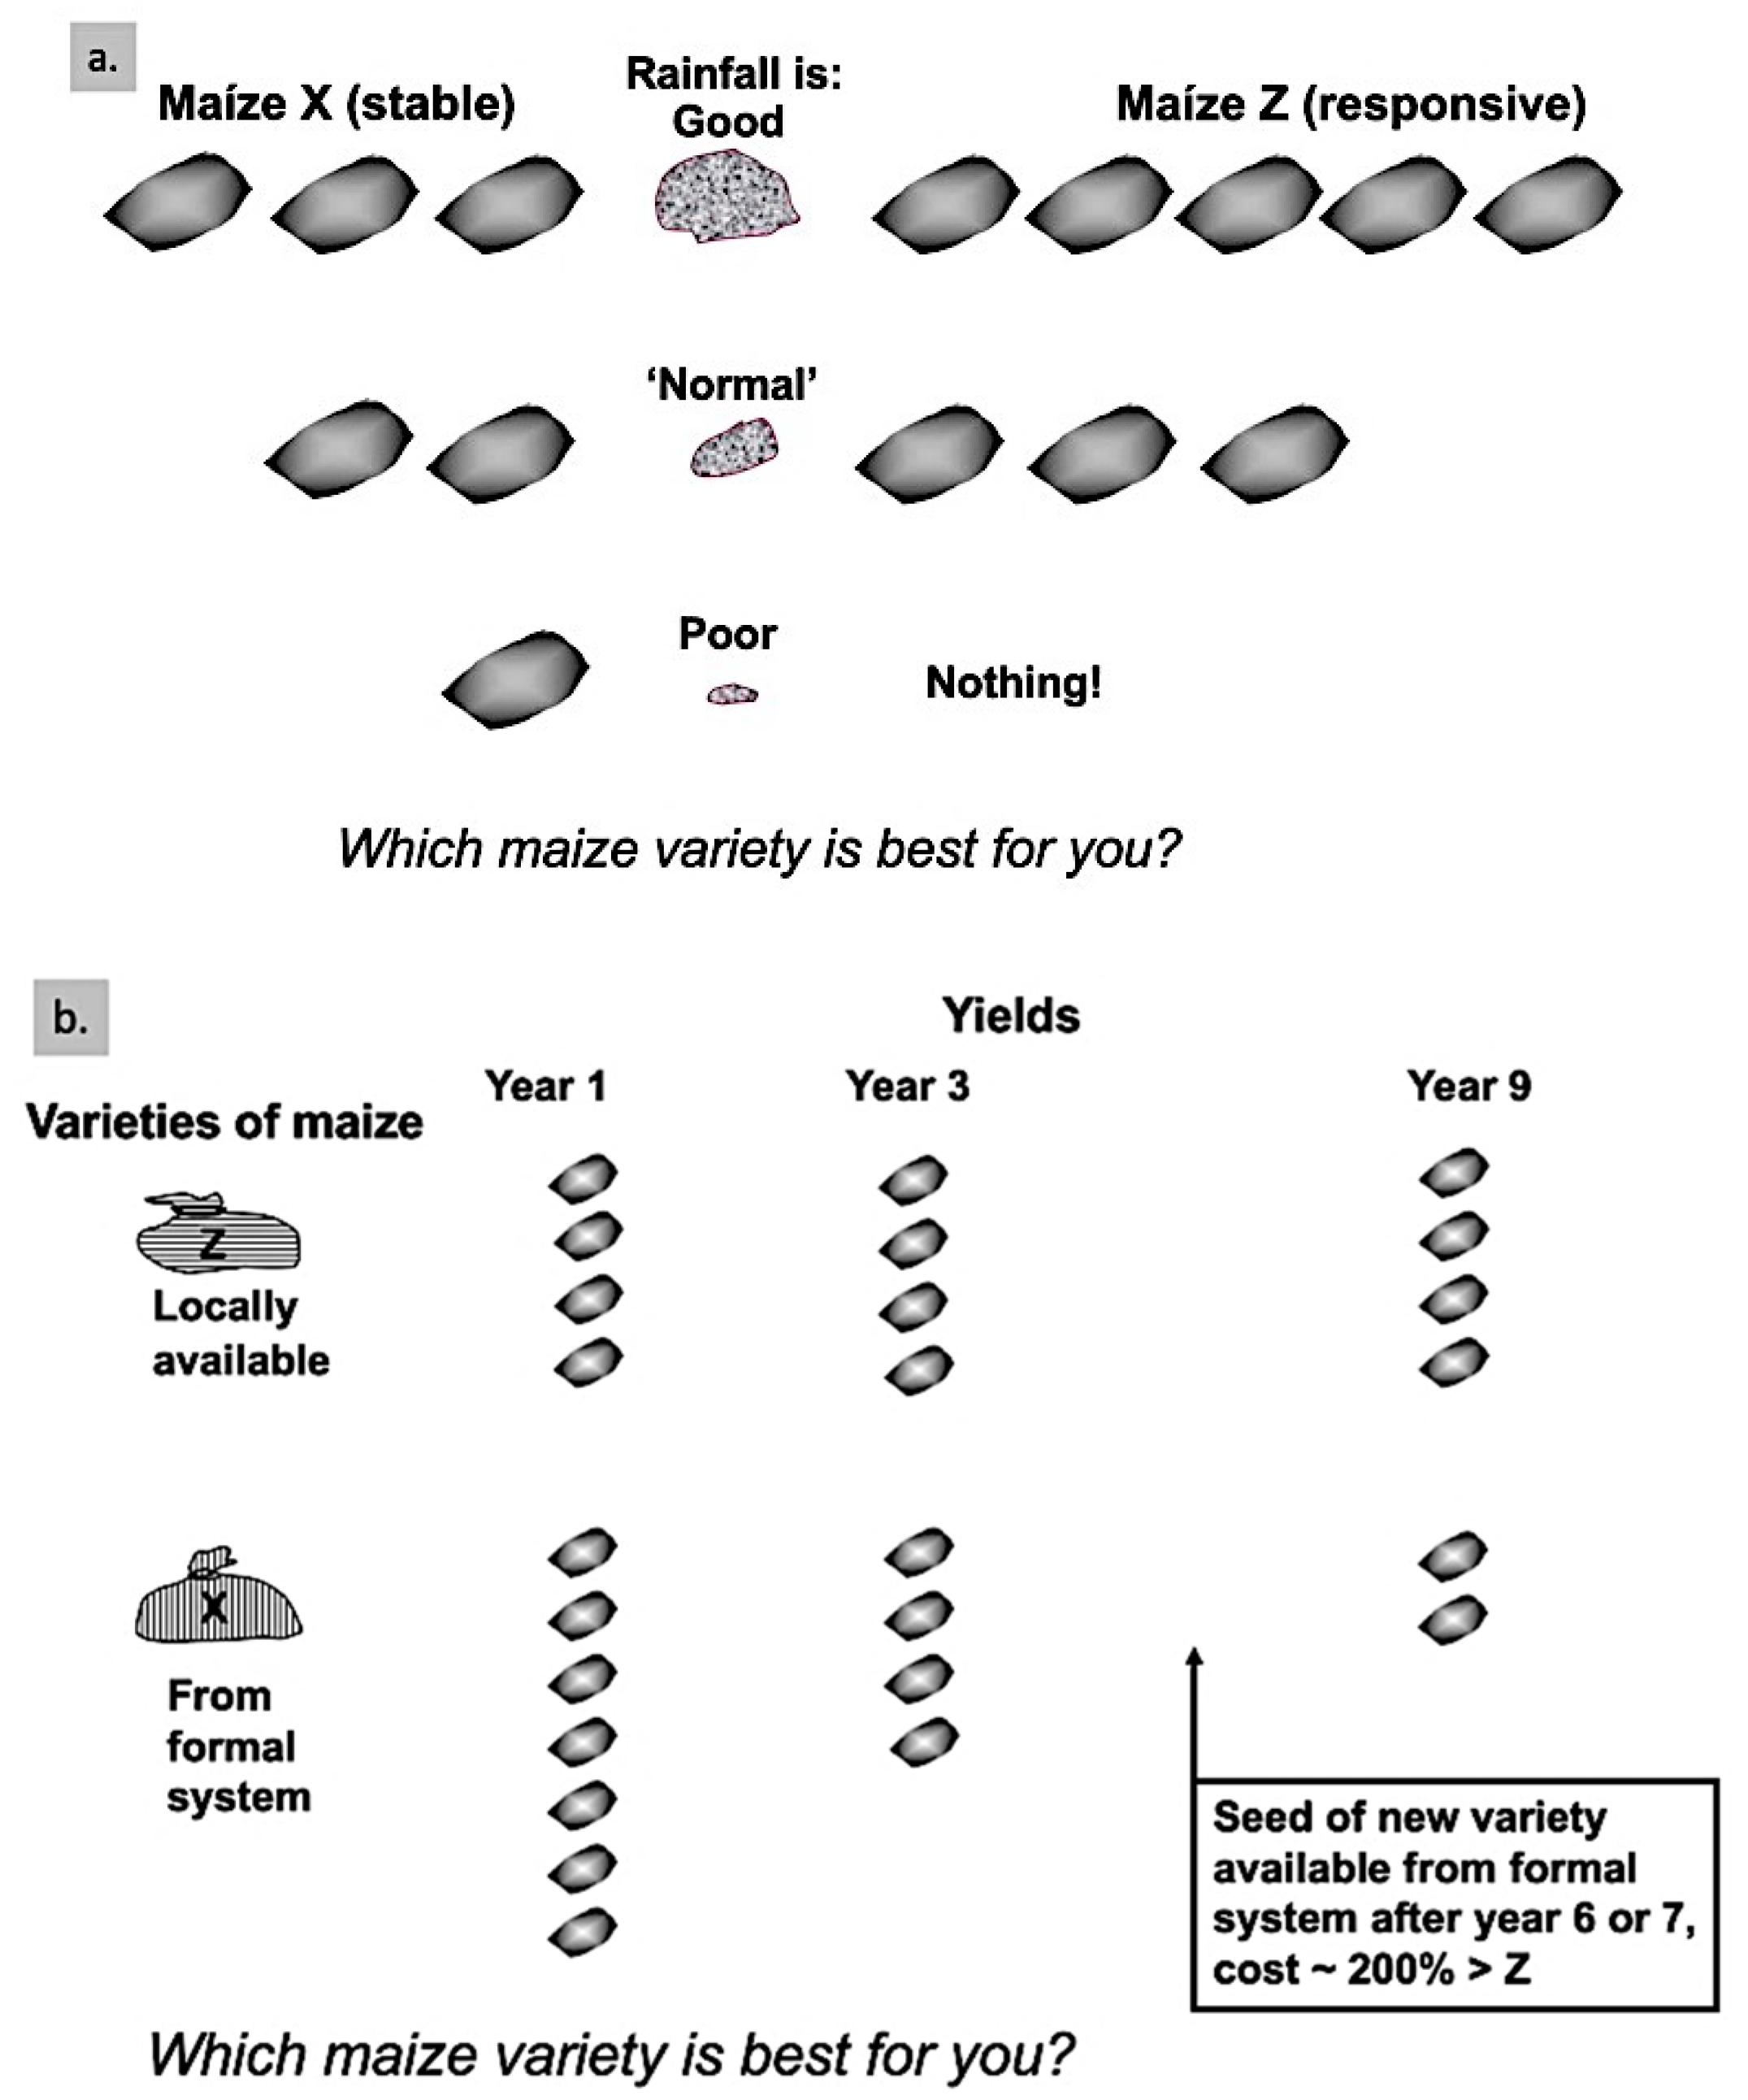
2.2.5. Attitudes toward Risk, Expectations for the Future

We assessed attitudes toward risk through two previously described scenarios [32,33] (Figure 2). For the first scenario, regarding the value of yield stability over time, farmers were asked to compare two maize varieties: one with yields highly responsive to rainfall; the other with more stable, less responsive yields, but with relatively higher yields under poor rainfall conditions. The hypothetical maize varieties were described as being exactly the same in every other way.
The second scenario also presented a comparison between two contrasting maize varieties: the first with relatively stable yield and locally available seed; the second with initially very high yield and seed that must be acquired from the formal seed system, at twice the cost of seed of the stable variety. Yield of the responsive variety would decline over approximately six years to a level lower than that of the stable one, but at that time seed for another variety with high initial yield would become available from the formal seed system. The responsive variety represents a maize variety with a transgene that provides effective protection from a pest that reduces yield in the local growing environment (similar to Bt maize). However, over time, evolution of resistance in the pest population would render the transgene ineffective and yield would drop below the levels of the local stable variety. The two varieties were described as being in every other way the same and were referred to as varieties 1 and 2. The term “transgenic” was never used in this scenario, which was presented before any question or discussion about transgenesis was introduced in the interviews.
Next, we provided farmers with a description of transgenesis as a “process conducted in laboratories by scientists in which properties from other living organisms such as other plants or animals could be inserted into a seed, in this case maize. After this process the seed could be planted and would grow as normal maize but the plant would contain that property.” We also presented the example of a microscopic soil organism with the property of resistance to caterpillars, and that property could be inserted into maize, making it resistant to caterpillars (as is the case for Bt maize). After this description was given, we asked the farmers if they thought this technology itself was good, bad, or whether its value depended on the results.
To ascertain farmers’ personal perspective on the future of farming in their community, we asked interviewees if they hoped young people in their community would continue to be maize and bean farmers in the future, and then asked them if they actually believed youth would continue to farm.

2.3. Analyses

Analyses were conducted in RStudio, version 2021.09.2 build 382 [35]. We screened quantitative variables for normalcy with the Shapiro–Wilk test [rstatix package; other packages bracketed below]; where appropriate we followed the non-parametric Kruskal–Wallis [rstatix] test by a Dunn’s Test [FSA], otherwise we used one-way ANOVA [stats] tests. We analyzed qualitative response variables with chi-square tests [rstatix], and hypotheses regarding associations between household characteristics and maize and bean varietal diversity with logistic regression analysis [stats], with independent variable collinearity screened by variance inflation factor [car], model fitting ascertained based on minimizing regression AIC, maximizing accuracy calculated by repeated k-fold cross-validation [caret; n = 3, reps = 3], and log odds ratios from these logistic regressions plotted on a log scale (see Figure 3). Farmer-named crop variety diversity was described as richness and as proportional abundance, expressed as the Simpson Index of Heterogeneity (SI) [vegan], with (SI = 1 − D; D = p i 2 ) and pi = proportion of individuals in the ith variety, following [28]. We used divergence [10] or “proportion of diversity residing among populations” [29] to describe diversity among community vs. household levels, calculated as (Community SI—mean household SI in community)/Community SI; and at region vs. community levels, calculated as (Region SI—mean community SI in region)/Region SI. Statistical significance was assigned at p ≤ 0.05 throughout.

3. Results and Discussion

Our results provide a detailed description of the household context of in situ conservation and use. While many variables did not have significant associations with diversity, they are nonetheless important for understanding that context and anticipating possible trends of change, for example, rates and destinations of labor migration, levels of consumption, sources of seed, and potential for gene flow. All data are available through the public data repository Dryad https://doi.org/10.25349/D9SC9W (accessed on 6 June 2022).

3.1. Farmer-Reported Varietal Diversity in Maize and Bean

We documented the diversity of farmer-named maize and bean varieties across eight Oaxacan communities, measured as richness, proportional abundance (SI) and divergence, and overall population size (only for maize).

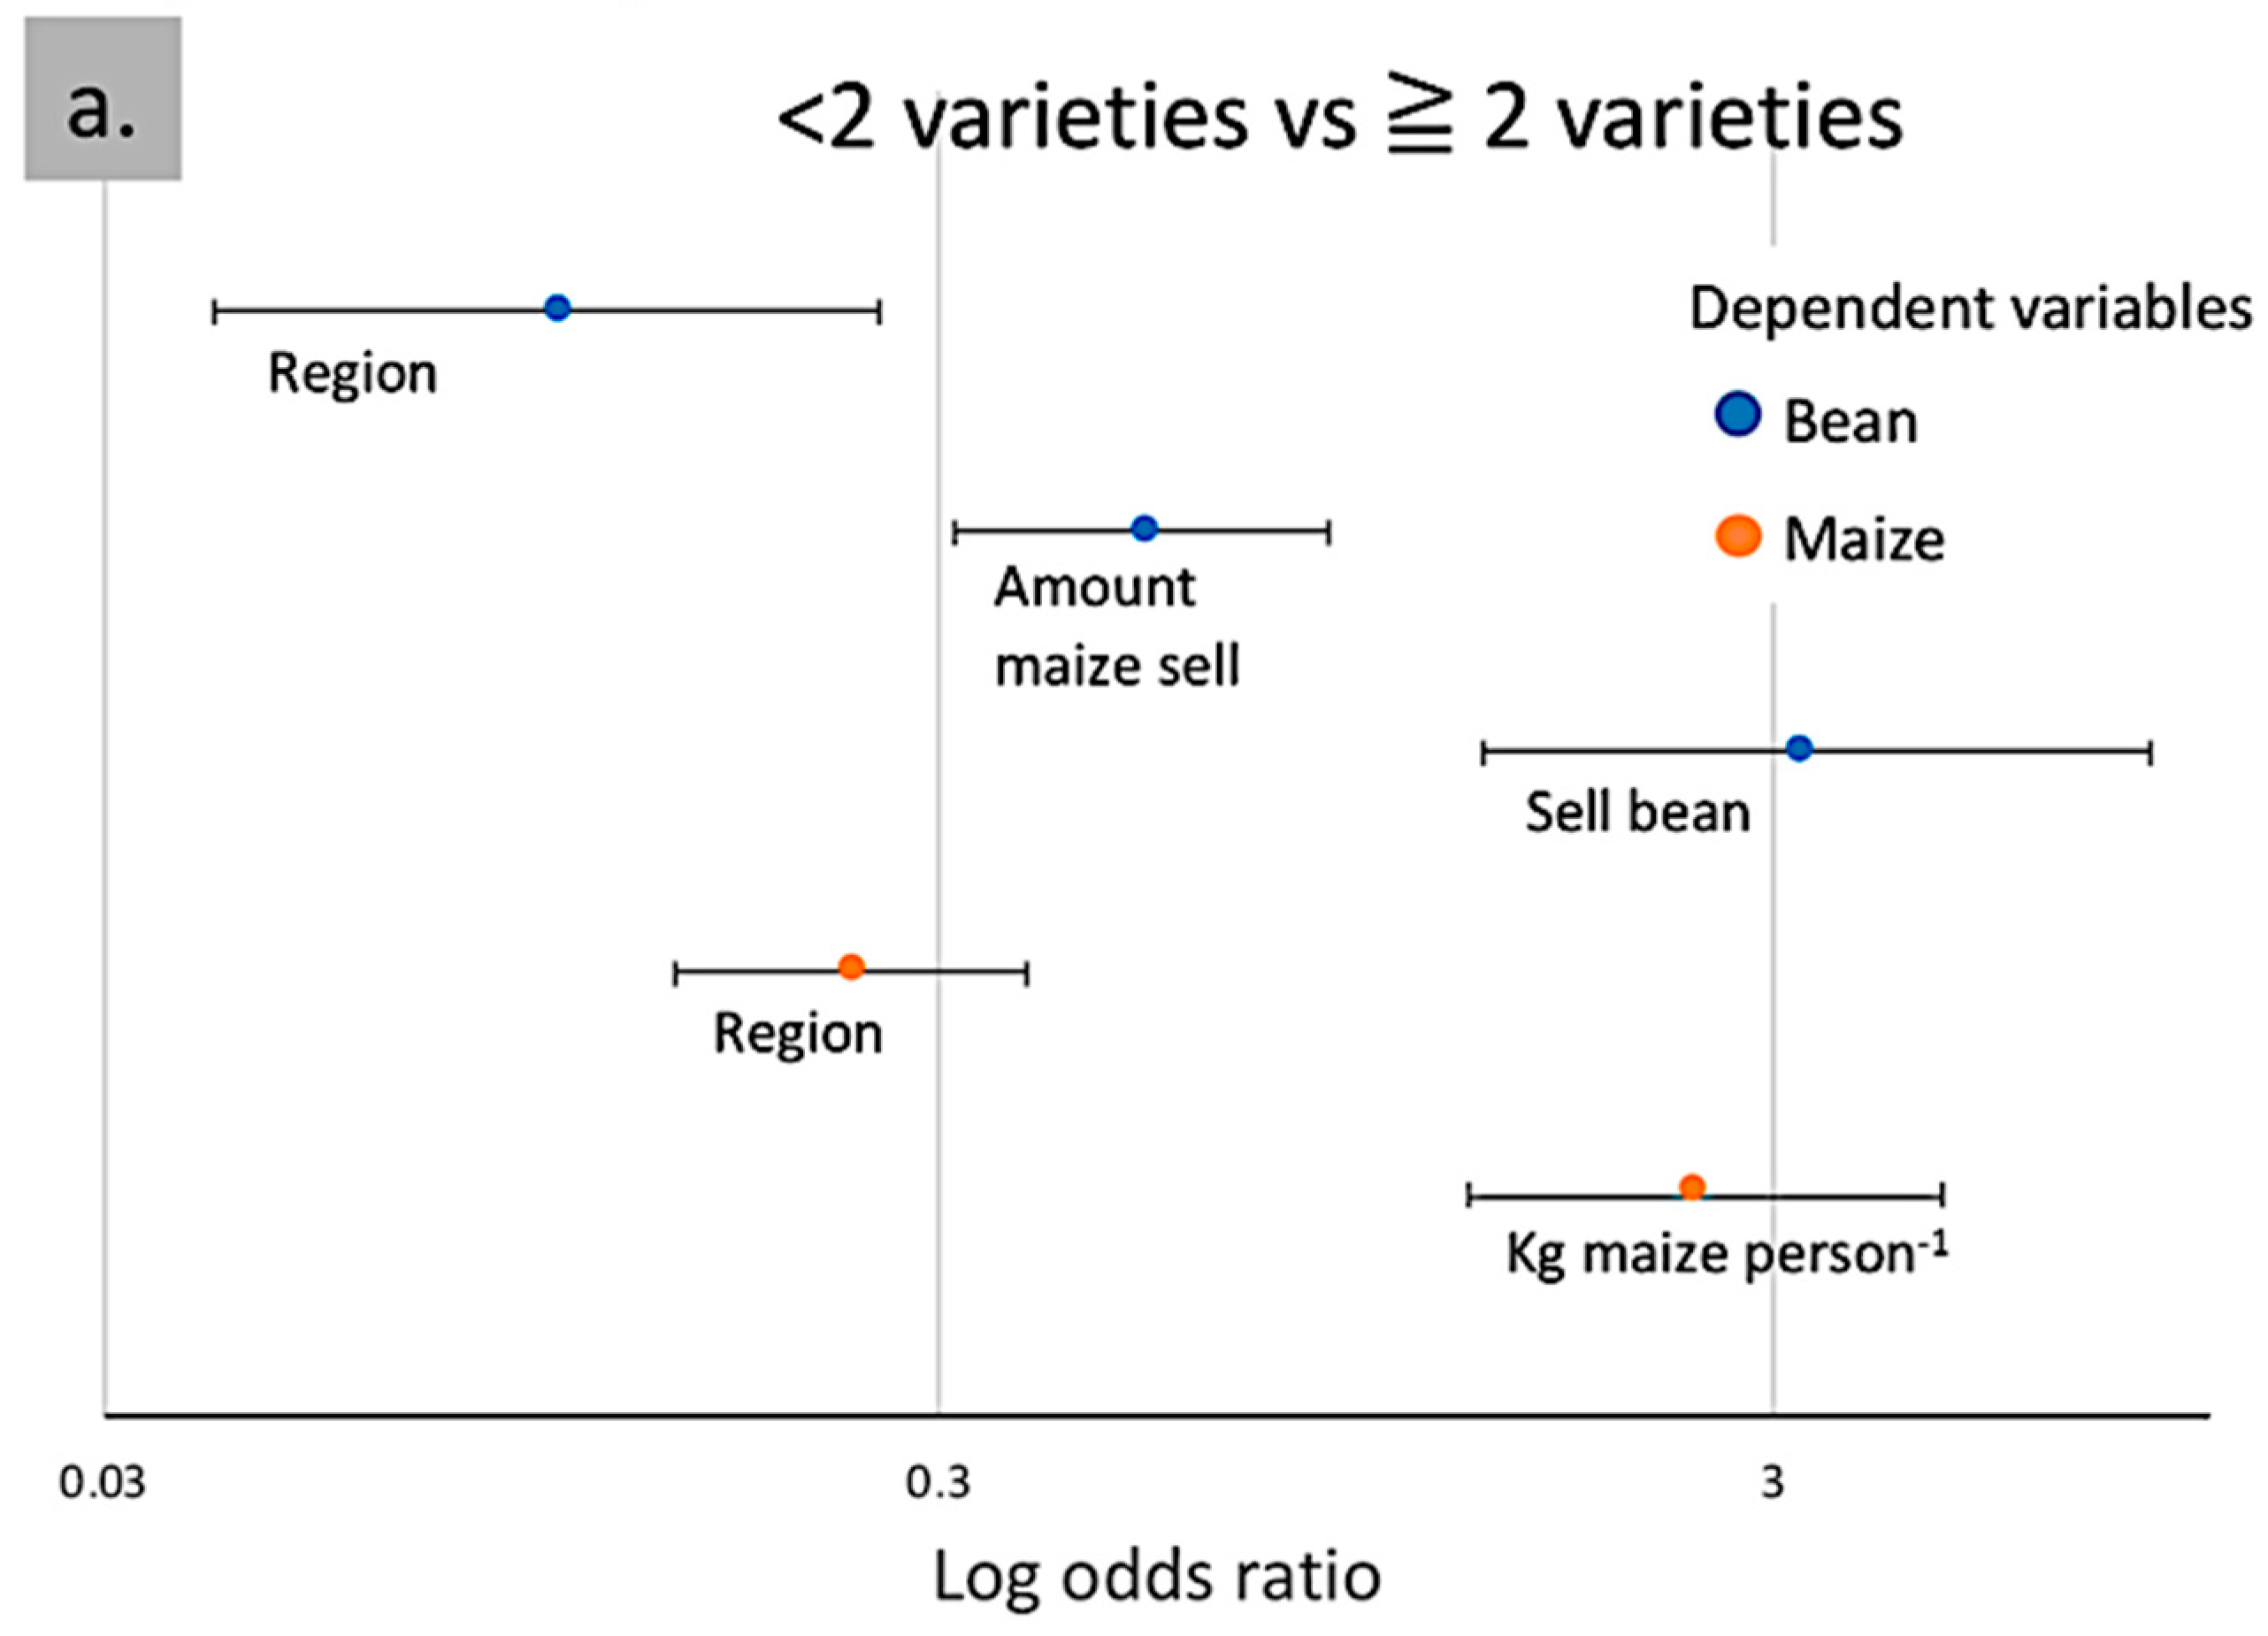
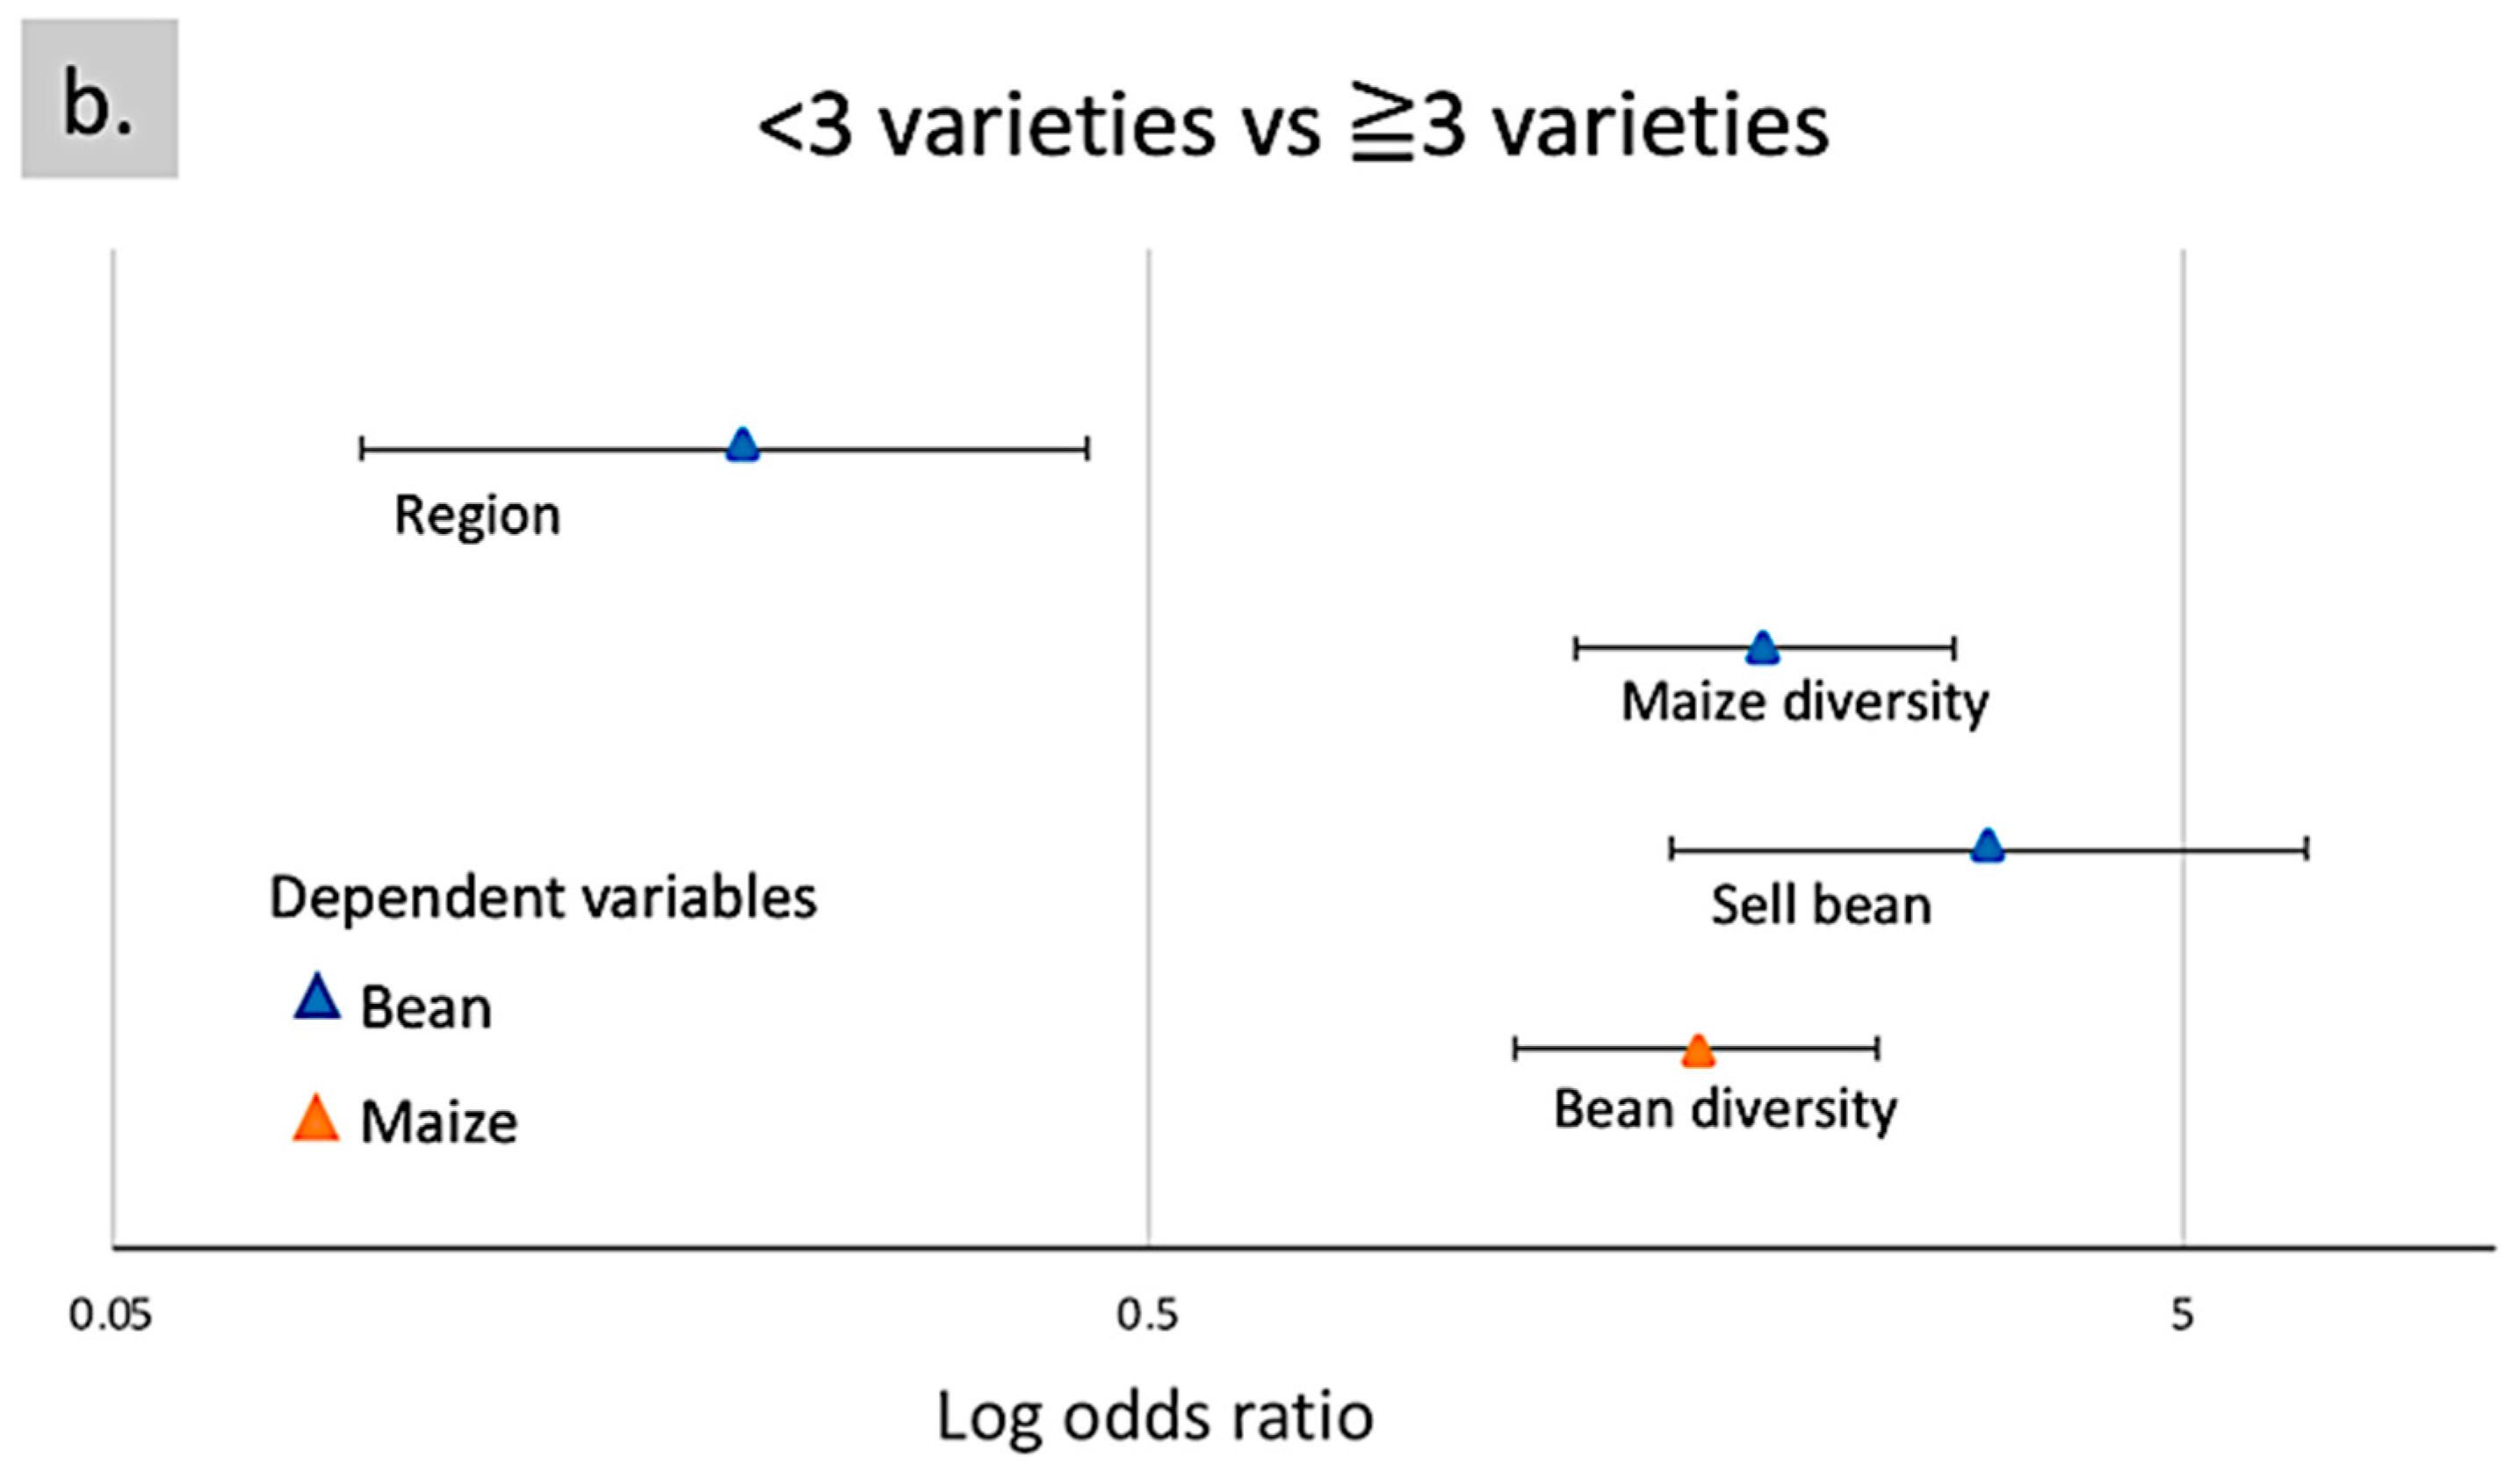
3.1.1. Richness (Number of Farmer-Named Varieties)

Seventy-three percent of households interviewed grew both maize and beans in 2007. In the SJ, 20 households (10%) did not grow beans, and one Totontepec household did not grow maize; in the VC, 84 households (41%) grew no beans, and one household in Zautla did not grow maize (Table 2). One household in each of Cacalotepec and Amatengo reported growing five maize varieties; two Valdeflores households grew four maize varieties, with one out of four and three out of four of those being modern varieties. The nearly universal cultivation of maize (99.5% of households) reflects the economic, cultural, social, culinary, and nutritional significance of the crop [7,36,37]. Maize production is important for subsistence, even for households receiving migrant remittances or participating in wage labor locally (see the comments about farming and the future, Section 3.5.2).
We found higher mean maize varietal richness in the SJ and larger maize population sizes in the VC, parallel to Aragón Cuevas et al.’s general finding [16] that more maize racial diversity is maintained in the SJ, while in the VC significantly more kilograms of maize, and thus larger maize populations, are sown (Table 2). See Tables S1a,b for the names of bean and maize varieties that farmers reported growing in 2007. We found the same pattern of greater varietal diversity for bean in the SJ compared to the VC. Farmers reported non-Phaseolus species that they also classified as “frijol” (“bean”), but we did not include these varieties in the bean diversity counts because Oaxaca is not their center of origin, domestication or diversity: frijol Chivo (Vigna unguiculata—Santa Marta Chichihualtepec n = 26); chícharo/Poopxëjk (Pisum sativum—Cacalotepec n = 2, Zautla n = 1); frijol Nescafe (Mucuna pruriens—Amatengo n = 1).
In the SJ, farmers who continue to plant tierra caliente (see Section 3.3.2 and Table S3 for descriptions of the growing environments) sowed large quantities of beans (mean planting, 4.3 kg), predominantly with the delgado variety as a sole crop, relative to the amounts of beans sown in tierra templada (1.12 kg) and tierra fría (0.24 kg). For example, one household in the SJ plants 96 kg of delgado, while also planting “handfuls” of two other varieties, each in different tierra fría fields. In that region, many households described a shift over time to a focus on smaller plantings closer to their community to reduce walking and avoid losses due to field damage by animals—a trend of environmental contraction in SJ agriculture noted by other researchers [38].
To assess the impact of independent variables together on varietal richness, we expressed varietal richness at the household level in the form of two binomial dependent variables: as either less than two or two or more varieties; and as either less than three or three or more varieties (Figure 3, for model information for logits included in Figure 3, see Table S2). We then investigated the association of each of these two richness variables with the independent variables documented. Across our entire sample, households directly consuming more maize person−1, and households in the SJ were more likely to grow two or more maize varieties (Figure 3a), while households selling beans were 3.3 times more likely to have two or more bean varieties. However, increasing the amount of maize sold, defined as less than, equal to, or greater than the amount consumed (a proxy for market orientation of maize farming), meant that households were less likely to grow two or more bean varieties.
Similarly, selling beans made households 3.3 times more likely to grow three or more bean varieties, and for each maize variety grown households were two times more likely to grow three or more bean varieties. Households were 1.8 times more likely to grow three or more maize varieties for every increase in the number of bean varieties grown (Figure 3b).
The contrast between variables associated with growing two or more vs. growing three or more varieties of each crop (see Figure 3) suggests a qualitative threshold in the determinants of household varietal diversity maintenance between two and three varieties: (a) households growing three or more varieties may be intentionally focused on diversity because diversity in one crop was positively associated with diversity in the other; and (b) households growing two or more varieties may be doing so for reasons other than to maintain diversity; for example, growing two or more named bean varieties was associated with selling beans, not selling large amounts of maize and being a SJ community, and growing two or more maize varieties was associated with kilograms of direct daily maize consumption person−1.

3.1.2. Proportional Varietal Abundance and Divergence

SI and divergence describe the structure of diversity at different scales and are the most useful indicators for this study. Using these indicators, we found some differences in the structure of varietal diversity between crops and regions (Table 2). Proportional varietal abundance, calculated here using Simpson’s Index of Heterogeneity (SI), describes the likelihood that randomly chosen populations of the same crop in a region or community will be of different varieties; higher SI values indicate that for a given crop the proportion of each variety is relatively evenly distributed, not dominated by a single variety. As with richness, SI in the SJ compared to in the VC was higher for both crops and the differences between communities were smaller, indicating a more even distribution of varieties across the SJ region. However, there was also variation between communities in each region: SI was substantially lower for bean in Totontepec (SJ) and in Zautla and Valdeflores (VC) than other communities in their regions, and lower for maize in Zautla (VC) than other communities in the VC. These results suggest a less even distribution of crop diversity in these communities and therefore the value of more extensive sampling from different households to capture the full extent of diversity.
While SI indicates the proportional abundance of varietal diversity within a unit such as a community or region, divergence describes the structure of that diversity in regions and their constituent communities, and in communities and their households. A higher divergence estimate indicates diversity present across the larger unit, for example, a region, while a lower estimate indicates diversity stratified into subunits, for example, the communities that comprise a region, with some varieties absent in some communities. For maize and bean at the regional level, divergence estimates are low (≤0.20) in both regions, with some varieties only grown by some communities.
Divergence estimates for bean at the community level in the SJ were lower than in the VC, meaning that in the SJ a larger proportion of bean diversity was not present in all households within a community. However, Totontepec differs from other SJ communities with a greater proportion of bean varietal diversity maintained at the community instead of the household level, indicating more widely grown varieties. The pattern for maize is similar to that for bean, but with much lower regional divergence estimates, especially in the SJ, indicating diversity due to different communities growing distinct named varietals. For both crops, more named diversity is maintained among households than at community levels in the SJ compared with the VC, again emphasizing the need to sample extensively among SJ households to capture that diversity.
The proportion of rare varieties is an important factor affecting SI and thus divergence estimates. If we define as “rare” varieties grown by fewer than 10% of households in a region (≤20), then rare maize varieties comprised 84% (SJ) and 86% (VC) of named maize varietal diversity. Rare bean varieties comprised 76% (SJ) and 65% (VC) of regional named bean varietal diversity, contributing to the slightly higher regional divergence in SJ compared to VC.

3.1.3. Maize Planting Population Size and Change

There were regional differences in the extent of maize farming, measured as amount of seed sown variety−1 in 2007, and in change, measured as the difference between total kg maize sown annually in 1987 and 2007. In 2007, only 12 kg of seed was planted per maize variety in the SJ, compared with 39 kg in the VC (see Table 2c), which may be due to the SJ’s variable topography, resulting in smaller cultivable areas, and because forestry and non-timber forest products provide land-based sources of livelihood in the SJ not available in the VC.
In both regions, there was a decline in total kilograms of maize seed farmers reported sowing between 1987 and 2007 (Table 2c). This change was not statistically different between regions, but the biological significance may be greater in the SJ where total maize population size was, and is, much smaller. In addition, plants, including crops, adapted to higher elevations are most threatened by the warming of the anthropogenic climate crisis through loss of appropriate habitat [39].
Large reductions in kilograms of maize seed sown by two households in San Juan Atepec were comparable with maximum reductions in other communities, but the small sample size (n = 8) in that community for kilograms of maize planted in 1987 made it inappropriate to include Atepec in the combined community and regional descriptive statistics.

3.2. Interviewee and Household Characteristics

The first languages of 96–100% of interviewees in the SJ communities were the indigenous Zapotec and Mixe languages compared with 100% Spanish in the VC communities (Table 3). Mean household size and number of adult females and males were not significantly different. The proportion of household members that were children was higher in the SJ.
Labor migration is a significant investment for these farming households; a majority sent out labor migrants at some point in the previous 10 years, with the USA the single most common destination. Over 60% of households across both regions had members migrating for work between 1997–2007 (Table 4), but migrant destinations and the proportion of households participating differed by sending region and community (Figure 4). For example, compared to SJ, more VC households sent migrants to the USA and more migrants household−1 to that destination. More SJ households sent migrants to destinations in Mexico, as well as more migrants per household to those destinations, though this difference was not significant. Mean numbers of male and female migrants reflected the same patterns as published indices of masculinity (Table 1), with the exception of Cacalotepec.
Within regions, communities also differed in the proportions of households sending out migrants in the previous 10 years and in the numbers of migrants sent to destinations in Mexico and the US. Three communities, Atepec, Cacalotepec (SJ), and Zautla (VC), had higher proportions of households sending members to Mexican destinations than to the US.
We found no consistent, significant associations between maize and bean diversity and migration prevalence, number of migrants, or migrant destination (Figure 4). We speculate that this is likely due to variations in variables we did not quantify, including remittance practices and amounts [38] and the different ways in which recipient households use remittances. Some households described using remittances to enhance agriculture through purchases of land, labor, and equipment, while others used remittances to support a transition away from agriculture, e.g., investing in education, businesses, or housing (Soleri et al. field notes).

3.3. Maize and Bean Farming Practices

3.3.1. Seed Sources

Gene flow from transgenic maize into farmers’ varieties in Mexico has long been a concern [40] and remains a topic of research and debate. Opportunities for gene flow in centers of crop diversity gained prominence when the presence of a transgenic promotor in a small sample of farmers’ maize varieties in the SJ was reported in 2001 [41], launching a global debate amid conflicting evidence [42,43,44] about transgenes in centers of origin and diversity. Subsequent research has provided further evidence for the introgression of transgenes in Mexican maize [45,46], widely believed to be the result of gene flow from transgenic maize into local populations. In Mexico, the center of origin, domestication, and diversity for maize, and where the crop is culturally iconic and essential to the diets of tens of millions of Mexicans, authorization of commercial transgenic maize plantings is contentious. Starting in 2013, Demanda Colectiva Maíz (http://demandacolectivamaiz.mx/wp/, accessed on 6 June 2022), a diverse group of scientists, farmers, activists, and others brought legal action to stop sales and planting of transgenic maize in Mexico, based on the precautionary principle and arguing for the human right to biodiversity free of transgenic materials, achieving an injunction against any plantings in late 2013. At the end of 2020, the government of President Andrés Manuel López Obrador issued a statement announcing the phasing out by 2024 of transgenic maize planting in Mexico and also of glyphosate herbicides often used with herbicide-resistant transgenic crops, to “maintain and secure [maize] production for public health and the biocultural diversity of the country and the environment”.
Where farmers obtain their planting seed is one indicator of opportunities for gene flow. Even though almost every household in both SJ and VC regions reported on-farm seed saving (Table 5), there was also ample opportunity for gene flow from non-local varieties. This was primarily through planting industrial or ‘modern’ varieties (referred to as “mejorado”, or “híbrido” varieties by Oaxacan farmers) and maize (and, to a lesser extent, beans) obtained as food, which at the time of the survey was typically from DICONSA, imported from outside of the community and likely of modern varieties. The planting of maize and beans obtained as food was more common in the SJ than the VC, significantly so for maize.
More SJ farmers reported experimenting with planting maize grain sold as food. In 2007, DICONSA sold mostly maize from the US and to a lesser extent from the northern Mexican state of Sinaloa. The US maize could have been transgenic, since in 2007 half the maize grown in the US was transgenic, 52% was herbicide-tolerant, and 49% contained the transgenic pesticidal gene Bt [47]. Sinaloan maize was unlikely to have been transgenic, as a de facto moratorium on commercial plantings of transgenic maize was in place at the time, although there could have been contamination with transgenes. Genetic analysis (PCR and Southern blot) of one sample of DICONSA maize collected in the SJ in 2001 was negative for transgene markers [45]. In the SJ, the smaller population sizes, more experimentation with maize purchased as food grain, and high rates of outcrossing in that crop mean that local maize diversity there is more threatened by gene flow.
Another possible opportunity for gene flow, especially in maize, is from volunteer plants, those not intentionally planted by the farmer, for example, maize grain spilled during transportation, as documented for canola in Japan [48] and speculated for maize in Oaxaca [42]. The majority of farmers in both the VC and the SJ said they would let a volunteer maize plant grow if it appeared near their fields; San Juan Atepec is the exception, with a majority saying they would not let it grow.
One reason that VC farmers experimented less with planting maize sold as food may be that they have had more opportunity to see and try growing modern varieties, and a larger proportion have sown commercially obtained modern variety maize seed (see Table 5). Numerous VC farmers noted that non-local maize was not appropriate for their fields, most of which are used for rain-fed production. While modern varieties have been promoted by governmental and private entities in the VC and some modern varieties may yield well in irrigated VC fields, few modern varieties have been promoted for the SJ, which may have contributed to more experimentation with food grains out of curiosity.
Across and within regions, we found a significant negative association between households growing more than one bean variety and having sown bean bought for food at some time in the last 10 years; thus, food grain is not a common source of added bean varietal richness. The same relationship was not found between maize varietal richness and sowing maize grain. At the regional level, VC households had lower maize varietal richness, planted more modern varieties of maize and bean using purchased seed, and fewer had tried sowing grain of either crop available as food. It is also important to recognize that farmers may not manage new seed, including food grain, as a separate named variety; for example, they may mix that seed with seed of their existing varieties [26].

3.3.2. Growing Environments, Inputs, and Yield Estimates

In the SJ, farmers identify three growing environments based on elevation: tierras fría (>1800 masl), templada (~1400–1700 masl), and caliente (<1200 masl) (FAC, field notes) [27] (see Table S3). Some farmer-named varieties of both maize and bean were specifically identified with one of these environments in our interviews (see Table S1a,b). The varieties allocated by farmers to particular environments can be genetically distinct and in the case of bean the varieties appear to be shifting, likely in response to changing temperatures in the three environments due to anthropogenic climate change [24]. Changing the allocation of seed to environments was also influenced by demographic changes. For example, farmers in the SJ frequently commented that farming, especially for aging households, has increasingly focused on the tierra templada fields that are closest to the community and where smaller amounts of seed are sown compared to tierra caliente fields, e.g., 1.12 vs. 4.31 kg of bean, respectively. In the VC, the first-order characterization of growing environments is temporal, not spatial, with the most common plantings for the predominantly rainfed summer season, 48 households across the region planting with irrigation in the winter season (Table S3) and 60% of those in Valdeflores.
A higher proportion of households in the VC used inputs in maize and bean cultivation, the only exception being herbicide use for bean, for which there was no significant difference (Table 6). Still, the intercommunity variation and patterns within each region are notable: in the SJ, Totontepec had the highest frequency of households using all inputs for both crops except organic matter; in the VC, more households in Valdeflores used most agrochemical inputs for both crops, while in the SJ, the proportion of households in Jaltianguis using organic matter-based fertilizers for both crops was substantially greater than in the other three SJ communities, the result of training workshops held there in the early 2000s, including ones led by FAC and HCG. Thus, while there are regional differences, particular communities have discernable patterns of practice which we speculate may be the result of characteristics specific to them, such as market orientation (Valdeflores) or exposure to training about management of organic matter (Jaltianguis).
Higher rainfall, lower evaporation rates, and more intensive management of the smaller maize plantings in the SJ compared to the VC may contribute to the higher mean maize yields in the SJ. Mean bean yield estimates for both growth types were higher in the VC; however, there is substantial variation in these estimates and the inter-regional differences are not statistically significant.

3.4. Household Use of Maize and Bean Harvests

3.4.1. Household Maize and Bean Consumption

Maize is central to Mexican cuisine, including in Oaxaca, and, together with Phaseolus bean, forms the foundation of most rural Oaxacan diets. We asked farmers about their household consumption of maize grain, understanding that this is not always obtained solely from their own production. Even among households who stated their maize harvest provides for their needs for 12 months or more (Table 7), some still purchase maize for livestock feed, while reserving their own maize for human food. Per person direct human consumption of maize (kg day−1) was not significantly different between VC and SJ regions, but even though household size is not significantly different between the two regions, total household maize consumption in the VC is 141% of that in the SJ (see Table 3) due to the significantly greater mean amount of maize used for livestock feed in the VC, with a mean feed:food ratio 1.9 times higher than in the SJ (Table 7). In addition, purchased tortilla consumption in the VC is five times that in the SJ, in part due to greater bread consumption in the SJ. Valdeflores reported the lowest direct human maize consumption of all communities, the highest purchased tortilla consumption, and at least double the quantity of maize for livestock feed than any other community in the study. Valdeflores is also the community in which maize harvests are used up most quickly, contributing to VC maize harvests lasting significantly shorter times than SJ harvests. As a region, the SJ has slightly higher mean per capita daily bean consumption compared to the VC; however, there is much variation between and within communities in both regions.

3.4.2. Selling Maize and Bean Harvests

In addition to consumption by humans or animals, some farming households sell maize and bean harvests. This can affect diversity, as some maize research in Mexico has found that rare, local named varieties with high value persist in niche markets [50,51]. Households in all eight communities sold some of their maize and bean harvests (Figure 5), but a larger proportion of households did this in the VC region.
To put maize and bean sales in the context of total household consumption, we asked those households that did sell if the amount sold was less than, about equal to, or greater than the amount of each crop they consume directly. Compared to the SJ, a greater proportion of households in the VC sold an amount larger than the amount they consumed of the same crop. In the SJ communities, the large majority of selling households sold less than they consume of either crop, especially in the case of bean, while those selling households managed greater bean diversity than households not selling beans (see also Figure 3). A minority of households in Jaltianguis and Totontepec sold the maize but compared to the other SJ communities many of those households sold amounts equal to or greater than their own consumption—a total of 60% and 44% in the respective communities. In Atepec and Cacalotepec, more households sold maize, but few of them reported selling amounts equal to or more than they consume at home—a total of 11% and 17%, respectively. Among those selling maize in the SJ, households without labor migrants sell amounts equal to or greater than they consume directly compared to households sending migrants. Jaltianguis was the only community reporting more households selling beans than maize.
In the VC, significantly more households sold both crops in Zautla and Valdeflores compared to Chichihualtepec and Amatengo. Additionally, for both crops in Zautla and Valdeflores, which receive more rainfall (see Table 1) and have access to irrigation, a greater proportion of households sold amounts equal to or greater than the amount they consume, although these amounts were only significantly different for maize—a total of 71% and 55% of selling households, respectively.
Our data describe contrasting relationships between crop sales and varietal richness for bean and maize. Across and between regions, households selling beans managed more bean varietal richness, especially those selling less than they consumed. This suggests that selling beans may be associated with an additional variety, as, for example, in the SJ, where Daá güin-nii/Möötsk xëjk is frequently marketed and sown in larger amounts than other varieties. In contrast, across all locations, households selling maize had significantly less maize richness.

3.5. Farmer Attitudes towards Risk and the Future of Farming

3.5.1. Perceptions of Risk: Harvest Failure, Yield Stability, and New Technology

Risk is always present in agriculture, affecting farm viability and household wellbeing, because the future, whether the next growing season or the next decade, is unknown. We asked farmers about their perceptions of risk. Developing genotypes and varieties responsive to high-input environments has been a cornerstone of Western plant breeding since the ‘green revolution’ [52]. However, our previous research in Oaxaca and elsewhere has found that a majority of low-resource, small-scale farmers are risk-averse and prefer varieties displaying yield stability, rejecting some characteristics of transgenic varieties, and that these attitudes are associated with crop diversity maintenance [31,53].
Using the two scenarios described earlier (see Figure 2), we found that farmers are well aware of the possibility of poor harvests and failed harvests (harvests equal to or less than the amounts planted). Especially in the VC, the primary source of maize harvest failure is variation in timing or amount of summer rainfall [54]. Farmers in that region reported a significantly greater proportion of years (number out of ten) of very poor maize harvest compared to farmers in the SJ region (Table 8). In the first scenario (see Figure 2a), in both regions the stable variety was preferred by a large majority of farmers. Some farmers, especially in the VC, have observed that modern varieties perform worse than traditional varieties under drought stress, and previous studies in Oaxaca [31,33,53] similarly found that the majority of farmers preferred the stable maize variety in that scenario over the high-response variety.
Also consistent with our previous findings, we found that for the second scenario most farmers preferred the stable maize variety (see Figure 2b) compared to a responsive one with the features of a hypothetical transgenic maize variety (increased seed cost, limited availability, yield decline over time). However, in the two most commercially oriented communities, Zautla and Valdeflores in the VC (see Figure 5), seed cost was also a reason for the rejection, and when seed prices were described as equal more farmers in those communities were open to the new variety’s other characteristics. Finally, when asked if transgenesis per se is negative, fewer VC farmers had negative attitudes to the new technology per se. Again, in Zautla and Valdeflores, a smaller proportion (48–50%) of farmers considered transgenesis per se negative, as described in the interview, than in the other communities where a higher proportion of farmers (64–89%) had a negative response to the technology itself (see Table 8). Across both regions and all communities, the proportion of farmers seeing transgenesis per se as negative was smaller than the proportion who rejected the characteristics of the hypothetical transgenic variety at either level of seed cost. Based solely on the criteria outlined in the scenarios, the responses indicate an openness to new technology if it is locally appropriate and useful. It is important to note that our scenarios did not explore ethical or political associations with transgenic technologies.

3.5.2. The Future: Hopes and Beliefs Regarding Farming and the Next Generation

The transformation of small farmers into labor for state or private capital has been a global development goal for decades, e.g., [3,55]. More recently, recognition of the diversity conservation “service” provided by these farms has led to their endorsement by some development and conservation professionals [56,57]. However, the reality is that the poverty, physical hardship, social neglect, and cultural marginalization experienced by many agricultural households and communities create strong pressures to find alternatives to farming, particularly among youth. Thus, a threat to traditional farming and associated crop diversity worldwide is young people leaving agriculture in favor of wage labor. To obtain their own assessments of the future of farming, we asked households what they hoped for the future and then what they believed the reality would be.
When asked if they hoped their children (or young people in the community if they did not have children) would be maize and bean farmers in the future, a majority of interviewees across regions and communities replied “yes” (Table 9). Many cited agriculture as a source of food security and sovereignty for their households. However, in addition, there were also many comments describing farming as having positive attributes in and of itself. Farmers noted that identity, heritage, health, independence, and enjoyment were among benefits that some of them experienced through their farming and that they hoped their children would also be able to experience.
Still, many of those who hoped youth would continue farming were skeptical that this would be the case for a number of reasons: the disruptive impact of formal education, migration in the form of prolonged or permanent absences, and other influences that distance youth from farming, in addition to the challenges posed by a changing climate that farmers in both regions saw as making successful farming more difficult and problematic.
In both regions, those who hoped that youth would continue to farm in the future were evenly divided into those who believed this would occur and those who did not. Across and within both regions there was a significant positive association between maize varietal richness and thinking that youth actually would continue to farm maize and beans, possibly because these are the households with the greatest interest and physical and cultural investment in agriculture.

4. Conclusions

This data article describes aspects of the household context of in situ conservation in a major global center of crop diversity for maize and Phaseolus beans grown by small-scale, traditionally based farmers across diverse Oaxacan communities and environments. We documented farmer-reported maize and bean diversity, household characteristics, labor migration, use of agricultural inputs, changes in the size of maize plantings, seed sources, opportunities for gene flow, use of harvests, and attitudes toward risk and the future of farming.
These data provide a baseline and orientation for the household context of maize and Phaseolus bean farming and the in situ conservation of those crops in two contrasting regions of Oaxaca, including a snapshot of farmer-named maize and bean varietal diversity in the households interviewed in 2007. This farmer-named diversity is assumed to be correlated, though not isometric with, genetic diversity. Our previous research on farmer varietal naming and diversity [25], along with that of others, e.g., [10], indicates that for sampling genetic diversity, farmers’ named variety categories are a first, orienting step.
Together, a limited number of variables were associated with farmer-named maize and bean varietal richness across all communities in the two regions included in this research (Figure 3). Regional contrasts were found for some variables, with differences in biophysical (Table 1, Table S3) and sociocultural (Table 3) environments and in household experiences of migration (Table 4), modernization, and climate change (Table 8 and Table 9) playing a role. Additionally, the discernable patterns indicate that the impacts of these changes may be different for the two important crops, for example, with marketing associated with greater diversity in bean but not in maize. Similarly, while there was no statistically significant difference between the two regions in the reduction of maize population size (total kilograms of maize sown) between 1987 and 2007, the reductions are more likely to be biologically significant in the SJ because households grow more varieties and farmers’ seed lots for individual varieties were one-third the size of those in the VC (see Table 2, kilograms seed sown variety−1). However, the variation within regions, and sometimes within communities, makes further generalizations about patterns and relationships with named crop varietal diversity challenging. The heterogeneity of household characteristics and practices observed in this study is similar to findings from research on the implications of policy change [58] and of migration [38] on rural Oaxacan households. All of this research indicates that households are influenced by many and varying factors that can combine in distinctive ways under local circumstances, including between households.
As the challenges of the Anthropocene intensify, detailed descriptions of local contexts such as those that have been presented here, together with local knowledge and regional and global observations, will be key to constructing and enhancing the locally appropriate adaptation [22] that communities want for themselves.

Supplementary Materials

The following supporting information can be downloaded at: https://www.mdpi.com/article/10.3390/su14127148/s1, Table S1a: Sierra Juárez Region. Maize and bean varieties farmers reported growing; Table S1b: Valles Centrales Region. Maize and bean varieties farmers reported growing; Table S2: Model information for logits included in Figure 3; Table S3: Environments and fields of maize and bean sown, as reported by farming households, 2007.

Author Contributions

Conceptualization, D.S. and D.A.C.; methodology, D.S. and D.A.C.; validation, D.S., F.A.C. and H.C.G.; formal analysis, D.S. and S.E.S.; investigation, F.A.C., H.C.G. and D.S.; resources, D.A.C. and D.S.; data curation, D.S., F.A.C. and H.C.G.; writing—original draft preparation, D.S.; writing—review and editing, D.S., F.A.C., H.C.G., D.A.C. and S.E.S.; visualization, D.S.; supervision, D.S.; project administration, D.S.; funding acquisition, D.A.C. and D.S. All authors have read and agreed to the published version of the manuscript.

Funding

This research was supported by the US National Science Foundation (SES-9977996). The APC was funded by the University of California, Santa Barbara, Open Access Publishing Fund.

Institutional Review Board Statement

This research was conducted in accordance with the Declaration of Helsinki and approved by the Institutional Review Board of the University of California, Santa Barbara (protocol code 4-01-250, record number 20090976, start date 1 September 2004).

Informed Consent Statement

This research was declared exempt by UCSB IRB.

Data Availability Statement

The data on which this paper is based can be accessed at the Dryad Data Repository, https://doi.org/10.25349/D9SC9W (accessed on 6 June 2022).

Acknowledgments

We especially thank the farming households we interviewed for their patience and generosity; the municipal authorities for granting permission for our research; Ingeniero Juan Arelí Bernal Alcántara for Mixe translations for SJ (Totontepec); Maestra Juana Bautista for Mixe translations for SJ (Cacalotepec); Dra María del Carmen Castillo Cisneros for facilitating Cacalotepec translations; Gladís Flores Ruis for data entry assistance; and Eusebio Jiménez Nicolas for Zapotec translations for SJ (Atepec and SMJ).

Conflicts of Interest

The authors declare no conflict of interest. The funder had no role in the design of the study; in the collection, analyses, or interpretation of data; in the writing of the manuscript, or in the decision to publish the results.

References

  1. ETC Group. Small-Scale Farmers and Peasants Still Feed the World. 31 January 2022; p. 16. Available online: https://www.google.com.hk/url?sa=t&rct=j&q=&esrc=s&source=web&cd=&ved=2ahUKEwiq3Lrgz5r4AhUFEYgKHcVXDUUQFnoECA0QAQ&url=https%3A%2F%2Fwww.etcgroup.org%2Ffiles%2Ffiles%2F31-01-2022_small-scale_farmers_and_peasants_still_feed_the_world.pdf&usg=AOvVaw3AJCTVrHMnf9r60KkvZYCb (accessed on 6 June 2022).
  2. Lowder, S.K.; Sánchez, M.V.; Bertini, R. Which farms feed the world and has farmland become more concentrated? World Dev. 2021, 142, 105455. [Google Scholar] [CrossRef]
  3. González, H.; Macías, A. Agrifood Vulnerability and Neoliberal Economic Policies in Mexico. Rev. Agrar. Stud. 2017, 7, 72–105. [Google Scholar]
  4. FAO. The Second Report on the State of the World’s Plant Genetic Resources for Food and Agriculture; FAO: Rome, Italy, 2010; Available online: https://www.fao.org/3/i1500e/i1500e00.htm (accessed on 6 June 2022).
  5. Pacicco, L.; Bodesmo, M.; Torricelli, R.; Negri, V. A methodological approach to identify agro-biodiversity hotspots for priority in situ conservation of plant genetic resources. PLoS ONE 2018, 13, e0197709. [Google Scholar] [CrossRef] [PubMed]
  6. Hajjar, R.; Jarvis, D.I.; Gemmill-Herren, B. The utility of crop genetic diversity in maintaining ecosystem services. Agric. Ecosyst. Environ. 2008, 123, 261–270. [Google Scholar] [CrossRef]
  7. Esteva, G.; Marielle, C. (Eds.) Sin Maíz no Hay País; Consejo Nacional para la Cultura y las Artes, Dirección General de Culturas Populares e Indígenas: Mexico City, Mexico, 2003. [Google Scholar]
  8. Frison, E.A.; IPES-Food. From Uniformity to Diversity: A Paradigm Shift from Industrial Agriculture to Diversified Agroecological Systems. 2016. Available online: https://www.google.com.hk/url?sa=t&rct=j&q=&esrc=s&source=web&cd=&ved=2ahUKEwizi7e20Jr4AhXGBt4KHUouBhoQFnoECAYQAQ&url=https%3A%2F%2Fwww.globalagriculture.org%2Ffileadmin%2Ffiles%2Fweltagrarbericht%2FIAASTD-Buch%2F01Reports%2FEmileAFrison-IAASTD-pages-72-77.pdf&usg=AOvVaw2sBJqpfeQEIjyhixEdspv5 (accessed on 6 June 2022).
  9. Lazos, E.; Chauvet, M. Análisis del Contexto Social y Biocultural de las Colectas de Maíces Nativos en México; CONABIO: México City, Mexico, 2012. [Google Scholar]
  10. Jarvis, D.I.; Brown, A.H.D.; Cuong, P.H.; Collado-Panduro, L.; Latournerie-Moreno, L.; Gyawali, S.; Tanto, T.; Sawadogo, M.; Mar, I.; Sadiki, M.; et al. A global perspective of the richness and evenness of traditional crop-variety diversity maintained by farming communities. Proc. Natl. Acad. Sci. USA 2008, 105, 5326–5331. [Google Scholar] [CrossRef] [PubMed]
  11. Netting, R.M. Smallholders, Householders: Farm Families and the Ecology of Intensive, Sustainable Agriculture; Stanford University Press: Stanford, CA, USA, 1993; p. xxi, 389. [Google Scholar]
  12. Matsuoka, Y.; Vigouroux, Y.; Goodman, M.M.; Sanchez, G.J.; Buckler, E.; Doebley, J. A single domestication for maize shown by multilocus microsatellite genotyping. Proc. Natl. Acad. Sci. USA 2002, 99, 6080–6084. [Google Scholar] [CrossRef]
  13. Kwak, M.; Kami, J.A.; Gepts, P. The putative Mesoamerican domestication center of Phaseolus vulgaris is located in the Lerma–Santiago Basin of Mexico. Crop. Sci. 2009, 49, 554–563. [Google Scholar] [CrossRef]
  14. Guerra-García, A.; Suárez-Atilano, M.; Mastretta-Yanes, A.; Delgado-Salinas, A.; Piñero, D. Domestication genomics of the open-pollinated scarlet runner bean (Phaseolus coccineus L.). Front. Plant Sci. 2017, 8, 1891. [Google Scholar] [CrossRef]
  15. Vielle-Calzada, J.-P.; Padilla, J. The Mexican Landraces: Description, Classification and Diversity. In Handbook of Maize: Its Biology; Bennetzen, J.L., Hake, S.C., Eds.; Springer: New York, NY, USA, 2009; pp. 543–561. [Google Scholar]
  16. Aragón Cuevas, F.; Taba, S.; Hernández-Casillas, J.M.; Figueroa Cárdenas, J.d.D.; Serrano Altamirno, V.; Castro-García, F.H. Catálogo de Maíces Criollos de Oaxaca, Primera ed.; INIFAP-SAGARPA: Oaxaca, Mexico, 2006; p. 343. [Google Scholar]
  17. CONABIO. Razas de Maíz de México. 2020. Available online: https://www.biodiversidad.gob.mx/diversidad/alimentos/maices/razas-de-maiz (accessed on 6 June 2022).
  18. Wellhausen, E.J.; Roberts, L.M.; Hernández, X.E.; Manglesdorf, P.C. Races of Maize in Mexico, English edition of Razas de Maíz en México, 1951 ed.; The Bussey Institution of Harvard University: Cambridge, MA, USA, 1952; p. 207. [Google Scholar]
  19. INEGI. Principales Resultados Por Localidad (ITER) del Censo de Población y Vivienda 2010. 2013. Available online: https://www.google.com.hk/url?sa=t&rct=j&q=&esrc=s&source=web&cd=&ved=2ahUKEwi5g-TP8Jr4AhWITGwGHasJCw0QFnoECA4QAQ&url=https%3A%2F%2Fwww.inegi.org.mx%2Fcontenidos%2Fprogramas%2Fccpv%2F2010%2Fdoc%2Ffd_iter_2010.pdf&usg=AOvVaw0r9WUPSLOD8fHeN9FjqRct (accessed on 28 February 2022).
  20. CONAPO. Índice de Marginación a Nivel Localidad 2005. 2005. Available online: https://www.google.com.hk/url?sa=t&rct=j&q=&esrc=s&source=web&cd=&ved=2ahUKEwi6w6Dv75r4AhU_TWwGHarhD54QFnoECAwQAQ&url=http%3A%2F%2Fwww.conapo.gob.mx%2Fwork%2Fmodels%2FCONAPO%2Findices_margina%2Fmarg_local05%2Flibro%2FIndiceMargLoc2005.pdf&usg=AOvVaw1efgV6iB_munIXzNF8YCPW (accessed on 8 February 2022).
  21. SIAP. Anuario Estadístico de la Producción Agrícola. 2022. Available online: https://nube.siap.gob.mx/cierreagricola/ (accessed on 18 February 2022).
  22. Rodrigues, R.R.; Shepherd, T.G. Small is beautiful: Climate-change science as if people mattered. PNAS Nexus 2022, 1, pgac009. [Google Scholar] [CrossRef]
  23. Barry, M.B.; Pham, J.L.; Courtois, B.; Billot, C.; Ahmadi, N. Rice genetic diversity at farm and village levels and genetic structure of local varieties reveal need for in situ conservation. Genet. Resour. Crop. Evol. 2007, 54, 1675–1690. [Google Scholar] [CrossRef]
  24. Worthington, M.; Soleri, D.; Aragón-Cuevas, F.; Gepts, P. Genetic composition and spatial distribution of farmer-managed Phaseolus bean plantings: An example from a village in Oaxaca, Mexico. Crop. Sci. 2012, 52, 1721–1735. [Google Scholar] [CrossRef]
  25. Soleri, D.; Worthington, M.; Aragon-Cuevas, F.; Smith, S.E.; Gepts, P. Farmers’ Varietal Identification in a Reference Sample of Local Phaseolus Species in the Sierra Juarez, Oaxaca, Mexico. Econ. Bot. 2013, 67, 283–298. [Google Scholar] [CrossRef]
  26. Pressoir, G.; Berthaud, J. Patterns of population structure in maize landraces from the Central Valleys of Oaxaca in Mexico. Heredity 2004, 92, 88–94. [Google Scholar] [CrossRef] [PubMed]
  27. González, R.J. Zapotec Science: Farming and Food in the Northern Sierra of Oaxaca; University of Texas Press: Austin, TX, USA, 2001. [Google Scholar]
  28. Magurran, A.E. Ecological Diversity and Its Measurement; Princeton University Press: Princeton, NJ, USA, 1988. [Google Scholar]
  29. Hamrick, J.L.; Godt, M.J.W. Allozyme diversity in cultivated crops. Crop. Sci. 1997, 37, 26–30. [Google Scholar] [CrossRef]
  30. Hardaker, J.B.; Huirne, R.B.M.; Anderson, J.R. Coping with Risk in Agriculture; CAB International: Wallingford, UK, 1997; p. xi, 274. [Google Scholar]
  31. Soleri, D.; Cleveland, D.A.; Aragón Cuevas, F.; Ríos Labrada, H.; Fuentes Lopez, M.R.; Sweeney, S.H. Understanding the potential impact of transgenic crops in traditional agriculture: Maize farmers’ perspectives in Cuba, Guatemala and Mexico. Environ. Biosaf. Res. 2005, 4, 141–166. [Google Scholar] [CrossRef] [PubMed]
  32. Soleri, D.; Cleveland, D.A. Scenarios as a tool for eliciting and understanding farmers’ biological knowledge. Field Methods 2005, 17, 283–301. [Google Scholar] [CrossRef]
  33. Soleri, D.; Cleveland, D.A.; Glasgow, G.E.; Sweeney, S.H.; Aragón Cuevas, F.; Ríos Labrada, H.; Fuentes Lopez, M.R. Testing economic assumptions underlying research on transgenic food crops for Third World farmers: Evidence from Cuba, Guatemala and Mexico. Ecol. Econ. 2008, 67, 667–682. [Google Scholar] [CrossRef]
  34. Cleveland, D.A.; Soleri, D. Rethinking the risk management process for genetically engineered crop varieties in small-scale, traditionally based agriculture. Ecol. Soc. 2005, 10, 9. [Google Scholar] [CrossRef]
  35. RStudio Team. RStudio: Integrated Development for R; PBC: Boston, MA, USA, 2020. [Google Scholar]
  36. Sin maíz no hay país. Campaña Nacional en Defensa de la Soberanía Alimentaria y la Reactivación del Campo Mexicano. Available online: http://www.sinmaiznohaypais.org/ (accessed on 26 June 2018).
  37. El Espacio Estatal en Defensa del Maíz Nativo de Oaxaca. Espacio Estatal en Defensa del Maíz Nativo de Oaxaca. Available online: https://maiznativodeoaxaca.wordpress.com/ (accessed on 5 October 2021).
  38. Robson, J.; Klooster, D.; Worthen, H.; Hernández-Díaz, J. Migration and agrarian transformation in Indigenous Mexico. J. Agrar. Chang. 2018, 18, 299–323. [Google Scholar] [CrossRef]
  39. Loarie, S.R.; Duffy, P.B.; Hamilton, H.; Asner, G.P.; Field, C.B.; Ackerly, D.D. The velocity of climate change. Nature 2009, 462, 1052–1055. [Google Scholar] [CrossRef]
  40. Serratos, J.A.; Willcox, M.C.; Castillo-González, F. (Eds.) Gene Flow among Maize Landraces, Improved Maize Varieties and Teosinte: Implications for Transgenic Maize; CIMMYT: Mexico, Mexico, 1997; p. xiii, 122. [Google Scholar]
  41. Quist, D.; Chapela, I.H. Transgenic DNA introgressed into traditional maize landraces in Oaxaca, Mexico. Nature 2001, 414, 541–543. [Google Scholar] [CrossRef]
  42. Cleveland, D.A.; Soleri, D.; Aragón Cuevas, F.; Crossa, J.; Gepts, P. Detecting (trans)gene flow to landraces in centers of crop origin: Lessons from the case of maize in Mexico. Environ. Biosaf. Res. 2005, 4, 197–208. [Google Scholar] [CrossRef] [PubMed]
  43. Ortiz-García, S.; Ezcurra, E.; Schoel, B.; Acevedo, F.; Soberón, J.; Snow, A.A. Absence of detectable transgenes in local landraces of maize in Oaxaca, Mexico (2003–2004). Proc. Natl. Acad. Sci. USA 2005, 102, 12338–12343. [Google Scholar] [CrossRef] [PubMed]
  44. Dyer, G.A.; Serratos-Hernández, J.A.; Perales, H.R.; Gepts, P.; Piñeyro-Nelson, A.; Chávez, A.; Salinas-Arreortua, N.; Yúnez-Naude, A.; Taylor, E.; Alvarez-Buylla, E.R. Dispersal of transgenes through maize seed systems in Mexico. PLoS ONE 2009, 4, e5734. [Google Scholar] [CrossRef] [PubMed]
  45. Piñeyro-Nelson, A.; Van Heerwaarden, J.; Perales, H.R.; Serratos-Hernandez, J.A.; Rangel, A.; Hufford, M.B.; Gepts, P.; Garay-Arroyo, A.; Rivera-Bustamante, R.; Alvarez-Buylla, E.R. Transgenes in Mexican maize: Molecular evidence and methodological considerations for GMO detection in landrace populations. Mol. Ecol. 2009, 18, 750–761. [Google Scholar] [CrossRef] [PubMed]
  46. Serratos-Hernández, J.-A.; Gómez-Olivares, J.-L.; Salinas-Arreortua, N.; Buendía-Rodríguez, E.; Islas-Gutiérrez, F.; de-Ita, A. Transgenic proteins in maize in the Soil Conservation area of Federal District, Mexico. Front. Ecol. Environ. 2007, 5, 247–252. [Google Scholar] [CrossRef]
  47. USDA ERS. Recent Trends in GE Adoption. Available online: https://www.ers.usda.gov/data-products/adoption-of-genetically-engineered-crops-in-the-us/recent-trends-in-ge-adoption/ (accessed on 4 November 2021).
  48. Saji, H.; Nakajima, N.; Aono, M.; Tamaoki, M.; Kubo, A.; Wakiyama, S.; Hatase, Y.; Nagatsu, M. Monitoring the escape of transgenic oilseed rape around Japanese ports and roadsides. Environ. Biosaf. Res. 2005, 4, 217–222. [Google Scholar] [CrossRef]
  49. Bonvecchio Arenas, A.; Fernández-Gaxiola, A.C.; Belausteguigoitia, M.P.; Kaufer-Horwitz, M.; Lizaur, A.B.P.; Dommarco, J.Á.R. (Eds.) Guías Alimentarias y de Actividad Física en Contexto de Sobrepeso y Obesidad en la Población Mexicana [Dietary and Physical Activity Guidelines in the Context of Overweight and Obesity in the MEXICAN Population]; Academia Nacional de Medicina: Mexico City, Mexico, 2015. [Google Scholar]
  50. Keleman, A.; Hellin, J.; Flores, D. Diverse Varieties and Diverse Markets: Scale-related Maize “Profitability Crossover” in the Central Mexican Highlands. Hum. Ecol. 2013, 41, 683–705. [Google Scholar] [CrossRef]
  51. Appendini, K.; Quijada, M.G. Consumption strategies in Mexican rural households: Pursuing food security with quality. Agric. Hum. Values 2016, 33, 439–454. [Google Scholar] [CrossRef]
  52. Simmonds, N.W.; Smartt, J. Principles of Crop Improvement, 2nd ed.; Blackwell Science Ltd.: Oxford, UK, 1999; p. xii, 412. [Google Scholar]
  53. Soleri, D.; Cleveland, D.A.; Smith, S.E.; Ceccarelli, S.; Grando, S.; Rana, R.B.; Rijal, D.; Ríos Labrada, H. Understanding farmers’ knowledge as the basis for collaboration with plant breeders: Methodological development and examples from ongoing research in Mexico, Syria, Cuba, and Nepal. In Farmers, Scientists and Plant Breeding: Integrating Knowledge and Practice; Cleveland, D.A., Soleri, D., Eds.; CAB International: Wallingford, UK, 2002; pp. 19–60. [Google Scholar]
  54. Dilley, M. Climatic factors affecting annual maize yields in the Valley of Oaxaca, Mexico. Int. J. Climatol. 1997, 17, 1549–1557. [Google Scholar] [CrossRef]
  55. Jennings, B.H. Foundations of International Agricultural Research; Westview Press: Boulder, CO, USA, 1988; p. 196. [Google Scholar]
  56. Guzzon, F.; Arandia Rios, L.W.; Caviedes Cepeda, G.M.; Céspedes Polo, M.; Chavez Cabrera, A.; Muriel Figueroa, J.; Medina Hoyos, A.E.; Jara Calvo, T.W.; Molnar, T.L.; Narro León, L.A.; et al. Conservation and Use of Latin American Maize Diversity: Pillar of Nutrition Security and Cultural Heritage of Humanity. Agronomy 2021, 11, 172. [Google Scholar] [CrossRef]
  57. Timberlake, T.P.; Cirtwill, A.R.; Baral, S.C.; Bhusal, D.R.; Devkota, K.; Harris-Fry, H.A.; Kortsch, S.; Myers, S.S.; Roslin, T.; Saville, N.M.; et al. A network approach for managing ecosystem services and improving food and nutrition security on smallholder farms. People Nat. 2022, 4, 563–575. [Google Scholar] [CrossRef]
  58. Novotny, I.P.; Fuentes-Ponce, M.H.; Lopez-Ridaura, S.; Tittonell, P.; Rossing, W.A. Longitudinal analysis of household types and livelihood trajectories in Oaxaca, Mexico. J. Rural Stud. 2021, 81, 170–181. [Google Scholar] [CrossRef]
Figure 1. The locations of the eight communities included in this study (INIFAP).
Sustainability 14 07148 g001
Figure 2. Two scenarios regarding attitudes toward risk presented to farmers in eight communities in Oaxaca, Mexico. (a) Scenario to elicit farmer attitudes towards risk. Farmer perceptions of genotype x environment interaction and attitudes toward risk. Reprinted with permission from [31]. (b) Scenario to elicit farmer attitudes towards hypothetical consequences of a transgenic maize variety. Reprinted with permission from [34].
Sustainability 14 07148 g002
Figure 3. Log odds ratios of independent variables associated with levels of varietal richness for bean and maize. Varietal richness levels were (a) less than two vs two or more varieties, (b) less than three vs three or more varieties. Error bars represent the 95% confidence interval; values are plotted using a log scale.
Sustainability 14 07148 g003aSustainability 14 07148 g003b
Figure 4. Variation across communities for maize and bean varietal richness and participation in labor migration to specific destinations 1. 1 Migration destination proportions calculated among households with migrants; community varietal richness calculated among households sowing those crops. SJ = Sierra Juárez; VC = Valles Centrales; SMJ = Santa María Jaltianguis; SMC = Santa Marta Chichihualtepec.
Sustainability 14 07148 g004
Figure 5. Maize and bean sales, and quantity relative to household consumption. * Proportion of households selling is significantly different between units at this level, p < 0.5. # Relative amount sold by households is significantly different between units at this level, p < 0.5.
Sustainability 14 07148 g005
Table 1. Community and municipality characteristics from published sources.
Community Community physical
environment 1
Community social environment, 2010 2Municipality population and maize and bean area, yields and per person production, 2010 4,5
Representative
elevation (masl) 1
Mean annual
precipitation (mm) 1
Mean annual evapotranspiration (mm) 1Total population of communityLiteracy, above 15 years oldMean years of
education
Speak an indigenous
language
Index of masculinity (m/100f)Degree of
Marginalization 3
Total population of
municipality
Area rainfed maize, haRainfed maize yields,
t ha−1
Per person annual rainfed maize production, kgArea rainfed bean, haRainfed bean yields,
t ha−1
Per person annual rainfed bean production, kg
Sierra Juárez communities 6
  A20007571444147984.3%5.1976.3%87.99High1517951.1270220.415.9
  B2040881150255994.4%6.6556.8%91.38Low575511.13100280.4220.5
  C20502012168479175.4%5.6798.3%85.41High24957041.13319710.4111.6
  D195018051359168483.4%5.4188.6%85.44High559811101.122221350.419.9
Valles Centrales communities 7
  E15007171876142675.8%4.50.0%94.74High19,67949160.952371380.64.2
  F13606921912129463.7%4.090.7%83.31High13124951377150.78.0
  G16756981781185295.5%8.761.8%94.46Low44058000.99180180.672.7
  H14477711879109483.0%5.690.3%84.58Medium19,215619613227000.7928.8
1 [16]. 2 Results for community (localidades), 2010 population census [19]. 3 [20]. 4 Data for municipalities with same name as community except: Ejutla de Crespo for Santa Marta Chichihualtepec; Zimatlán de Álvarez for Valdeflores Zimatlán. 5 Municipal populations [19]; crop data, “maíz grano”, “frijol” [21]. 6 Community names; municipality name is the same unless otherwise noted. A = San Juan Atepec; B = Santa María Jaltianguis; C = Asunción Cacalotepec; D = Totontepec Villa de Morelos. 7 Community names; municipality name is the same unless otherwise noted. E = Santa Marta Chichihualtepec (Heroica Ciudad de Ejutla de Crespo); F = San Agustín Amatengo; G = San Andrés Zautla; H = Valdeflores Zimatlán (Zimatlán de Álvarez).
Table 2. (a) Farmer-reported bean varietal richness and associated abundance and divergence estimates. (b) Farmer-reported maize varietal richness and associated abundance and divergence estimates. (c) Farmer-reported total kilograms of maize seed sown and per variety and change in amount sown (1987–2007).
(a)
Region, CommunityProportion of Households
Planting Beans
Total
Community
Richness
(Farmer-Named Bean Varieties)
Bean 1 Varieties Household−1 among Those Sowing Bean
RichnessProportional
Abundance (SI)
Divergence
Estimate 3
MeanStandard
Deviation
MinMaxDunn’s Test 2
Between regions* *
Sierra Juárez, all communities0.90171.78 *0.8004 0.880.17
San Juan Atepec0.9281.980.8204a0.720.39
Santa María Jaltianguis0.92111.780.8104a0.820.37
Asunción Cacalotepec0.8872.050.7603a0.770.36
Totontepec Villa de Morelos0.8861.310.6003b0.580.60
Valles Centrales, all communities0.58131.35 *0.6203 0.700.15
Santa Marta Chichihualtepec0.3561.250.4502w0.780.85
San Agustín Amatengo0.6391.760.7903x0.820.62
San Andrés Zautla0.8661.140.4203w0.390.84
Valdeflores Zimatlán0.5541.230.5003w0.370.71
* Significant difference between units at this level, p < 0.05. 1 Phaseolus spp. only, farmer-named varieties. 2 Units with different letters are significantly different. 3 Community divergence = (community SI − mean household SI)/community SI; regional divergence = (regional SI − mean community SI)/regional SI, following [10]. SI = Simpson’s Index of Heterogeneity, expressed as 1 − D, after [28].
(b)
Region, CommunityRaces of Maize Identified
in the
Community 1
Proportion of
Households
Planting Maize
Total
Community Richness (Farmer-Named Maize
Varieties)
Maize Varieties Household−1 among Those Sowing Maize
RichnessProportional Abundance (SI)Divergence
Estimate 3
MeanStandard DeviationMinMaxDunn’s Test 2
Between regions NS *
Sierra Juárez, all communities101.00191.51 *0.6705 0.710.03
San Juan Atepec41.0081.270.4512a0.720.81
Santa María Jaltianguis31.0081.600.7013ab0.710.64
Asunción Cacalotepec41.00101.500.7715ab0.710.70
Totontepec Villa de Morelos60.9861.660.6903b0.620.51
Valles Centrales, all communities61.00141.23 *0.6005 0.550.20
Santa Marta Chichihualtepec41.0071.240.5213w0.690.84
San Agustín Amatengo31.0091.380.8015w0.570.75
San Andrés Zautla40.9821.000.0001x0.120.83
Valdeflores Zimatlán 431.0071.270.6814w0.400.75
* Significant difference between units at this level, p < 0.05. NS = not significant. 1 Source [16].2 Units with different letters are significantly different. 3 Community divergence = (community SI − mean household SI)/community SI; regional divergence = (regional SI − mean community SI)/regional SI, following [10]. SI = Simpson’s Index of Heterogeneity, expressed as 1 − D, after [28]. 4 Two Valdeflores households planted four maize varieties: in one household three were modern varieties (MVs), in the other household one was a MV; in both households the others were local maize varieties.
(c)
Region, CommunityMaize Sown Household−1 among Those Sowing Maize
Kg Sown Variety−1, 2007 1Total Kg Sown, 2007Change in Kg Sown, 1987–2007 2
MeanSDMinMaxDunn’s Test 3MeanSDMinMaxDunn’s Test 3MeanSDMinMax
Between regions* * NS
Sierra Juárez, all communities12.37 *10.070.5080 17.3013.250.0084NS−5.1516.28−8460
San Juan Atepec15.5510.830.5052a19.1612.880.5052 NANANANA
Santa María Jaltianguis10.3511.301.3380b16.2214.072.0080 −6.2917.49−3860
Asunción Cacalotepec12.247.942.0032ab16.4610.794.0060 −2.658.78−2816
Totontepec Villa de Morelos11.259.252.0040b17.3015.020.0084 −6.5420.07−8432
Valles Centrales, all communities38.59 *33.011.50156 38.41 *33.040.00184 −8.1732.95−164110
Santa Marta Chichihualtepec46.6241.061.50156x51.9942.781.50156w−2.9038.22−136110
San Agustín Amatengo22.7017.924.0092y30.6931.224.00184x−10.7732.55−16460
San Andrés Zautla30.3823.302.00100xy30.3823.300.00100xy−15.1830.41−14052
Valdeflores Zimatlán36.5928.026.00120xy41.3128.046.00120wy−3.7329.84−8460
* Significant difference between units at this level, p < 0.05. NS = not significant. NA = not available, see text. 1 Mean number of maize seeds kg−1 across the two regions ranges between 2870–3010, approximately. FAC field notes. 2 Dunn’s Test insignificant at all levels. 3 Units with different letters are significantly different.
Table 3. Interviewee characteristics and household composition.
Region,
Community
Person Interviewed 1Household Composition
Age, YearsFormal
Education, Years
Gender,
% Female
First Language, %Total
Members
Adult
Females
Adult MalesProportion of
Household
<15 Years Old
ZapotecMixeSpanish
Between regions NSNSNS*
Sierra Juárez, all communitiesMean54.434.9440%50%48.5%1.5%4.141.561.420.23
SD15.242.66 1.780.740.780.23
  San Juan AtepecMean55.224.9638%100%0%0%4.201.491.450.25
SD13.902.35 1.580.610.670.24
  Santa María JaltianguisMean55.825.5239%96%0%4%3.961.481.420.21
SD14.251.59 1.500.650.670.23
  Asunción CacalotepecMean53.465.0243%2%98%0%3.831.521.440.17
SD16.493.64 2.090.850.940.20
  Totontepec Villa de MorelosMean53.164.2941%0%98%2%4.531.731.390.26
SD16.492.68 1.890.830.830.22
Valles Centrales, all communitiesMean58.494.3641%0%0%100%4.051.591.490.18
SD15.583.42 2.171.000.880.20
  Santa Marta ChichihualtepecMean57.294.4241%0%0%100%4.221.571.490.22
SD15.791.98 1.900.790.850.21
  San Agustín AmatengoMean58.562.5042%0%0%100%3.401.371.290.16
SD13.763.11 1.870.950.780.20
  San Andrés ZautlaMean59.206.5337%0%0%100%4.491.611.690.23
SD18.833.61 2.110.951.000.21
  Valdeflores ZimatlánMean58.874.3746%0%0%100%4.111.801.510.12
SD14.103.34 2.591.220.880.17
* Significant difference between units at this level, p < 0.05. NS = not significant. 1 Not tested for differences.
Table 4. Household labor migration 1.
Region, CommunityAmong all HHs, Proportion with Migrants to Any Destination,
1997–2007
Only Among Households (HHs) Sending Labor Migrants, 1997–2007
Total Number of
Migrants/HH, Any
Destination, Count
Migrant Destinations
Anywhere in MexicoAnywhere in USA
Proportion of HHs 2Number Migrants/HHProportion of HHs 2Number Migrants/HH
MeanSDMeanSDDunn’s Test 3MeanSDDunn’s Test 3
Between regionsNSNS *NS **
Sierra Juárez, all communities63% *2.671.7462% *1.39 *1.52 54%*1.25 *1.64
Males 1.671.21
Females 1.061.16
San Juan Atepec69%2.201.3266%1.261.29a51%0.941.14b
Males 1.730.80
Females 0.400.91
Santa María Jaltianguis74%3.142.0036%0.671.04a83%2.532.09c
Males 2.001.50
Females 1.060.97
Asunción Cacalotepec60%2.861.5593%2.751.65b14%0.180.48a
Males 1.451.09
Females 1.451.27
Totontepec Villa deMorelos47%2.421.9358%1.001.29a63%0.950.97b
Males 1.421.02
Females 1.001.29
Valles Centrales, all communities66% *2.851.8246% *1.20 *1.74 67%1.59 *1.68
Males 1.741.16
Females 1.141.23
Santa Marta Chichihualtepec73%2.641.6151%1.341.75w66%1.201.23w
Males 1.581.00
Females 1.061.15
San Agustín Amatengo75%2.461.5247%1.261.91wx61%1.241.24w
Males 1.671.13
Females 0.790.83
San Andrés Zautla40%2.942.4882%2.191.97w31%0.380.62x
Males 1.611.50
Females 1.331.37
Valdeflores Zimatlán75%3.381.8821%0.501.11x94%2.972.01y
Males 2.001.15
Females 1.481.47
* Significant difference between units at this level, p < 0.05. NS = not significant. 1 Calculations are only among households participating in migration, unless otherwise indicated. 2 Together, proportions for sending out migrants to Mexico and the US may total more than 100%, as some households sent to both destinations. 3 Units with different letters are significantly different.
Table 5. Farmers’ on- and off-farm maize and bean seed sources.
Region, CommunityMaize, % of Households InterviewedBean, % of Households Interviewed
Save and Plant Their Own SeedsHave Ever Sown Maize Seeds Identified as MVs,
1997–2007
Have Planted Commercial Maize Purchased as Food from a Store, 1997–2007Leave a Maize Volunteer to Grow Near FieldSave and Plant Their Own SeedsHave Ever Sown Non-Criollo Bean Seeds,
1997–2007
Have Planted Commercial Bean
Purchased as Food from a Store,
1997–2007
Between regionsNS***NS*NS
Sierra Juárez, all communities96% *12% *22% *73% *94%11% *20%
  San Juan Atepec92%12%24%36%96%11%20%
  Santa María Jaltianguis100%32%34%88%94%22%28%
  Asunción Cacalotepec92%0%11%77%86%2%24%
  Totontepec Villa de Morelos100%2%18%92%98%7%10%
Valles Centrales, all communities94% *20% *10%94% *91%19% *15%
  Santa Marta Chichihualtepec96%9%8%88%94%13%11%
  San Agustín Amatengo100%23%6%98%88%6%23%
    San Andrés Zautla90%16%17%100%95%17%16%
  Valdeflores Zimatlán89%31%9%89%87%40%9%
* Significant difference between units at this level, p < 0.05. NS = not significant. MVs = modern varieties.
Table 6. (a) Farmer descriptions of their bean farming. (b) Farmer descriptions of their maize farming.
(a)
Region, Community Bean Cultivation, Proportion of Farmers Stating They Use Commercial, Agrochemical:Proportion Using Organic Matter as Fertilizer for BeanFarmer-Reported Mean Bean Yield Estimate, Kg Harvested/Kg Sown 1,2
FertilizerHerbicideInsecticideGrain Storage InsecticideDeterminate, Bush-Type BeansDunn’s Test 3Indeterminate,
Vining Beans
Between regions *NS***NS NS
Sierra Juárez, all communitiesMean41% *12% *3%19%*13% *9.7 16.1
SD 12.68 7.46
San Juan AtepecMean20%0%0%7%9%9.7 15.4
SD 14.48 7.45
Santa María JaltianguisMean60%0%0%9%38%9.6 18.6
SD 12.90 6.50
Asunción CacalotepecMean9%23%5%18%2%10.9 14.3
SD 7.74 4.83
Totontepec Villa de MorelosMean69%26%6%42%2%6.5 16.6
SD 9.59 9.50
Valles Centrales, all communitiesMean63% *19% *41% *38% *78% *16.1 * 24.7
SD 5.56 13.13
Santa Marta ChichihualtepecMean97%12%21%41%97%15.3a20.9
SD 5.23 11.39
San Agustín AmatengoMean53%13%38%9%66%13.1ab31.1
SD 4.94 16.12
San Andrés ZautlaMean36%6%15%51%76%8.2b1.9
SD 3.25 0.45
Valdeflores ZimatlánMean72%52%100%48%72%26.8aNA
SD 8.56 NA
(b)
Region, Community Maize Cultivation, Proportion of Farmers Stating They Use Commercial, Agrochemical:Proportion Using Organic Matter as Fertilizer for MaizeFarmer-Reported Mean Maize Yield Estimate, Kg Harvested/Kg Sown 1Dunn’s Test 3
FertilizerHerbicideInsecticideGrain
Storage
Insecticide
Between regions ******
Sierra Juárez, all communitiesMean50% *11% *2%24% *15% *46.7NS
SD 45.65
San Juan AtepecMean50%0%0%18%12%44.5
SD 50.60
Santa María JaltianguisMean67%2%0%8%39%44.9
SD 35.97
Asunción CacalotepecMean10%21%2%19%4%53.4
SD 44.94
Totontepec Villa de MorelosMean71%22%4%51%6%44.5
SD 51.34
Valles Centrales, all communitiesMean89% *18% *14% *44% *76%34.4 *
SD 14.48
Santa Marta ChichihualtepecMean96%15%13%44%88%19.8a
SD 7.32
San Agustín AmatengoMean94%17%14%26%73%42.3b
SD 16.24
San Andrés ZautlaMean78%2%2%27%78%36.5b
SD 14.59
Valdeflores ZimatlánMean89%37%26%75%67%38.5b
SD 19.30
* Significant difference between units at this level, p < 0.05. 1 Triangulation of farmer estimates following [30]. Average and standard deviation calculated individually from farmer-reported data. 2 Data points for bush-type varieties: SJ = 84, CV = 40; for vining-type varieties: SJ = 99, CV = 40. 3 Units with different letters are significantly different.
Table 7. (a) Farmer-reported maize consumption. (b) Farmer-reported bean consumption.
(a)
Region,
Community
Maize consumption
Kilograms of Maize/Person/DayFeed: Food Ratio
Animal: Direct Human Household Maize
Consumption
Total Daily Household Maize Consumption, KgKilograms of
Purchased
Tortillas/
Person/Week
Months Household Can Use Their Own Maize
Harvest, without
Purchasing Maize
Direct Human
Consumption 1
For Household
Livestock
MeanSDDunn’s Test 2MeanSDDunn’s Test 2MeanSDDunn’s Test 2MeanSDDunn’s Test 2MeanSDDunn’s Test 2MeanSDDunn’s Test 2
Between regionsNS NS NS * * *
Sierra Juárez, all communities0.530.36NS0.30 *0.35 0.64 *0.82 2.911.64NS0.401.05 10.615.59
  San Juan Atepec0.470.17 0.290.30ab0.771.18ab2.811.41 0.340.95a9.992.61ab
  Santa María Jaltianguis0.540.36 0.440.48ab0.870.86a3.141.68 0.831.56b9.453.04a
  Asunción Cacalotepec0.610.54 0.320.30ab0.570.42ab2.921.89 0.030.18c10.663.26b
  Totontepec Villa de Morelos0.520.27 0.170.23b0.350.44b2.781.59 0.390.87a12.299.65b
Valles Centrales, all communities0.54 *0.40 0.64 *1.17 1.19 *2.16 4.11 *3.72 2.023.15 9.786.28NS
  Santa Marta Chichihualtepec0.630.28x0.600.84wx1.081.54w4.472.64wx0.912.23w9.537.01
  San Agustín Amatengo0.670.45x0.320.44wy0.470.60x3.142.39wy1.863.29wx11.988.71
  San Andrés Zautla0.480.45y0.360.67y0.691.37x3.293.01y2.423.31xy8.863.24
  Valdeflores Zimatlán0.400.31y1.221.86x2.593.51w5.455.40x2.783.34y8.653.82
(b)
Region, CommunityBean Consumption, Kilograms/Person/Day 1,3
MeanSDDunn’s Test 2
Between regions*
Sierra Juárez, all communities0.073 *0.046
  San Juan Atepec0.0620.043a
  Santa María Jaltianguis0.0840.049b
  Asunción Cacalotepec0.0850.054bc
  Totontepec Villa de Morelos0.0610.032ac
Valles Centrales, all communities0.068 *0.059
  Santa Marta Chichihualtepec0.0480.030w
  San Agustín Amatengo0.0740.054xy
  San Andrés Zautla0.0530.026wx
  Valdeflores Zimatlán0.0950.086y
* Significant difference between units at this level, p < 0.05. S = not significant. 1 Children under 15 years old counted as 75% of adult consumption as per [49]. 2 Units with different letters are significantly different. 3 For this question, “beans” (frijoles) was generic, potentially including both bush and vining types and multiple species.
Table 8. Perceptions of risk in maize farming. Farmer estimations of poor maize harvest, responses to two risk scenarios, and attitudes toward transgenesis.
Region, CommunityYears of Poor Maize Harvest/10 YearsYield and Yield
Stability:
Proportion of
Farmers
Preferring
Stable
Variety over High Response Variety
Hypothetical TG
Maize Scenario:
Proportion of Farmers Preferring Stable Variety When:
Proportion of Farmers
Stating Transgenesis per Se Is
Negative
MeanSDCompared with Seeds of
Responsive
Variety That Cost 2× More
Than Stable
Variety Seeds
Seeds of All
Varieties Are the Same Price
Between regions* NSNS**
Sierra Juárez, all communities3.71.6687%97%93%78% *
  San Juan Atepec3.31.4986%100%95%82%
  Santa María Jaltianguis3.81.5280%96%94%64%
  Asunción Cacalotepec4.11.8794%98%91%89%
  Totontepec Villa de Morelos3.71.7590%96%92%78%
Valles Centrales, all communities5.11.8781% *94%82%59% *
  Santa Marta Chichihualtepec5.31.6088%96%89%72%
  San Agustín Amatengo5.21.5783%90%88%67%
  San Andrés Zautla4.42.1087%98%76%50%
  Valdeflores Zimatlán5.22.1767%91%75%48%
* Significant difference between units at this level, p < 0.05. TG = transgenic. NS = not significant.
Table 9. Hopes and beliefs about the future of maize and bean farming.
Region, CommunityProportion of HouseholdsFarmer Comments, from across Communities
Who Hope the Next Generation to Be Maize and Bean FarmersWho Believe the Next Generation Will Be Maize and Bean FarmersThemes and Examples of
Major Reasons for Hoping Youth Will Farm
Themes and Examples of Major Reasons for Believing Youth Will Not Farm
Between regionsNSNS
Sierra Juárez,
all communities
92%51% *Farming is an important tradition, a part of our identity as campesinosYoung people are migrating out of the community and not returning
  San Juan Atepec92%39%“venimos de herencia de campesinos”
“es la vida del campesino”
“para que no se hecha perder lo que hicieron los antiguos, se necesita el campo”
“están en los EEUA, los nietos son diferentes, hablan inglés,
algunos nunca han visitado Oaxaca”
“ya tienen la visión de irse a los EEUA”
  Santa María Jaltianguis96%41%
  Asunción Cacalotepec89%64%Farming is necessary for survivalPreferences for formal education and the work opportunities that might bring
  Totontepec Villa de Morelos92%61%“es lo más indispensable que uno puede conocer”
“es la fuente del trabajo, tiene la esperanza en el campo”
“para que tengan de comer”
“comprar maíz y frijol es más difícil ya que no hay dinero para comprar”
“siempre tiene de comer, aun en tiempos de escasez”
“la joventud prefiere estudiar”
Valles Centrales,
all communities
90% *45%Farming offers benefits and pleasures beyond simply survivingClimate changes are making farming even more difficult than in the past
  Santa Marta Chichihualtepec98%57%“para que conservar y que coma sano”
“el campo es muy bonito, y la necesidad nos enseña”
“porque da cierto tipo de independencia”
“el campo me gusta mucho, es mi satisfacción comer lo que cultivo”
“esta más tranquilo, respira aire puro, más libre”
“el campo ya no es el mismo, el sol ya esta muy fuerte”
“el tiempo ya no es el mismo, ya no hay agua”
“como oigo, en el futuro llueve menos”
“ya no se saca provecho y no es seguro el campo”
  San Agustín Amatengo87%42%
  San Andrés Zautla77%36%
  Valdeflores Zimatlán98%44%
* Significant difference between units at this level, p < 0.05. NS = not significant.
Publisher’s Note: MDPI stays neutral with regard to jurisdictional claims in published maps and institutional affiliations.

