Correction: Della Posta et al. COVID-19, Economic Policies and Public Debt Sustainability in Italy. Sustainability 2022, 14, 4691


- (1)
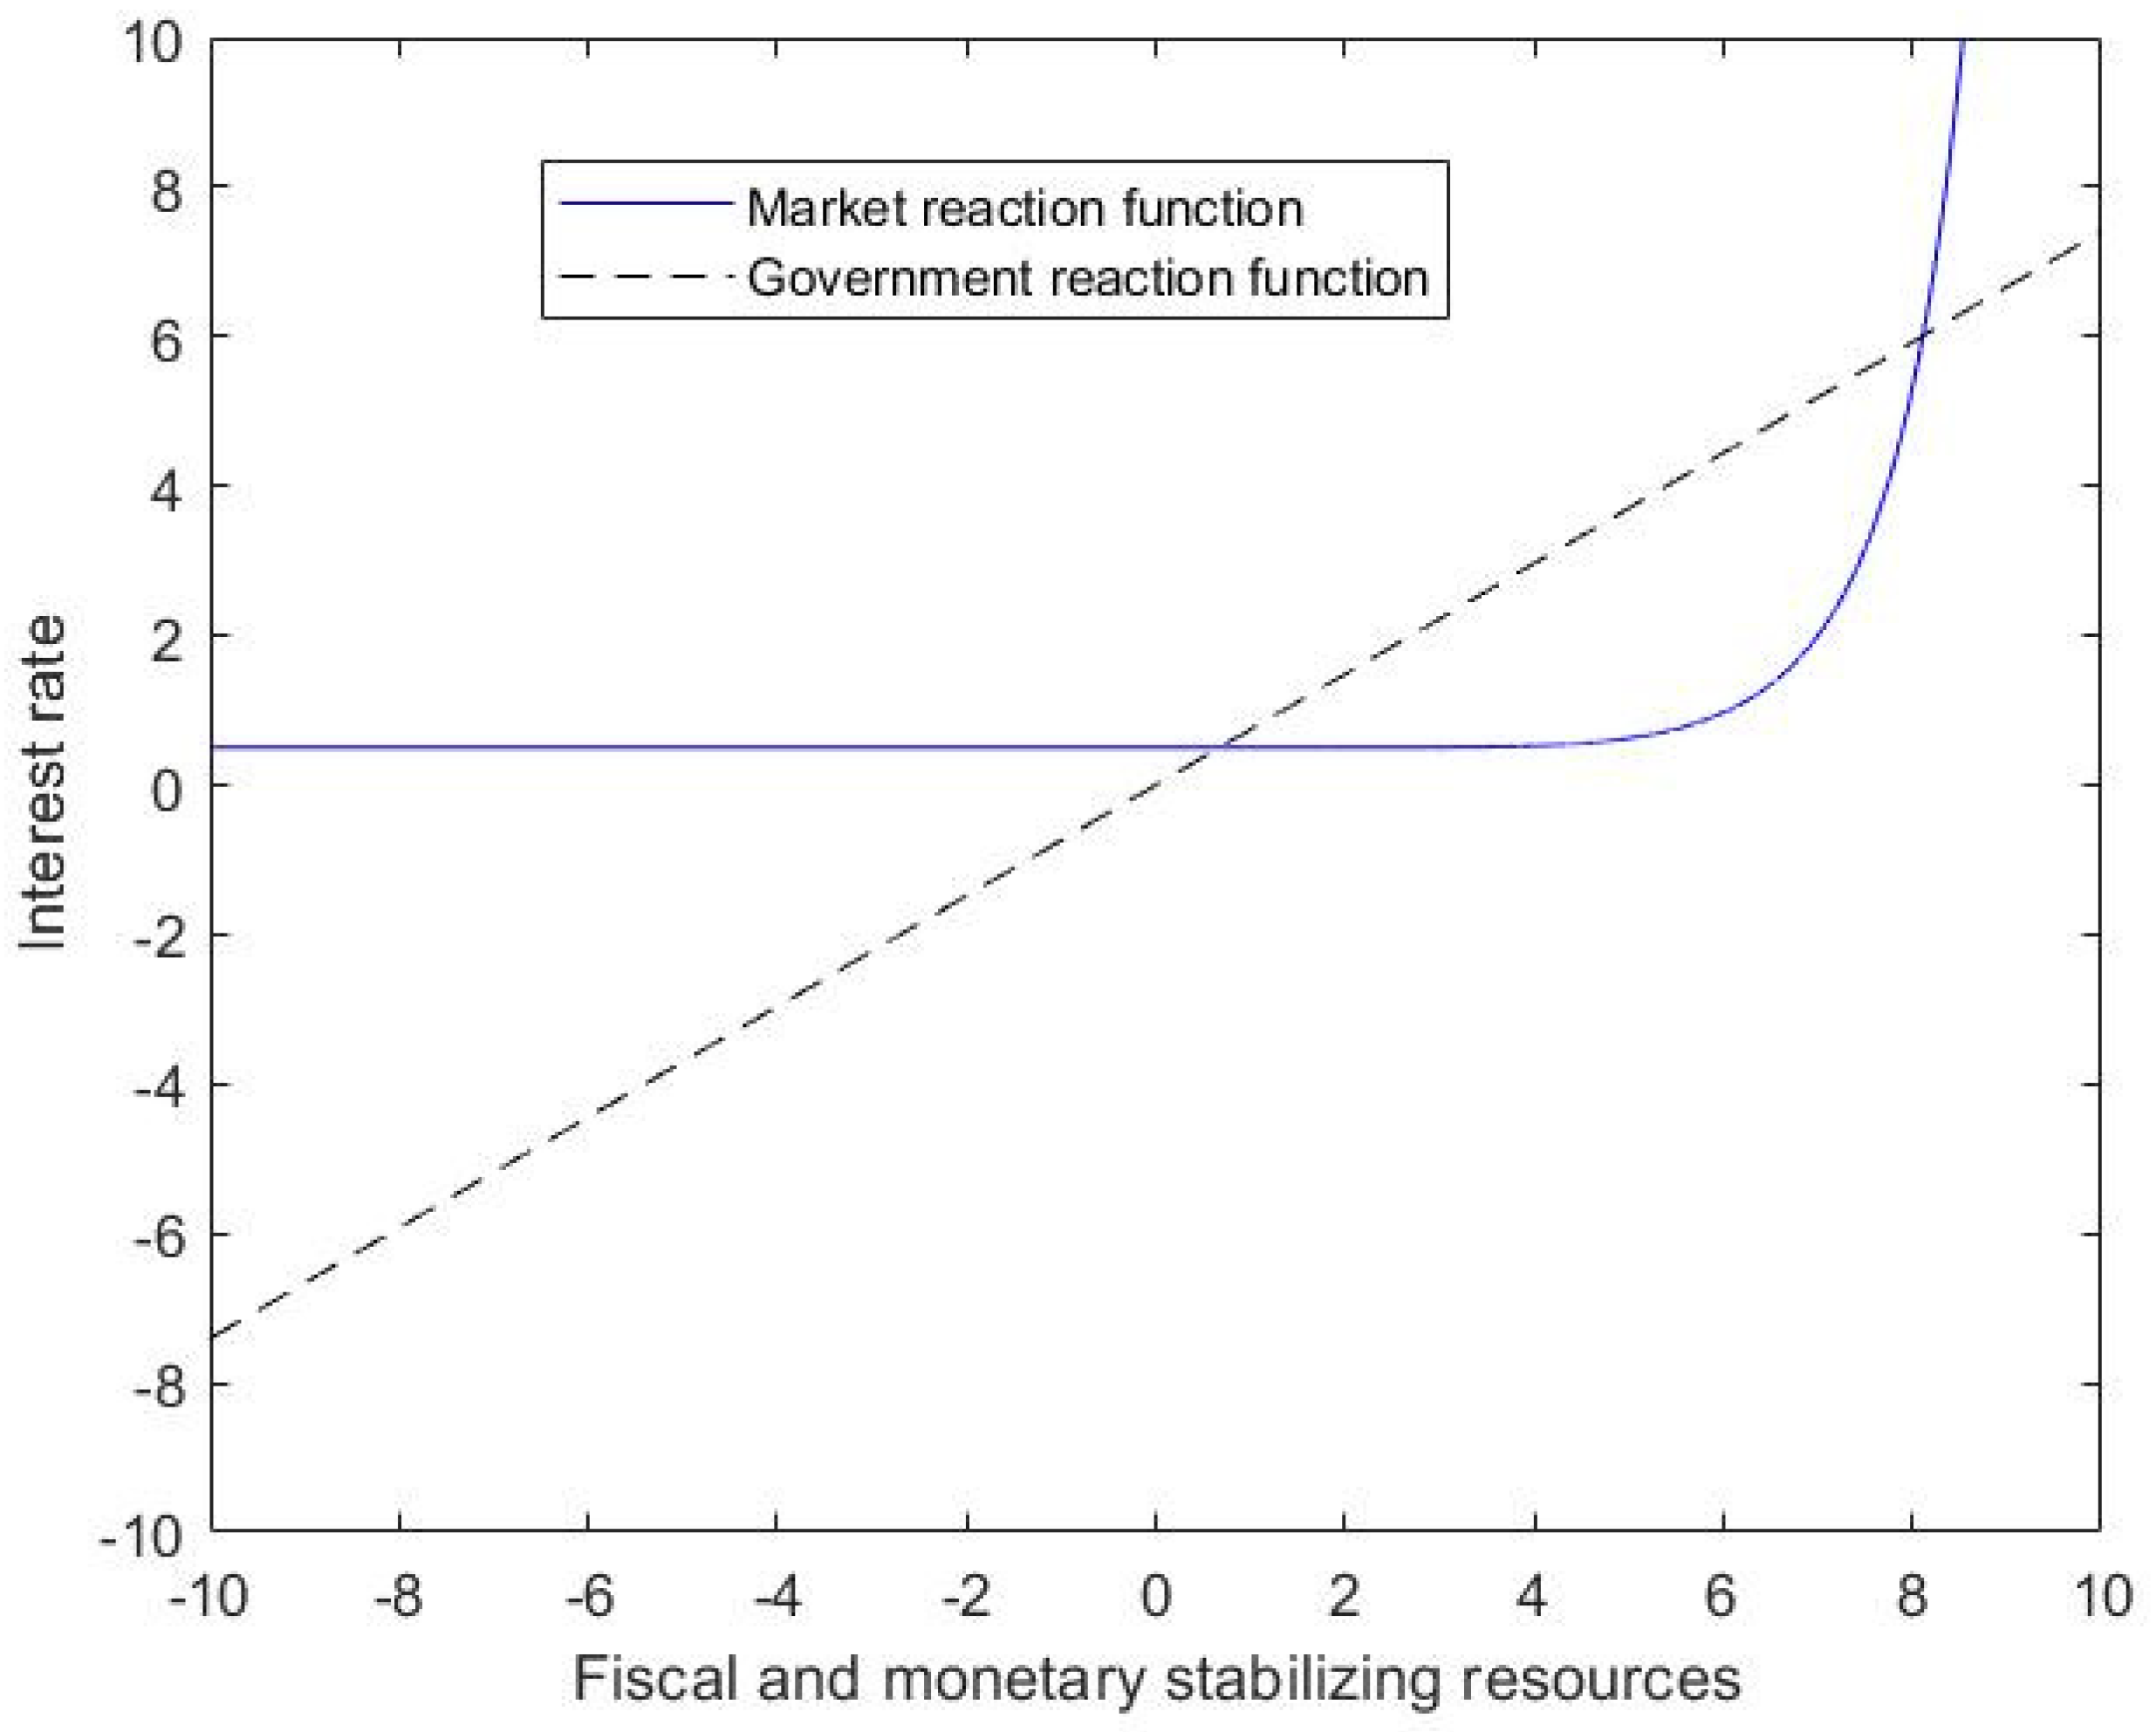
- Replacing Figure 1:Figure 1. Government and market reaction function before the pandemic. Legend: in Figure 1, the black dotted line represents the government reaction function and the blue continuous line represents the market reaction function. Public debt stability is granted up to an interest rate value of 6%.Figure 1. Government and market reaction function before the pandemic. Legend: in Figure 1, the black dotted line represents the government reaction function and the blue continuous line represents the market reaction function. Public debt stability is granted up to an interest rate value of 6%.
![Sustainability 14 07133 g001]()

- (2)
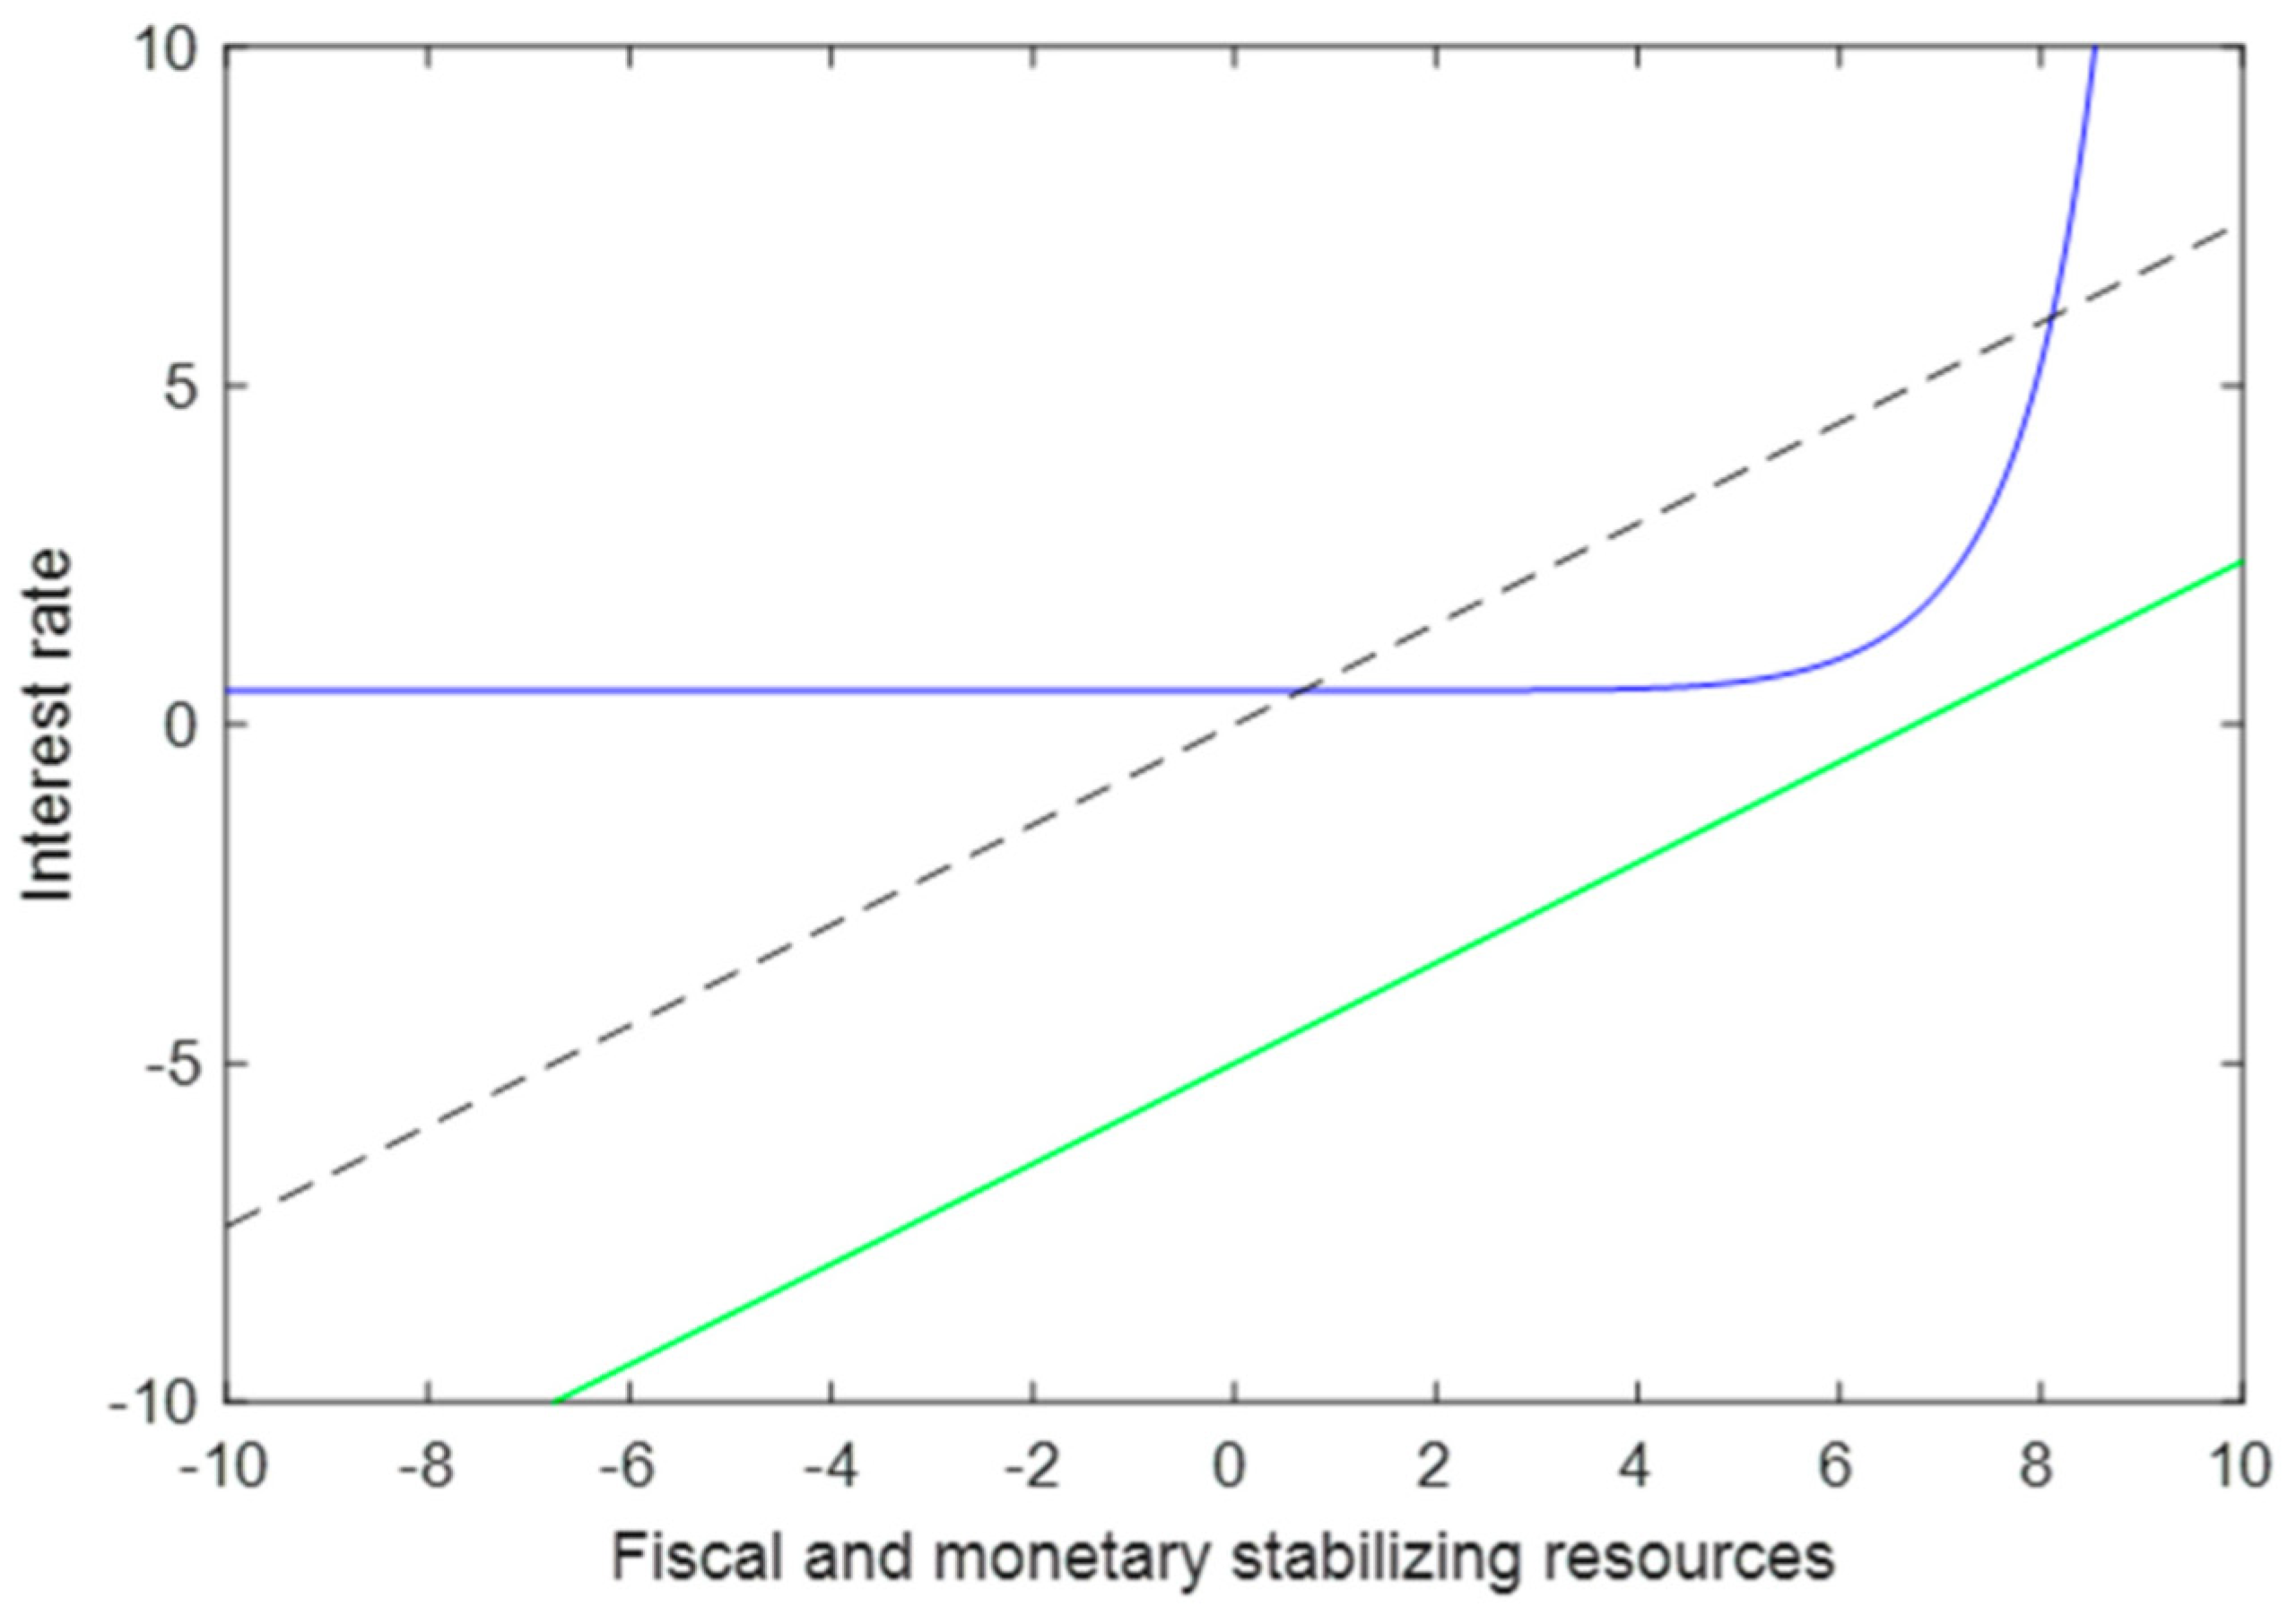
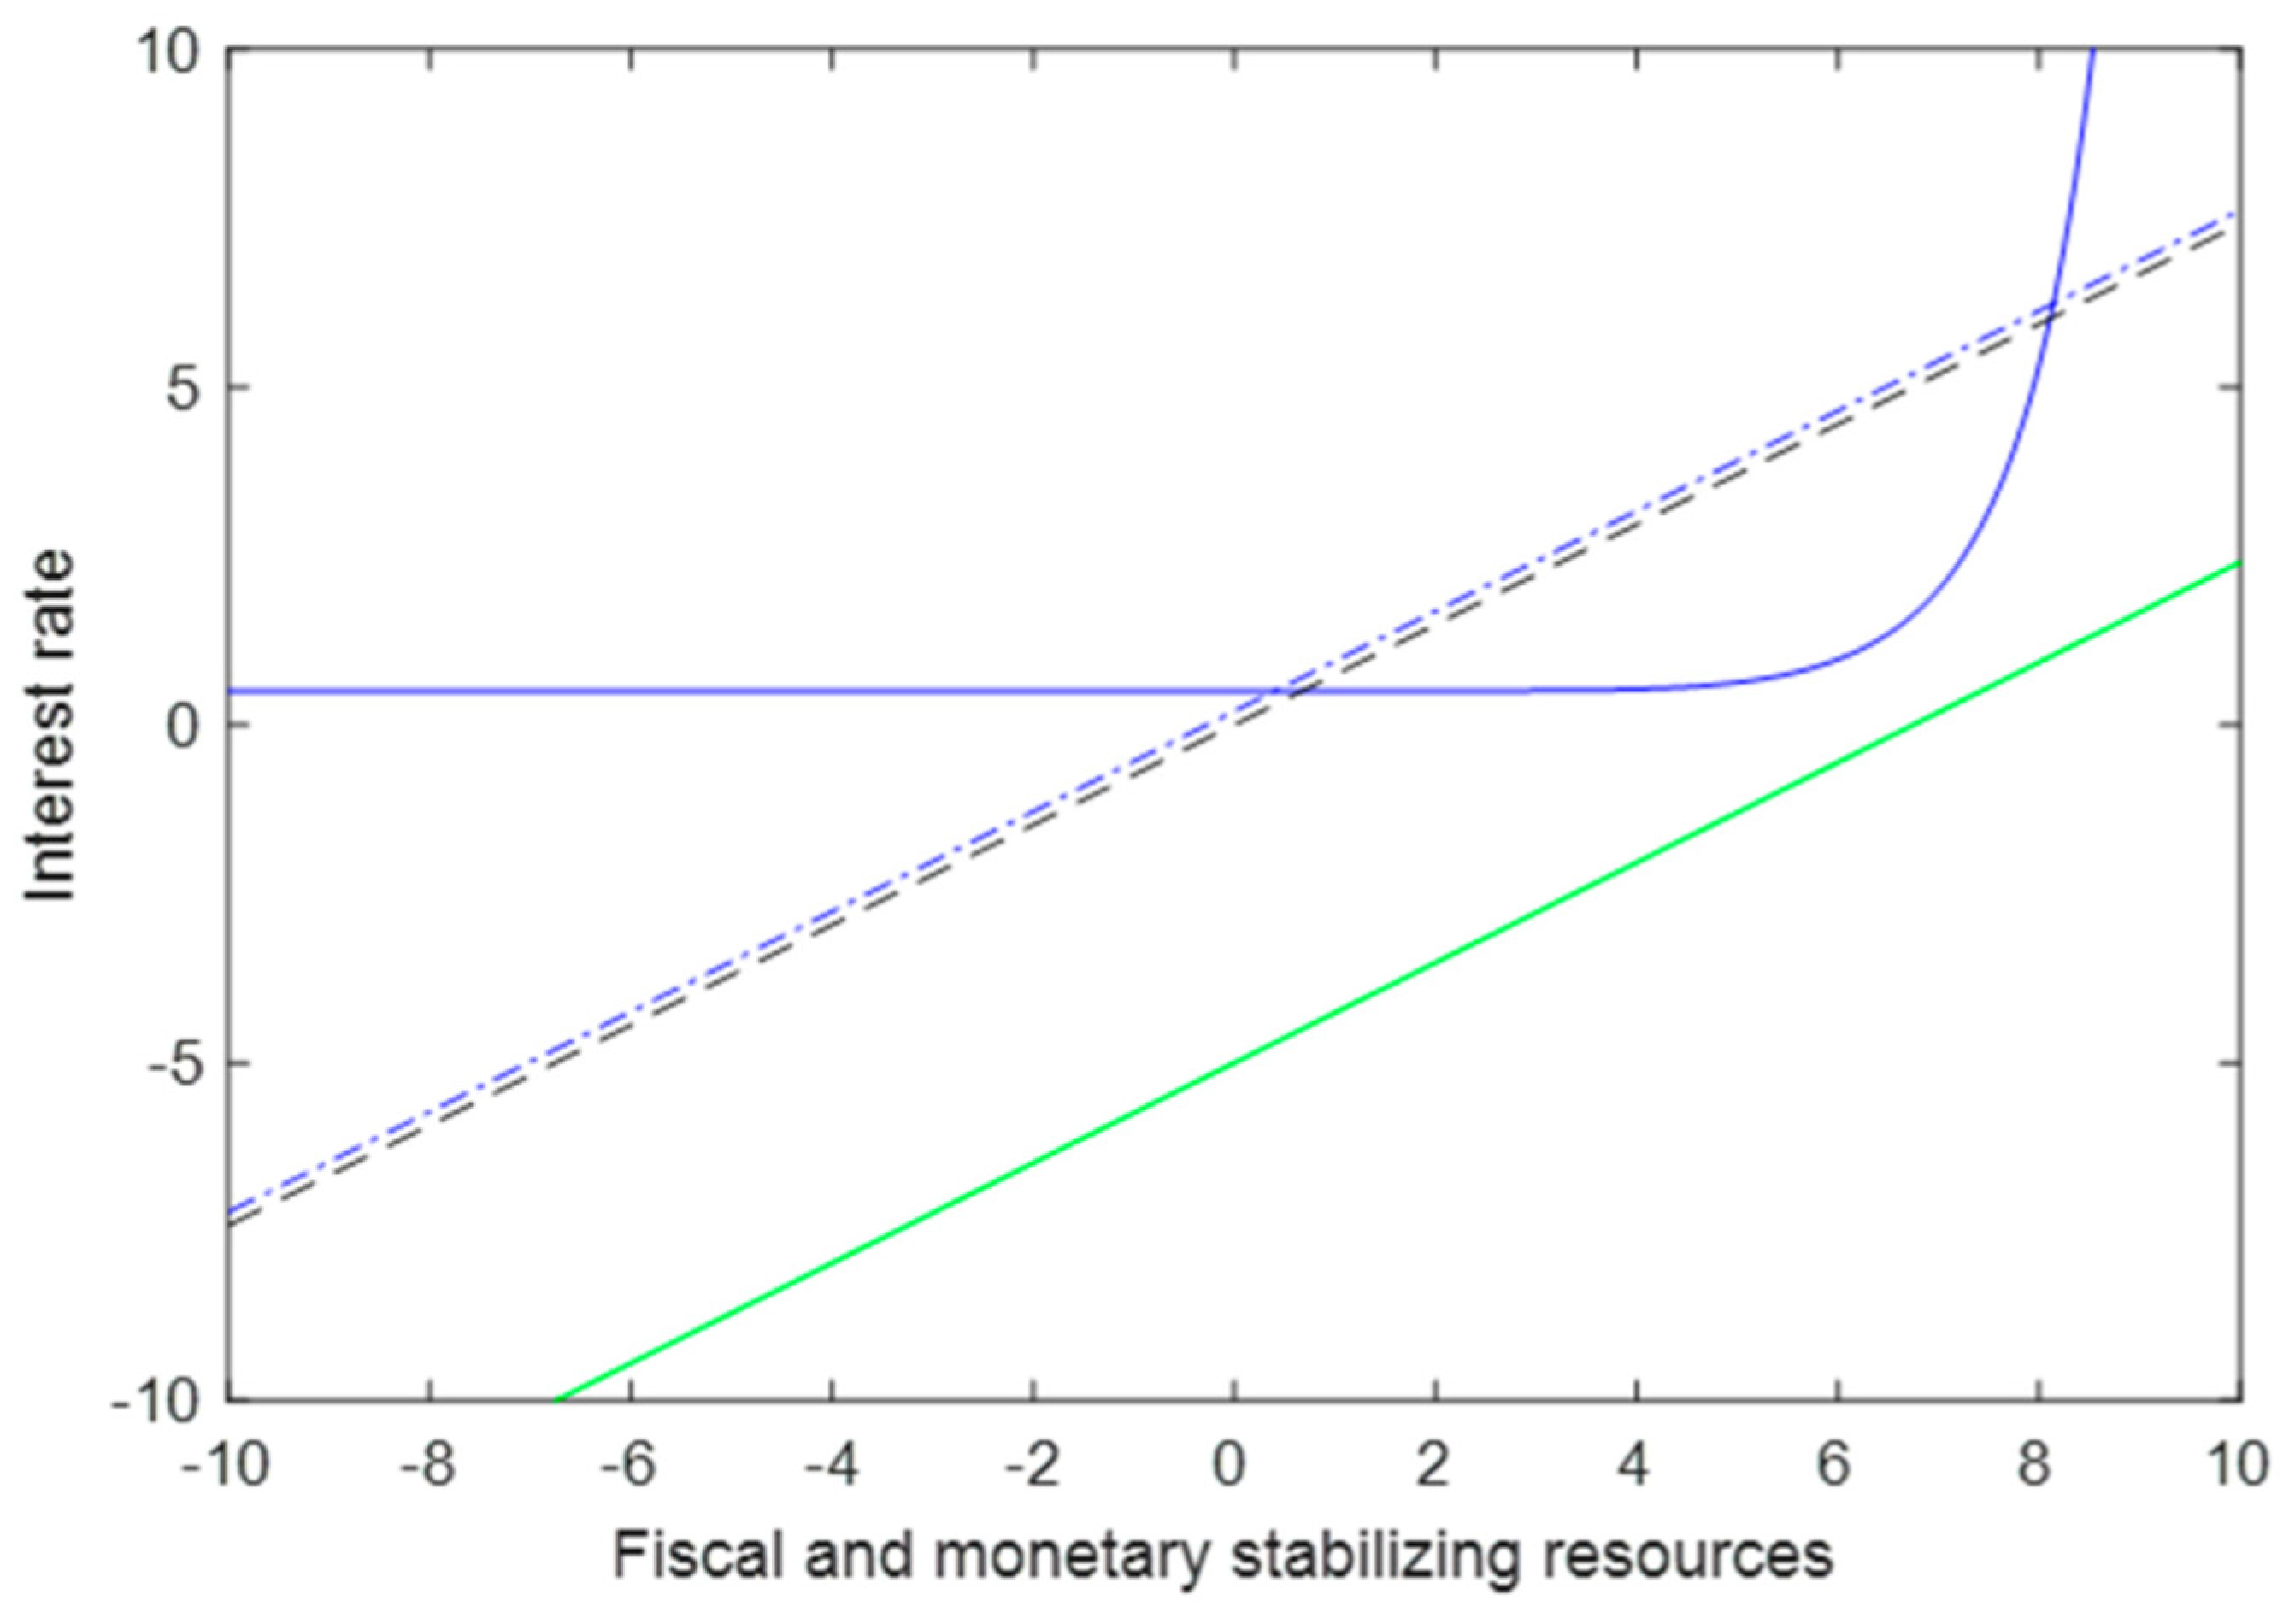
- Replacing Figure 2:Figure 2. The effect of the pandemic shock, v, on the stability of public debt/GDP. Legend: in Figure 2 the green continuous line represents the government reaction function when a 5% pandemic shock hits the economy, thereby making public debt unsustainable. As for blue and black lines see Legend in Figure 1.Figure 2. The effect of the pandemic shock, v, on the stability of public debt/GDP. Legend: in Figure 2 the green continuous line represents the government reaction function when a 5% pandemic shock hits the economy, thereby making public debt unsustainable. As for blue and black lines see Legend in Figure 1.
![Sustainability 14 07133 g002]()
- (3)
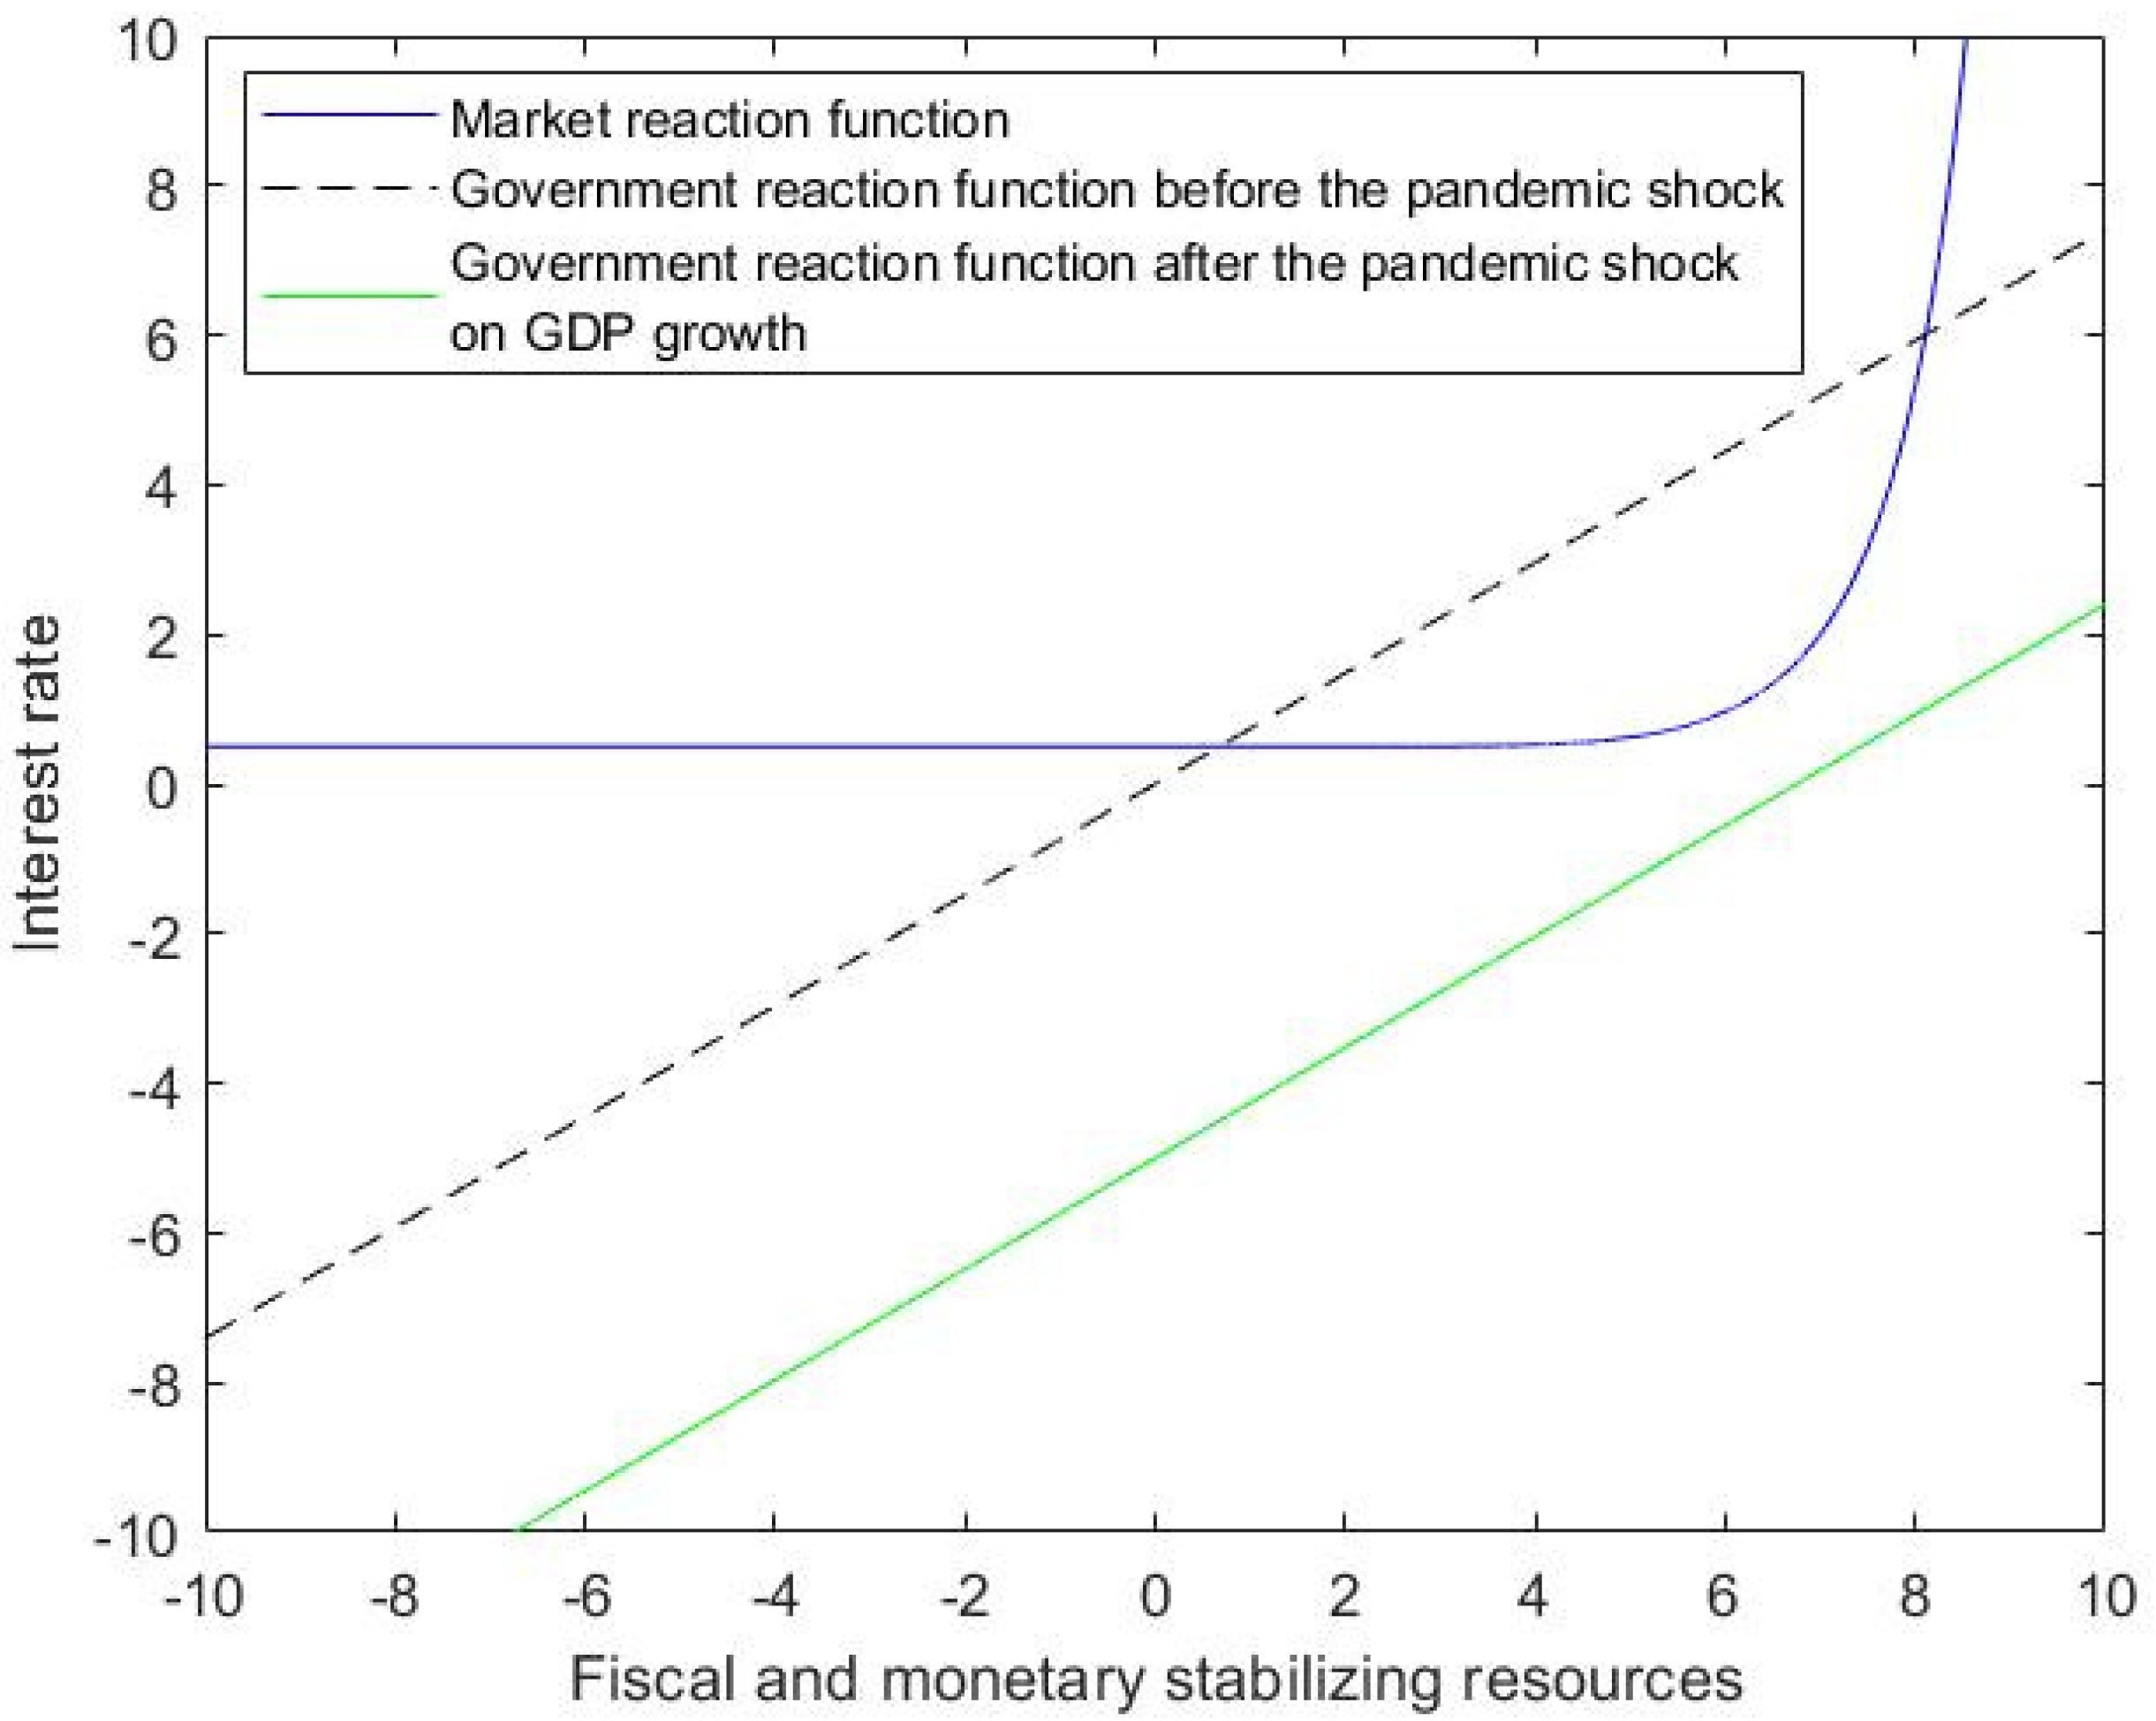
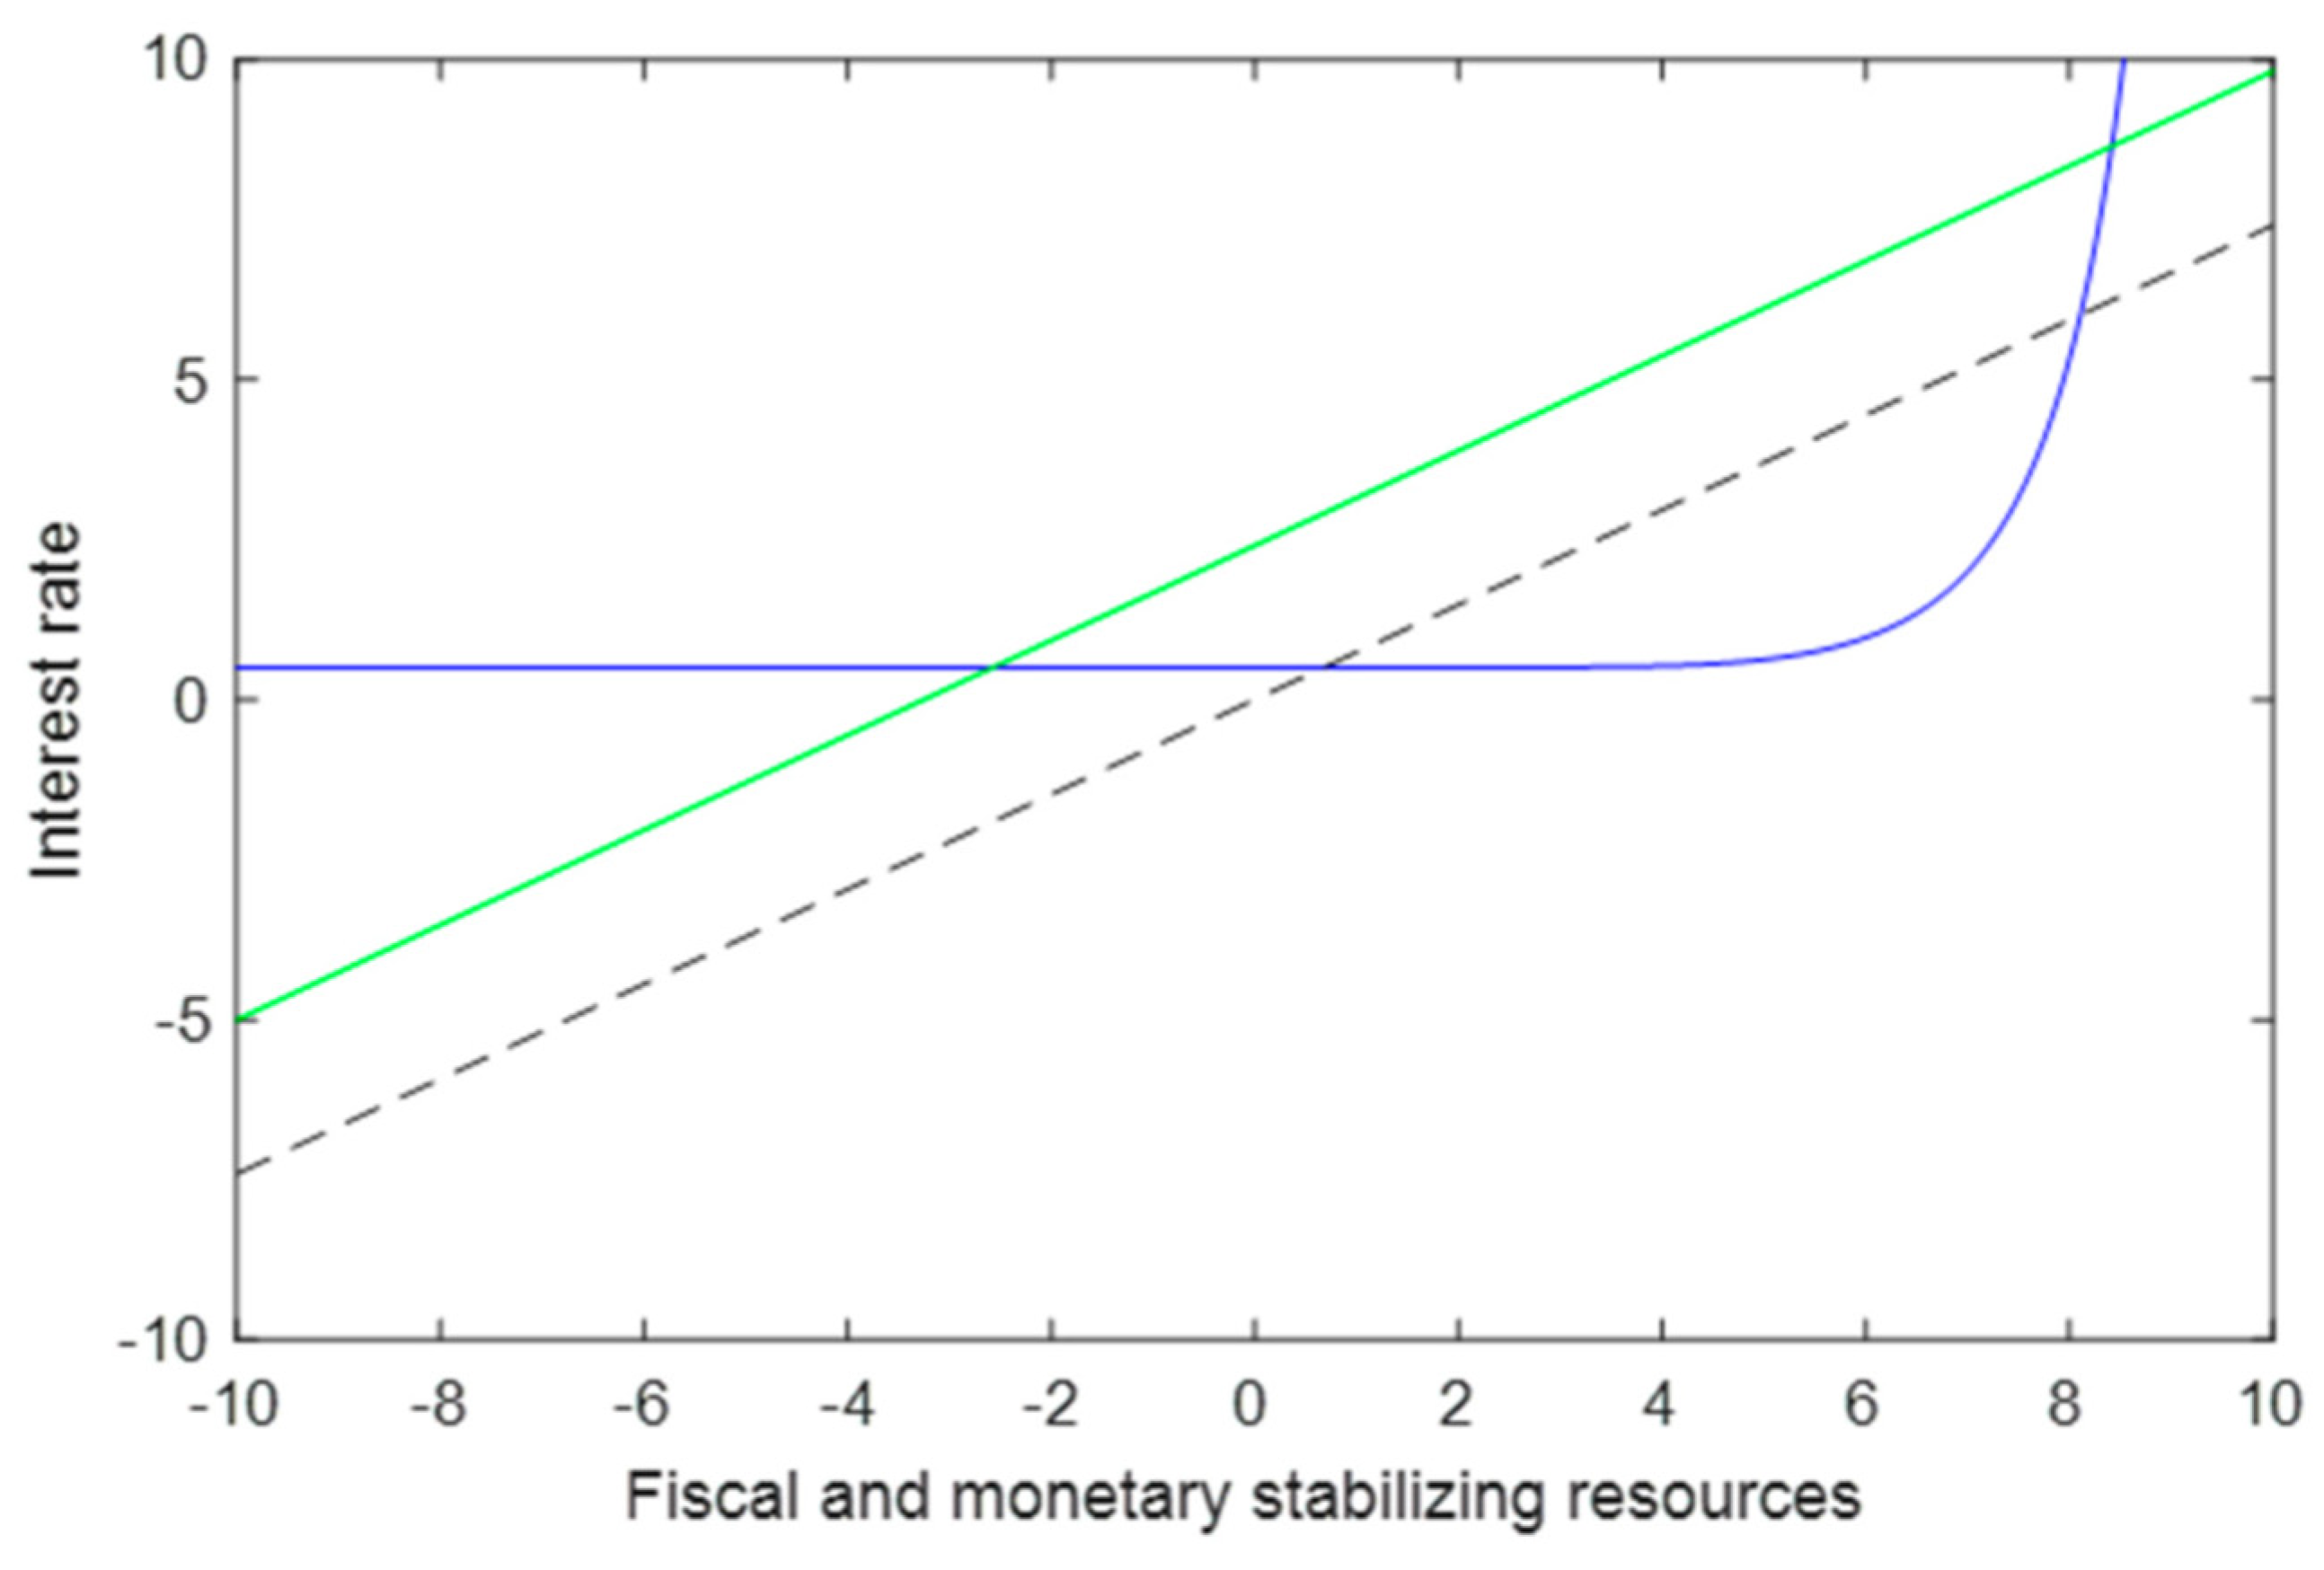
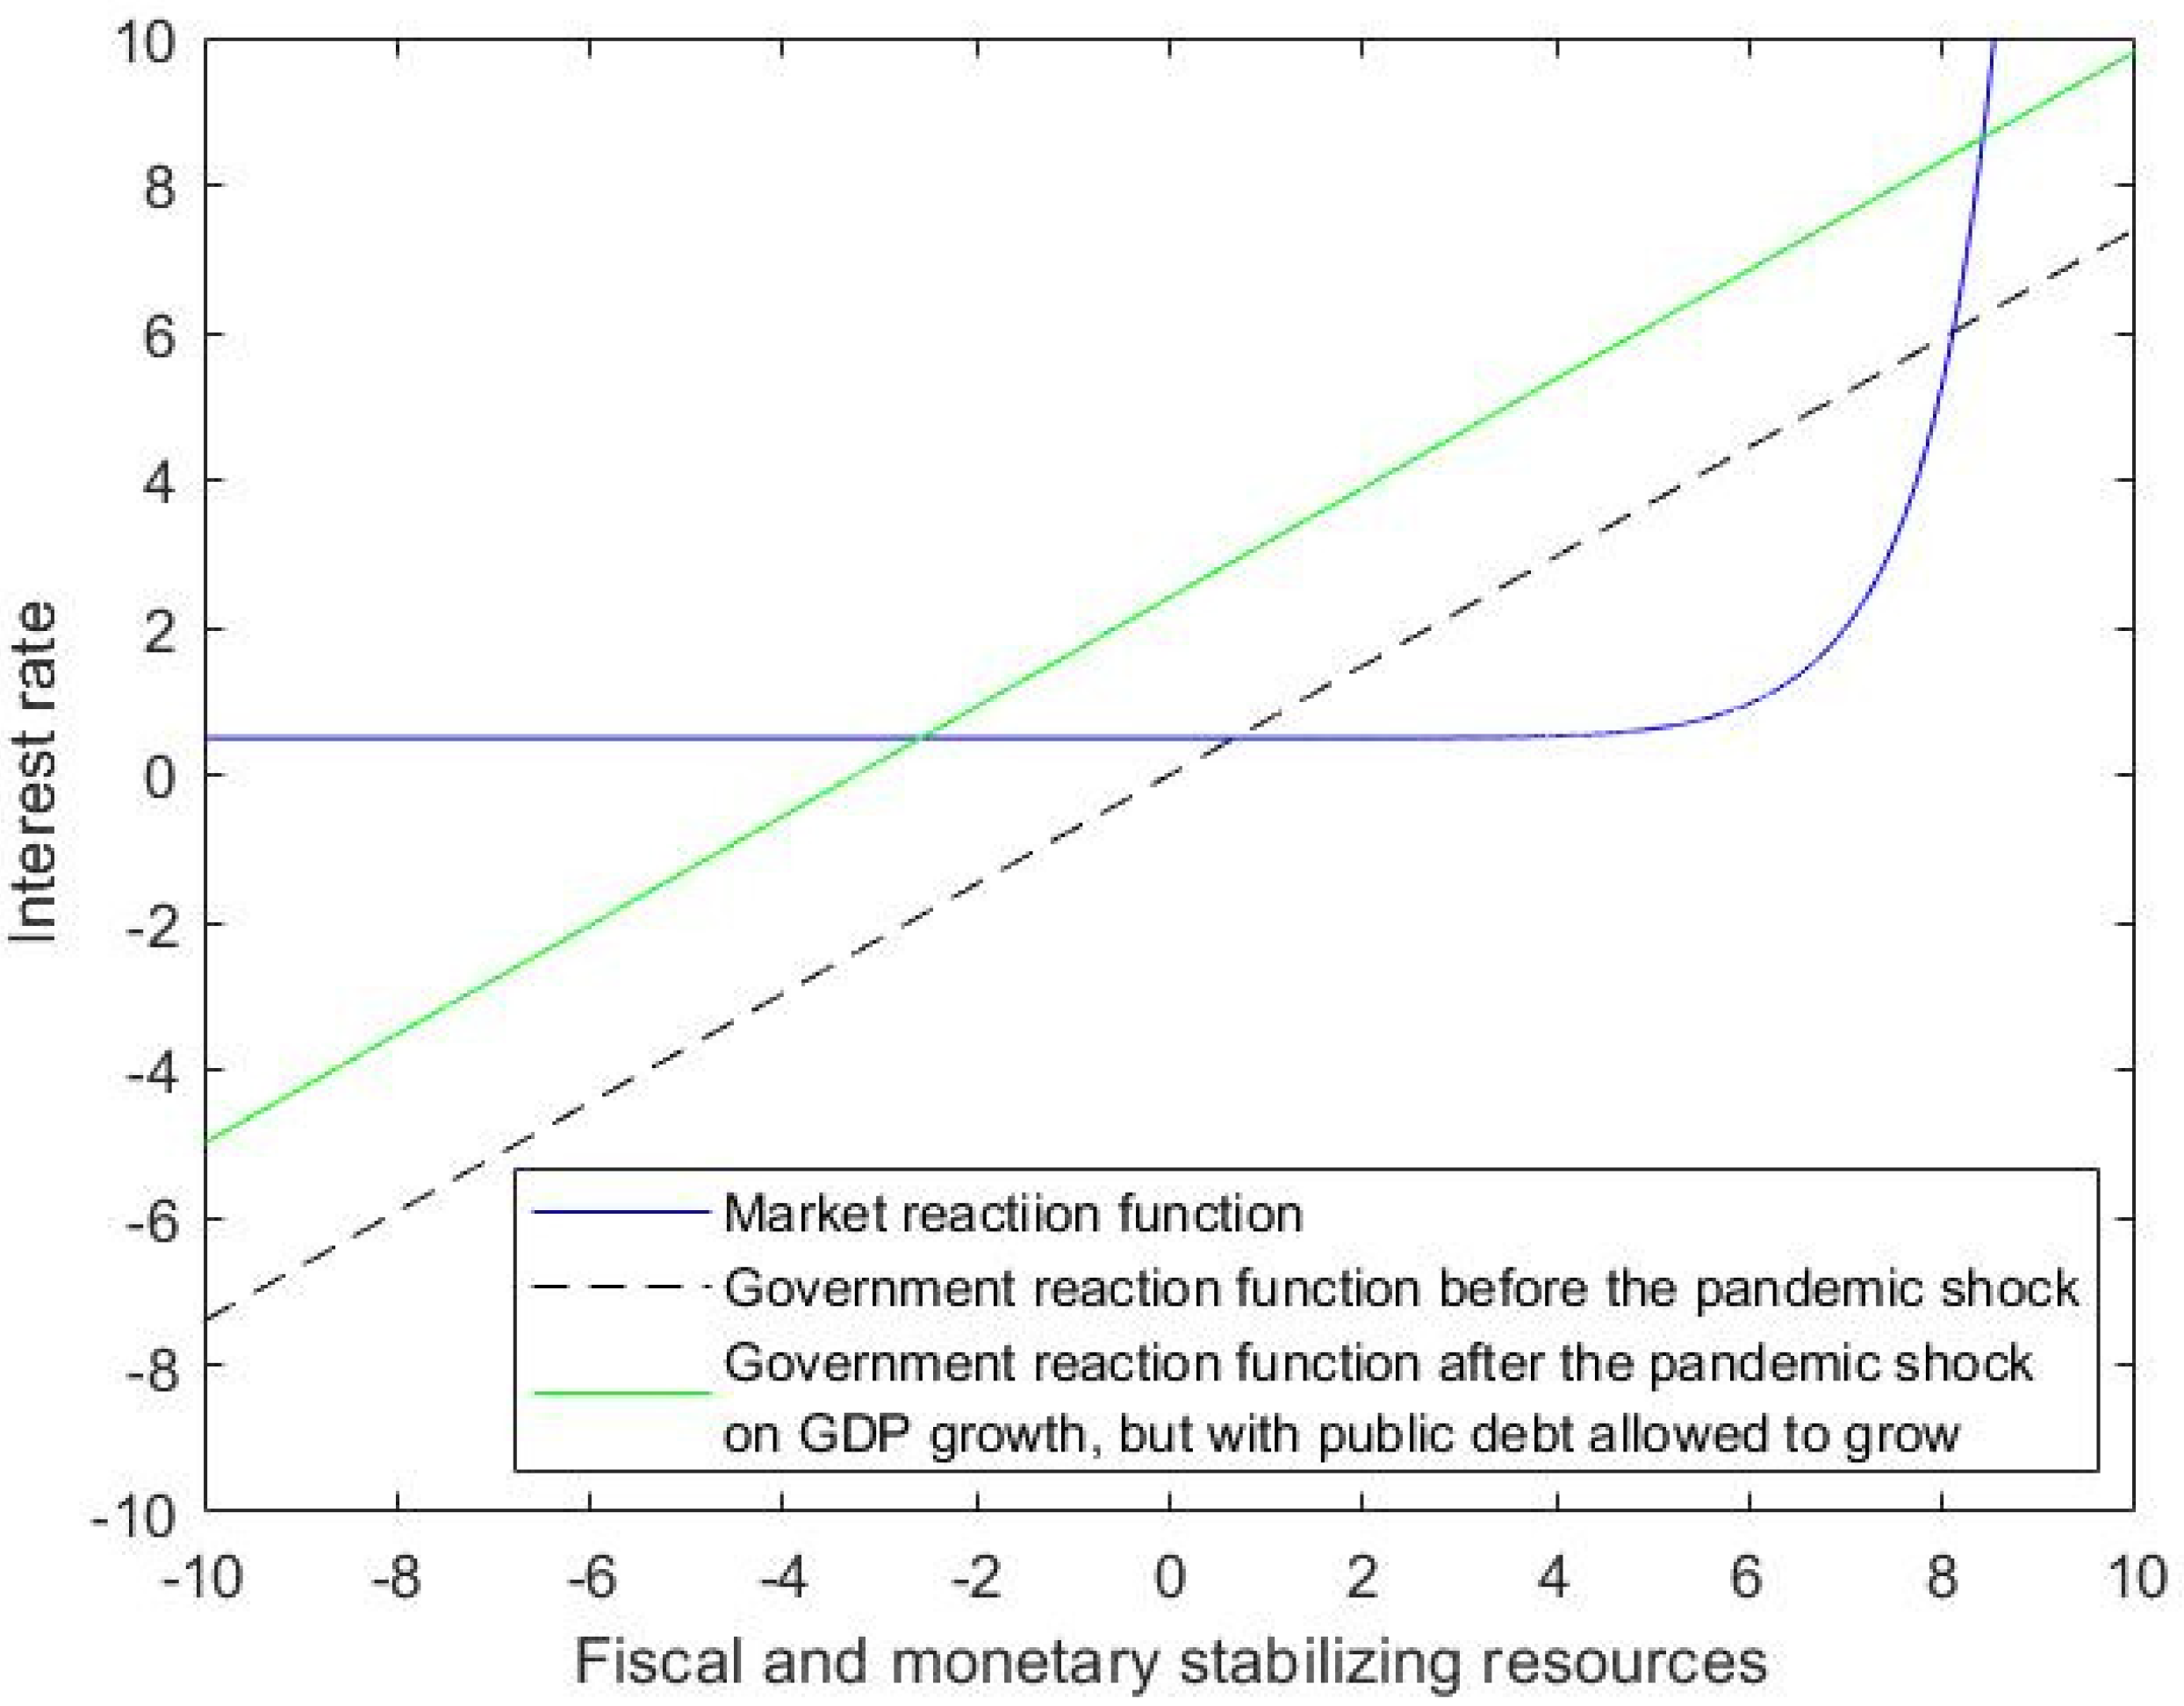
- Replacing Figure 3:Figure 3. Government and market reaction function before and after the pandemic – a negative shock, v, on GDP growth, with public debt allowed to grow. Legend: in Figure 3 the green continuous line represents the government reaction function when a 5% pandemic shock hits the economy, and the public debt is allowed to grow at a higher level. As for blue and black lines see Legend in Figure 1.Figure 3. Government and market reaction function before and after the pandemic – a negative shock, v, on GDP growth, with public debt allowed to grow. Legend: in Figure 3 the green continuous line represents the government reaction function when a 5% pandemic shock hits the economy, and the public debt is allowed to grow at a higher level. As for blue and black lines see Legend in Figure 1.
![Sustainability 14 07133 g003]()
- (4)
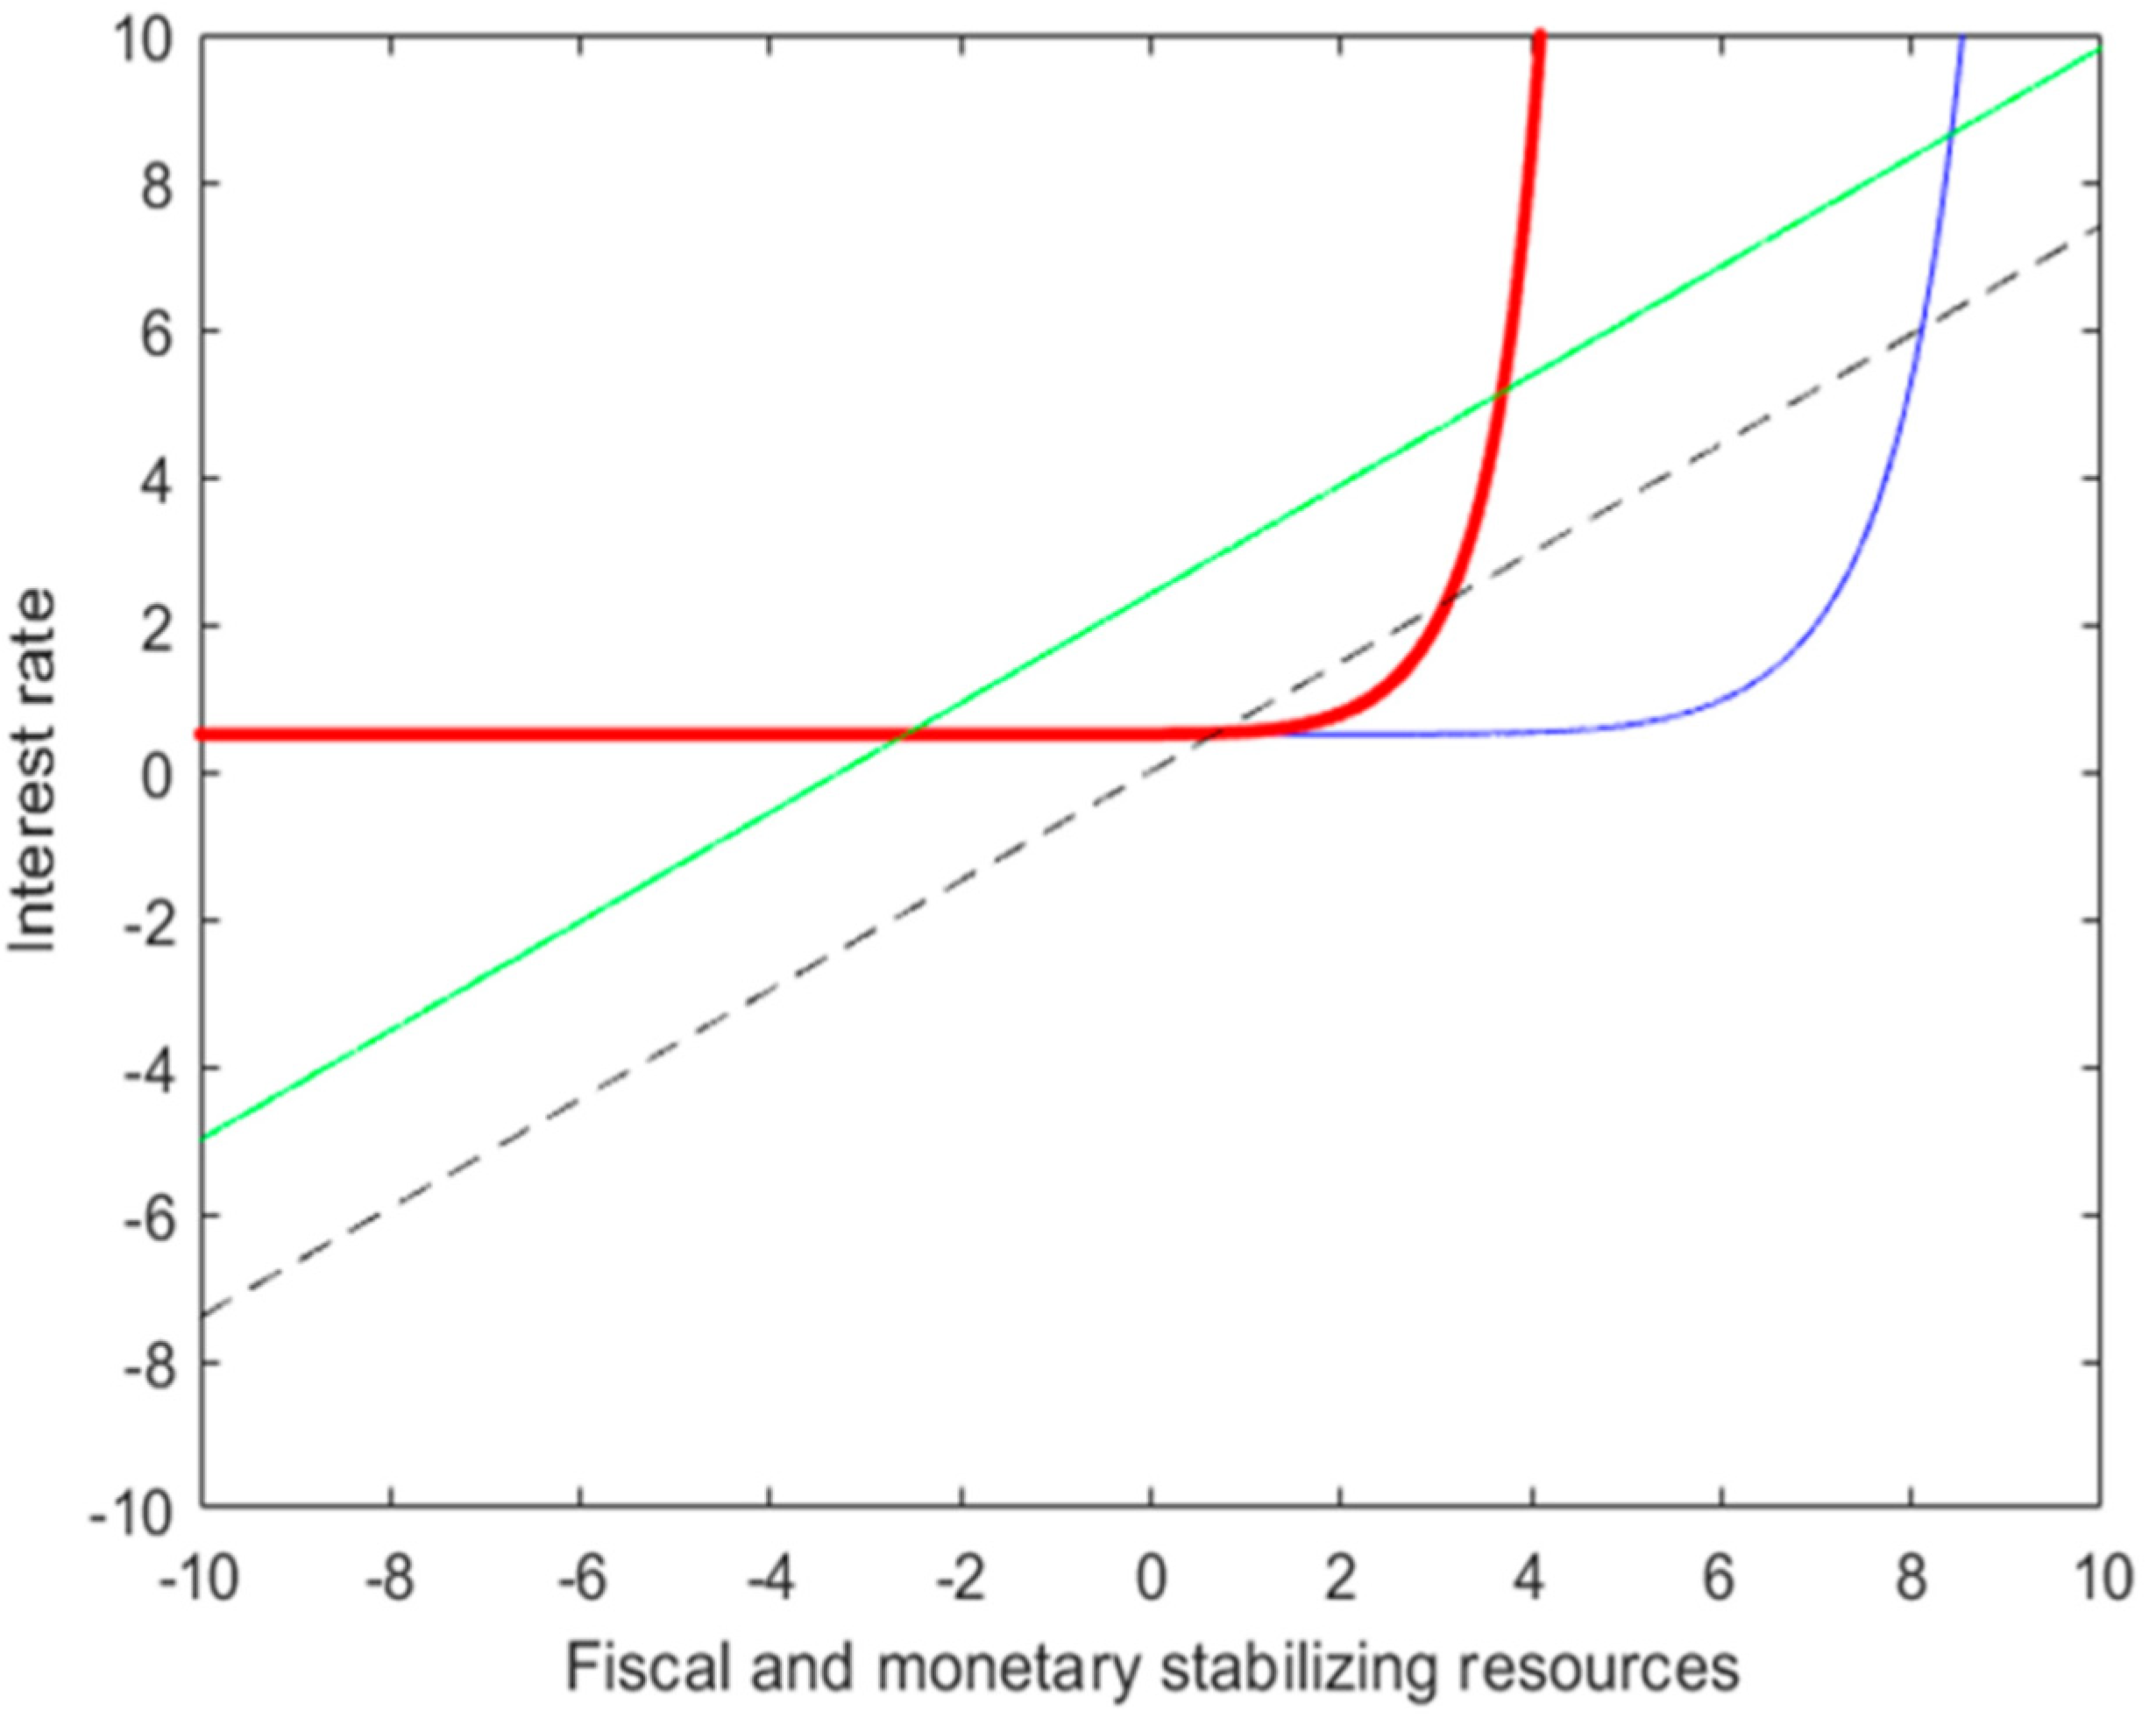
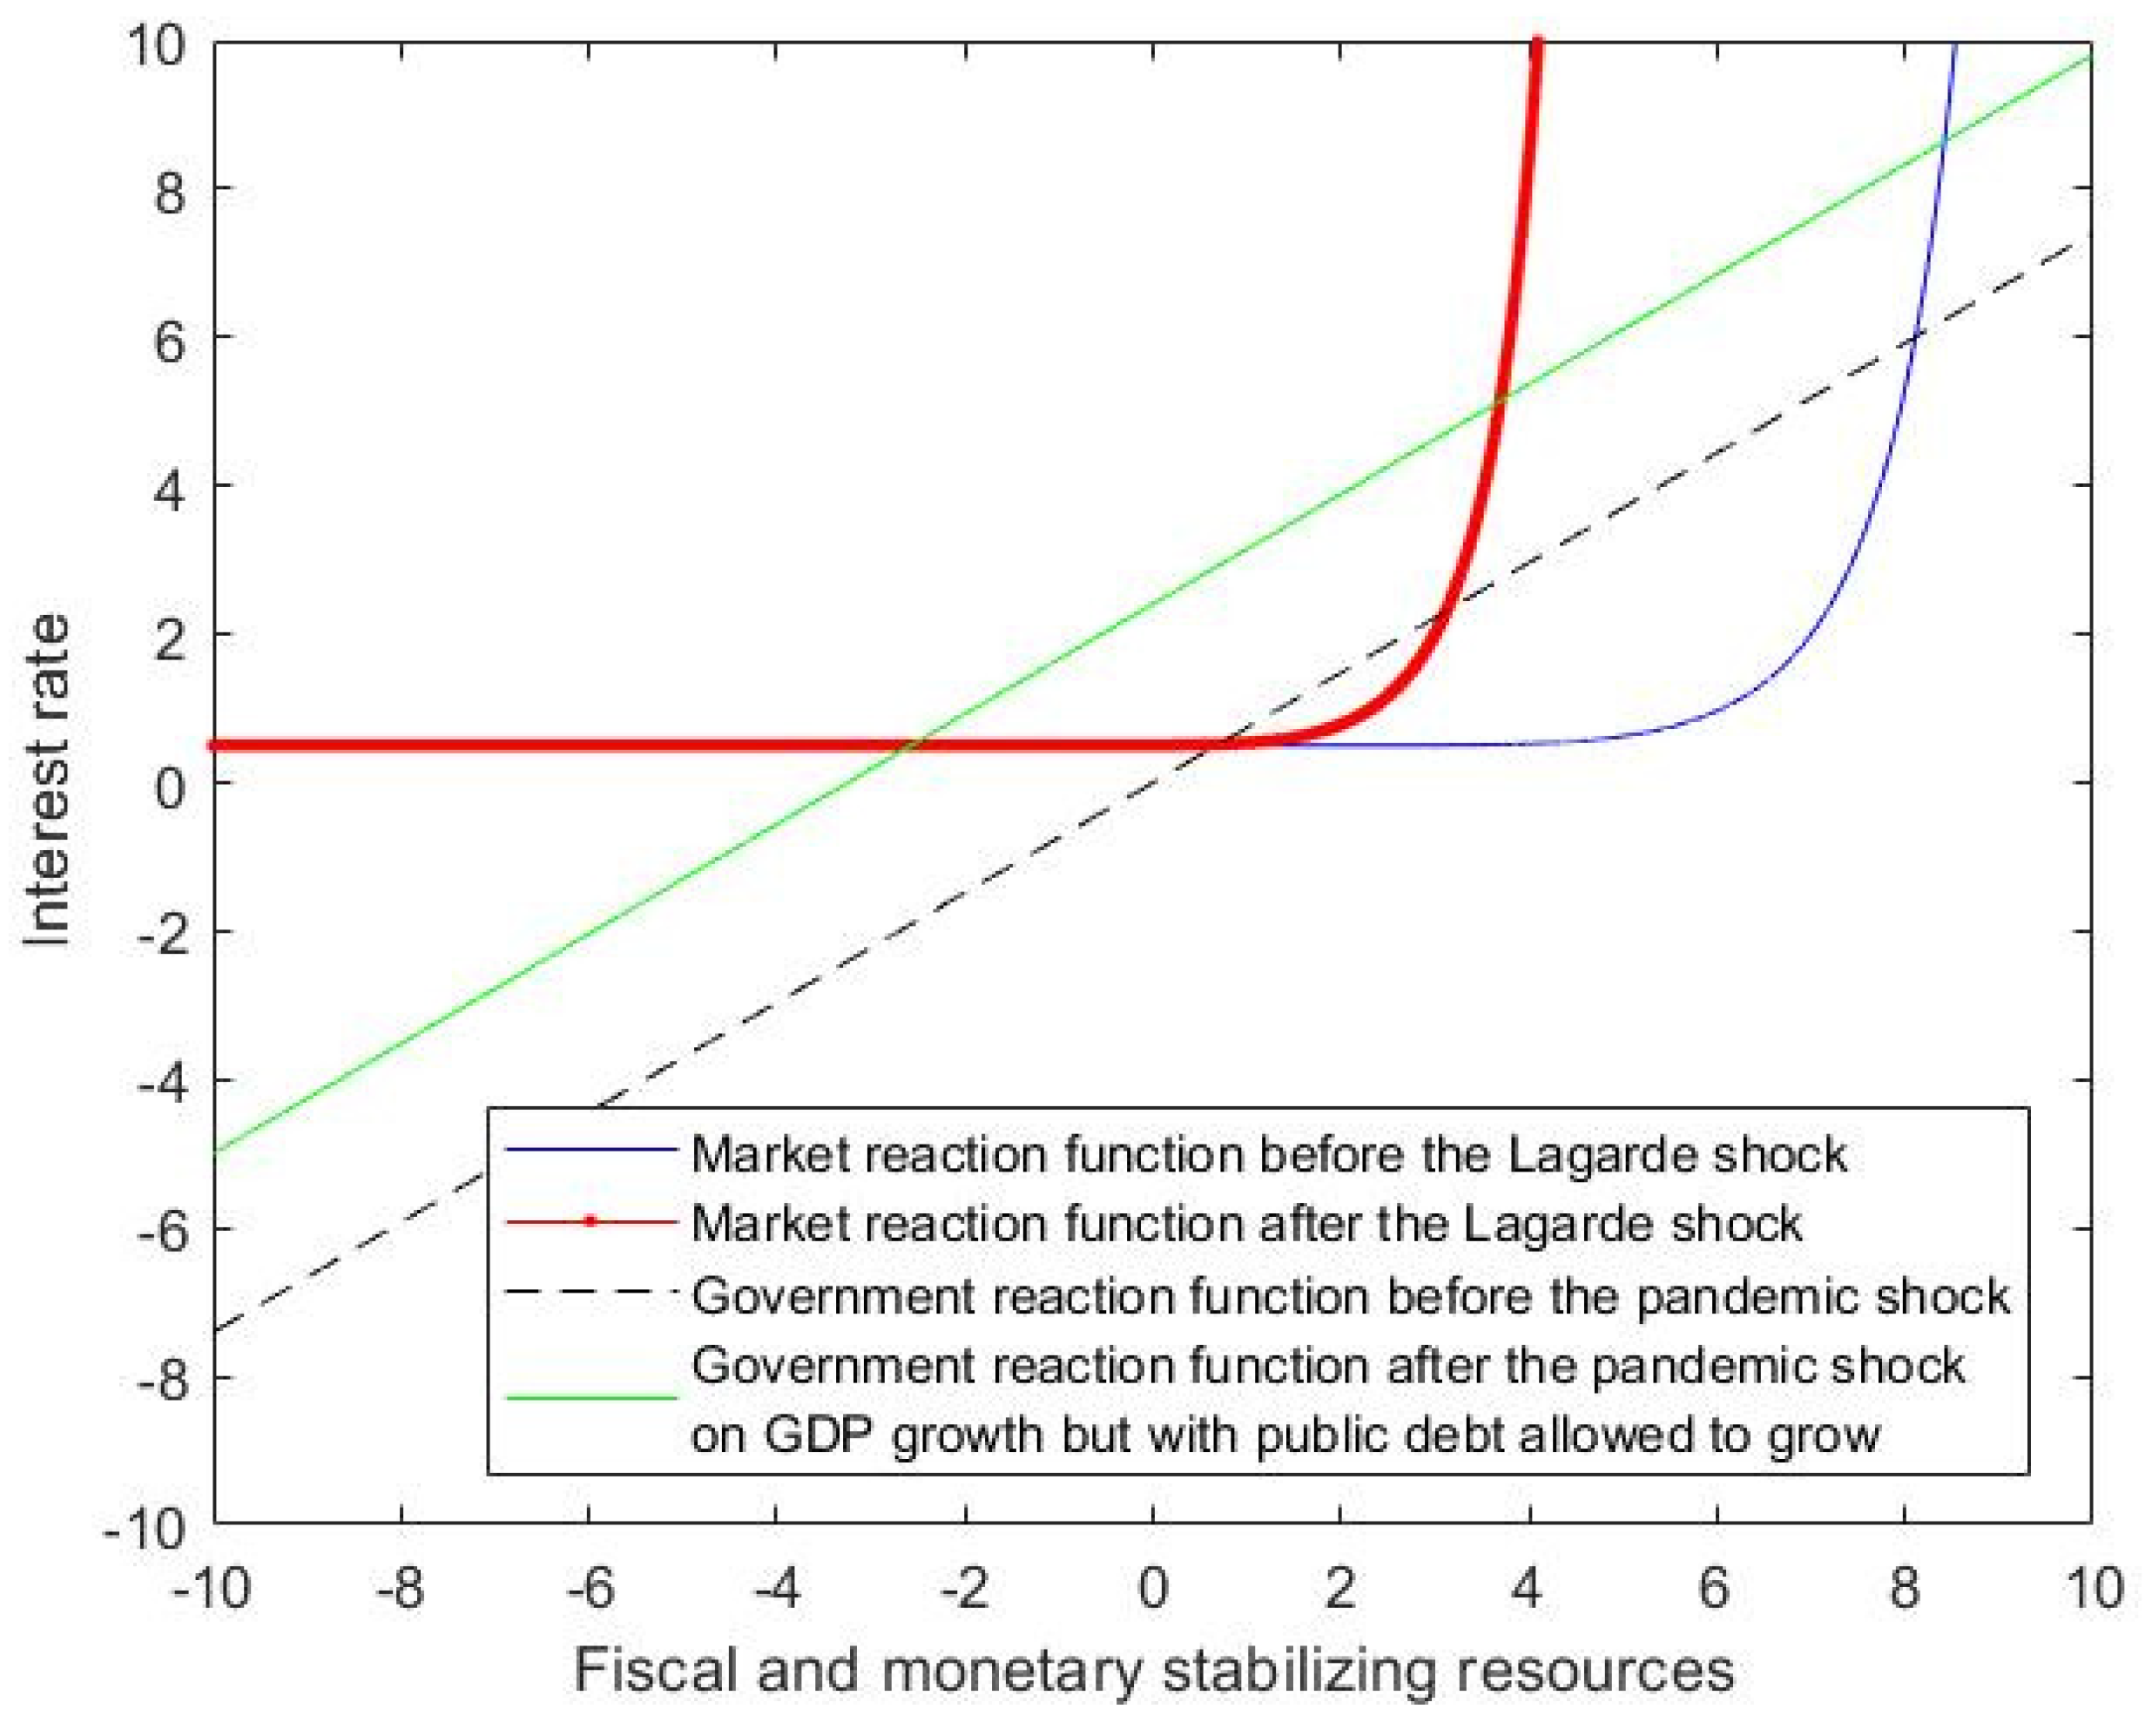
- Replacing Figure 4:Figure 4. The Lagarde shock. Legend: in Figure 4 the red continuous line represents the market reaction function resulting from the ‘Lagarde shock’, making the interest rate more reactive to given fiscal and monetary resources. As for blue and black lines see Legend in Figure 1. As for green line see Legend in Figure 3.Figure 4. The Lagarde shock. Legend: in Figure 4 the red continuous line represents the market reaction function resulting from the ‘Lagarde shock’, making the interest rate more reactive to given fiscal and monetary resources. As for blue and black lines see Legend in Figure 1. As for green line see Legend in Figure 3.
![Sustainability 14 07133 g004]()
- (5)
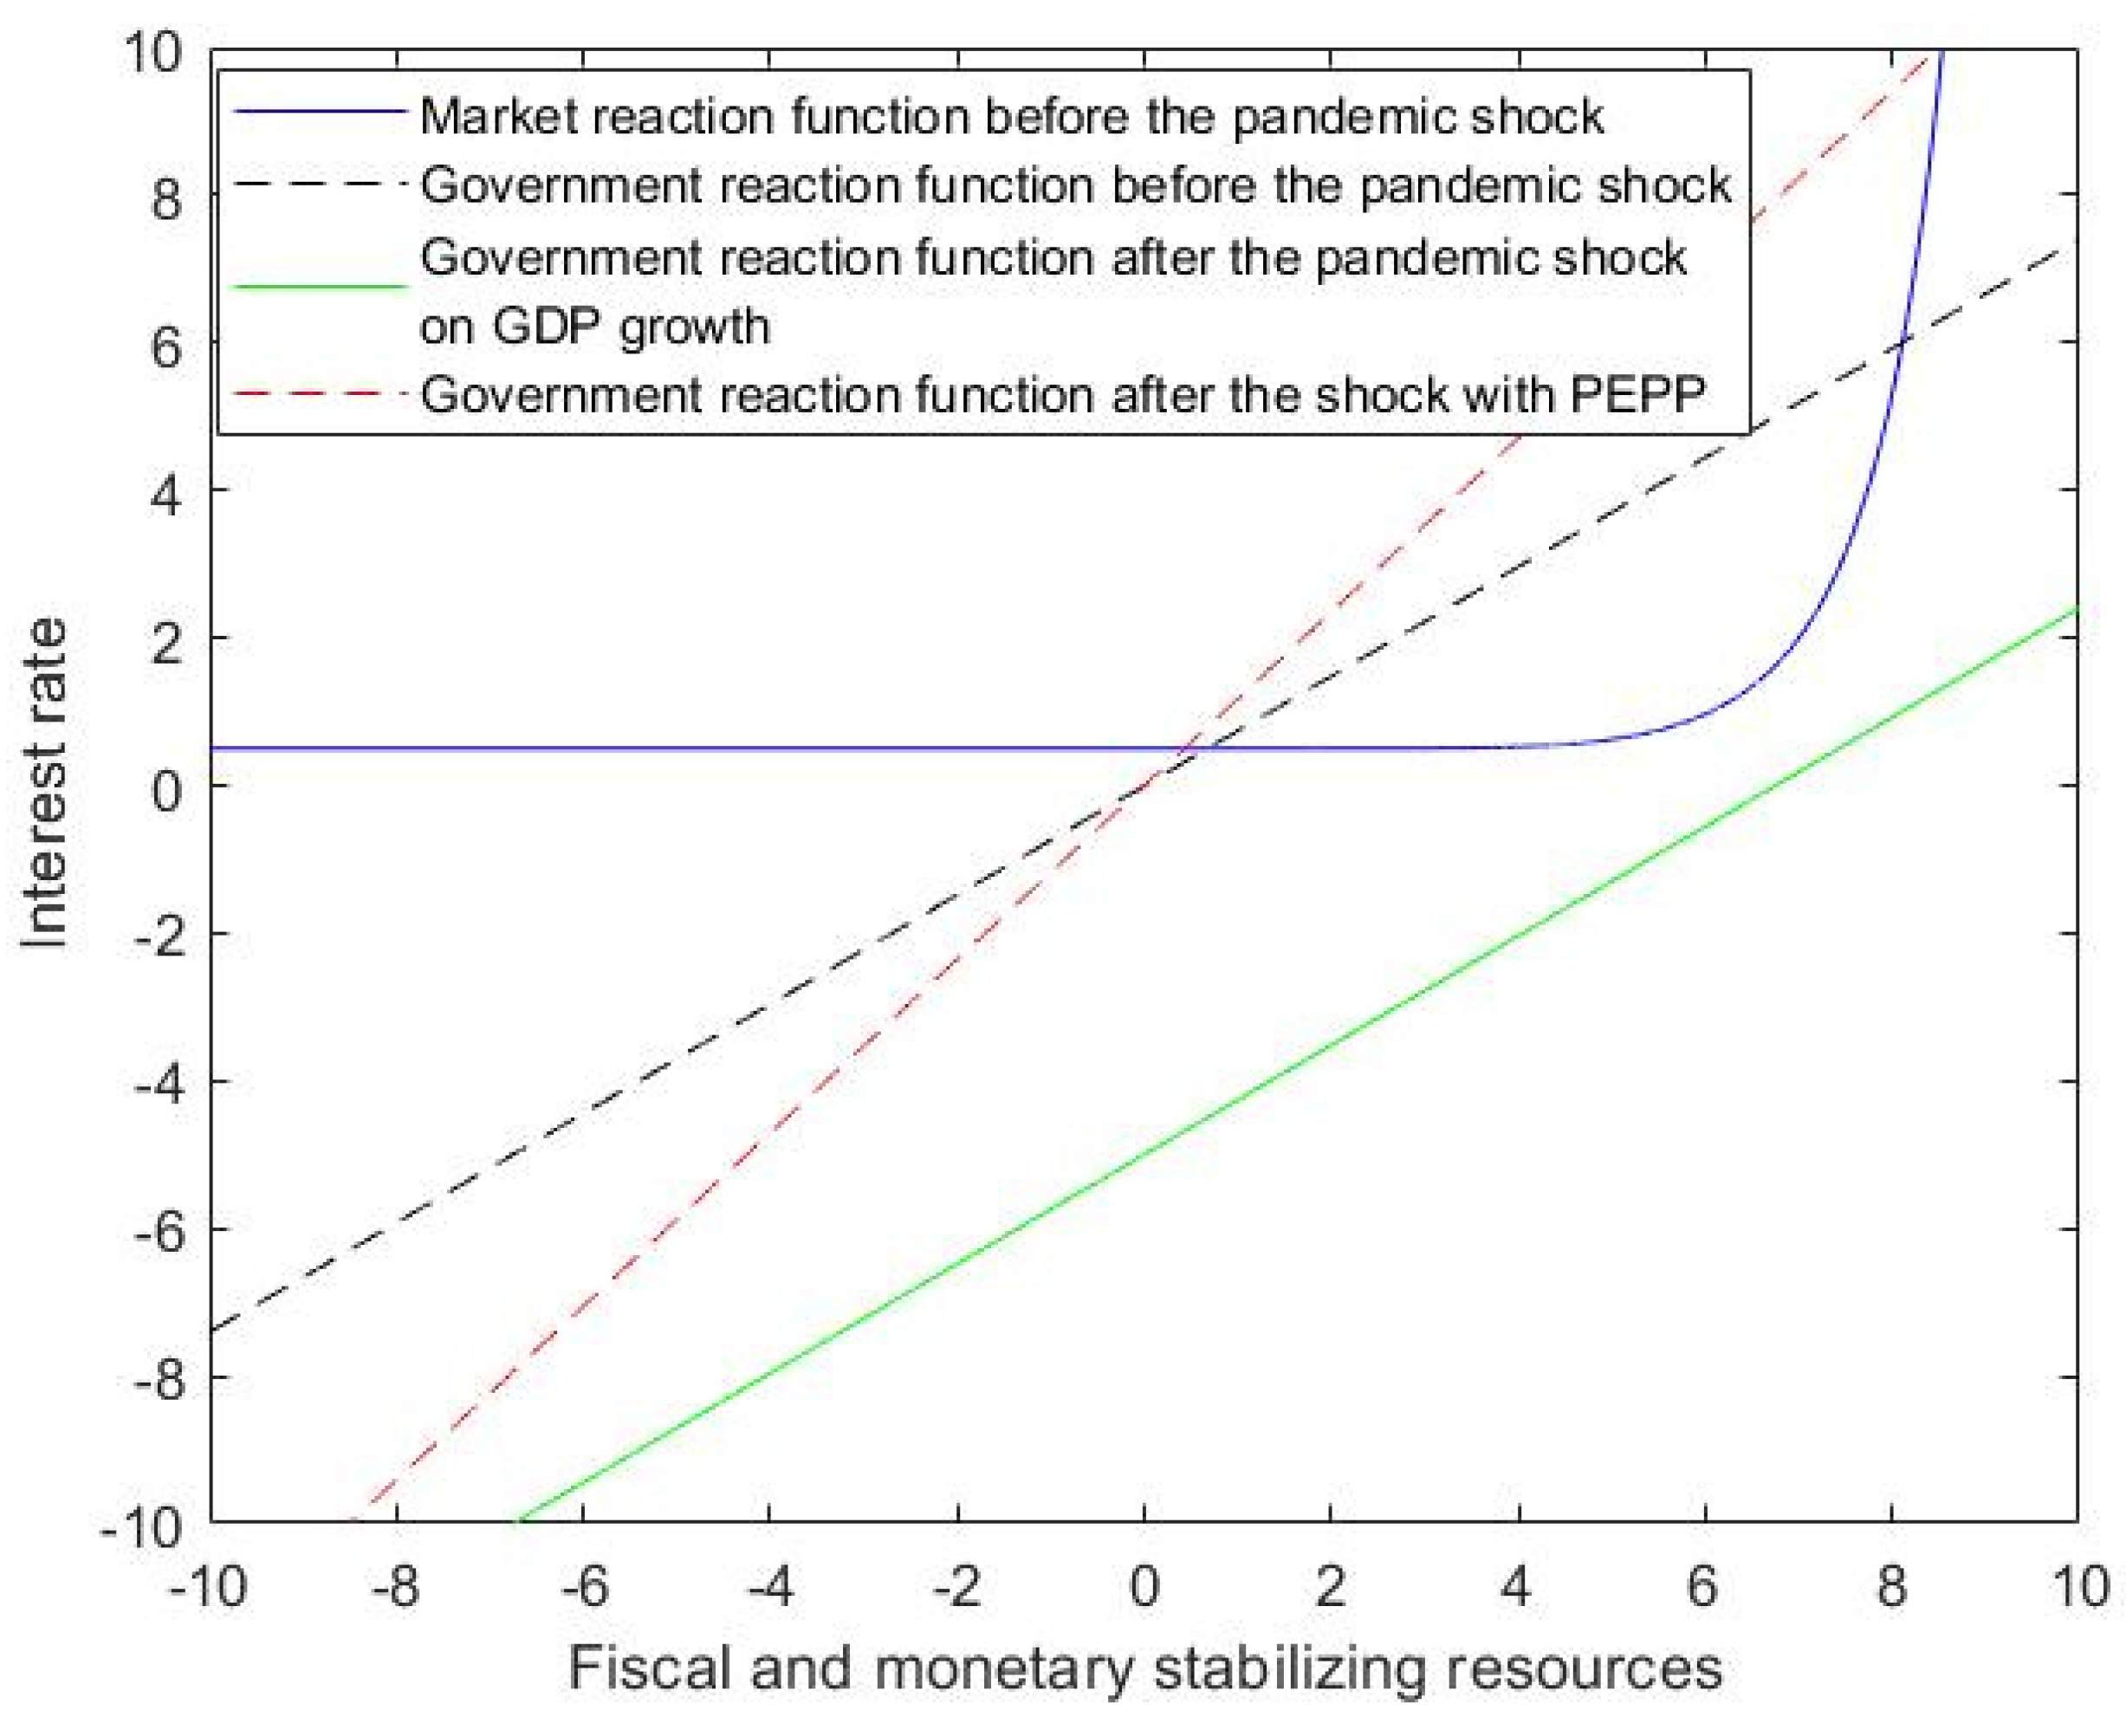
- Replacing Figure 5:Figure 5. Government and market reaction function with the PEPP. Legend: in Figure 5 the red dotted line represents the government reaction function when the 5% pandemic shock has hit the economy and a PEPP is introduced thereby reducing the share of debt which is subject to the higher risk premium charged by the market. As a result, an even larger area of public debt stability is gained, for levels of the interest rate lower than 10%. As for blue and black lines see Legend in Figure 1. As for green line see Legend in Figure 3.Figure 5. Government and market reaction function with the PEPP. Legend: in Figure 5 the red dotted line represents the government reaction function when the 5% pandemic shock has hit the economy and a PEPP is introduced thereby reducing the share of debt which is subject to the higher risk premium charged by the market. As a result, an even larger area of public debt stability is gained, for levels of the interest rate lower than 10%. As for blue and black lines see Legend in Figure 1. As for green line see Legend in Figure 3.
![Sustainability 14 07133 g005]()
- (6)
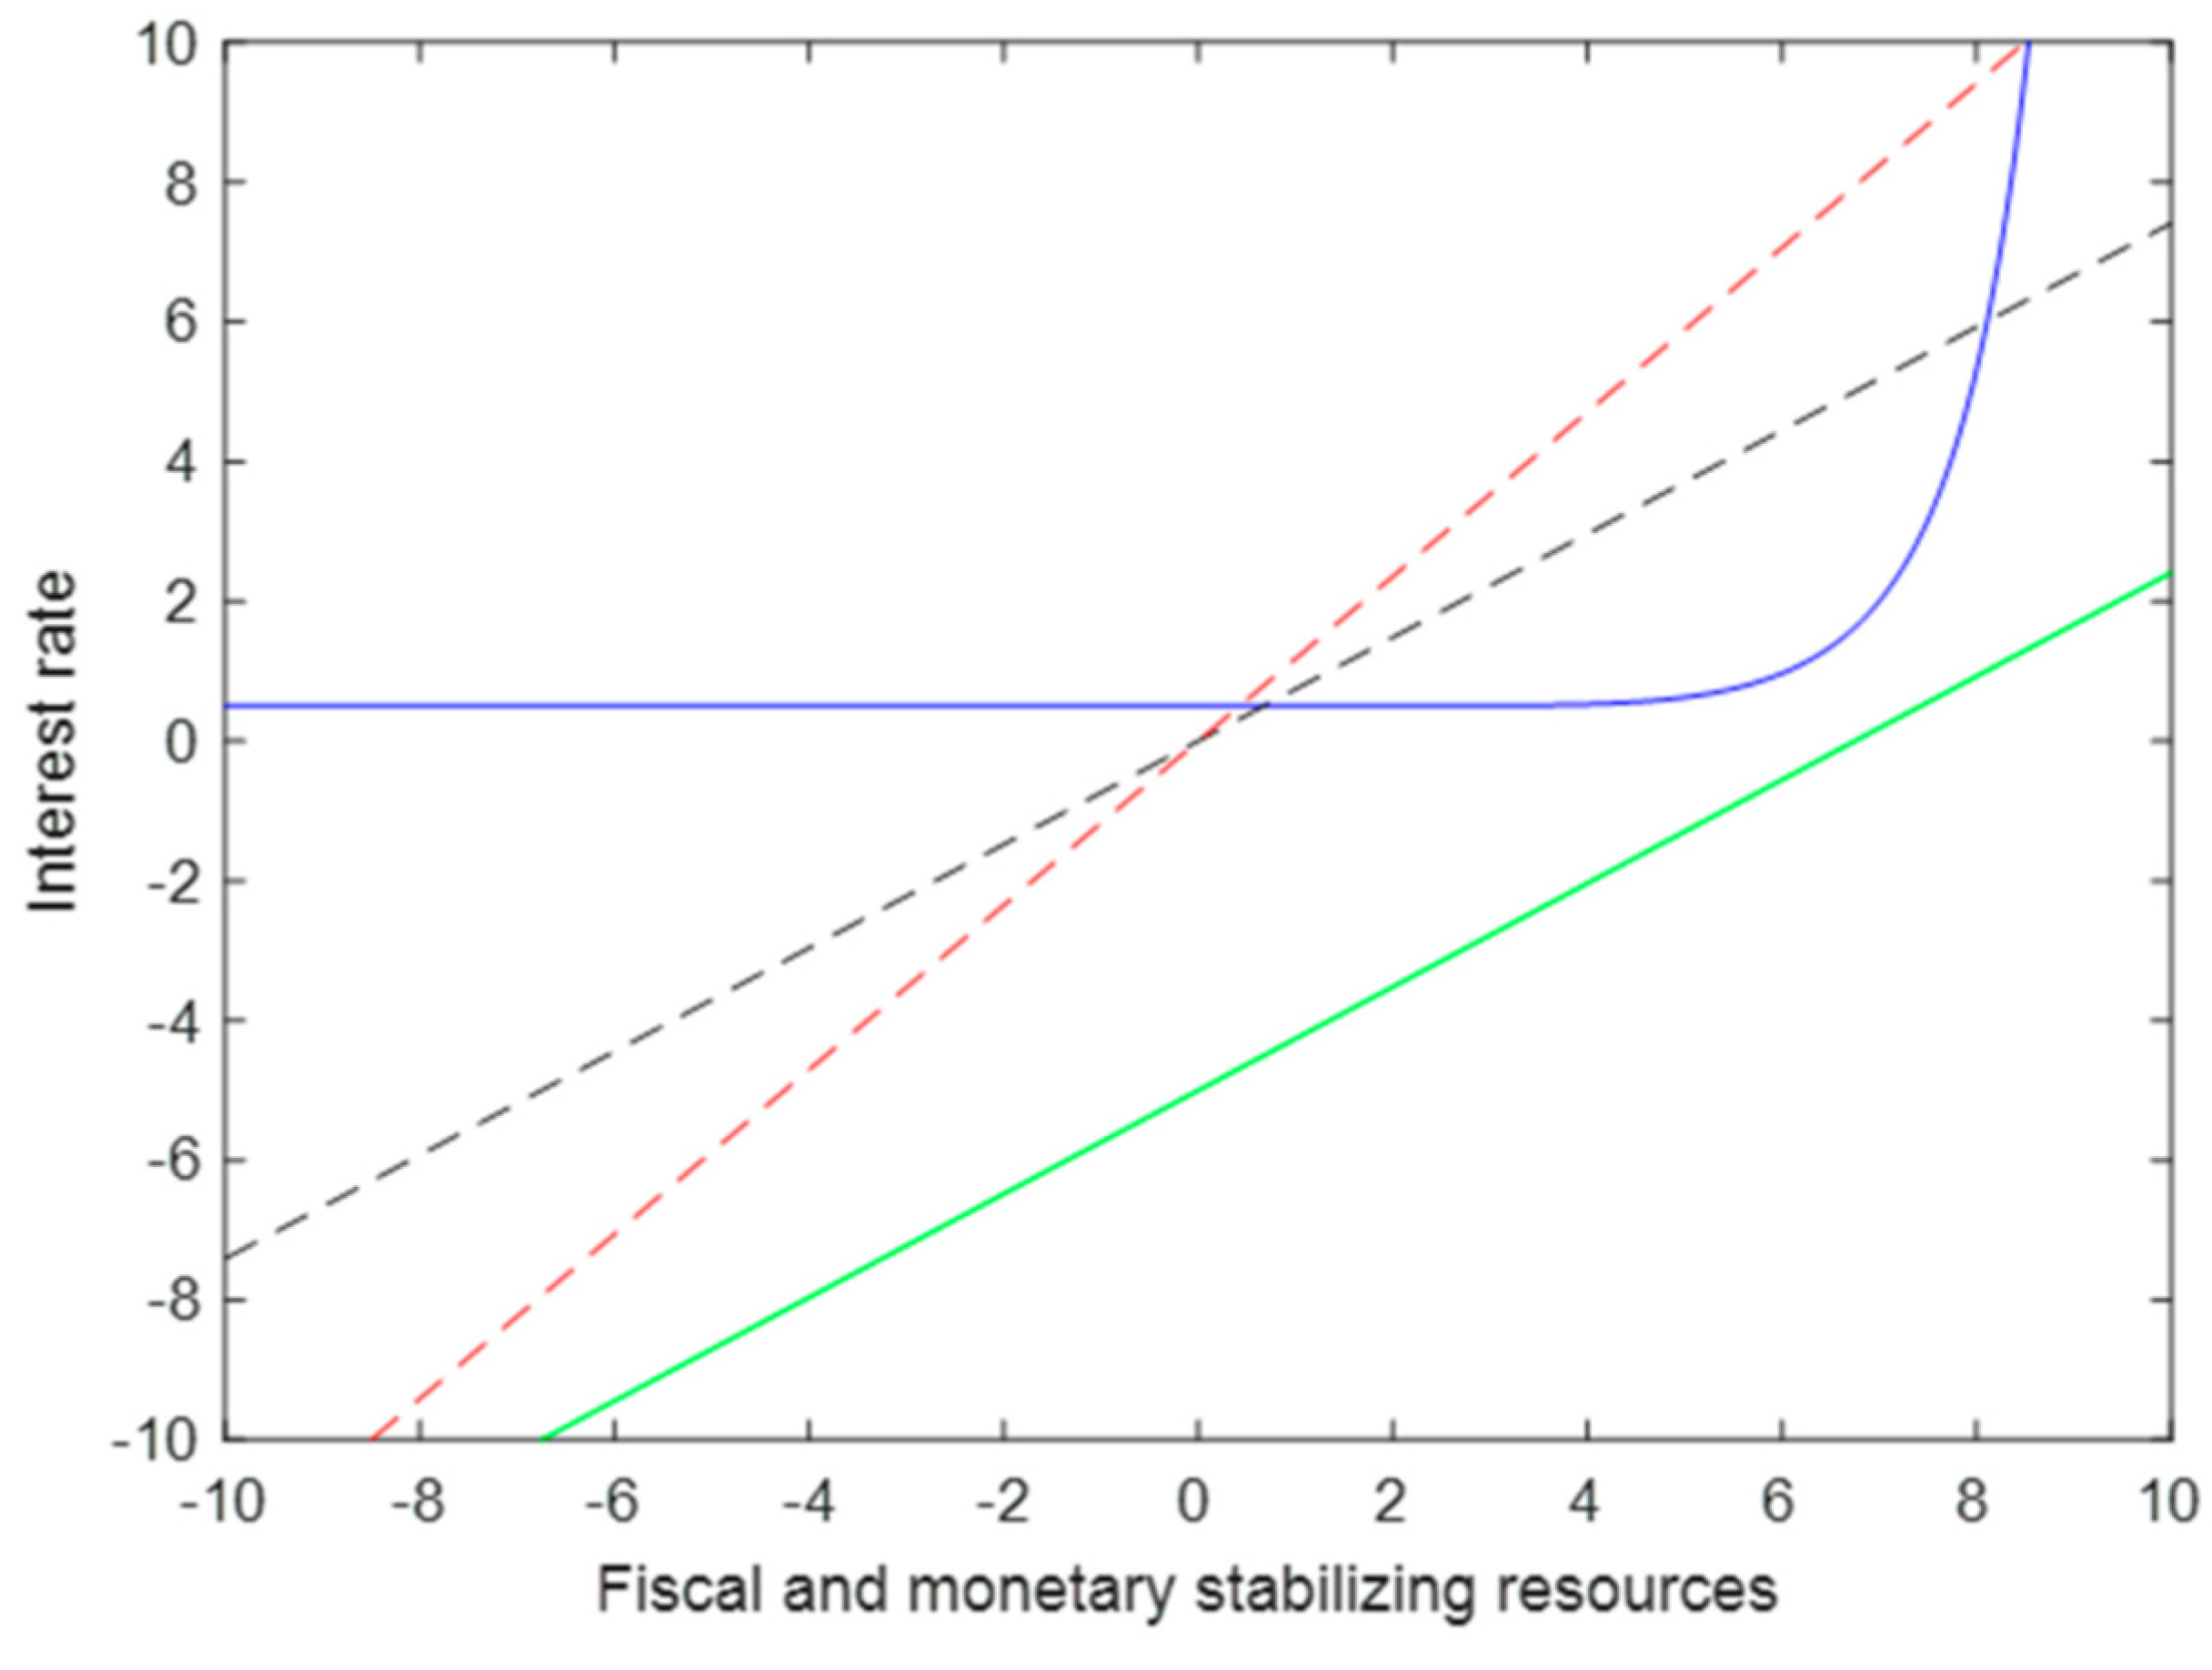
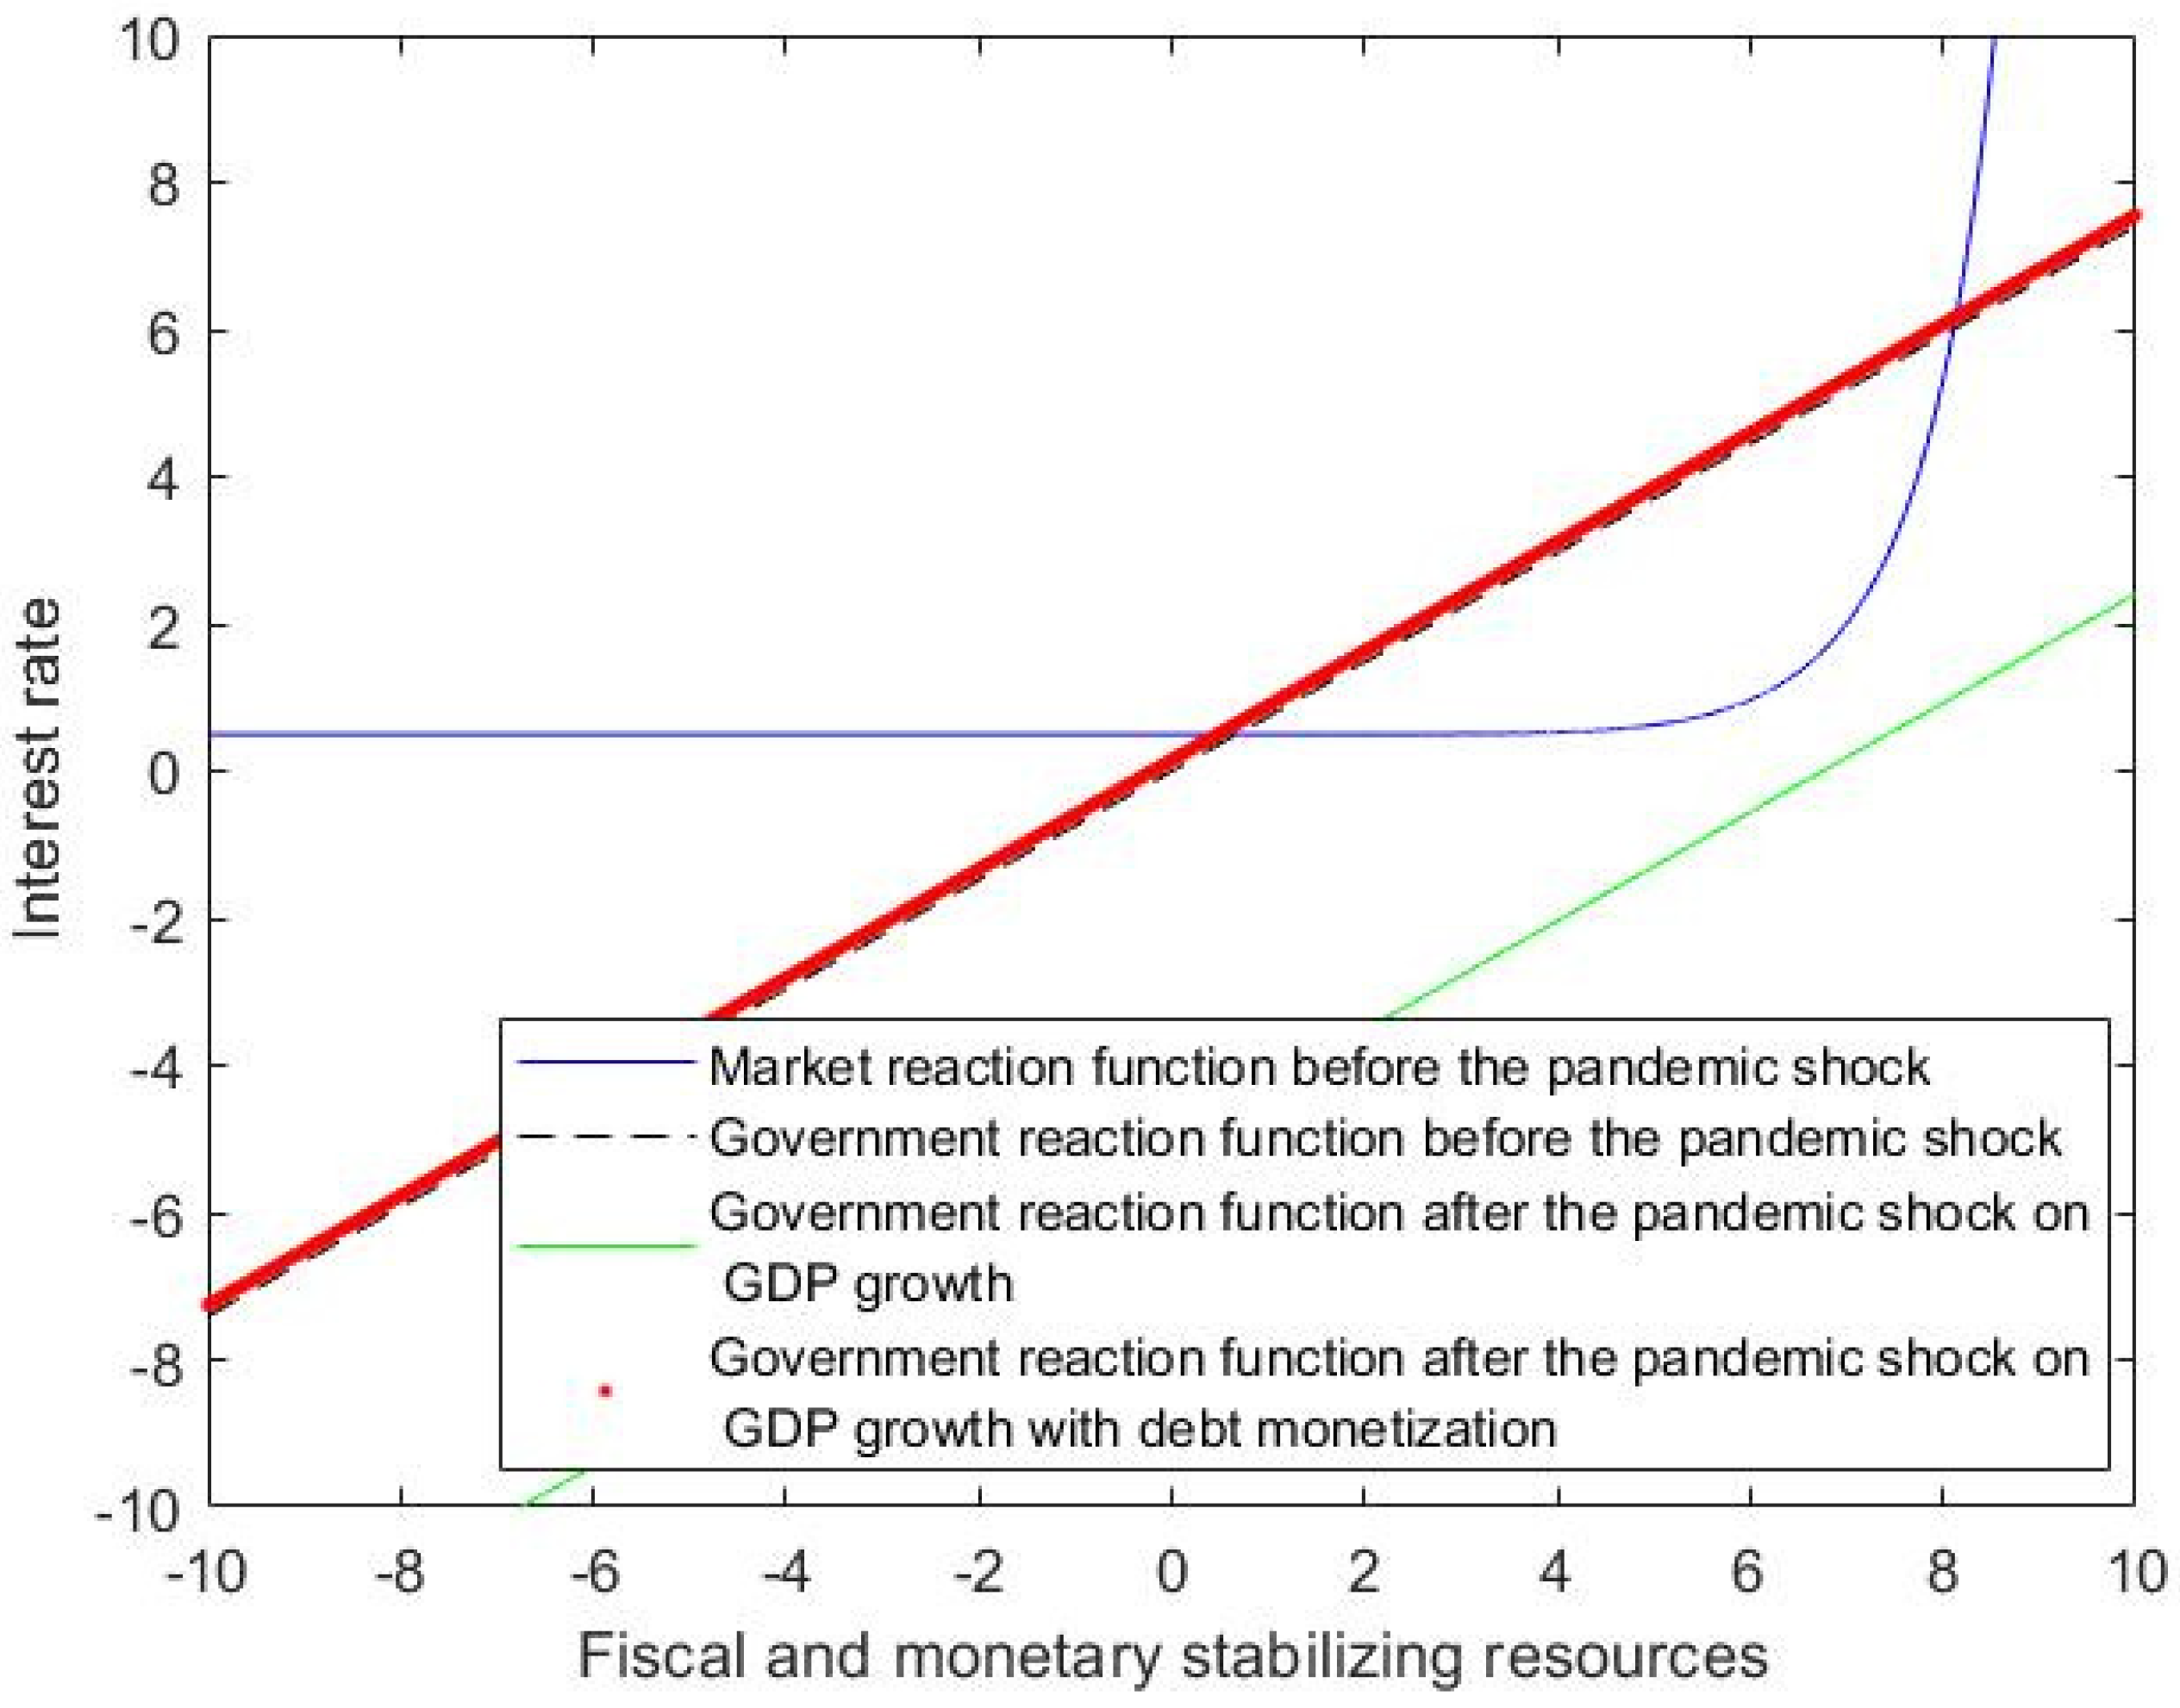
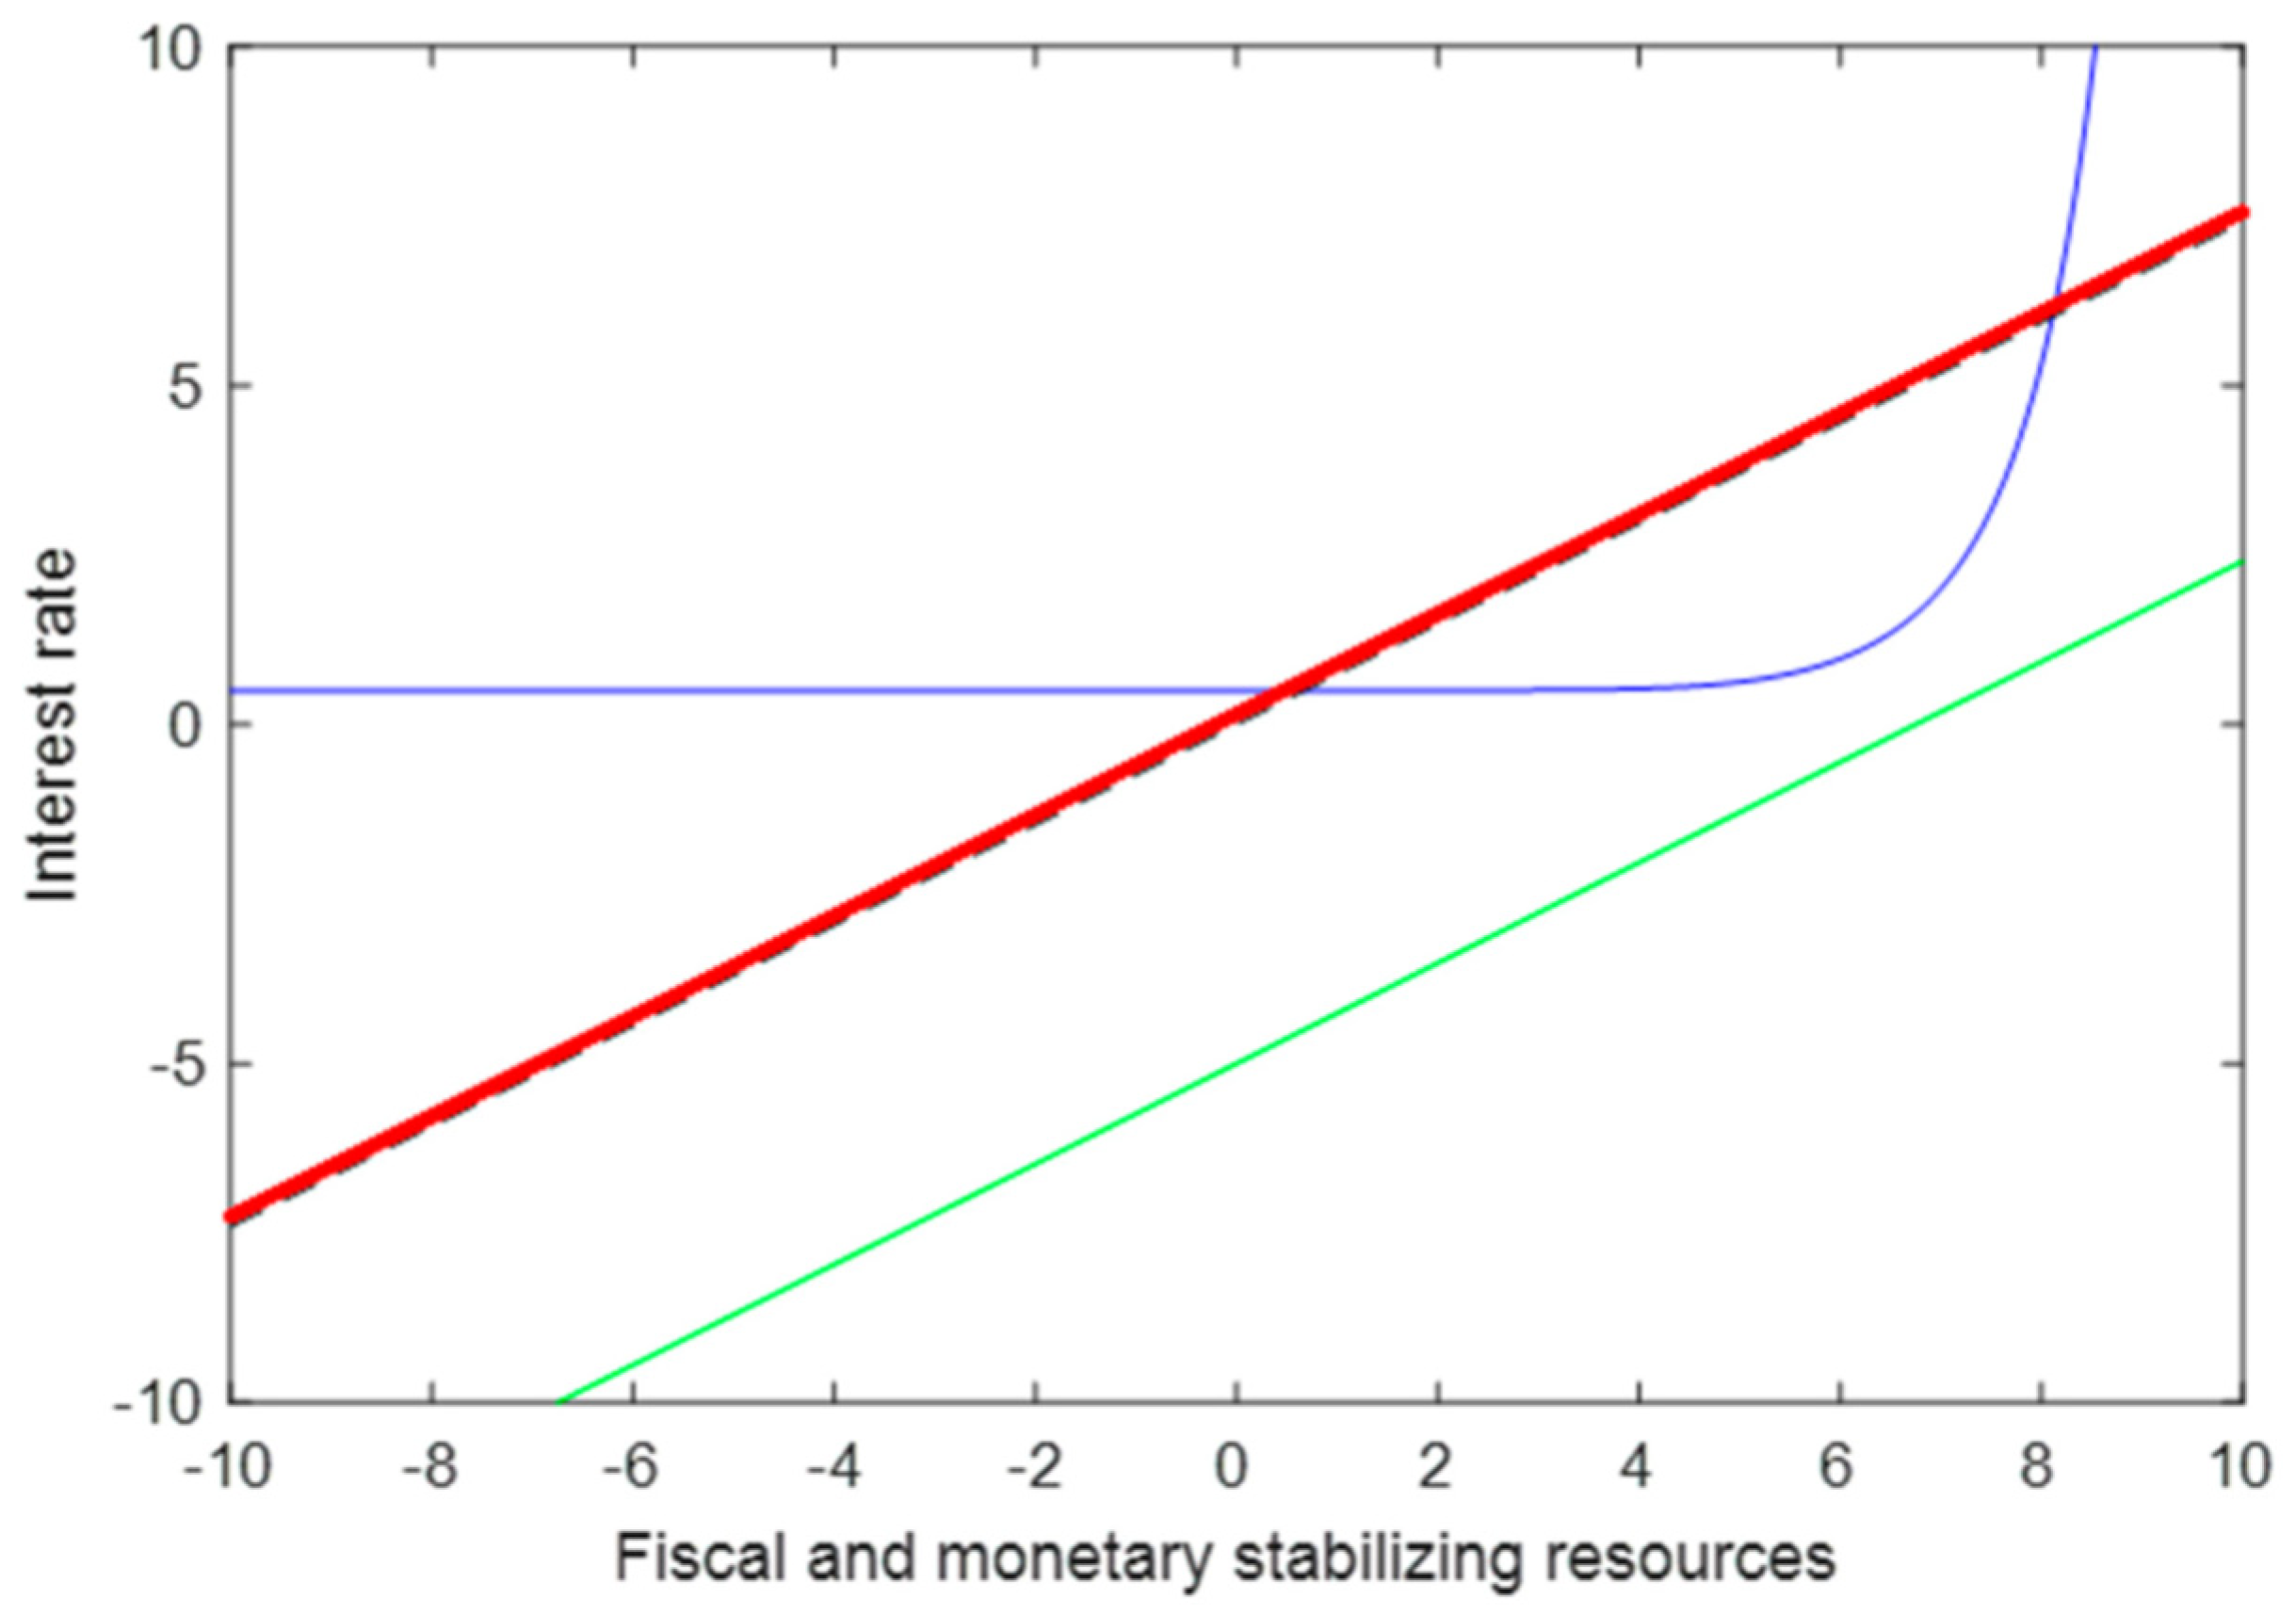
- Replacing Figure 6:Figure 6. Government and market reaction function with debt monetization. Legend: Figure 6 shows that the situation preceding the pandemic shock can be regained by adopting a full monetization of the public debt (the continuous red line representing the monetization brings the government’s reaction function back to its original position). As for blue and black lines see Legend in Figure 1. As for green line see Legend in Figure 3.Figure 6. Government and market reaction function with debt monetization. Legend: Figure 6 shows that the situation preceding the pandemic shock can be regained by adopting a full monetization of the public debt (the continuous red line representing the monetization brings the government’s reaction function back to its original position). As for blue and black lines see Legend in Figure 1. As for green line see Legend in Figure 3.
![Sustainability 14 07133 g006]()
- (7)
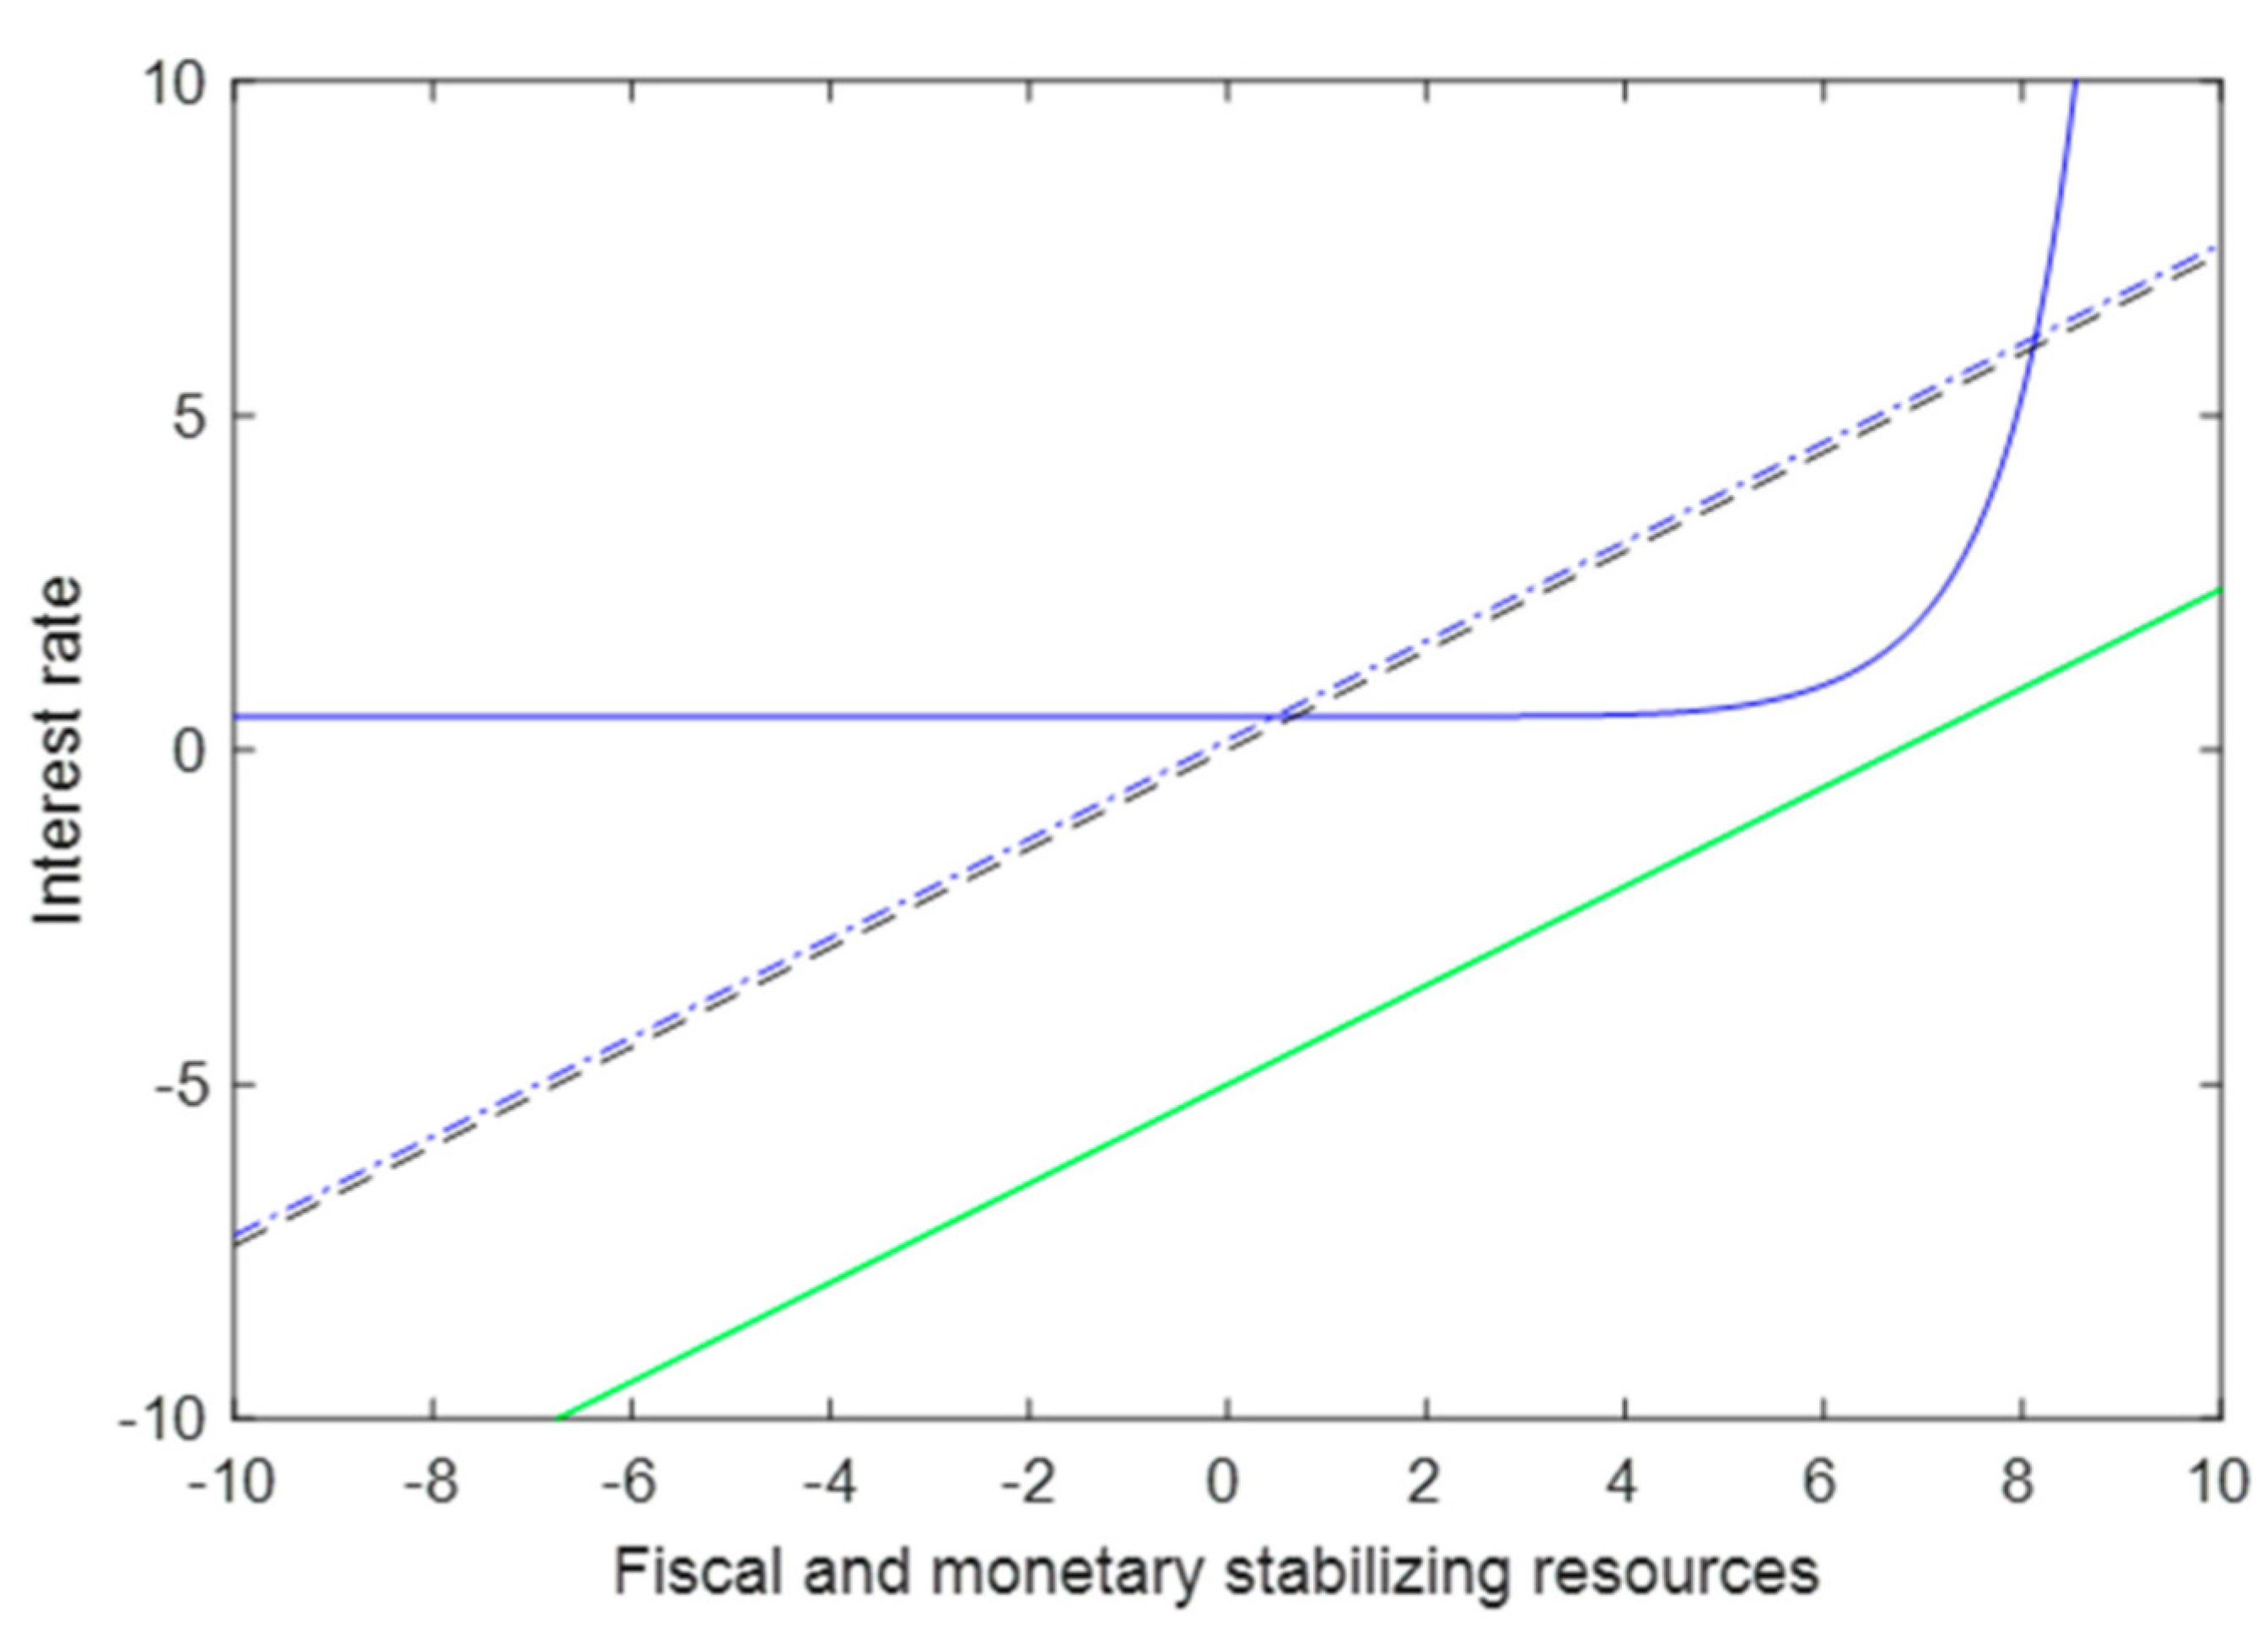
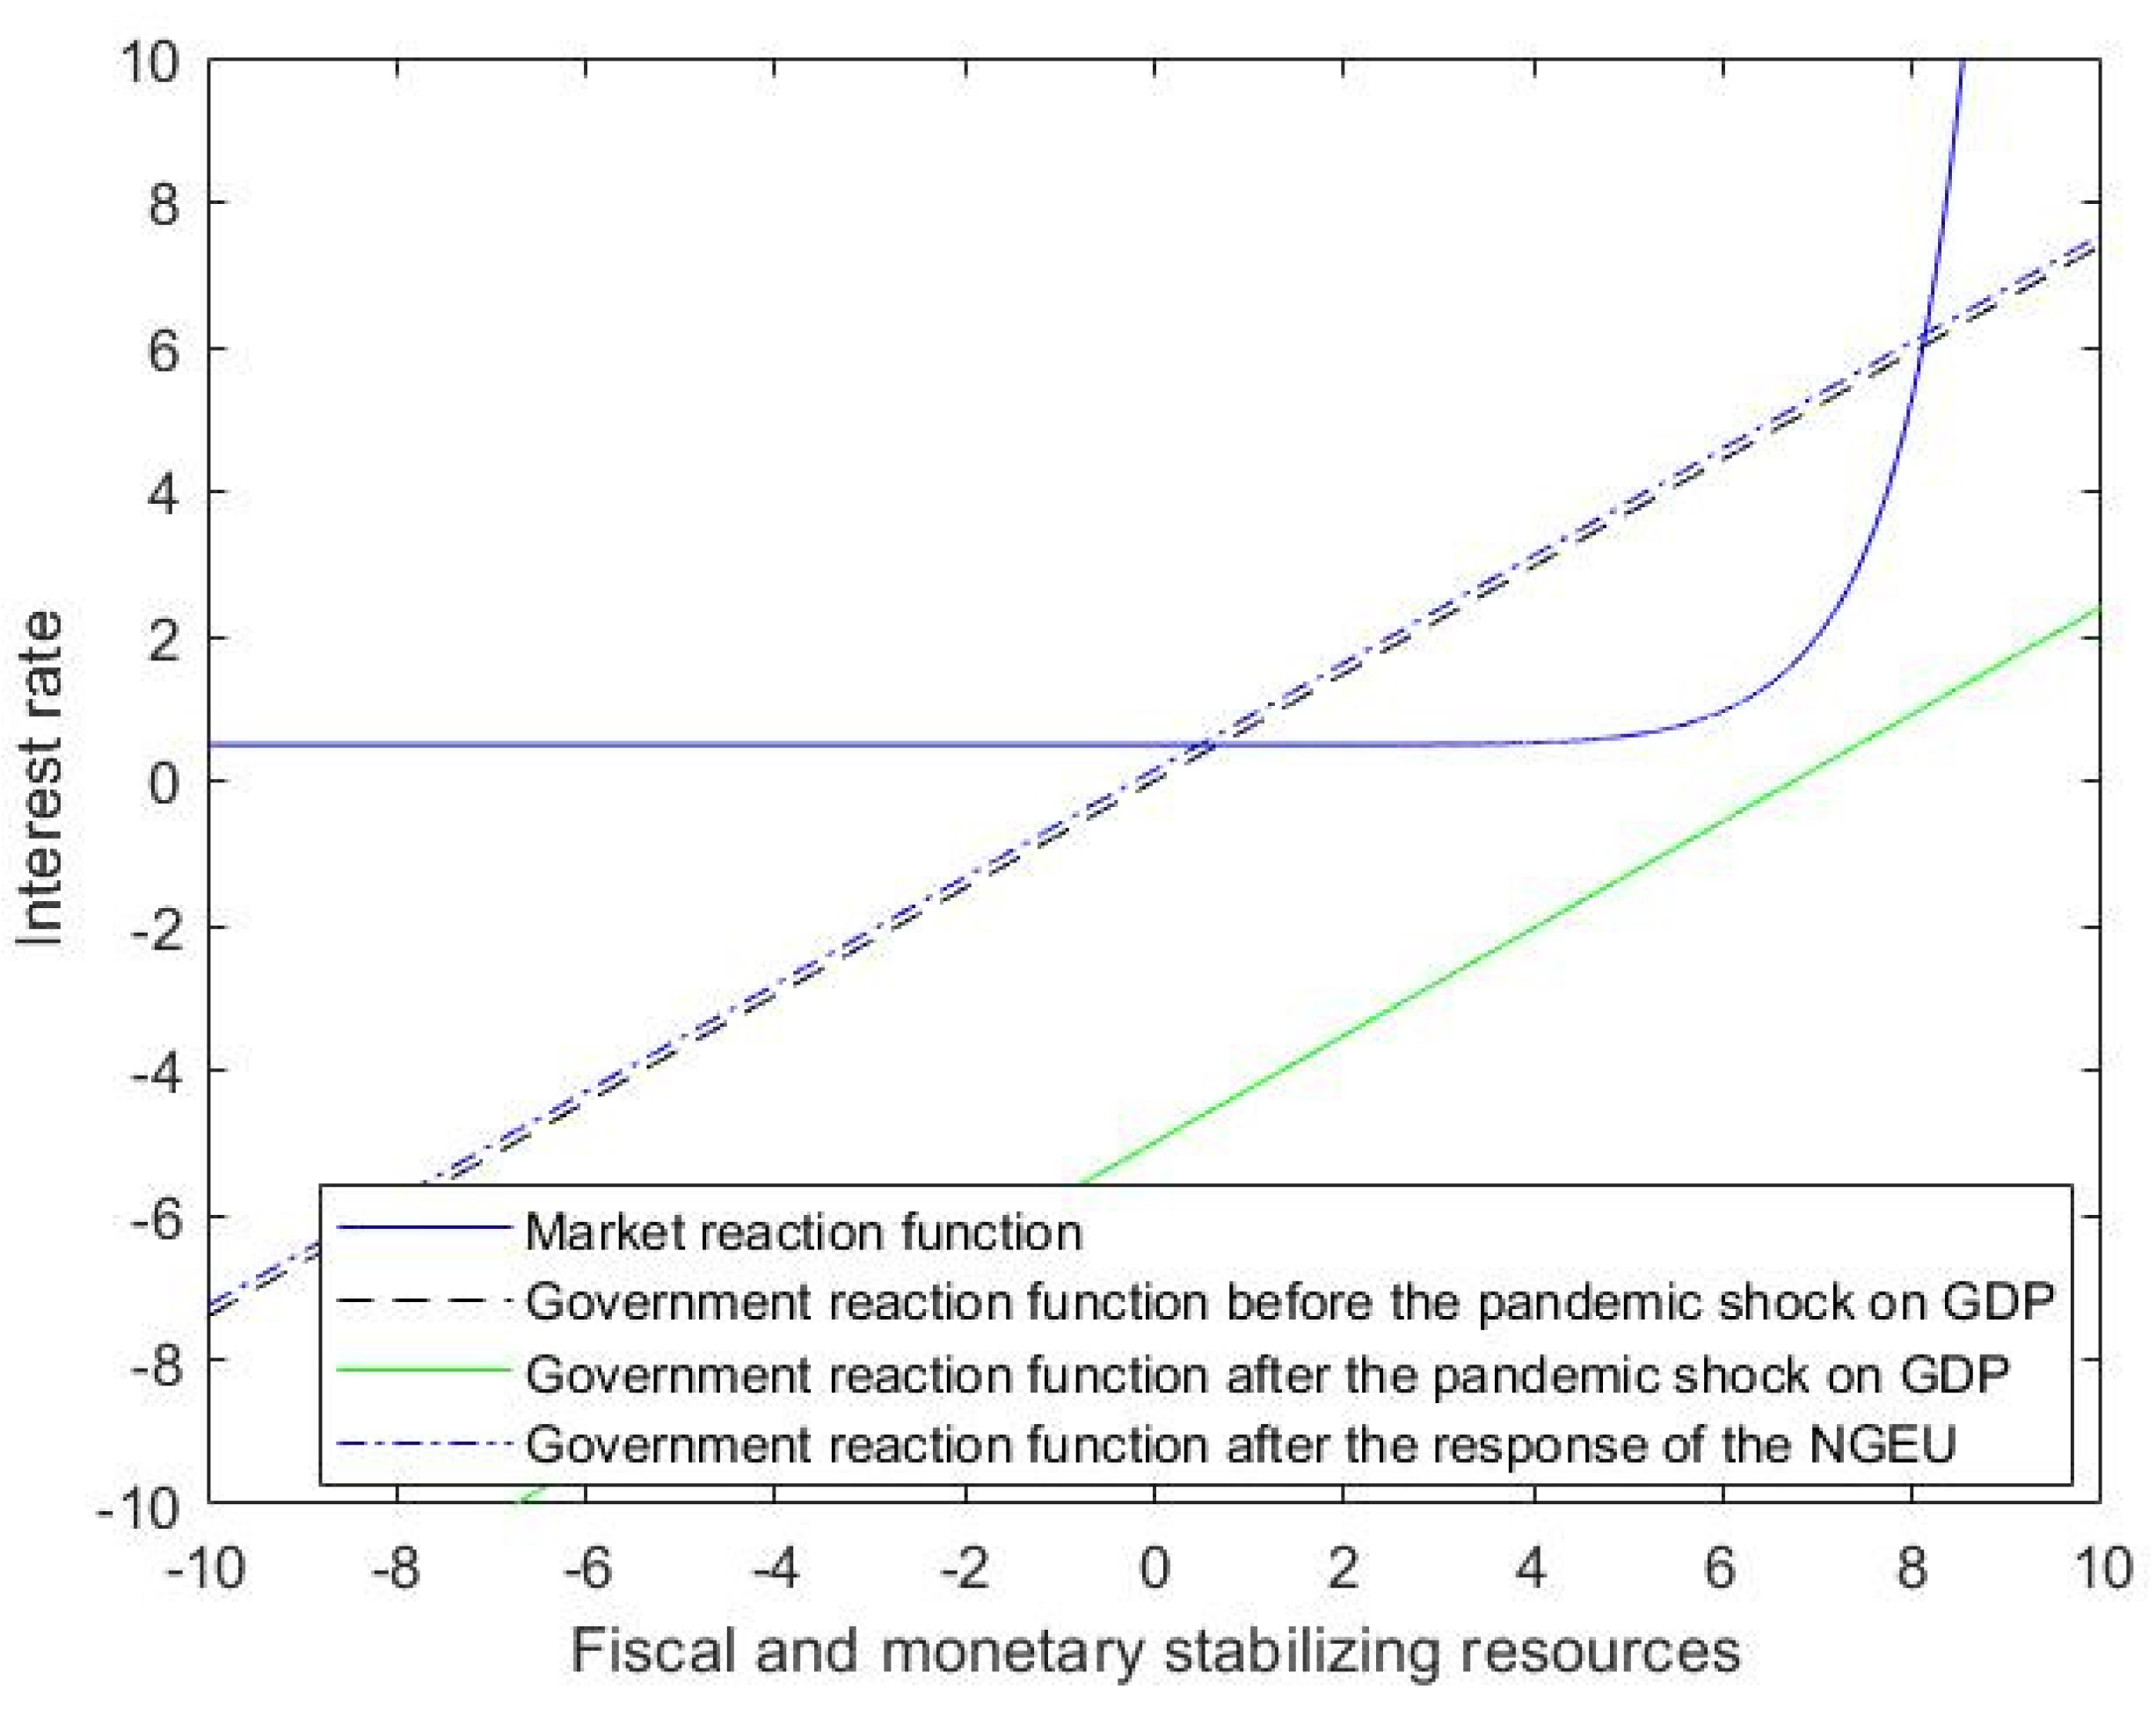
- Replacing Figure 7:Figure 7. Government and market reaction function with Next Generation EU. Legend: Figure 7 shows that the situation preceding the pandemic shock can be also regained by thanks to a NGEU program that removes from the country the burden of the public debt caused by the pandemic shock (dotted blue line representing the size of the NGEU brings the government’s reaction function back to its original position). As for blue and black lines see Legend in Figure 1. As for green line see Legend in Figure 3.Figure 7. Government and market reaction function with Next Generation EU. Legend: Figure 7 shows that the situation preceding the pandemic shock can be also regained by thanks to a NGEU program that removes from the country the burden of the public debt caused by the pandemic shock (dotted blue line representing the size of the NGEU brings the government’s reaction function back to its original position). As for blue and black lines see Legend in Figure 1. As for green line see Legend in Figure 3.
![Sustainability 14 07133 g007]()
- (8)
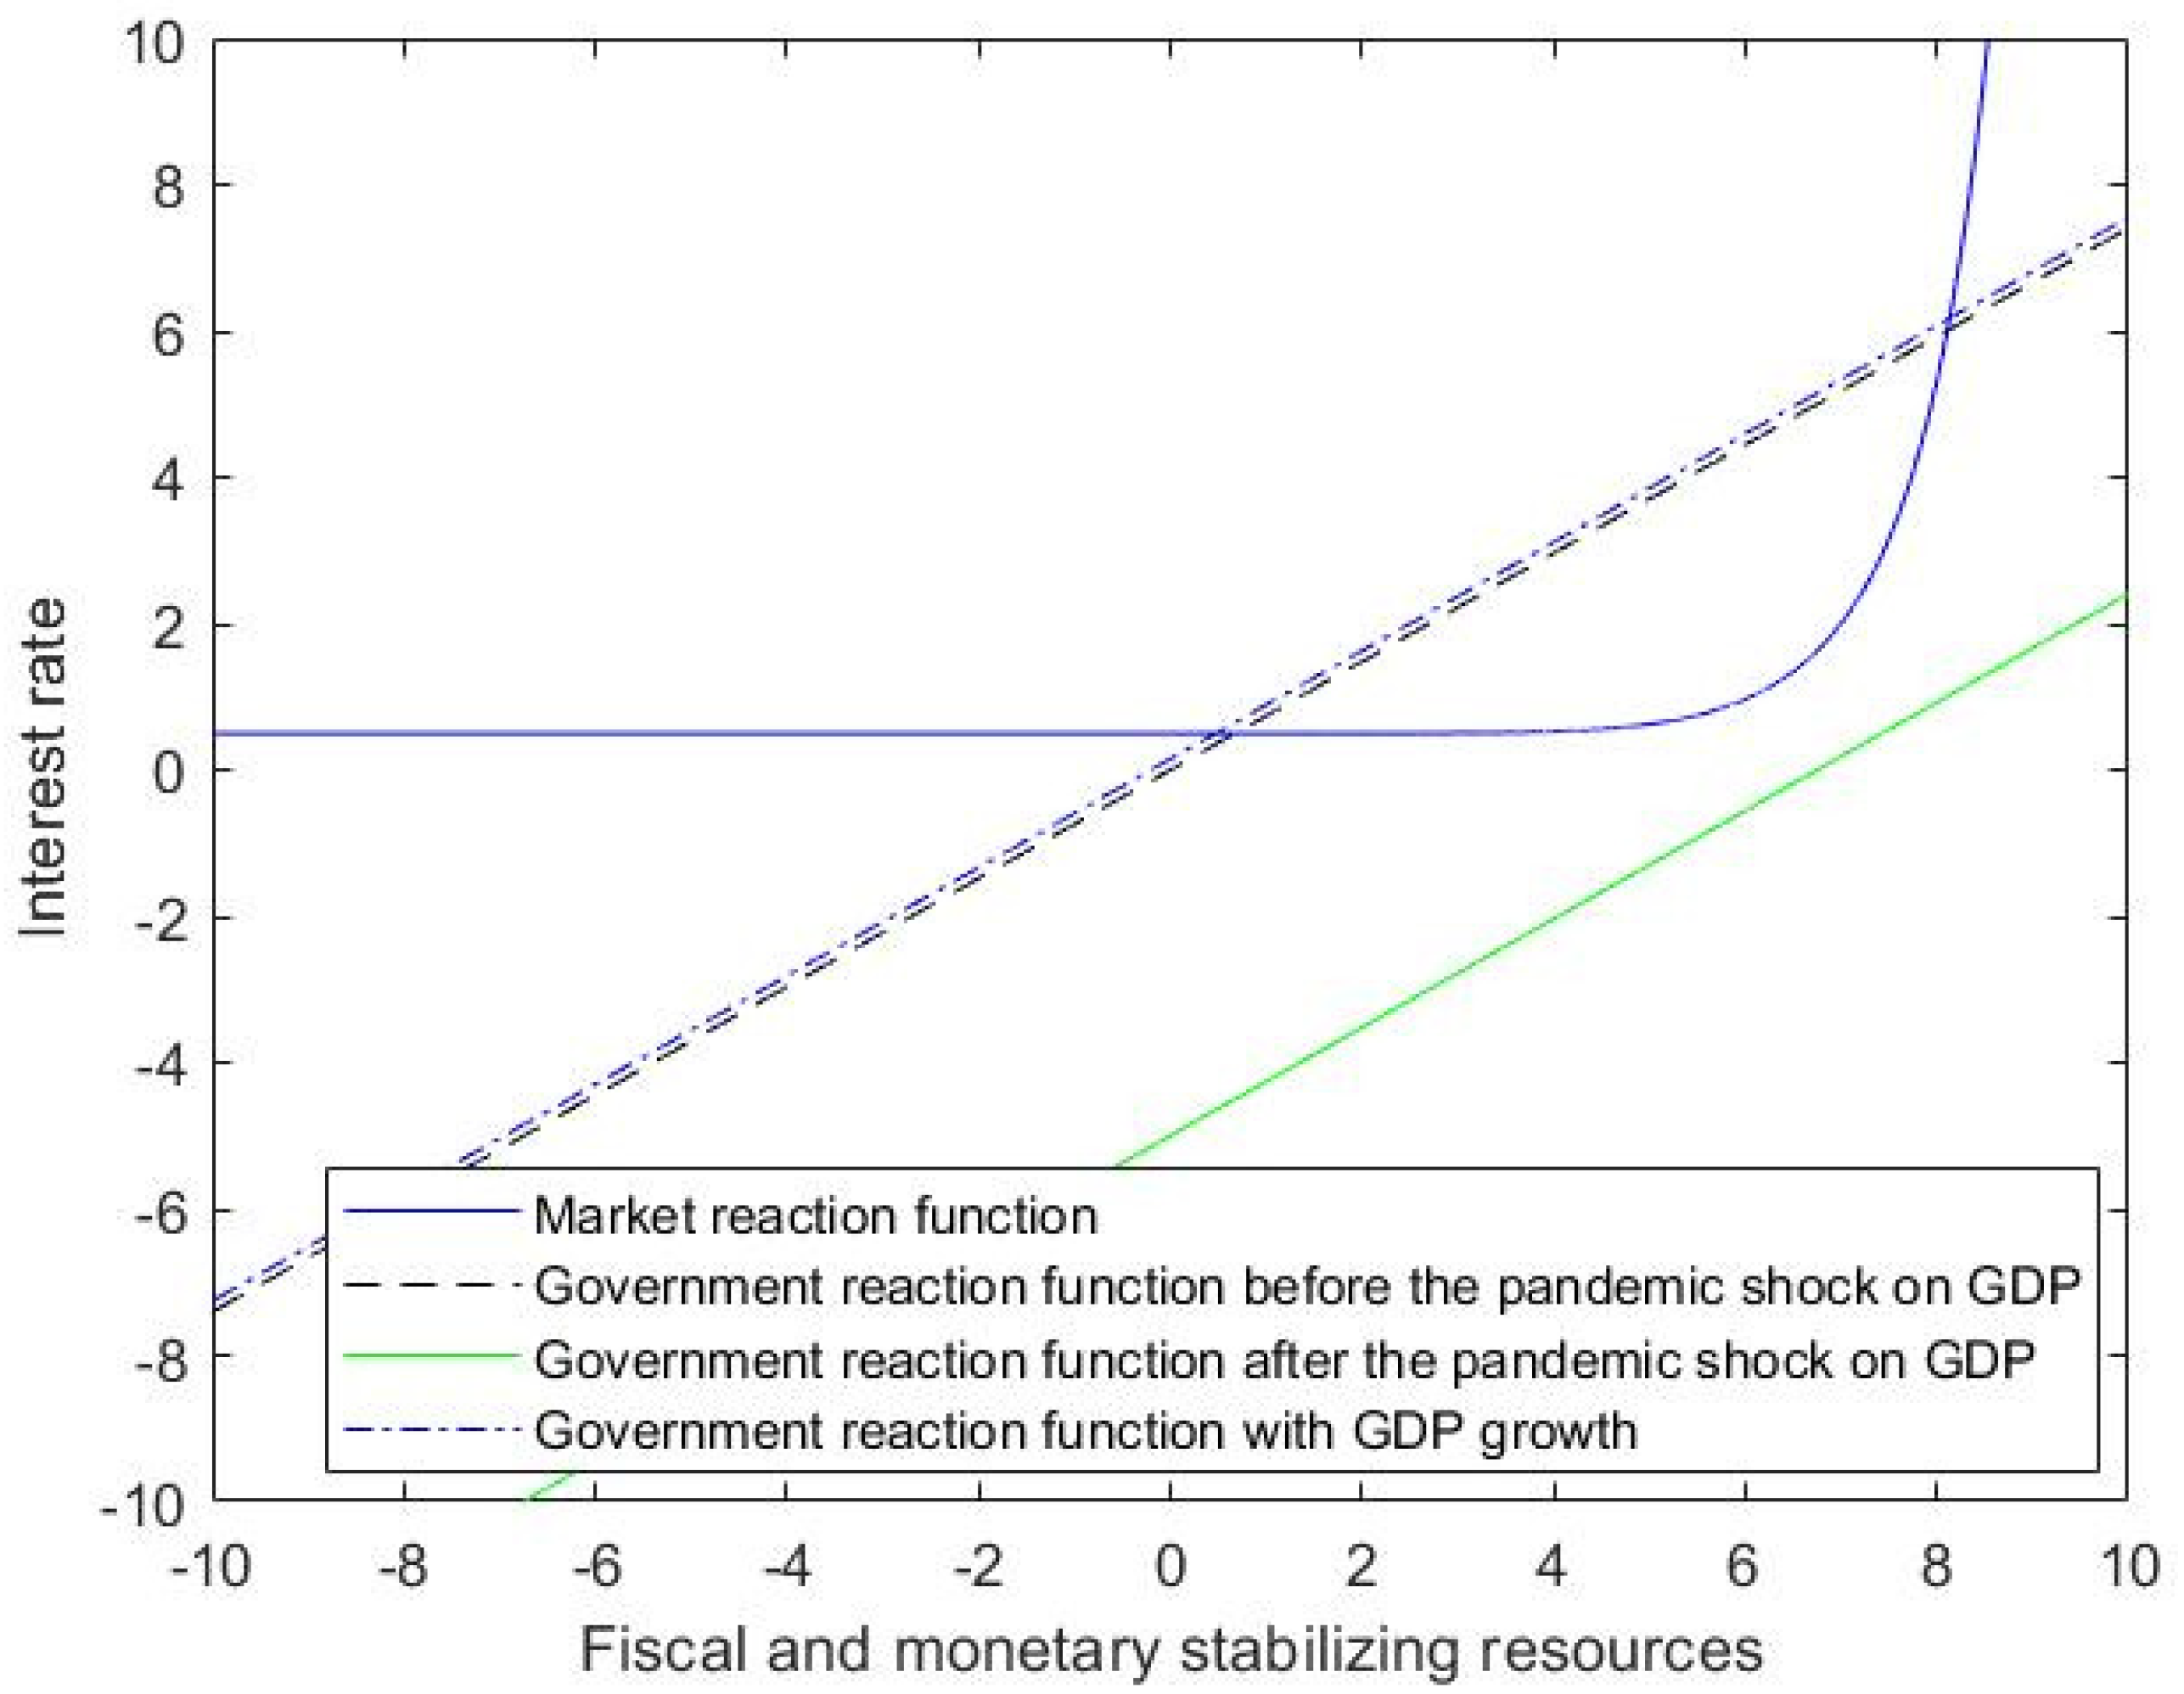
- Replacing Figure 8:Figure 8. Government and market reaction function with GDP growth. Legend: Figure 8 shows that the situation preceding the pandemic shock can be regained not only by adopting a full monetization of the public debt (Figure 6) or by adopting a NGEU (Figure 7), but also thanks to a GDP growth (as represented by the dotted black line). As for blue and black lines see Legend in Figure 1. As for green line see Legend in Figure 3.Figure 8. Government and market reaction function with GDP growth. Legend: Figure 8 shows that the situation preceding the pandemic shock can be regained not only by adopting a full monetization of the public debt (Figure 6) or by adopting a NGEU (Figure 7), but also thanks to a GDP growth (as represented by the dotted black line). As for blue and black lines see Legend in Figure 1. As for green line see Legend in Figure 3.
![Sustainability 14 07133 g008]()
- (9)
- Reorder the references in the reference list from:
- Acocella, N. Signalling imbalances in the EMU. In A Global Perspective on the European Economic Crisis; Dallago, B., Guri, G., McGowan, J., Eds.; Routledge: London, UK, 2016.
- Andreosso-O’Callaghan, B.; Moon, W.; Sohn, W. Economic Policy and the COVID-19 Crisis: The Macroeconomic Response in the US, Europe and East Asia; Routledge: London, UK, 2021.
- Arestis, P.; Sawyer, M. The Intertemporal Budget constraint and the Sustainability of Budget Deficits. In Current Issues in Fiscal Policy; Creel, J., Sawyer, M., Eds.; Palgrave Macmillan: Basingstoke, UK, 2008.
- Auerbach, A.J.; Gorodnichenko, Y. Output spillovers from fiscal policy. Am. Econ. Rev. Pap. Proc. 2013, 103, 141–146.
- Baqaee, D.R.; Farhi, E. Supply and Demand in Disaggregated Keynesian Economies with an Application to the COVID-19 Crisis; NBER Working Paper No. 27152; National Bureau of Economic Research: Cambridge, MA, USA, 2020.
- Bankowski, K.; Ferdinandusse, M.; Hauptmeier, S.; Jaquinot, P.; Valenta, V. The Macroeconomic Impact of the Next Generation EU Instrument on the Euro Area; Occasional Paper No. 255; European Central Bank: Frankfurt, Germany, 2021.
- Becchetti, L.; Scaramozzino, P. COVID-19 debt relief. Sci. E Pace 2021, 12, 2.
- Beker, V.; Moro, B. The European crisis. In World Economic Association Books Conference Series; World Economics Association: Bristol, UK, 2016.
- Blanchard, O.; Pisani-Ferry, J. Monetisation: Do Not Panic. VoxEU.org. 10 April. Available online: https://voxeu.org/article/monetisation-do-not-panic (accessed on 22 March 2022).
- Blanchard, O.J.; Leigh, D. Growth Forecast Errors and Fiscal Multipliers. Am. Econ. Rev. 2013, 103, 117–120.
- Blanchard, O.J.; Summers, L.-H. Rethinking stabilization policy: Evolution or revolution? NBER Work. Pap. Ser. 2017, 24179.
- Blanchard, O. Public debt and low interest rates. Am. Econ. Rev. 2019, 109, 1197–1229.
- Blanchard, O.; Gopinath, G.; Rogoff, K. Discussion on public debt and fiscal policy. IMF Econ. Rev. 2021, 69, 258–274.
- Blyth, M. Austerity: The History of a Dangerous Idea; Oxford University Press: Oxford, UK, 2015.
- Bohn, H. The Sustainability of Budget Deficits in a Stochastic Economy. J. Money Crédit. Bank. 1995, 27, 257–271.
- Bohn, H. The sustainability of fiscal policy in the United States. In Sustainability of Public Debt; Neck, R., Sturm, J., Eds.; MIT Press: Cambridge, MA, USA, 2008.
- Boyer, R. The four fallacies of contemporary austerity policies: The lost Keynesian legacy. Camb. J. Econ. 2012, 36, 283–312.
- Briceño, H.R.; Perote, J. Determinants of the public debt in the Eurozone and its sustainability amid the COVID-19 pandemic. Sustainability 2020, 12, 6456.
- Butkus, M.; Cibulskiene, D.; Garsviene, L.; Seputiene, J. The heterogeneous public debt—Growth relationship: The role of the expenditure multiplier. Sustainability 2021, 13, 4602.
- Cardani, R.; Croitorov, O.; Giovannini, M.; Pfeiffer, P.; Ratto, M.; Vogel, L. The Euro Area’s Pandemic Recession: A DSGE Interpretation; European Commission: Ispra, Italy, 2021; p. JRC126311.
- Ciccarelli, M.; Osbat, C. Low Inflation in the Euro Area: Causes and Consequences; ECB Occasional Paper No. 181; Elsevier: New York, NY, USA, 2017.
- Collignon, S. Fiscal policy rules and the sustainability of public debt in Europe. Int. Econ. Rev. 2012, 53, 539–567.
- Conefrey, T.; McInerney, N.; O’Reilly, G.; Walsh, G. Easing the Pain? Estimating the economic impact of domestic and global policy responses to the COVID-19 Pandemic. Econ. Soc. Rev. 2021, 52, 161–191.
- De Grauwe, P. The ECB must finance COVID-19 deficits. Proj. Synd. 2020. Available online: https://www.project-syndicate.org/commentary/ecb-needs-to-embrace-covid19-monetary-financing-by-paul-de-grauwe-2020-03 (accessed on 18 March 2020).
- Deleidi, M.; Mazzucato, M. Putting austerity to bed: Technical progress, aggregate demand and the supermultiplier. Rev. Political Econ. 2019, 31, 315–335.
- Della Posta, P. Fiscal austerity and monetary easing: Which one is to be praised for ending the euro area crisis? Eur. J. Comp. Econ. 2018, 15, 165–189.
- Della Posta, P.; Marelli, E.; Signorelli, M. An immediate solution for the euro area crisis: A grand European investment plan. In Yearning for Inclusive Growth and Development, Good Jobs and Sustainability; Paganetto, L., Ed.; Springer Nature: Cham, Switzerland, 2019.
- Della Posta, P.; Marelli, E.; Signorelli, M. A market-financed and growth-enhancing investment plan for the Euro area. Metroeconomica 2020, 71, 604–632.
- Domar, E.D. The “Burden of the debt” and the national income. Am. Econ. Rev. 1944, 34, 798–827.
- Ehnts, D.; Paetz, M. COVID-19 and its economic consequences for the Euro area. Eurasian Econ. Rev. 2021, 11, 227–249.
- Forni, L.; Palomba, G.; Pereira, J.; Richmond, C. Sovereign Debt Restructuring and Growth; IMF Working Paper; International Monetary Fund: Washington, DC, USA, 2016.
- Galí, J. The effects of a money-financed fiscal stimulus. J. Monet. Econ. 2020, 115, 1–19.
- Giavazzi, F.; Tabellini, G. COVID perpetual bonds: Jointly Guaranteed and Supported by the ECB. CEPR Policy Portal. Available online: https://voxeu.org/article/covid-perpetual-eurobonds (accessed on 24 March 2021).
- Guillamón, M.D.; Ríos, A.M.; Benito, B. An assessment of post-COVID-19 EU recovery funds and the distribution of them among member states. J. Risk Financ. Manag. 2021, 14, 549.
- Haas, J.; Neely, C.J.; Emmons, W.R. Responses of international central banks to the COVID-19 crisis. Fed. Reserve Bank St. Louis Rev. 2020, 102, 339–384.
- Hatchondo, J.C.; Martinez, L.; Padilla, C.S. Voluntary sovereign debt exchanges. J. Monet. Econ. 2014, 61, 32–50.
- Holland, S. Beyond Austerity: Alternatives for a Democratic Europe; Spokesman: Nottingham, UK, 2016.
- Hein, E.; Detzer, D. Post-Keynesian Alternative Policies to Curb Macroeconomic Imbalances in the Euro Area. Panoeconomicus 2015, 62, 217–223.
- Hondroyiannis, G.; Papaoikonomou, D. The effect of Eurosystem asset purchase programs on euro area sovereign bond yields during the COVID-19 pandemic. In Working Paper, Bank of Greece; SUERF: Vienna, Austria, 2021.
- IMF. World Economic Outlook: Coping with High Debt and Sluggish Growth; October; International Monetary Fund: Washington, DC, USA, 2012.
- Islam, A.M. Impact of COVID-19 pandemic on global output, employment and prices: An assessment. Transnatl. Corp. Rev. 2021, 13, 189–201.
- Konzelmann, S.J. The political economics of austerity. Camb. J. Econ. 2014, 38, 701–741.
- Kristóf, T. Sovereign Default Forecasting in the Era of the COVID-19 Crisis. J. Risk Fin. Man. 2021, 14, 494.
- Krugman, P. Financing vs. Forgiving a debt overhang. J. Dev. Econ. 1988, 29, 253–268.
- Krugman, P. Self-defeating Austerity. The New Yok Times, The Opinion Pages, The Conscience of a Liberal, 7 July 2010.
- Krugman, P. Learn to stop worrying and love debt. The New York Times, 3 December 2020.
- Jordà, O.; Singh, S.R.; Taylor, A.M. Longer-Run Economic Consequences of Pandemics; NBER Working Paper 26934; MIT Press Direct: Cambridge, MA, USA, 2020.
- Marelli, E.; Signorelli, M. Europe and the Euro. Integration, Crisis and Policies; Palgrave: London, UK; Springer: New York, NY, USA, 2017.
- Nordhaus, W.D. Quality changes in price indexes. J. Econ. Perspect. 1998, 12, 59–68.
- Pfeiffer, P.; Werner, R.; Veld, J. The COVID19-Pandemic in the EU: Macroeconomic Transmission & Economic Policy Response; Discussion Paper 127; European Commission: Brussels, Belgium, 2020.
- Pasinetti, L. The social burden of high interest rates. In Capital Controversy, Post-Keynesian Economics and the History of Economics: Essays in Honour of Geoff Harcourt; Arestis, P., Palma, G., Sawyer, M., Eds.; Routledge: London, UK, 1997; Volume 1.
- Reinhart, R.; Carmen, M.; Trebesch, C. Sovereign debt relief and its aftermath. J. Eur. Econ. Assoc. 2016, 14, 215–251.
- Saccone, D.; Della Posta, P.; Marelli, E.; Signorelli, M. Public investment multipliers by functions of government: An empirical analysis for European countries. Struct. Change Econ. Dyn. 2022, 60, 531–545.
- Tamborini, R. Heterogeneous market beliefs, fundamentals and the sovereign debt crisis in the Eurozone. Economica 2015, 82, 1153–1176.
- Teresiené, D.; Keliuotyté-Staniuléniené, G.; Kanapickiené, R. Sustainable economic growth support through credit transmission channel and financial stability: In the context of the COVID-19 pandemic. Sustainability 2021, 13, 2692.
- Vernengo, M.; Nadar-Bhadurib, S. The Economic Consequences of COVID-19: The Great Shutdown and the Rethinking of Economic Policy. Int. J. Political Econ. 2020, 49, 265–277.
- Watkins, J.P. The policy response to COVID-19: The implementation of modern monetary theory. J. Econ. Issues 2021, 55, 484–491.
- Domar, E.D. The “Burden of the debt” and the national income. Am. Econ. Rev. 1944, 34, 798–827.
- Pasinetti, L. The social burden of high interest rates. In Capital Controversy, Post-Keynesian Economics and the History of Economics: Essays in Honour of Geoff Harcourt. P.; Arestis, G., Palma, G., Sawyer, M., Eds.; Routledge: London, UK, 1997; Volume 1.
- Collignon, S. Fiscal policy rules and the sustainability of public debt in Europe. Int. Econ. Rev. 2012, 53, 539–567.
- Blanchard, O. Public debt and low interest rates. Am. Econ. Rev. 2019, 109, 1197–1229.
- Blanchard, O.; Gopinath, G.; Rogoff, K. Discussion on public debt and fiscal policy. IMF Econ. Rev. 2021, 69, 258–274.
- Tamborini, R. Heterogeneous market beliefs, fundamentals and the sovereign debt crisis in the Eurozone. Economica 2015, 82, 1153–1176.
- Della Posta, P. Fiscal austerity and monetary easing: Which one is to be praised for ending the euro area crisis? Eur. J. Comp. Econ. 2018, 15, 165–189. https://doi.org/10.25428/1824-2979/201801-165-189, 2018.
- Marelli, E.; Signorelli, M. Europe and the Euro. Integration, Crisis and Policies; Palgrave: London, UK; Springer: New York, NY, USA, 2017.
- Bohn, H. The Sustainability of Budget Deficits in a Stochastic Economy. Bank 1995, 27, 257–271.
- Bohn, H. The sustainability of fiscal policy in the United States. In Sustainability of Public Debt; Neck, R., Sturm, J., Eds.; MIT Press: Cambridge, MA, USA, 2008.
- Della Posta, P.; Marelli, E.; Signorelli, M. A market-financed and growth-enhancing investment plan for the Euro area. Metroeconomica 2020, 71, 604–632.
- Blyth, M. Austerity: The History of a Dangerous Idea; Oxford University Press: Oxford, UK, 2015.
- Holland, S. Beyond Austerity: Alternatives for a Democratic Europe; Spokesman: Nottingham, UK, 2016.
- Blanchard, O.J.; Leigh, D. Growth Forecast Errors and Fiscal Multipliers. Am. Econ. Rev. 2013, 103, 117–120.
- IMF. World Economic Outlook: Coping with High Debt and Sluggish Growth; October; International Monetary Fund: Washington, DC, USA, 2012.
- Deleidi, M.; Mazzucato, M. Putting austerity to bed: Technical progress, aggregate demand and the supermultiplier. Rev. Political Econ. 2019, 31, 315–335.
- Saccone, D.; Della Posta, P.; Marelli, E.; Signorelli, M. Public investment multipliers by functions of government: An empirical analysis for European countries. Struct. Change Econ. Dyn. 2022, 60, 531–545.
- Auerbach, A.J.; Gorodnichenko, Y. Output spillovers from fiscal policy. Am. Econ. Rev. Pap. Proc. 2013, 103, 141–146.
- Krugman, P. Self-defeating Austerity. The New Yok Times, The Opinion Pages, The Conscience of a Liberal, 7 July 2010.
- Boyer, R. The four fallacies of contemporary austerity policies: The lost Keynesian legacy. Camb. J. Econ. 2012, 36, 283–312.
- Konzelmann, S.J. The political economics of austerity. Camb. J. Econ. 2014, 38, 701–741.
- Beker, V.; Moro, B. The European crisis. In World Economic Association Books Conference Series; World Economics Association: Bristol, UK, 2016.
- Acocella, N. Signalling imbalances in the EMU. In A Global Perspective on the European Economic Crisis; Dallago, B., Guri, G., McGowan, J., Eds.; Routledge: London, UK, 2016.
- Blanchard, O.; Pisani-Ferry, J. Monetisation: Do Not Panic. VoxEU.org, 10 April. 2020. Available online: https://voxeu.org/article/monetisation-do-not-panic (accessed on 22 March 2022).
- Giavazzi, F.; Tabellini, G. Covid. Perpetual Bonds: Jointly Guaranteed and Supported by the ECB. CEPR Policy Portal 2020. Available online: https://voxeu.org/article/covid-perpetual-eurobonds (accessed on 24 March 2021).
- Galí, J. The effects of a money-financed fiscal stimulus. J. Monet. Econ. 2020, 115, 1–19.
- De Grauwe, P. The ECB Must Finance COVID-19 Deficits. Proj. Synd. 2020, March 18. Available online: https://www.project-syndicate.org/commentary/ecb-needs-to-embrace-covid19-monetary-financing-by-paul-de-grauwe-2020-03 (accessed on 18 March 2020).
- Reinhart, R.; Carmen, M.; Trebesch, C. Sovereign debt relief and its aftermath. J. Eur. Econ. Assoc. 2016, 14.1, 215–251.
- Forni, L.; Palomba, G.; Pereira, J.; Richmond, C. Sovereign Debt Restructuring and Growth; IMF Working Paper; International Monetary Fund: Washington, DC, USA, 2016.
- Hatchondo, J.C.; Martinez, L.; Padilla, C.S. Voluntary sovereign debt exchanges. J. Monet. Econ. 2014, 61, 32–50.
- Krugman, P. Financing vs. Forgiving a debt overhang. J. Dev. Econ. 1988, 29, 253–268.
- Ciccarelli, M.; Osbat, C. Low Inflation in the Euro Area: Causes and Consequences; ECB Occasional Paper No. 181; Elsevier: New York, NY, USA, 2017.
- Nordhaus, W.D. Quality changes in price indexes. J. Econ. Perspect. 1998, 12, 59–68.
- Becchetti, L.; Scaramozzino, P. Covid-19 debt relief. Sci. E Pace 2021, 12, 2.
- Watkins, J.P. The policy response to COVID-19: The implementation of modern monetary theory. J. Econ. Issues 2021, 55, 484–491.
- Blanchard, O.J.; Summers, L.-H. Rethinking stabilization policy: Evolution or revolution? NBER Work. Pap. Ser. 2017, 24179.
- Krugman, P. Learn to stop worrying and love debt. The New York Times, 3 December 2020.
- Andreosso-O’Callaghan, B.; Moon, W.; Sohn, W. Economic Policy and the COVID-19 Crisis: The Macroeconomic Response in the US, Europe and East Asia; Routledge: London, UK, 2021.
- Baqaee, D.R.; Farhi, E. Supply and Demand in Disaggregated Keynesian Economies with an Application to the Covid-19 Crisis; NBER Working Paper No. 27152; National Bureau of Economic Research: Cambridge, MA, USA, 2020.
- Islam, A.M. Impact of COVID-19 pandemic on global output, employment and prices: An assessment. Transnatl. Corp. Rev. 2021, 13, 189–201.
- Cardani, R.; Croitorov, O.; Giovannini, M.; Pfeiffer, P.; Ratto, M.; Vogel, L. Th Eu A a’s Pa m c R c ss: A DSGE Interpretation; European Commission: Ispra, Italy, 2021; p. JRC126311.
- Jordà, O.; Singh, S.R.; Taylor, A.M. Longer-Run Economic Consequences of Pandemics; NBER Working Paper 26934; MIT Press Direct: Cambridge, MA, USA, 2020.
- Haas, J.; Neely, C.J.; Emmons, W.R. Responses of international central banks to the COVID-19 crisis. Fed. Reserve Bank St. Louis Rev. 2020, 102, 339–384.
- Briceño, H.R.; Perote, J. Determinants of the public debt in the Eurozone and its sustainability amid the COVID-19 pandemic. Sustainability 2020, 12, 6456.
- Kristóf, T. Sovereign Default Forecasting in the Era of the COVID-19 Crisis. J. Risk Fin. Man. 2021, 14, 494. https://doi.org/10.3390/jrfm1410049
- Vernengo, M.; Nadar-Bhadurib, S. The Economic Consequences of COVID-19: The Great Shutdown and the Rethinking of Economic Policy. Int. J. Political Econ. 2020, 49, 265–277.
- Ehnts, D.; Paetz, M. COVID-19 and its economic consequences for the Euro area. Eurasian Econ. Rev. 2021, 11, 227–249.
- Butkus, M.; Cibulskiene, D.; Garsviene, L.; Seputiene, J. The heterogeneous public debt—Growth relationship: The role of the expenditure multiplier. Sustainability 2021, 13, 4602.
- Conefrey, T.; McInerney, N.; O’Reilly, G.; Walsh, G. Easing the Pain? Estimating the economic impact of domestic and global policy responses to the COVID-19 Pandemic. Econ. Soc. Rev. 2021, 52, 161–191.
- Pfeiffer, P.; Werner, R.; Veld, J. The COVID19-Pandemic in the EU: Macroeconomic Transmission & Economic Policy Response; Discussion Paper 127; European Commission: Brussels, Belgium, 2020.
- Teresiené, D.; Keliuotyté-Staniuléniené, G.; Kanapickiené, R. Sustainable economic growth support through credit transmission channel and financial stability: In the context of the COVID-19 pandemic. Sustainability 2021, 13, 2692.
- Hondroyiannis, G.; Papaoikonomou, D. The effect of Eurosystem asset purchase programs on euro area sovereign bond yields during the COVID-19 pandemic. In Working Paper, Bank of Greece; SUERF: Vienna, Austria, 2021.
- Guillamón, M.D.; Ríos, A.M.; Benito, B. An assessment of post-COVID-19 EU recovery funds and the distribution of them among member states. J. Risk Financ. Manag. 2021, 14, 549.
- Arestis, P.; Sawyer, M. The Intertemporal Budget constraint and the Sustainability of Budget Deficits. In Current Issues in Fiscal Policy; Creel, J., Sawyer, M., Eds.; Palgrave Macmillan: Basingstoke, UK, 2008.
- Bankowski, K.; Ferdinandusse, M.; Hauptmeier, S.; Jaquinot, P.; Valenta, V. The Macroeconomic Impact of the Next Generation EU Instrument on the Euro Area; Occasional Paper No. 255; European Central Bank: Frankfurt, Germany, 2021
- Hein, E.; Detzer, D. Post-Keynesian Alternative Policies to Curb Macroeconomic Imbalances in the Euro Area. Panoeconomicus 2015, 62, 217–223.
- Della Posta, P.; Marelli, E.; Signorelli, M. An immediate solution for the euro area crisis: A grand European investment plan. In Yearning for Inclusive Growth and Development, Good Jobs and Sustainability; Paganetto, L., Ed.; Springer Nature: Cham, Switzerland, 2019.
Reference
- Della Posta, P.; Marelli, E.; Signorelli, M. COVID-19, Economic Policies and Public Debt Sustainability in Italy. Sustainability 2022, 14, 4691. [Google Scholar] [CrossRef]
Publisher’s Note: MDPI stays neutral with regard to jurisdictional claims in published maps and institutional affiliations. |
© 2022 by the authors. Licensee MDPI, Basel, Switzerland. This article is an open access article distributed under the terms and conditions of the Creative Commons Attribution (CC BY) license (https://creativecommons.org/licenses/by/4.0/).
Share and Cite
Della Posta, P.; Marelli, E.; Signorelli, M. Correction: Della Posta et al. COVID-19, Economic Policies and Public Debt Sustainability in Italy. Sustainability 2022, 14, 4691. Sustainability 2022, 14, 7133. https://doi.org/10.3390/su14127133
Della Posta P, Marelli E, Signorelli M. Correction: Della Posta et al. COVID-19, Economic Policies and Public Debt Sustainability in Italy. Sustainability 2022, 14, 4691. Sustainability. 2022; 14(12):7133. https://doi.org/10.3390/su14127133
Chicago/Turabian StyleDella Posta, Pompeo, Enrico Marelli, and Marcello Signorelli. 2022. "Correction: Della Posta et al. COVID-19, Economic Policies and Public Debt Sustainability in Italy. Sustainability 2022, 14, 4691" Sustainability 14, no. 12: 7133. https://doi.org/10.3390/su14127133
APA StyleDella Posta, P., Marelli, E., & Signorelli, M. (2022). Correction: Della Posta et al. COVID-19, Economic Policies and Public Debt Sustainability in Italy. Sustainability 2022, 14, 4691. Sustainability, 14(12), 7133. https://doi.org/10.3390/su14127133