Article

The 15-Minute City—The Geographical Proximity of Services in Krakow

1
Department of Spatial Management, Institute of Spatial Management and Urban Studies, College of Public Economy and Administration, Cracow University of Economics, 27 Rakowicka St., 31-510 Krakow, Poland
2
Department of Public Economy, Institute of Public Policy and Administration, College of Public Economy and Administration, Cracow University of Economics, 27 Rakowicka St., 31-510 Krakow, Poland
3
Cracow Association Space-People-City, 30-122 Krakow, Poland
*
Author to whom correspondence should be addressed.
Sustainability 2022, 14(12), 7103; https://doi.org/10.3390/su14127103
Submission received: 5 April 2022 / Revised: 2 June 2022 / Accepted: 8 June 2022 / Published: 9 June 2022

Abstract

:
The discussion about 15-minute cities (also referred to as cities of short distances) has gained considerable momentum in the last decade. Thanks to the optimal spatial layout of these urban areas, their residents can meet most or all of their day-to-day needs within a short walk or a bicycle ride from their place of residence. This is especially important in the context of problems currently faced by most large agglomerations worldwide, the negative externalities caused by predominantly motorised transport and inappropriate spatial planning policies that entail substantial environmental and technical infrastructure outlays. The concept of spatial proximity to services played a key role in the empirical part of the present study, where Krakow’s layout was analysed in detail from the perspective of a 15-minute city. Krakow is a resident-friendly, inclusive city created primarily with local communities in mind. However, certain design flaws in terms of spatial proximity to services prompted us to reconsider how its specific spatial components operate. To achieve the study’s goal—a comprehensive assessment of Krakow as a 15-minute city—we proposed several solutions that can be made universally adaptable for other urban areas striving to meet the short distance criteria.

1. Introduction

In the third decade of the 21st century, cities are experiencing civilisational changes due to the ongoing scientific and technological revolution. The growing importance of the information society raises public awareness of phenomena such as demographic growth and urban overcrowding, the climate crisis, and increasing social stratification. People, regardless of their age and material status, want to live in a safe and comfortable environment and want to be certain that their consumption habits and day-to-day practices promote social order without adversely affecting the natural environment.
Today’s cities—crowded, dominated by motorised transport, dysfunctional due to growing environmental problems and the loss of time associated with long-distance passenger car travel—increasingly fail to meet these expectations. The COVID-19 pandemic, which paralysed cities for months, brought these issues to the forefront. As a result, urban areas must redefine sustainability in terms of mobility and access to services for residents. Such requirements are met by the concept of a 15-minute city. The search for a model of a ‘green,’ ‘just,’ and ‘productive’ city highlights the importance of service proximity, which makes life much more convenient for urbanised populations.
The paper is divided into three parts. It starts by defining the 15-minute city as a concept for organising city dwellers’ daily practices rather than a specific urban planning or management doctrine. Cities are looking for individual ways to improve the quality of life of their residents, specifically by eliminating deficiencies or errors in the design of their functional and spatial structures as well as methods of managing public affairs. The main research areas that capture the relevance of this concept for Krakow were identified.
The study focuses on one aspect of the 15-minute city, namely proximity. Theorists and practitioners have been searching for their own interpretations of proximity with a view to improving the well-being of residents both in individual neighbourhoods and in cities as a whole. For this reason, the empirical part of this paper focuses on the availability of services that should be provided locally in various parts of the city. Taking proximity as one of the constitutive features of a 15-minute city, we set out to determine how well Krakow’s spatial organisation meets this condition in relation to a variety of its functions. The aim of the study was to answer the following questions:
  • How does proximity to services vary across Krakow?
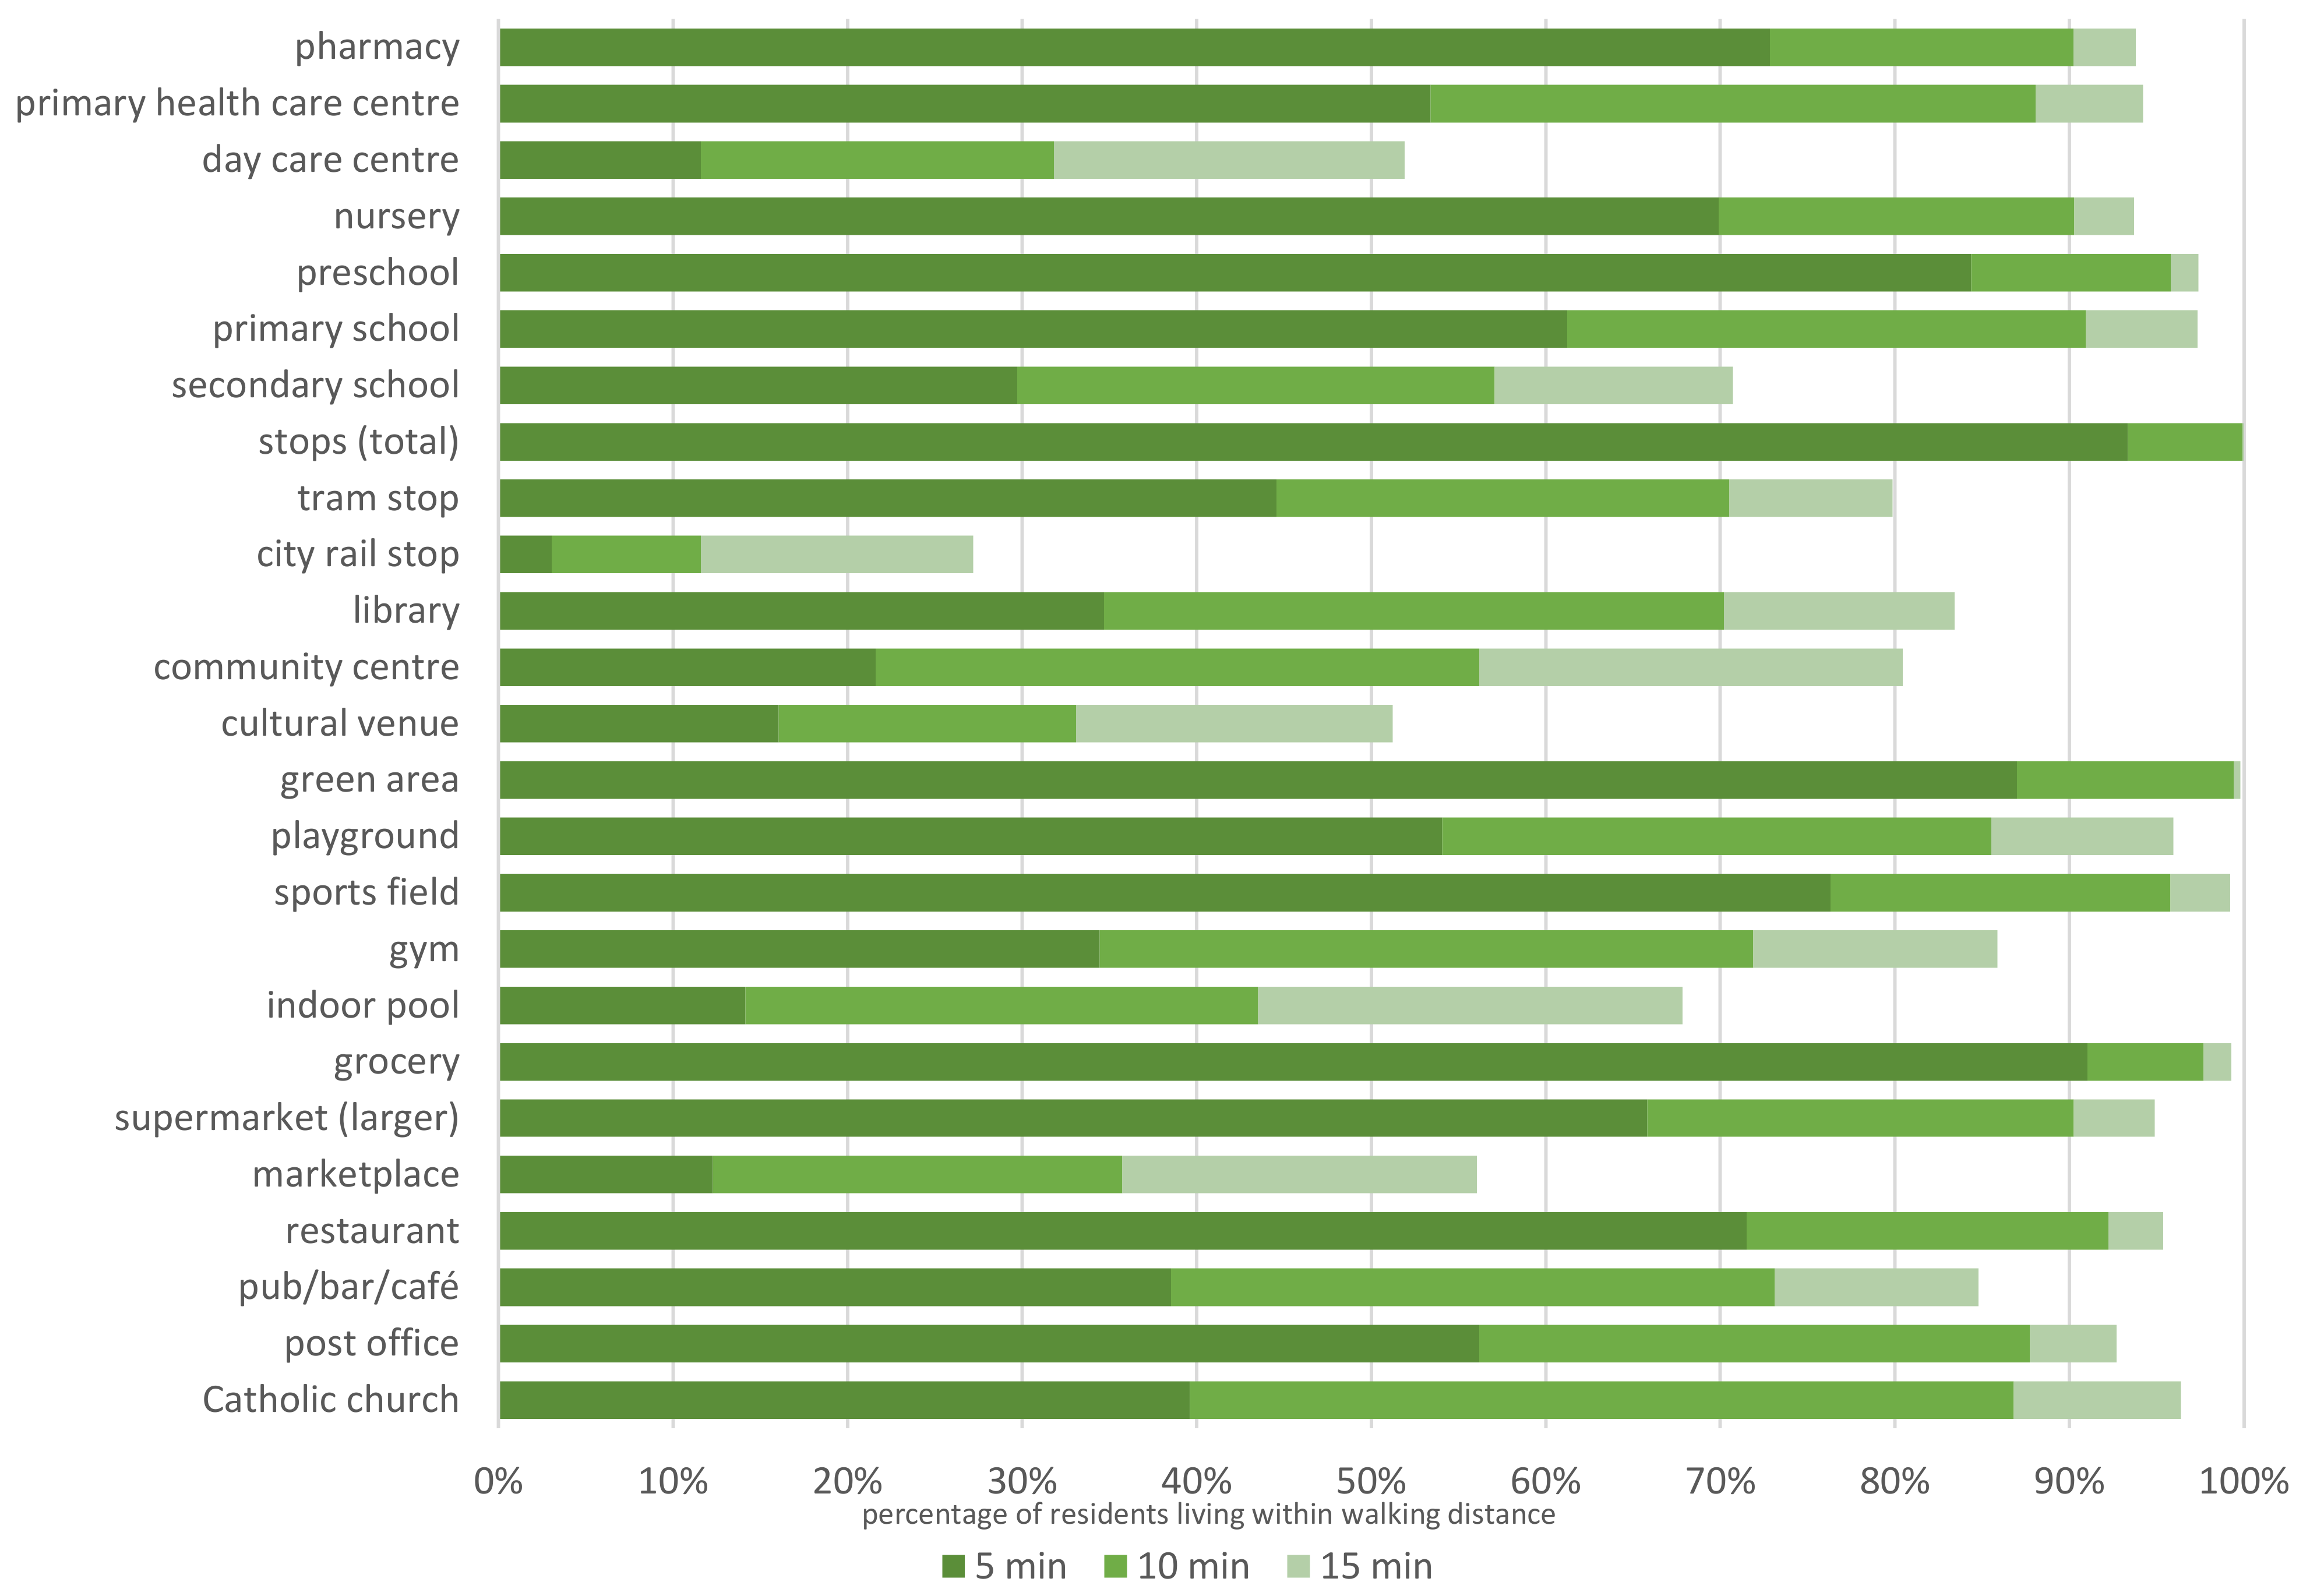
  • What percentage of Krakow’s residents can access specific facilities within 15 min?
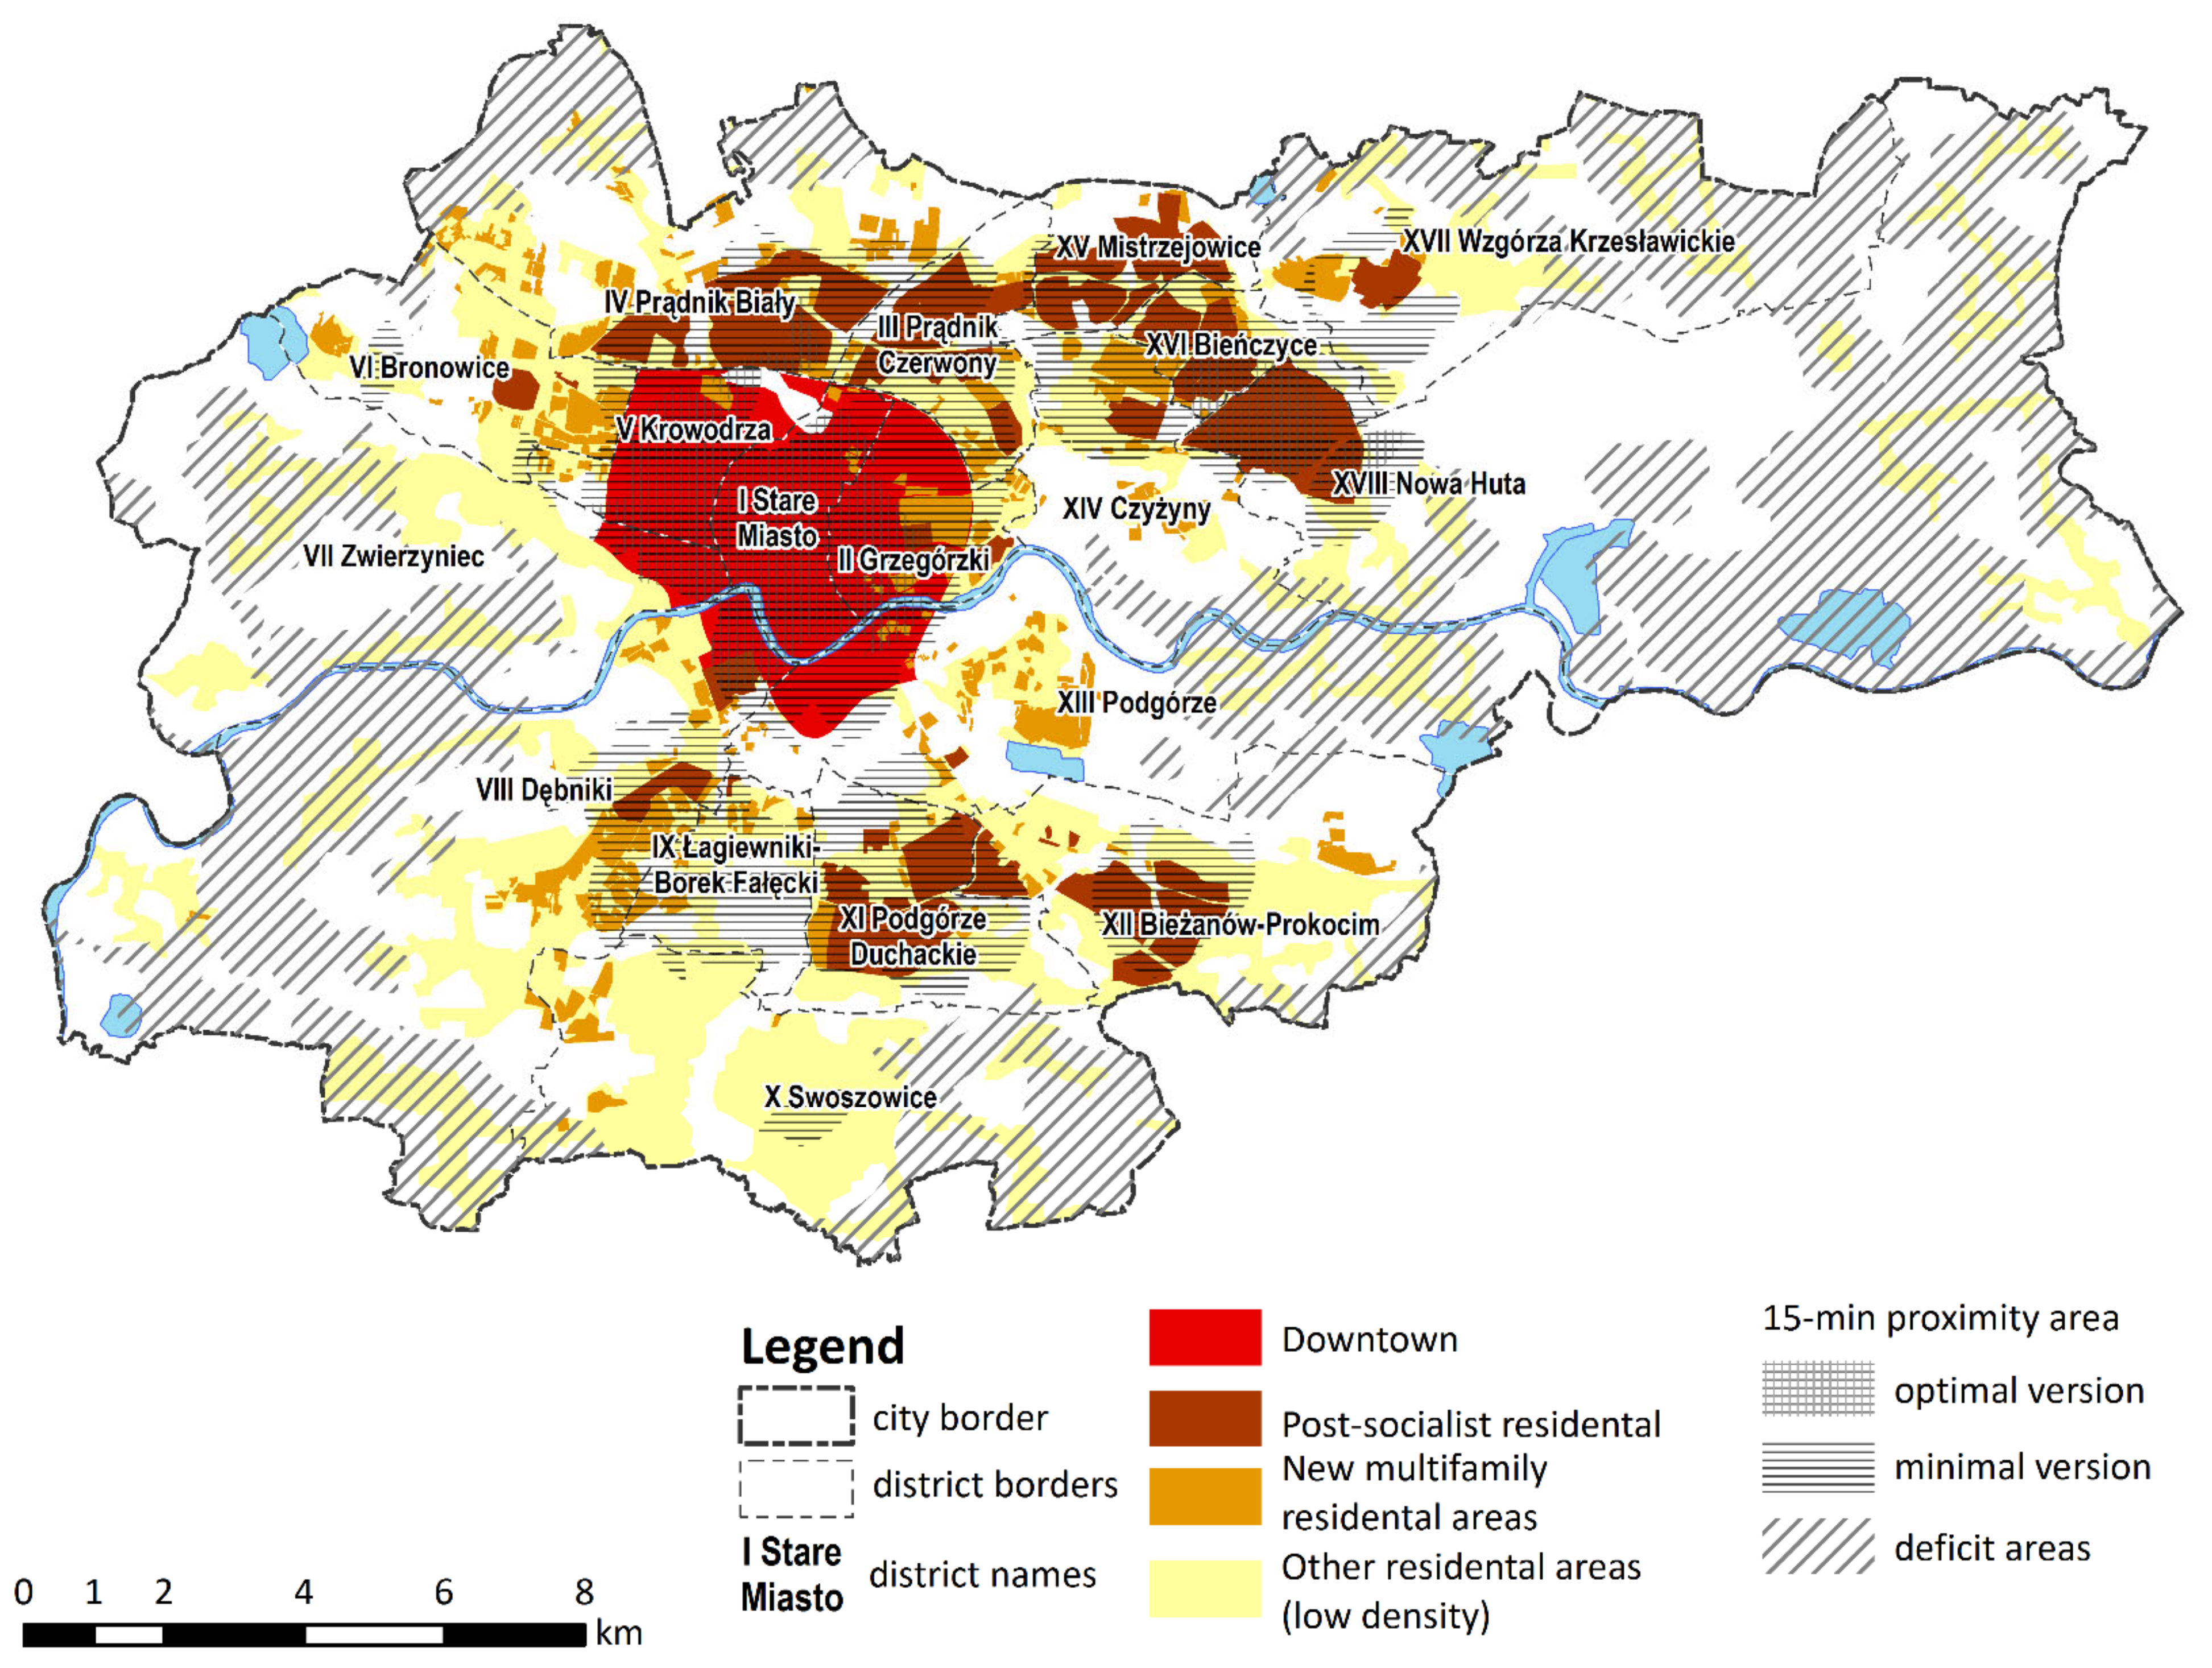
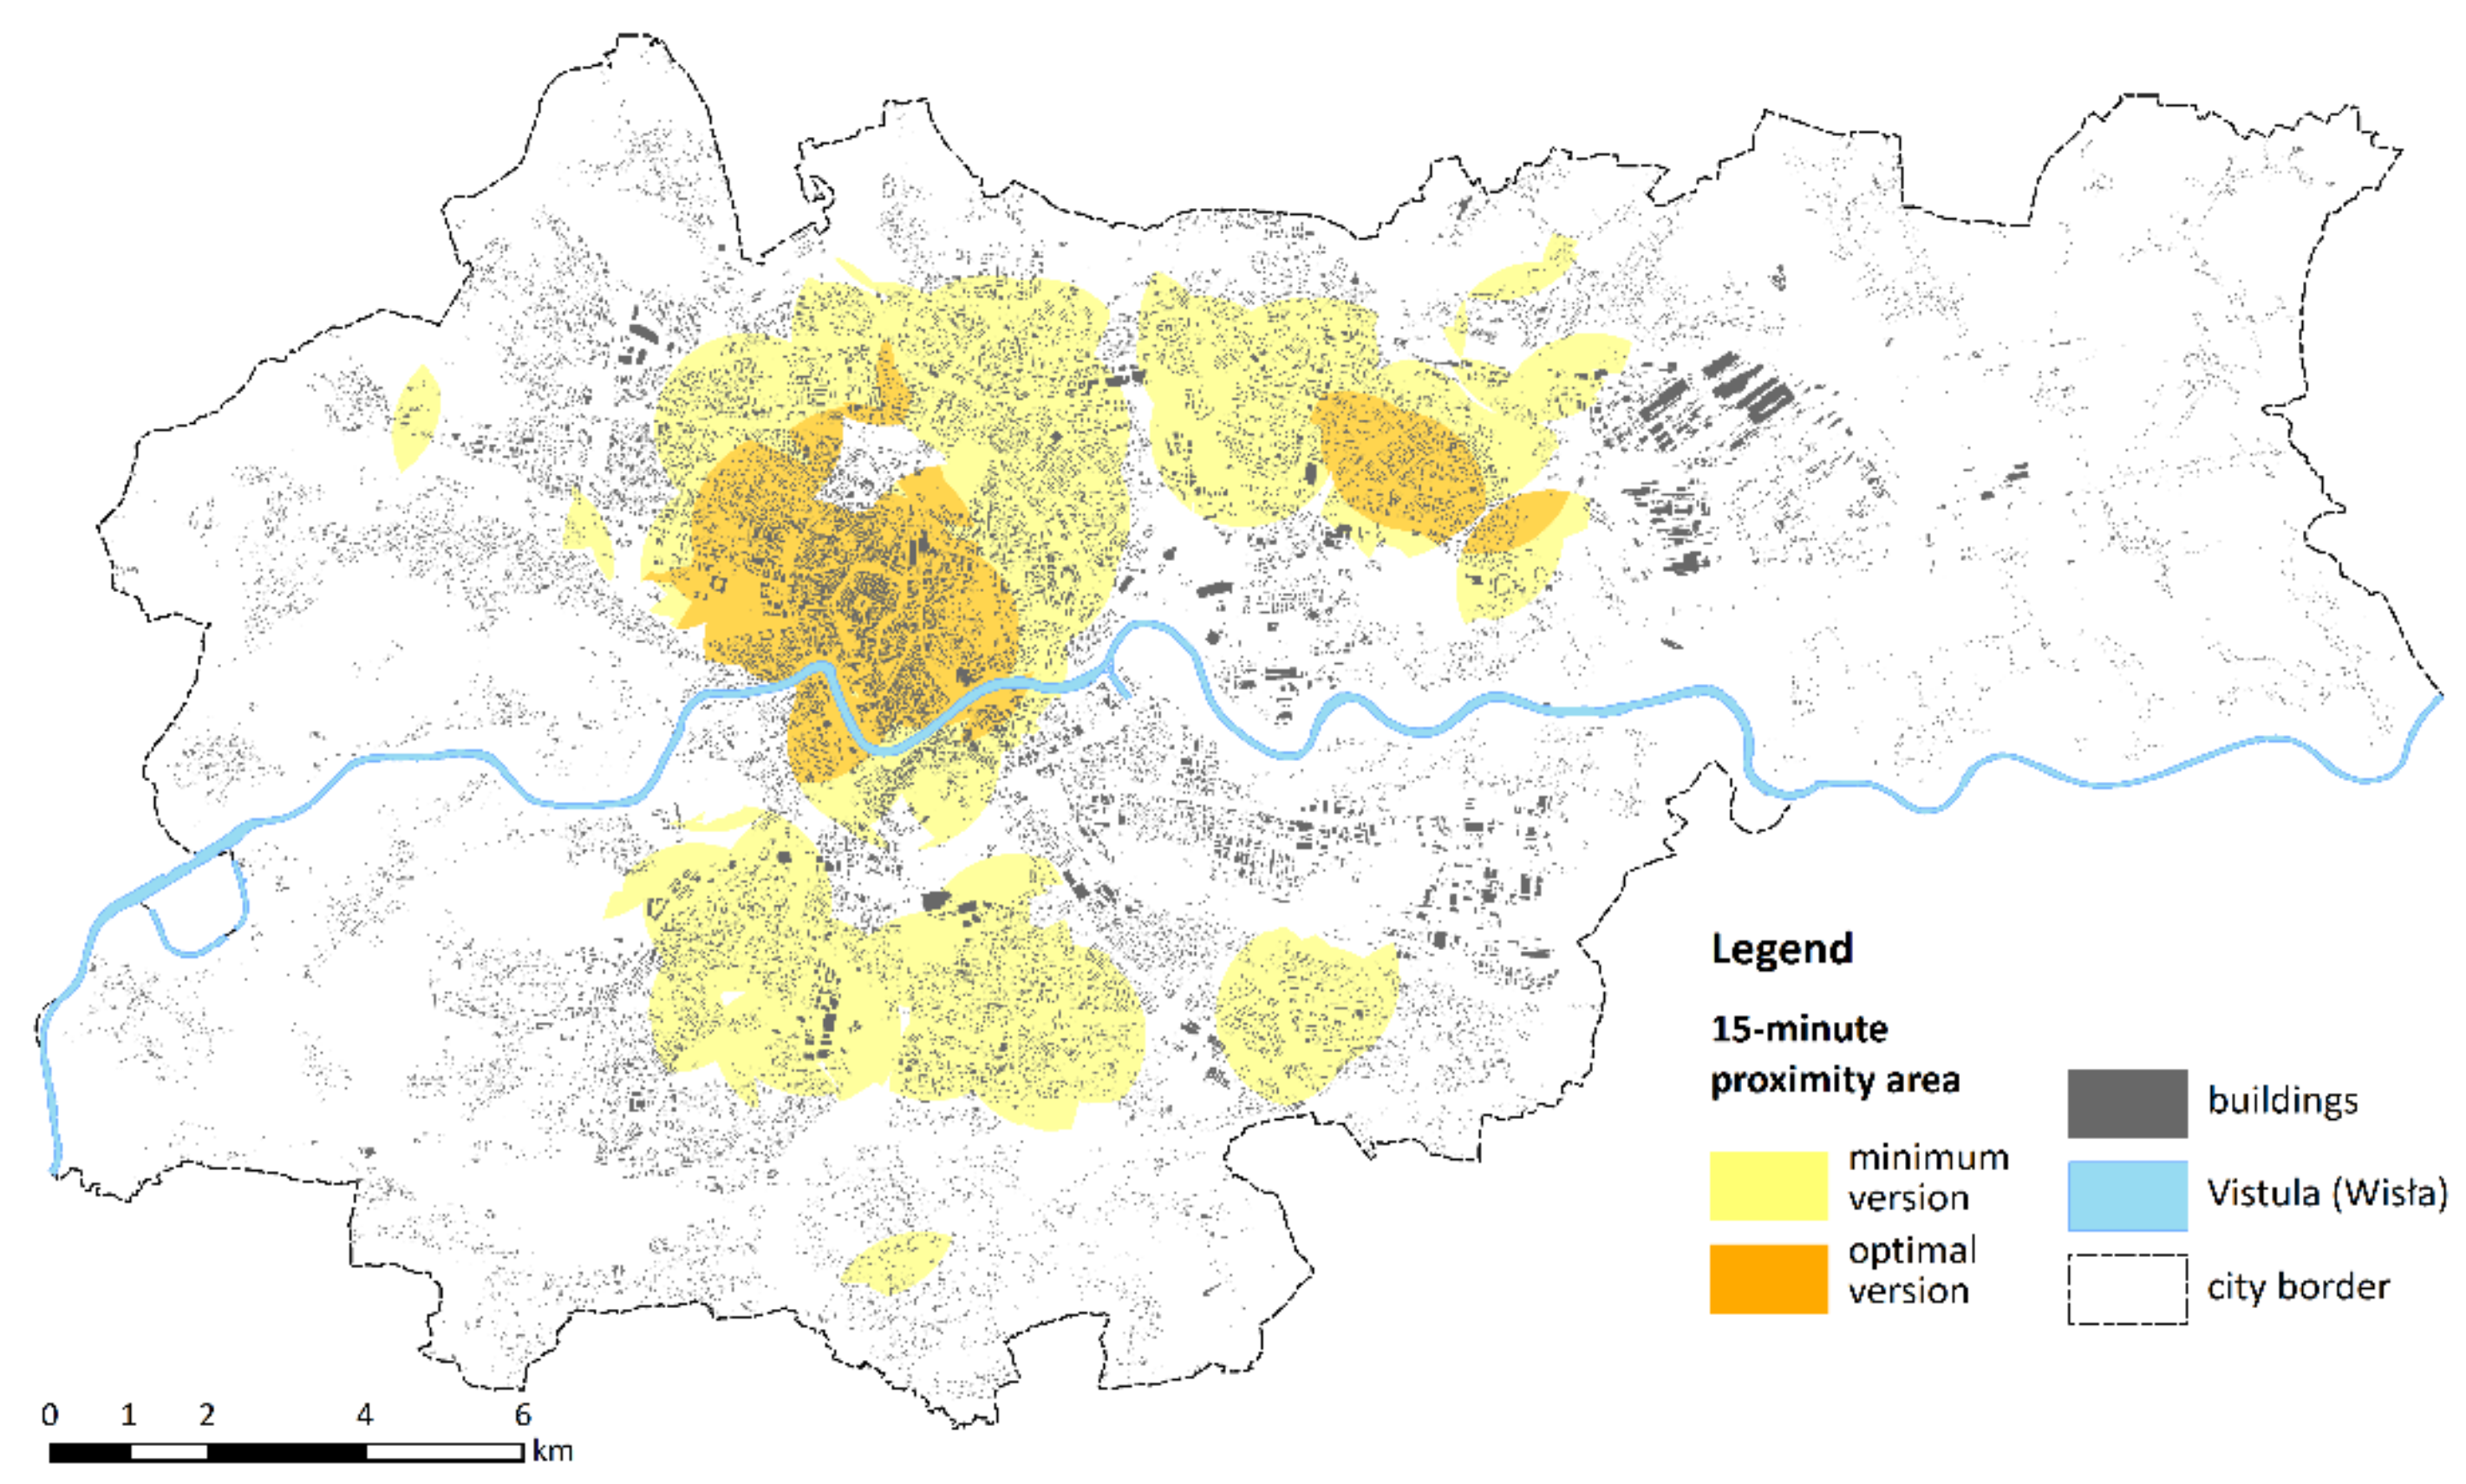
  • Which areas of the city provide access to a set of services that meets the needs of residents within a 15-minute walking distance? (minimal and optimal versions)
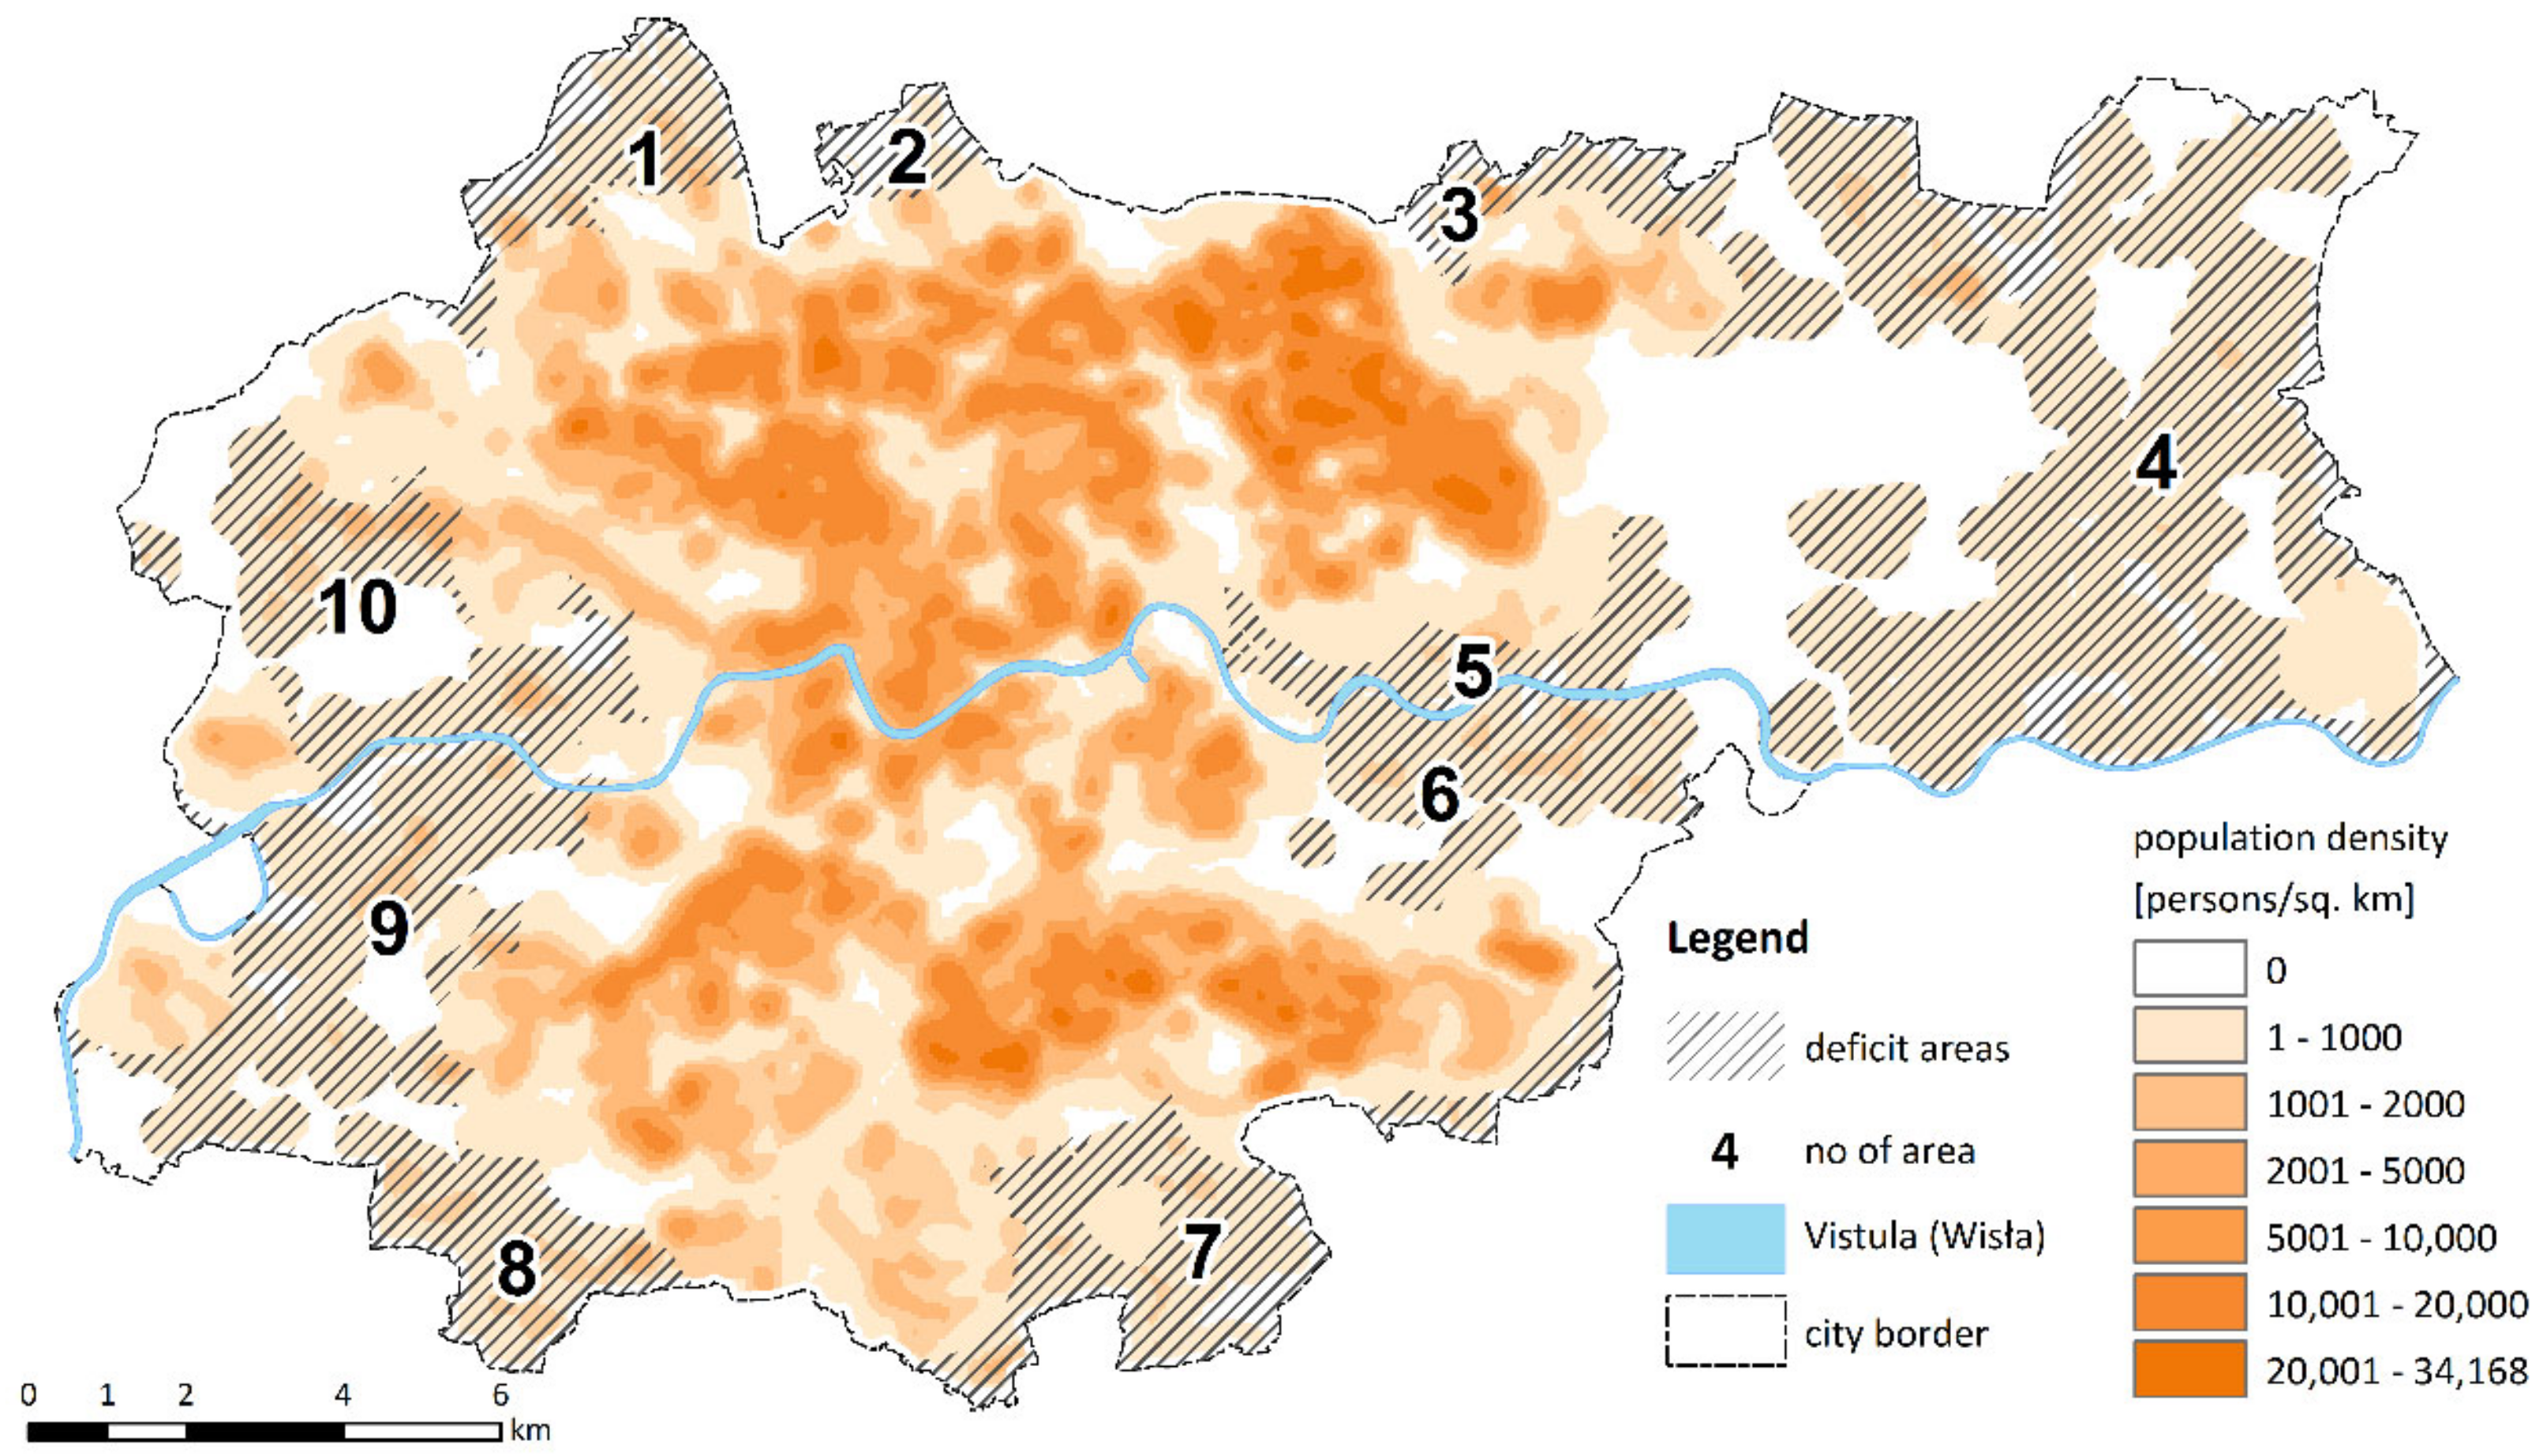
  • Which areas are characterised by the largest deficits in the local provision of services?
The concept of spatial proximity, which stipulates 15-minute pedestrian access to services, was crucial for the analysis as it determines the functionality and quality of life while also laying the groundwork for better social relations and a more productive existence for all users of urban areas in question. We identified a range of accessibility parameters and services that can be reached without the use of a car to create maps in which areas with access times of 5, 10, and 15 min to the studied categories of service facilities were plotted using the equidistant method. Our research identified city neighbourhoods that fail to meet the 15-minute criterion and should be addressed as a matter of priority by Krakow’s pro-social and pro-ecological development policies.
This article, providing a multifaceted assessment of Krakow from the perspective of a short-distances city, is a preliminary attempt to recast the city as a 15-minute city and should be interpreted as an invitation to discuss analytical methods and tools for improving the quality of life of its residents.

2. Review of Research

The concept of a 15-minute or a quarter-hour city (la ville du quart d’heure) was developed by Carlos Moreno in 2016 as an attempt to respond effectively to the climate crisis and the progressing urban sprawl [1]. In 2020, in the wake of the spread of the COVID-19 pandemic, Moreno developed it further as a kind of prescription for health crises [2]. However, the assumptions behind the quarter-hour city were already present in previously formulated concepts relating to the design of urban spaces and urban living. It draws, among others, on the concept of the neighbourhood unit formulated in the 1920s by Clarence Perry [3], the work of Jane Jacobs promoting the creation of multifunctional, densely populated, pedestrian-friendly and vital neighbourhoods [4], and New Urbanism which advocates the creation of compact, pedestrian-friendly, mixed-use neighbourhoods in which many everyday activities take place within walking distance [5].
The 15-minute city reflects the goals and recommendations contained in the 2030 Agenda for Sustainable Development (Goals 3, 5, 9, 10, 11, and 13) [6], responds to the New Urban Agenda’s call for the Right to the City [7], and also aligns with the vision of green, equitable, and productive city outlined in the New Leipzig Charter for Cities [8].
Nowadays, the most commonly used term is ‘the 15-minute city’ popularised by A. Hidalgo and C. Moreno [9] (e.g., Paris, Milan [10]). Nevertheless, it should be remembered that similar ideas are also being implemented in other urban areas, e.g., the human-scale city (ciudad a escala humana) in Buenos Aires [11], complete neighbourhoods in Portland [12], vital neighbourhoods (barrios vitales) in Bogota [13], 10-minute neighbourhoods in Charlotte [14], 15-minute neighbourhoods in Ottawa [15], 20-minute neighbourhoods in Melbourne [16] and Detroit [17], the 30-minute city in Sydney [18], walkable places in Houston [19], and Barcelona’s superblocks [20].
By definition, all residents of a 15-minute city should be able to meet most, if not all, of their daily needs within a short walking or cycling distance of their homes [21,22]. This simple designation not only emphasises closeness to places where the needs of inhabitants can be met (hence the concept is sometimes also referred to as a short-distance city) [23] but also provides a very interesting starting point for an in-depth analysis of the concept. On this basis, three fundamental questions can be formulated, the answers to which will allow for the exploration of both the essence of the concept and its modification.
The first question concerns the type of unit within which the inhabitants should be able to satisfy their needs. Urban areas implementing the 15-minute concept use different terminology, e.g., Paris, Milan, Sidney, and Buenos Aires refer to ‘city’, whereas Portland and Melbourne prefer ‘districts’ or ‘neighbourhoods’.
Although the terms ‘city’ and ‘neighbourhood’ have similar meanings in this context, the former seems more appropriate. It should be noted that the short distance requirement applies to all the residents of a city, not just those who live in its specific neighbourhoods; moreover, the distance that must be travelled to meet a need may extend beyond the boundaries of a single neighbourhood. Besides, activities in cities implementing this concept are not limited to specific neighbourhoods but involve all of their component territorial units.
The second question concerns the timeframe adopted as a reference and requires a brief explanation of the concept of chrono-urbanism, which is a response to the desynchronisation and transience of the existing social practices and urban lifestyles [1,24]. Traditional urban planning, based on long-term and relatively sustainable social behaviour patterns, is not as successful in the case of cities in constant motion, where mobility and speed are increasingly important aspects of the pace of life. To keep up with changes in urban space, chrono-urbanism incorporates variables such as place, movement, and time into the planning process. Space and time are equal values and must be considered when planning urban life [2]. Chrono-urbanism, as applied to the concept of a 15-minute city, represents the period of time during which residents can access places where their needs are met. In practice, a variety of target time limits have been adopted, e.g., 10 min (Charlotte), 15 min (Paris, Milan, and Ottawa), 20 min (Portland, Detroit, Dublin [24], Melbourne, cities in Scotland) or even 30 min in the case of Sydney [22]. In the context of the time periods proposed by different cities, “it is noteworthy that while the concept of ‘chrono-urbanism’ may seem arbitrary for some—e.g., why 15 min and not 17 min?—this concept is not rigid in nature and is proposed with the intent to be tailored to individual cities based on both their morphology and specific needs and characteristics.” [1] (p. 106).
It is only natural that the timeframe within which residents should be able to access services to meet their needs varies because it reflects people’s natural habits and willingness to make daily journeys, though Marchetti observed that the average daily time a person is willing to spend travelling is about 1 h (this is sometimes referred to as Marchetti’s constant) [25,26].
It is also necessary to consider the role of urban transport in providing residents with access to goods and services needed on a daily basis. This is an important issue because residents can travel different distances within the same period of time depending on the mode of transport. As a result, the question arises of which mode of transport should be considered when determining the scale of the 15-minute city. For obvious reasons, the car should be excluded from the list; otherwise, most modern metropolitan areas would meet the stated requirements while failing to achieve the desired positive environmental or social effects [27,28]. An efficient, affordable and well-designed transport system should make longer trips easier and more comfortable (especially between city districts) and thus reduce the use of private cars for city traffic [27,28]. Nonetheless, due to a number of methodological issues, this mode of transport should not be used to establish the reach of the 15-minute city since “a resident using public transport has to walk to a stop, wait for a train or bus to arrive, complete the journey and then walk to his/her final destination. These trips vary by start and end points as well as the level of development of transport services, which is constantly changing. The distance a resident can travel within a quarter of an hour depends on too many variables to determine the scale of the 15-minute city. In contrast, walking and cycling trips are independent of such variables and essentially occur on a door-to-door basis.” [27]. As a result, a short-distance city should be defined first and foremost by its ability to provide services to its residents within a 15-minute (or shorter) walking or cycling distance.
The third and final question concerns the kinds of needs to be met within the stipulated time limit. Naturally, the city does not have to meet all of its residents’ needs but rather those related to their daily lives. While a grocery shop and a bus stop are both considered absolute necessities, highly specialised medical services are not. What is important is local access to a wide range of places considered important for the perception of quality of life, such as health care centres, preschools, schools, social services, public transport infrastructure, cultural facilities, entertainment and recreation, parks and green areas [21,22,29,30].
A very important aspect of a quarter-hour city is to provide its inhabitants with work opportunities within walking distance of their homes. This can be achieved both by providing small and inexpensive office spaces and by creating incentives and opportunities for remote working, which has become a common practice in efforts to prevent the spread of the COVID-19 pandemic [1].
According to Moreno’s original concept of a 15-minute city, people enjoy a higher quality of life in places that effectively meet the following six basic requirements of decent urban life: living, working, supplying, caring, learning, and enjoying [23]. These functions can only be fulfilled in an urban area characterised by:
  • proximity—understood as a short physical distance to services, goods, equipment, buildings, and places that serve the needs of citizens;
  • diversity—understood as 1. a comprehensive use of space in order to provide inhabitants with access to a wide range of services, goods and facilities offered by the city; and 2. multiculturalism;
  • density—or the concentration in a given area of a sufficient number of residents to make it profitable to do business and provide a variety of public services;
  • ubiquity—a city must be affordable for everyone who wants to live in it and ensure equal access to services, infrastructure, employment, education for all regardless of age, health or financial situation [1,23].
In 2021, as a result of actions taken by cities worldwide in an attempt to prevent the spread of the pandemic, Moreno amended the list. In its updated version, he replaced ubiquity with digitalisation [1,31].
Moreno’s characteristics of a 15-minute city seem to be universal and can be found in various forms throughout the world [22,32]. This, in turn, necessitates a closer examination of the concept’s constitutive features, especially proximity, diversity, density, and digitalisation [1].
In a broad sense, spatial accessibility refers to the ability of two points in space to interact economically and socially. As such, it is distinguished by the dimensions listed below:
  • spatial (takes place in space), communicative (through a variety of media, including transport);
  • temporal (takes place at a certain time or occupies a certain amount of time), and socio-cultural (concerns communities with different social characteristics, needs, opportunities and expectations);
  • economic (requires effort—financial outlays, technical resources);
  • purpose (is conducted with a specific purpose in mind) [33], and infrastructure provision (as measured by indicators that describe the quantity and quality of infrastructure or the level of congestion) [34].
In the context of meeting the needs of city residents, Taylor defines accessibility as “the possibility for the inhabitants of a given area to use a certain type of service.” [35] (pp. 261–283). Spatial accessibility is therefore described as the ease of reaching a place or function from another place expressed in terms of distance to be covered, transport cost and/or travel time [36]. The barrier that hinders the use of the service (i.e., the interaction) is space—the distance between the starting point of the journey (usually the place of residence) and its destination (the facility where the service is provided) [37]. In this context, two aspects of accessibility can be identified: 1. mobility, which overcomes the space barrier by means of transport, and 2. proximity, based on geographical proximity [38]. Nowadays, particularly in the aftermath of the COVID-19 pandemic waves, a third aspect, namely digitalisation, plays an increasingly important role, allowing an increasing range of needs to be met remotely [1,31]. It is worth noting that, apart from the objective dimension that can be captured by a coordinate system, proximity has a subjective dimension resulting from people’s perceptions of space and distance [34] as well as the time needed to travel it. These perceptions depend on individual preferences, the type of urban space, and its attractiveness to passers-by. At the local level, the walkability [39] of public spaces and their saturation with public green areas are also important aspects of the 15-minute city idea.
With the above in mind, in a 15-minute city, proximity should be understood not only in physical terms as the distance to be covered but also in temporal ones such as the time it takes residents to reach basic services, which should be possible via a short walk or bicycle ride. This means that the emphasis of this concept shifts from accessibility to the proximity of urban functions with local access to a wide range of services and infrastructure important for the residents’ perception of quality of life [40]. Concepts that prioritise accessibility, on the other hand, focus on developing efficient transport systems that allow residents to access services and infrastructure in other parts of the city. In other words, unlike previous concepts, a 15-minute city brings urban activities to where people live rather than taking people to urban activities [21].
In the context of a 15-minute city, diversity should be understood primarily as the range and comprehensiveness of functions and services available to local residents to satisfy their needs, which can be reached within a quarter of an hour. In practice, this entails a ‘deconstruction of the city’ or mixing as many functions as possible within a given space [41]. To that end, short-distance neighbourhoods should be mixed in nature, fulfilling residential, retail, office, administrative, and even light industrial functions [42]. More importantly, Moreno believes that diversity should manifest itself not only across the city as a whole or its districts but also within individual buildings located in a given area [1]. In practice, effective diversity implementation necessitates adding new functions to places that, in most cases, only serve one purpose. This is especially true for retail establishments, schools, restaurants, and residential and office buildings. In carrying out such transformations, the concept of chronotopy, which assumes that the same location can be used differently depending on the time of day, day of the week, or season [40], is especially useful.
In a 15-minute city, density primarily refers to the number of inhabitants per sq. km. Optimal density makes it easier to access high-quality commercial and public services in the vicinity, reduces the need for travel, creates demand for services and products (the volume of this demand makes their provision and production profitable), and contributes to a more sustainable use of resources, especially the natural environment.
The advancement of digitalisation not only broadens the range of urban services available to residents but also makes it possible to meet a significant proportion of their needs related to work, administrative matters, shopping, communicating, and making payments. The digitalisation of an increasing number of commercial and public services increases their accessibility without the need for travel. This, in turn, makes the city more resilient to the risks associated with climate change, among other things, by reducing harmful emissions and making better use of its resources. As evidenced by the recent lockdowns intended to check the spread of the pandemic, digitalisation also helps the city respond to other types of crises.
The above-mentioned qualities cannot be imposed by authorities or experts. The creation of a 15-minute city is a bottom-up effort in which citizens play a key role. Their active participation contributes to their affective attitude toward the city or neighbourhood in which they live, manifesting itself as attachment, pride, happiness, and responsibility for the place (topophilia) [2]. Thus, citizens should not only review the plans developed by the municipality or experts but also participate in the process on an equal footing from the start. Tactical urbanism, which consists in introducing temporary changes to the urban space which are limited in scale and cost, is an interesting and effective way of engaging citizens in the effort. Such small-scale projects almost immediately deliver visible results and are primarily intended to help residents understand how larger investment programmes can change their city or neighbourhood [43].

3. Materials and Methods
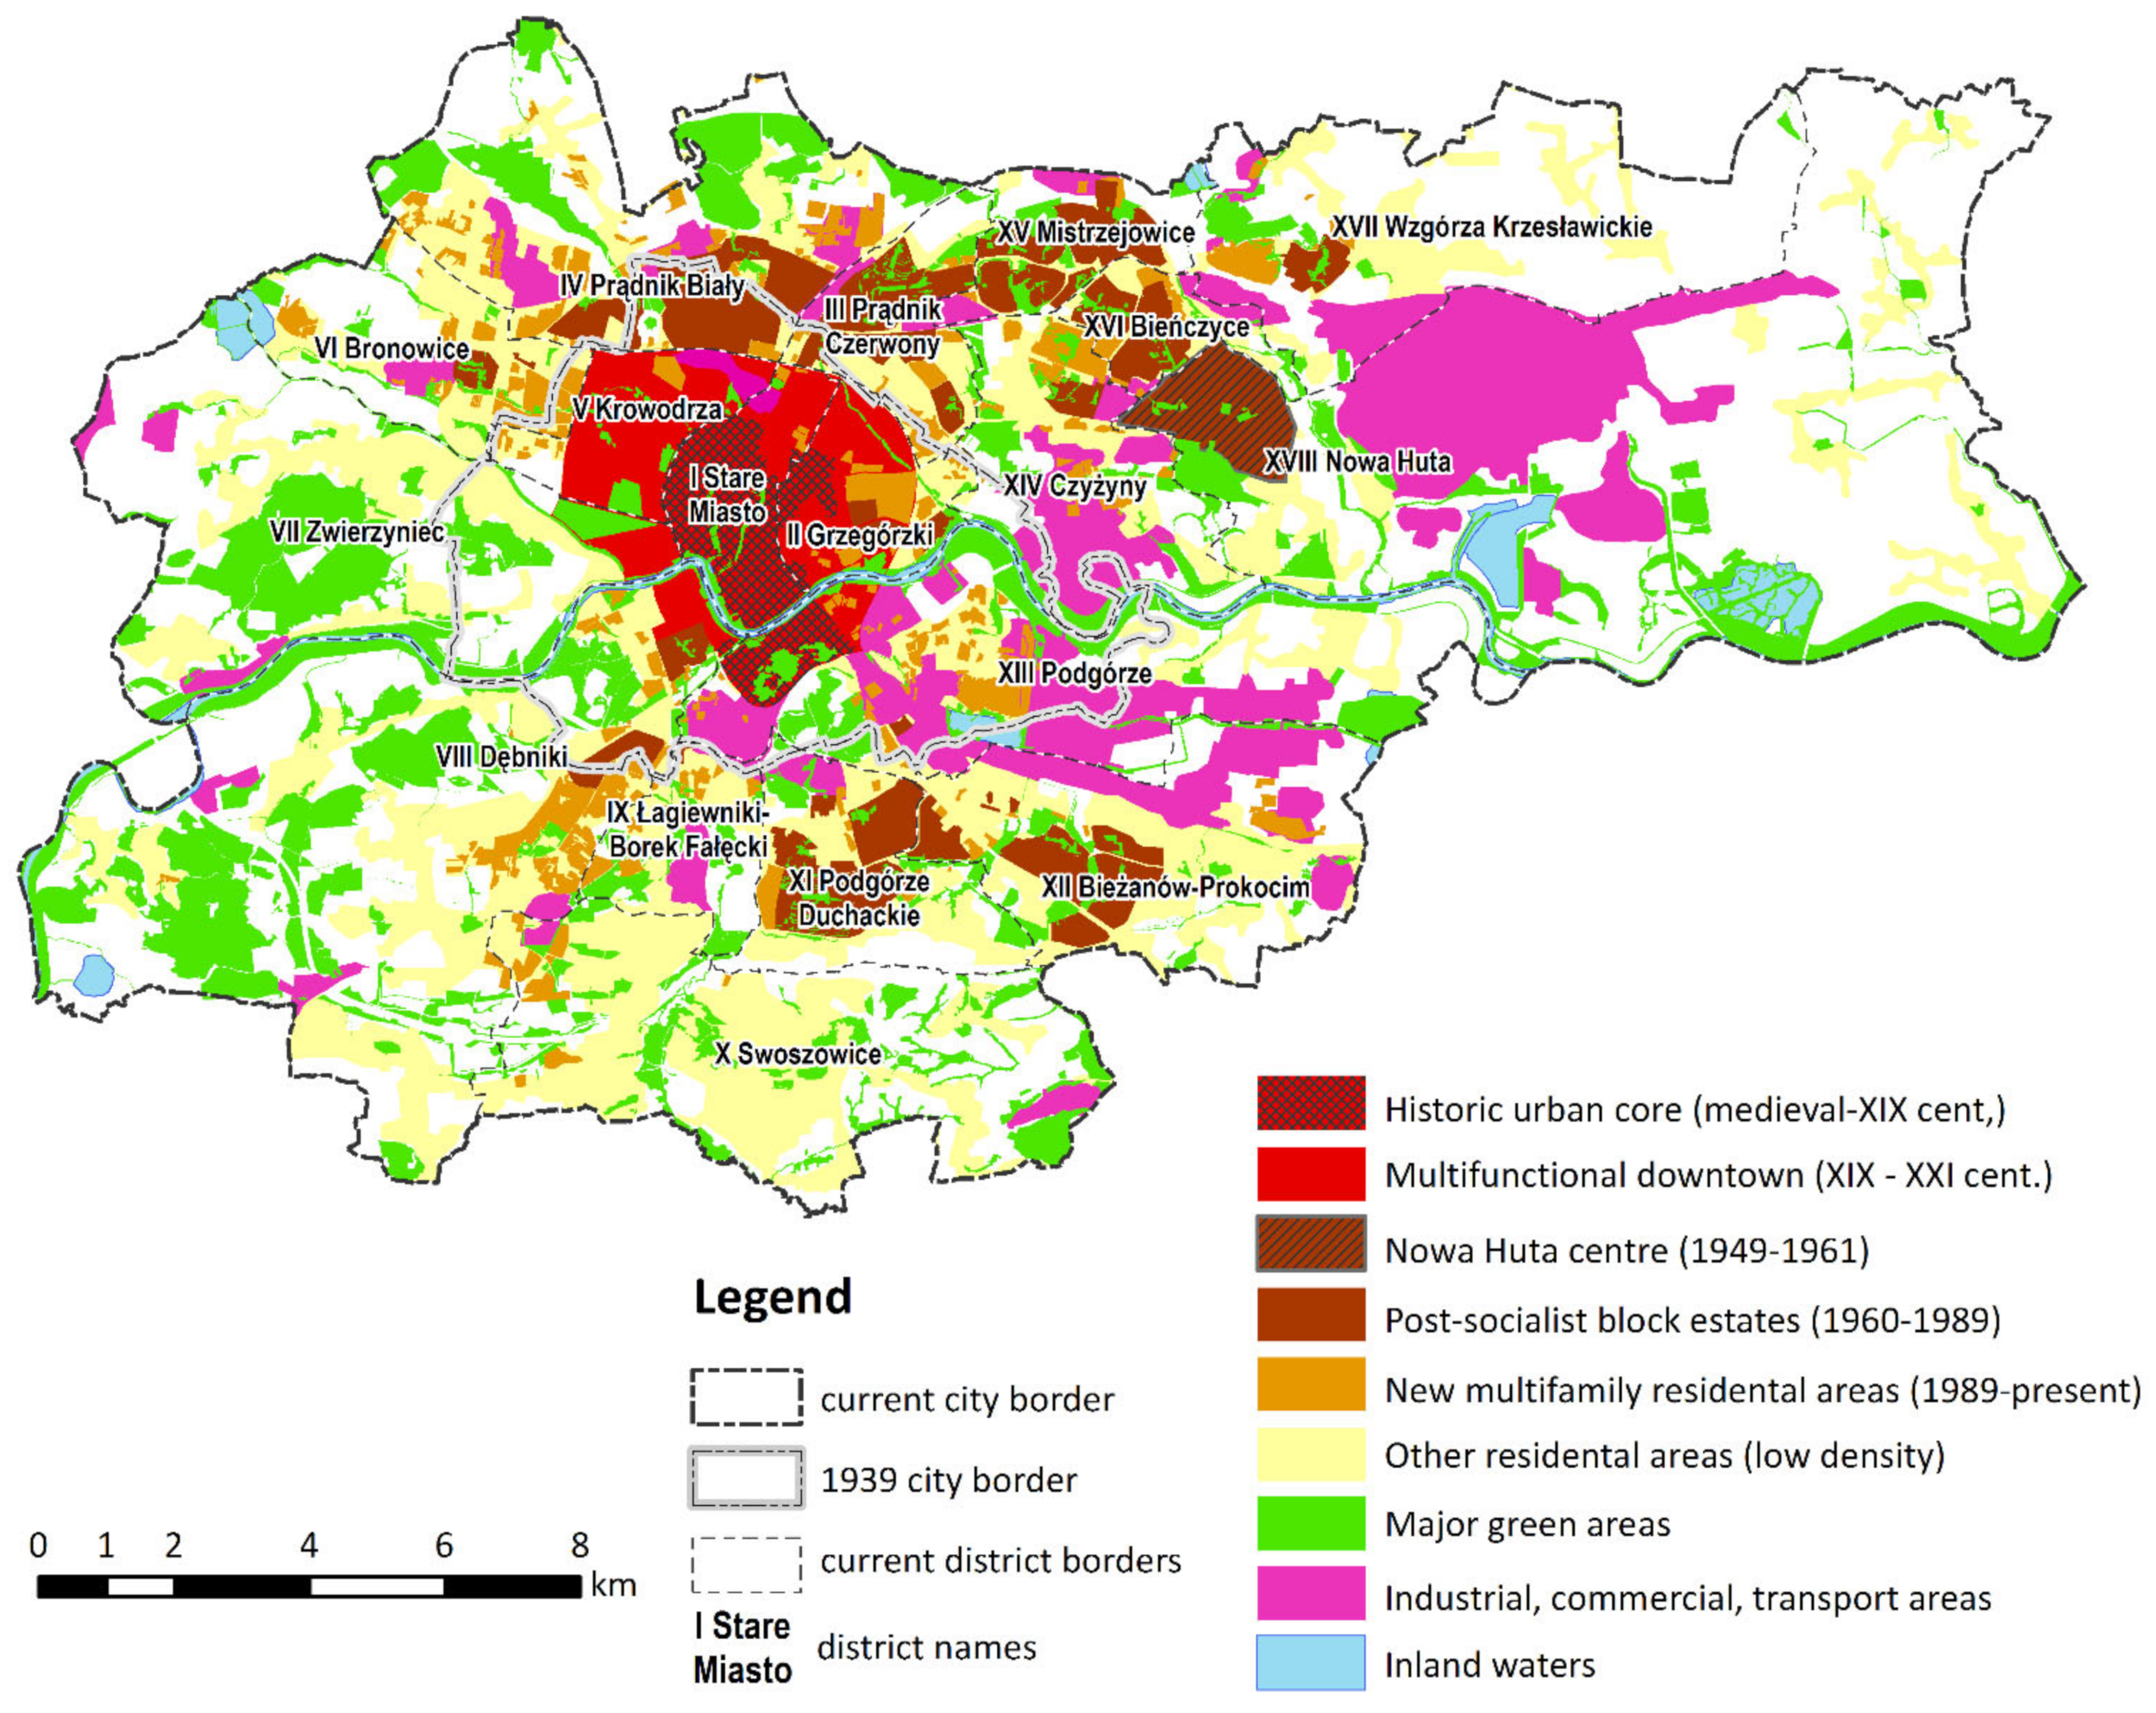
3.1. Study Area

Krakow is the second-most populous city (781,000 in 2021) in Poland. The medieval city centre has preserved its historical urban layout. During the Austro-Hungarian period, Krakow was a fortified city, with an area limited to less than 6 km2, inhabited by 90,000 people around 1900 (the once separate town of Podgórze, now the southern part of the urban core on the right bank of the Vistula, was then inhabited by 18,000) [44]. This constraint had a significant impact on the development of Krakow’s current urban core (see Figure 1), resulting in the creation of a very dense and diverse city centre. Krakow expanded several times between 1912 and World War II. Its area in 1939 was less than 50 km2 (see Figure 1). The traditional, high-density pattern of residential areas was maintained at this stage. World War II halted this period of compact development.
Following the war, the city experienced rapid growth and industrialisation based on socialist economic principles and modernist development paradigms. The construction of a metallurgical plant and the new town of Nowa Huta (see Figure 1) sparked post-war development. The first phase of this settlement (now known as “the Old Nowa Huta”) was designed to be an ideal, socialist city. The city plan was based on classic Renaissance towns, C. Perry’s neighbourhood unit concept, and E. Howard’s garden city concept. Residential units were designed for 5–6 thousand inhabitants, with social infrastructure provided to each of those units [45]. Extensive green areas were designed, ranging from green inner yards to large parks.
The industrialisation of the city caused rapid population growth in the 1960s (to approx. 750,000 inhabitants in 1989) and an urgent need for new housing supplies and residential areas. This meant an over six-fold increase in area (to 326 km2; Figure 1) as well as a break with traditional neighbourhood planning in favour of large housing estates built in the newly incorporated areas using precast concrete technology. The main large estates of this kind are situated north and northeast of the city centre and the southeastern part of the city (see Figure 1). These estates are characterised by large, multi-story buildings surrounded by extensive green spaces. They included the necessary social infrastructure; however, due to a lack of funds, not all amenities were always built [46].
The next stage of the city’s development began with Poland’s economic transformation in the 1990s and coincided with a spatial planning crisis in Poland, linked to a neoliberal approach to shaping space. The first Spatial Planning and Development Act (1994) replaced former Spatial Master Plans with the so-called Studies on Preconditions and Directions in Spatial Management, which set general spatial policy and provided the basis for Local Zoning Plans. In the areas with no Local Plan, the act allowed to start development on the strength of administrative decisions, with no obligation to meet the conditions defined by the study. The Subsequent Act (2003) repealed all Master Plans passed before 1995, leaving most of the country with no spatial regulations. Local Plans covered only 17% of Krakow in 2009 but 50% in 2017 [47,48,49]. During this period, the majority of housing developments were built on the strength of administrative decisions. In many cases, this resulted in a haphazard construction of housing estates devoid of basic services, green areas, or adequate transport links [50,51]. Large residential areas of this kind were built in the southern part of Dębniki, the northern part of Prądnik Biały, the central part of Podgórze, the eastern part of Bronowice, and in Czyżyny (see Figure 1). The recent trend is toward re-urbanisation; new residential buildings are constructed downtown, particularly in post-industrial areas. Most of this new development is concentrated in the eastern part of downtown on both banks of the Vistula (see Figure 1). A fairly large part of the city is occupied by sparsely populated quasi-rural areas (especially in the eastern part of the city).

3.2. Data Sources and Research Method

The analysis began with the identification of a set of needs that should be met on a local level. Short-distance city concepts emphasise pedestrian access to facilities and places important for a high quality of life, such as diverse social services and green and recreational areas. Based on the literature [22,23,29,52,53] and expert discussions, six categories of needs implemented in the short-distance city were identified, which were further broken down by specific services and facilities where they are provided (Table 1). For the purposes of the study, the facilities were divided into two groups: 1. the minimal version, which comprises only basic local services, and 2. the optimal one, which also includes more complex/advanced services. In both cases, it was assumed that public transportation services are accessible on foot within 10 min in the minimal version and a tram in the optimal version. Krakow’s public transport is based on two systems: buses and trams. The tram is the primary and fundamental mode of public transport (in some parts of the city, it runs underground). The tram system is also mostly traffic-independent and provides relatively fast access, but its coverage area is limited. The larger bus system serves areas where tram services are not available, but it does not provide traffic-free, quick connections. Therefore, in the minimal version of the study, all the public transport stops (bus and tram) were included, and in the optimal one, only tram stops. Currently, extensive investment in urban/suburban rail is being made, including the construction of new stops to expand the existing network as part of city transportation. The proximity to rail stops was also investigated, but due to the very limited extent and lack of ticket integration, their catchment areas were not included in the later 15-minute proximity test.
The maps reproduced below were created using spatial data from a variety of sources. We relied basically on the official data contained in the Municipality of Krakow’s Urban Spatial Information System (https://msip.krakow.pl, accessed on 31 July 2021), despite the fact that it lacks many facilities considered important for service availability analysis. To identify green areas, spatial data from an appendix to the study titled Directions for the Development and Management of Green Areas in Krakow for 2019–2030 [54] were used (publicly accessible green areas, each with a surface area of over 2 ha, were included in the study, of the following categories: urban parks, ecological parks and geoparks, forests and forest parks, fortress parks and fortress greenery, grassland commons, mounds, squares and areas of greenery accompanying residential buildings and public facilities, greenery of sports facilities, river parks and areas with water courses and reservoirs, existing greenery to be preserved as well as unmanaged greenery). Data on the population registered permanently and temporarily at individual addresses were obtained from the Office of the City of Krakow.
For the amenities not included in municipal sources, OpenStreetMap (OSM, www.openstreetmap.org, accessed on 7 May 2022) data were used. The data was verified and supplemented using the websites of relevant institutions and businesses (see Table 1). These inputs were then geotagged to match the address points from the State Register of Borders and Areas of Territorial Divisions.
The analysis required the creation of a spatial database containing relevant Points (polygons in the case of green areas) of Interest (POI) with their locations corresponding to individual facilities of interest to local residents.
The catchment areas for each service category were delineated by the distances covered by pedestrians in a straight line in 5, 10, and 15 min, respectively, assuming (after Hoogendoorn Daamen [39]) the average walking speed to be 1.34 m/s (or 80 m/min). This represents a fairly brisk walk and is roughly equivalent to that adopted by Andrés Duany and Robert Steuteville for their 15-minute city concept (3 miles/h) [27]. A simple ArcGIS buffer creation tool was used to delineate the catchment areas. The tool creates buffer polygons around input features (point and polygons in this study) to a specified distance (measured in a straight line). The buffers of 400, 800, and 1200 m from each POI were then plotted. Access to green areas was measured as a distance to their borders (the border of each polygon represents the green area).
The dissolved buffer polygons created for the POIs of each facility were used to create the area of 5, 10 and 15-minute proximity to a given service. The catchment areas for each facility were then mapped. The area within the theoretical 15-minute distance to the minimal and optimal POI—the proximity area—was created as the geometric common part of the catchment areas’ layers of the individual sites. This means that the proximity area must cover all of the facilities included in its minimal or optimal versions listed in Table 1. Deficit areas were then identified as areas of the city that lack access to more than five categories of POI in the minimal version. These locations are thus not covered by catchment areas of more than five facilities listed in the minimal version in Table 1. The map of population density was created using the previously mentioned data to limit the deficit areas to inhabited areas of the city. A kernel density tool with a cell size of 25 m was used to visualise population density; uninhabited areas were then excluded from the deficit areas.
Finally, for each of the obtained areas (catchment areas, proximity areas in minimal and optimal versions, and deficit areas), the number of residents was calculated using the population data in address points covered by the buffer (see Figure 2).
A map was created to show the proximity areas and deficit areas within the urban fabric in order to determine the correlation between the main types of residential areas (shown in Figure 1) and service proximity.

4. Results

4.1. Externalities of a 15-Minute City

The growing popularity of the 15-minute city may result in a shift in perception of the existing spatial systems. This fact affects the degree of transformation, and sometimes re-evaluation, of the very fabric of urban functional areas, those undergoing urbanisation processes, and already urbanised spaces. It may also influence the dynamics and range of spatial relationships, particularly functional ones. Political factors, including city development policy directions, and economic factors, appear to be very important in this context, taking into account the needs of all space users. These are affected by the current institutional, legal, and administrative situation of a given urban (spatial) unit.
Any discussion of the 15-minute city should take into account the factors that influence the quality of life, such as the population density of individual districts and housing estates, their functional specificity, as well as their historical and spatial structure. Suburban areas, which typically determine the development potential of the urban core, also play an important role in this respect. The various feedback that they generate influences the space and, more importantly, the quality and formula of development that is acceptable to the local community [55,56]. The 15-minute city also generates multiple positive and negative externalities as a result of the planning, management, and spatial development policies that have been implemented. Numerous benefits identified in the local space at the neighbourhood or district level, where the inhabitants go about their daily activities, are usually accompanied by economic and/or ecological losses. Every time a space is organised—even if it is fully functional and characterised by a desirable order—the process is accompanied by both positive and negative mechanisms, including multiplier effects. As a result of meeting various local social and economic needs, the 15-minute city undoubtedly favours the generation of externalities, which play an important role not only in sub-local but also in regional spaces [57]. When conducting activities to assess the identified externalities, consideration should be given to the issue of individual marginal utility, which is due to the fact that positive externalities (whether socially motivated or not) do not always have to translate into individual benefits for space users. On the other hand, externalities perceived as negative by the local community can have positive effects on individual users.
Assuming that externalities derive from the behaviour of individual units in a given space (affecting the utility-scale of a larger community), it is necessary to accurately identify all parties to the transactions that occur as generators or recipients of externalities in a given structure. In the case of the 15-minute city, this can be an individual resident of a housing estate, a local community, a group of neighbourhood users, or any other persons consciously or unconsciously affected by the externalities in question.
Space users engage in a variety of activities carried out in a specific location within the framework of local spatial and economic policies [58]. Aside from the intended goal (benefit), this behaviour usually entails costs, which are critical in any discussion of externalities. In practice, it is difficult to distinguish between positive and negative externalities, especially when we lack sufficient knowledge about them or are unaware of their existence. The final assessment may be further skewed by commonly observed interactions in the spatial structure, and to make matters worse, users may have become accustomed to a number of interactions that have already occurred and no longer treat them as externalities [57].
The recipients of such externalities cannot effectively influence the entities involved; as a result, the form of use as well as the size of the benefits that stem from the consumption of locally available resources are crucial in the discussion of the significance of the externalities generated by an urbanised structure [59]. Furthermore, there is a degree of sensitivity among space users to the effects of implemented local and regional policies. Proximity, and thus appropriate location in accordance with the concept of a 15-minute city, is linked to access to the necessary social, technical, and green infrastructure. Economies of scale and processes of spatial concentration of various economic activities together with households and dedicated public services are additionally induced. Functioning in a well-organised 15-minute urban structure is usually characterised by predominantly positive effects for all users [60].
An externality is usually defined as a specific relationship between two parties, whereby one of them (e.g., a person) generates an impact on the other (e.g., a local community) without paying or receiving reasonable compensation for the said impact [61]. Managing the space of a 15-minute city should aim to reduce the generation of negative externalities. The functioning of an entity usually affects the utility of other entities which are not directly related to it [59,61]. Furthermore, decision-making processes must take into account the fact that the costs and consequences of spatial management cannot be avoided, even at the local level [62,63]. The difficulty in accurately assigning the 15-minute structure of the resulting benefits or external costs to individual users is not trivial. Difficulties are also caused by determining the price for a unit of external effect (regardless of whether it is positive or negative). As a result, the terms of the transaction procedure in the externalities market must be clarified. Such a task is usually extremely difficult, if not impossible, to complete [60,64].
In 15-minute spaces, these processes pervade one another, creating an extremely complex structure of internal and external interactions, resulting in a multiplication of the generators of externalities. Consumption has the most powerful external effects on local structures. In a 15-minute city, externalities are typically produced by manufacturing activities involving spatial management associated with development (including the management of technical and social infrastructure, real estate, and natural and landscape resources). In the emerging feedback loops, the induced externalities are reflected in implemented policies, particularly in local spatial management policies.
The 15-minute city is also strongly associated with the migration (including circular migration) of positive externalities. The variety of benefits and multiplicity of incentives in 15-minute spaces is also a recognisable and common promotional platform for new users of a given space. It should be noted that the operating costs of such structures are typically higher [65,66]. However, it should be noted that 15-minute neighbourhoods are characterised by a diversity of content, which, in contrast to monocultures, generates negative externalities on a relatively smaller scale [67,68]. Moreover, even though these negative externalities tend to cancel each other out, a complete balance between positive and negative externalities is unlikely to be achieved.

4.2. The 15-Minute Krakow

Approximately 66% of Krakow’s residents live in urban spaces that meet the most basic conditions of a 15-minute city. The city centre, the ‘old’ part of Nowa Huta, as well as a significant proportion of housing estates on both banks of the Vistula, is where a basic range of everyday needs can be met locally (see Figure 3). However, quite a few new housing developments located closer to the city’s borders fall outside this area. The picture of Krakow as a 15-minute city in its optimal form, i.e., in proximity to all the services listed in the study, is much less positive. This area is home to 19% of the city’s population and embraces only a small portion of the city—the central part of Krakow, the districts of Stare Miasto, Grzegórzki, and parts of Zwierzyniec and Dębniki located closest to the centre (Figure 3). These areas are primarily occupied by traditional compact buildings with multifunctional characteristics typical of city centres. Their relatively small size is due to the high concentration and uneven distribution of public services, particularly in the fields of culture (including such basic amenities as libraries and community centres), education, sports, and elderly care, i.e., facilities whose distribution can be directly influenced by city authorities.
Deficit areas, defined as those characterised by longer access times to more than five categories of facilities identified for a minimal version of the 15-minute city, are listed in Table 2. These areas are inhabited by 36,000 people, 5% of the city’s population.
The study’s findings, as shown in Figure 2, Figure 3 and Figure 4, warrant the following conclusions. To begin with, both the ‘optimal’ and ‘minimal’ versions of 15-minute proximity zones are to be found within Krakow’s most densely populated areas. The area of optimal proximity overlaps with the city’s pre-war districts subject to traditional urban planning and, to a large extent, the historic part of Nowa Huta built on the concept of neighbourhoods as self-contained units. A large proportion of new housing estates are located outside even a loosely defined proximity zone.
However, certain non-peripheral areas of the city also suffer from deficiencies that are yet to be addressed by local policies. They present challenges to municipal authorities in terms of improving the quality of life of local residents due to a lack of services considered essential for daily life, such as post offices, pharmacies, gyms/fitness clubs (all the areas studied), primary health care centres (9 out of 10), libraries (8 out of 10), preschools and crèches (7 out of 10 each), and playgrounds (6 out of 10).
The series of spatial proximity–service accessibility maps of Krakow illustrate the detailed findings that inform the study’s conclusions and recommendations discussed in the following section. Appendix A contains a complete set of maps listed below:

5. Discussion

The findings presented in Section 4 allow all the objectives, which are laid down in the Introduction, to be addressed in the context of contemporary interpretations of the 15-minute city. Regarding the first research question, it should be emphasised that the study reveals differences in access to services across Krakow. It is presented synthetically in Figure 2, Figure 3, Figure 4 and Figure 5 and in detail in all Appendix A maps dedicated to individual services. The adopted research approach does not account for the actual network of pedestrian routes or spatial barriers such as rivers, road and rail networks, and the increasingly common fenced housing estates. In some cases, these impediments significantly affect the theoretically calculated access time. As a result, our research of service proximity should be regarded as a city-wide scale model. At the level of individual neighbourhoods and housing estates, it needs to be refined using network analyses that take into account the actual availability of facilities on a local scale.
The theoretical perspective on the city of short distances has not formulated a universal catalogue of services to which its residents should have access near their place of residence. For example, in their research on walkability in the context of China’s 15-minute Walkable Neighbourhoods, Weng et al. analyse the proximity of Shanghai residents to six categories of amenities, including education (kindergarten, primary school, middle school), medical care (hospital, neighbourhood health centre), municipal administration (e.g., subway entrance, bus stop, park, square, library), finance and telecommunication (bank, ATM, post office), commercial services (e.g., restaurant, fresh market, small and medium-sized store, beauty salon, cinema, gym), and elderly care (nursing home, apartment for seniors, school for older adults) [52]. In their research on three Swedish cities, Gothenburg, Molndal, and Uddevalla, Solá and Vilhelmson consider proximity in the context of work and school (e.g., day-care, primary school, secondary school, university, workplaces), service and trade (e.g., recycling waste disposal), district healthcare centre, hospital, retirement home, local plaza), transport (e.g., parking (bikes, strollers, walkers), flex-route stop, carpool, public transport stop), culture and community life (potential local meeting place, municipal office, various meeting places, cinema, church) and recreation (recreational areas, parks, training circuits, public swimming pools) [29]. These differences result from the specificity of a given place as well as from different ways of perceiving proximity, which is particularly emphasised in the research by Solá and Vilhelmson, in which the model called “the Flower” is proposed as a tool for identifying an optimal set of amenities available within a convenient distance [29]. Therefore, taking into account the theoretical achievements related to the city of short distances, as well as the specificity of Krakow as a part of the study, two service catalogues were proposed, based on which Krakow’s compliance with the 15-minute criterion was assessed.
As shown in Figure 2, in the case of Krakow, the postulate of proximity is implemented to a varying degree, depending on the type of urban service. Proximity is fully implemented in the case of the public transport facilities—100% of the city’s inhabitants live within a 15-minute walk of a public transport stop (tram or bus). Another group includes 13 urban services, which at least 90% of them can access comfortably. This group includes, among others, green areas (99.8%), groceries (99.3%), sports fields (99.2%), preschools (97.4%), restaurants (95.4%), and pharmacies (93.4%). The least convenient access is to city rail stops (27.2%), cultural venues (51.2%), day-care centres (51.9%), and marketplaces (56%).
The study’s findings regarding the second research question clearly show that only a proportion of Krakow’s inhabitants currently live within 15 min of places that allow them to meet the needs related to everyday functioning in the city. According to the findings, fewer than two-thirds of Krakow’s residents live in a 15-minute city, or its minimal version ensuring comfortable proximity to a fairly limited range of services. The application of more stringent criteria for this set of public services further reduces the population of 15-minute Krakow, with only one in every five residents living near the services that such a city should provide.
In order to answer the third and the fourth research questions, the areas of Krakow within and outside 15 min of service provision facilities were identified. The first kind of area is presented in Figure 3, which lists, as was the case with the population, two variants of proximity: the optimal and the minimal ones, indicating areas with different living conditions. In the case of Krakow, the more preferable, optimal version of the 15-minute city is restricted only to the relatively small area of the city characterised by dense and multifunctional developments. Figure 4, which depicts the areas of Krakow with the greatest deficits in terms of proximity to public services, leads to even more troubling conclusions. There is no doubt that these areas of the city should be prioritised in policies designed and implemented by public authorities with the participation of the local community in order to put the 15-minute idea into action. However, it should be noted that the majority of the deficit areas are sparsely populated, single-family houses. Despite being incorporated into the city several decades ago, they retain a quasi-rural character. This is especially true in the eastern part of Nowa Huta, east of the steelworks area, where the most extensive deficit areas (no 3 and 4) were discovered, inhabited by about 10,000 people. (1.3% of the city population). Moreover, those are the most remote areas of the city, even from the secondary service centre in the “Old Nowa Huta”, making commuting difficult. Public policy should ensure the proximity of very basic, everyday public maintained services, such as nurseries, preschools, or primary schools, in these areas. This part of the city is designated as the “Nowa Huta of the Future” strategic project in Krakow’s planning documents [69], combining new housing, modern industrial and business sites, and extensive recreational facilities. This can be viewed as an opportunity to create a sustainable, mixed-use district, but the remote location in a semi-rural area, lacking proximity to basic services, should call into question the project’s social, environmental, and financial viability, as well as the cost of constructing public services facilities in these areas.
The above findings regarding the proximity of public services in Krakow allow us to conclude that at present, the city meets the criteria of 15 min only to a limited extent. This statement is justified by the view often formulated in the literature, according to which the geographical proximity of facilities where the needs of residents are met is measured by the shortest walking or cycling time from the place of residence to the place where the service is provided, is the essential attribute of a 15-minute city.
Geographical proximity plays a significant role in the development and popularity of 15-minute cities. Modern solutions significantly reduce space resistance and improve the quality and efficiency of units located within such a structure. Most importantly, no compensation is involved in the case of all the benefits listed [70]. Local spatial policy is critical for the organisation of public spaces. Preliminary assessments of an already planned investment in terms of the size of the externalities generated can be made using the available planning documentation (local law), and negative externalities can be limited by maximising efficiency, which includes adaptations to local conditions and the needs of current and future users. Development activities tend to have a negative impact on the environment; moreover, the reorganisation of green spatial structures (by filling them with technical infrastructure, housing projects, etc.) invariably results in negative environmental or ecological externalities in the long run.
Studying externalities in a 15-minute city and in other urbanised areas is a difficult task. First, the entity causing an externality must be identified, followed by the entity or group of entities subject to this externality in an equally difficult process. It should also be noted that man-made spaces are dominated by external effects, which are perceived with varying degrees of delay. Sometimes the delay is so long that identifying the entity causing the externality is impossible because its activities in a given space have ceased.
The lack of (or its only limited presence) proximity makes it extremely difficult to meet another of the conditions of a 15-minute city, which is ubiquity. According to C. Moreno, ubiquity as a feature of a 15-minute city is a guarantee of equal access to services, infrastructure, employment, and education for all dwellers, regardless of their age, health, or financial situation [1,23]. In other words, the capacity to meet the needs of residents locally should apply to the entire or at least most of the inhabited area of the city, not only to a limited number of neighbourhoods. This is not the case in Krakow at present, as clearly shown by the findings illustrated in Figure 3. In the case under consideration, the territorial range of a 15-minute city is limited only to traditional compact downtown developments with a multifunctional character.
What are, then, the main reasons why Krakow only partly meets the requirements of a 15-minute city? Figure 5 reveals a strong correlation between different types of urban fabric and the proximity of basic services. The obvious conclusion is that the optimal proximity area almost entirely covers the multifunctional, dense, diverse, and walkable downtown. The main concern of the central area is thus population shrinkage, particularly in the city core, which reduces the number of inhabitants within walking distance of the city’s amenities. Between 2005 and 2021, the Stare Miasto district, covering most of the core, has shrunk by 38%. The neighbouring districts of Krowodrza and Grzegórzki by 18% and 8%, respectively [71]. The decrease in the number of inhabitants can be associated primarily with the excessive development of the tourist function (over-tourism), gentrification, and the increase in the cost of living in the city centre, as well as the inconvenience resulting from overcrowding [71,72].
The old part of Nowa Huta, the “ideal city”, is the second area of optimal proximity. This may come as no surprise, as its 15-minute city area closely resembles the neighbourhood unit concept on which this district was originally based. Most big socialist-modernist estates, which went underappreciated after 1990, turned out to be fairly well equipped with a variety of basic services, even though some still require upgrading. New residential areas built after 1989, as a rule, fail to meet the principles of 15-minute cities.
The outside of Krakow’s historic centre, as well as the outside of the “Old Nowa Huta”, sees inadequately planned, uncontrolled, and uncoordinated spatial development, which does not allow for land-use diversification and/or is not functionally related to the surrounding areas. Moreover, it appears as a low-density ‘ribbon’ of spatially unrelated or fully isolated buildings scattered in various combinations. The city also faces problems with maintaining the internal cohesion of urbanised areas caused by many years of neglect in planning studies (city authorities have had huge administrative difficulties in implementing an effective spatial development policy).
Krakow faces a two-pronged problem related to the complexity of spatial management, namely the intensification of development (usually homogeneous buildings) and forms of development consistent with urban sprawl. As a result, the spread of buildings within Krakow severely limits its capacity to achieve the 15-minute city status (the distance from the place of residence to services and travel time increase, and there are significant deficiencies in the field of communication and technical infrastructure). It is thus necessary to perceptibly improve spatial development coordination. This goal appears to be achievable, especially since the formal and legal conditions specified in local law have significantly improved in the last three years (as of May 2022, 72.9% of Krakow’s area is covered by local plans). The fragmentation of planning documentation has an impact on the quality and effectiveness of spatial policy implementation (as many as 235 local plans have been prepared so far). Today’s spatial planning can be judged as inadequately adapted to current conditions and needs [73,74].
Today’s spatial planning can be judged as inadequately adapted to current conditions and needs. Many residents still associate owning a car with prestige and quality of life, whereas the development of linear infrastructure is viewed as a guarantee of comfortable travel around a neighbourhood. Unfortunately, it is easier, even more convenient, for the public sector to adapt to the circumstances and needs generated by the current technology- and profit-driven spatial evolution. Attempts to implement pro-ecological, innovative solutions that require sacrificing anything by space users are still not widely understood or supported.
Furthermore, technological advances have reduced transport and communication costs, making company locations less reliant on a central location. This new approach adopted by companies operating in Krakow was also based on easy access to information, which contributed to the development of suburban centres.
All these processes impede the development of the city of short distances. It remains to be hoped that appropriate measures will be taken to promote 15-minute proximity beyond the areas identified in this study.

6. Conclusions

The authors are aware of the constraints of their study. The presented research results constitute the first approximation of the analysis of Krakow’s space in light of the concept of a 15-minute city. Further research should focus on the areas where service deficits were identified (Figure 4) and should be undertaken on a local scale, taking into account the planned spatial development. Apart from proximity, the issue of accessibility in the layouts of specific housing complexes and estates should include the following aspects.
First, specific spatial barriers must be identified, which necessitates creating an inventory that goes beyond the data available in spatial databases in order to apply network analysis and verify the actual time required to reach specific service delivery locations. The next stage must include a survey of the residents of target districts to identify local deficits in service provision. Involving residents in discussions about the local scale of future intervention may reveal, on the one hand, additional deficits and, on the other, certain limitations.

Author Contributions

Conceptualisation, P.K. and A.N.; methodology, A.N. and P.H.; software, P.H.; validation, P.K. and A.H.; formal analysis, P.K.; investigation, P.H. and J.S.; resources, P.H. and J.S.; data curation, P.K. and A.H.; writing—original draft preparation, P.H. and J.S.; writing—review and editing, A.N. and A.H.; visualisation, P.H; supervision, A.N; project administration, P.K.; funding acquisition, P.K. and A.N. All authors have read and agreed to the published version of the manuscript.

Funding

This research was funded 50% by Cracow University of Economics, Program “POTENCJAŁ”, contract no. 28/GGR/2021/POT and 50% by the Minister of Education and Science within the “Regional Initiative of Excellence” Programme for 2019–2022, project no.: 021/RID/2018/19, total financing: 11,897,131.40 PLN.

Institutional Review Board Statement

Not applicable.

Informed Consent Statement

Not applicable.

Data Availability Statement

Data available in a publicly accessible repository that does not issue DOIs: publicly available datasets were analysed in this study. This data can be found here: https://msip.krakow.pl (accessed on 31 July 2021).; data from openstreetmap.org acessed via http://download.geofabrik.de/osm/ (accessed on 7 May 2021); www.bip.krakow.pl/?sub_dok_id=644 (accessed on 3 August 2021); www.krakow.pl/kultura/35702,artykul,katalog_instytucji.html (accessed on 13 August 2021); www.krakow.pl/instcbi/247778,,2589,3,wyszukiwarka.html (accessed on 18 August 2021); https://placowki.poczta-polska.pl (accessed on 5 August 2021). 3rd Party Data: restrictions apply to the availability of these data, which were obtained from the Office of the City of Krakow and should not be shared due to legal and privacy issues. The data presented in this study are available in Appendix A.

Conflicts of Interest

The authors declare no conflict of interest.

Appendix A

Background map data source: OpenStreetMap/openstreetmap.org, accessed on 7 May 2021.
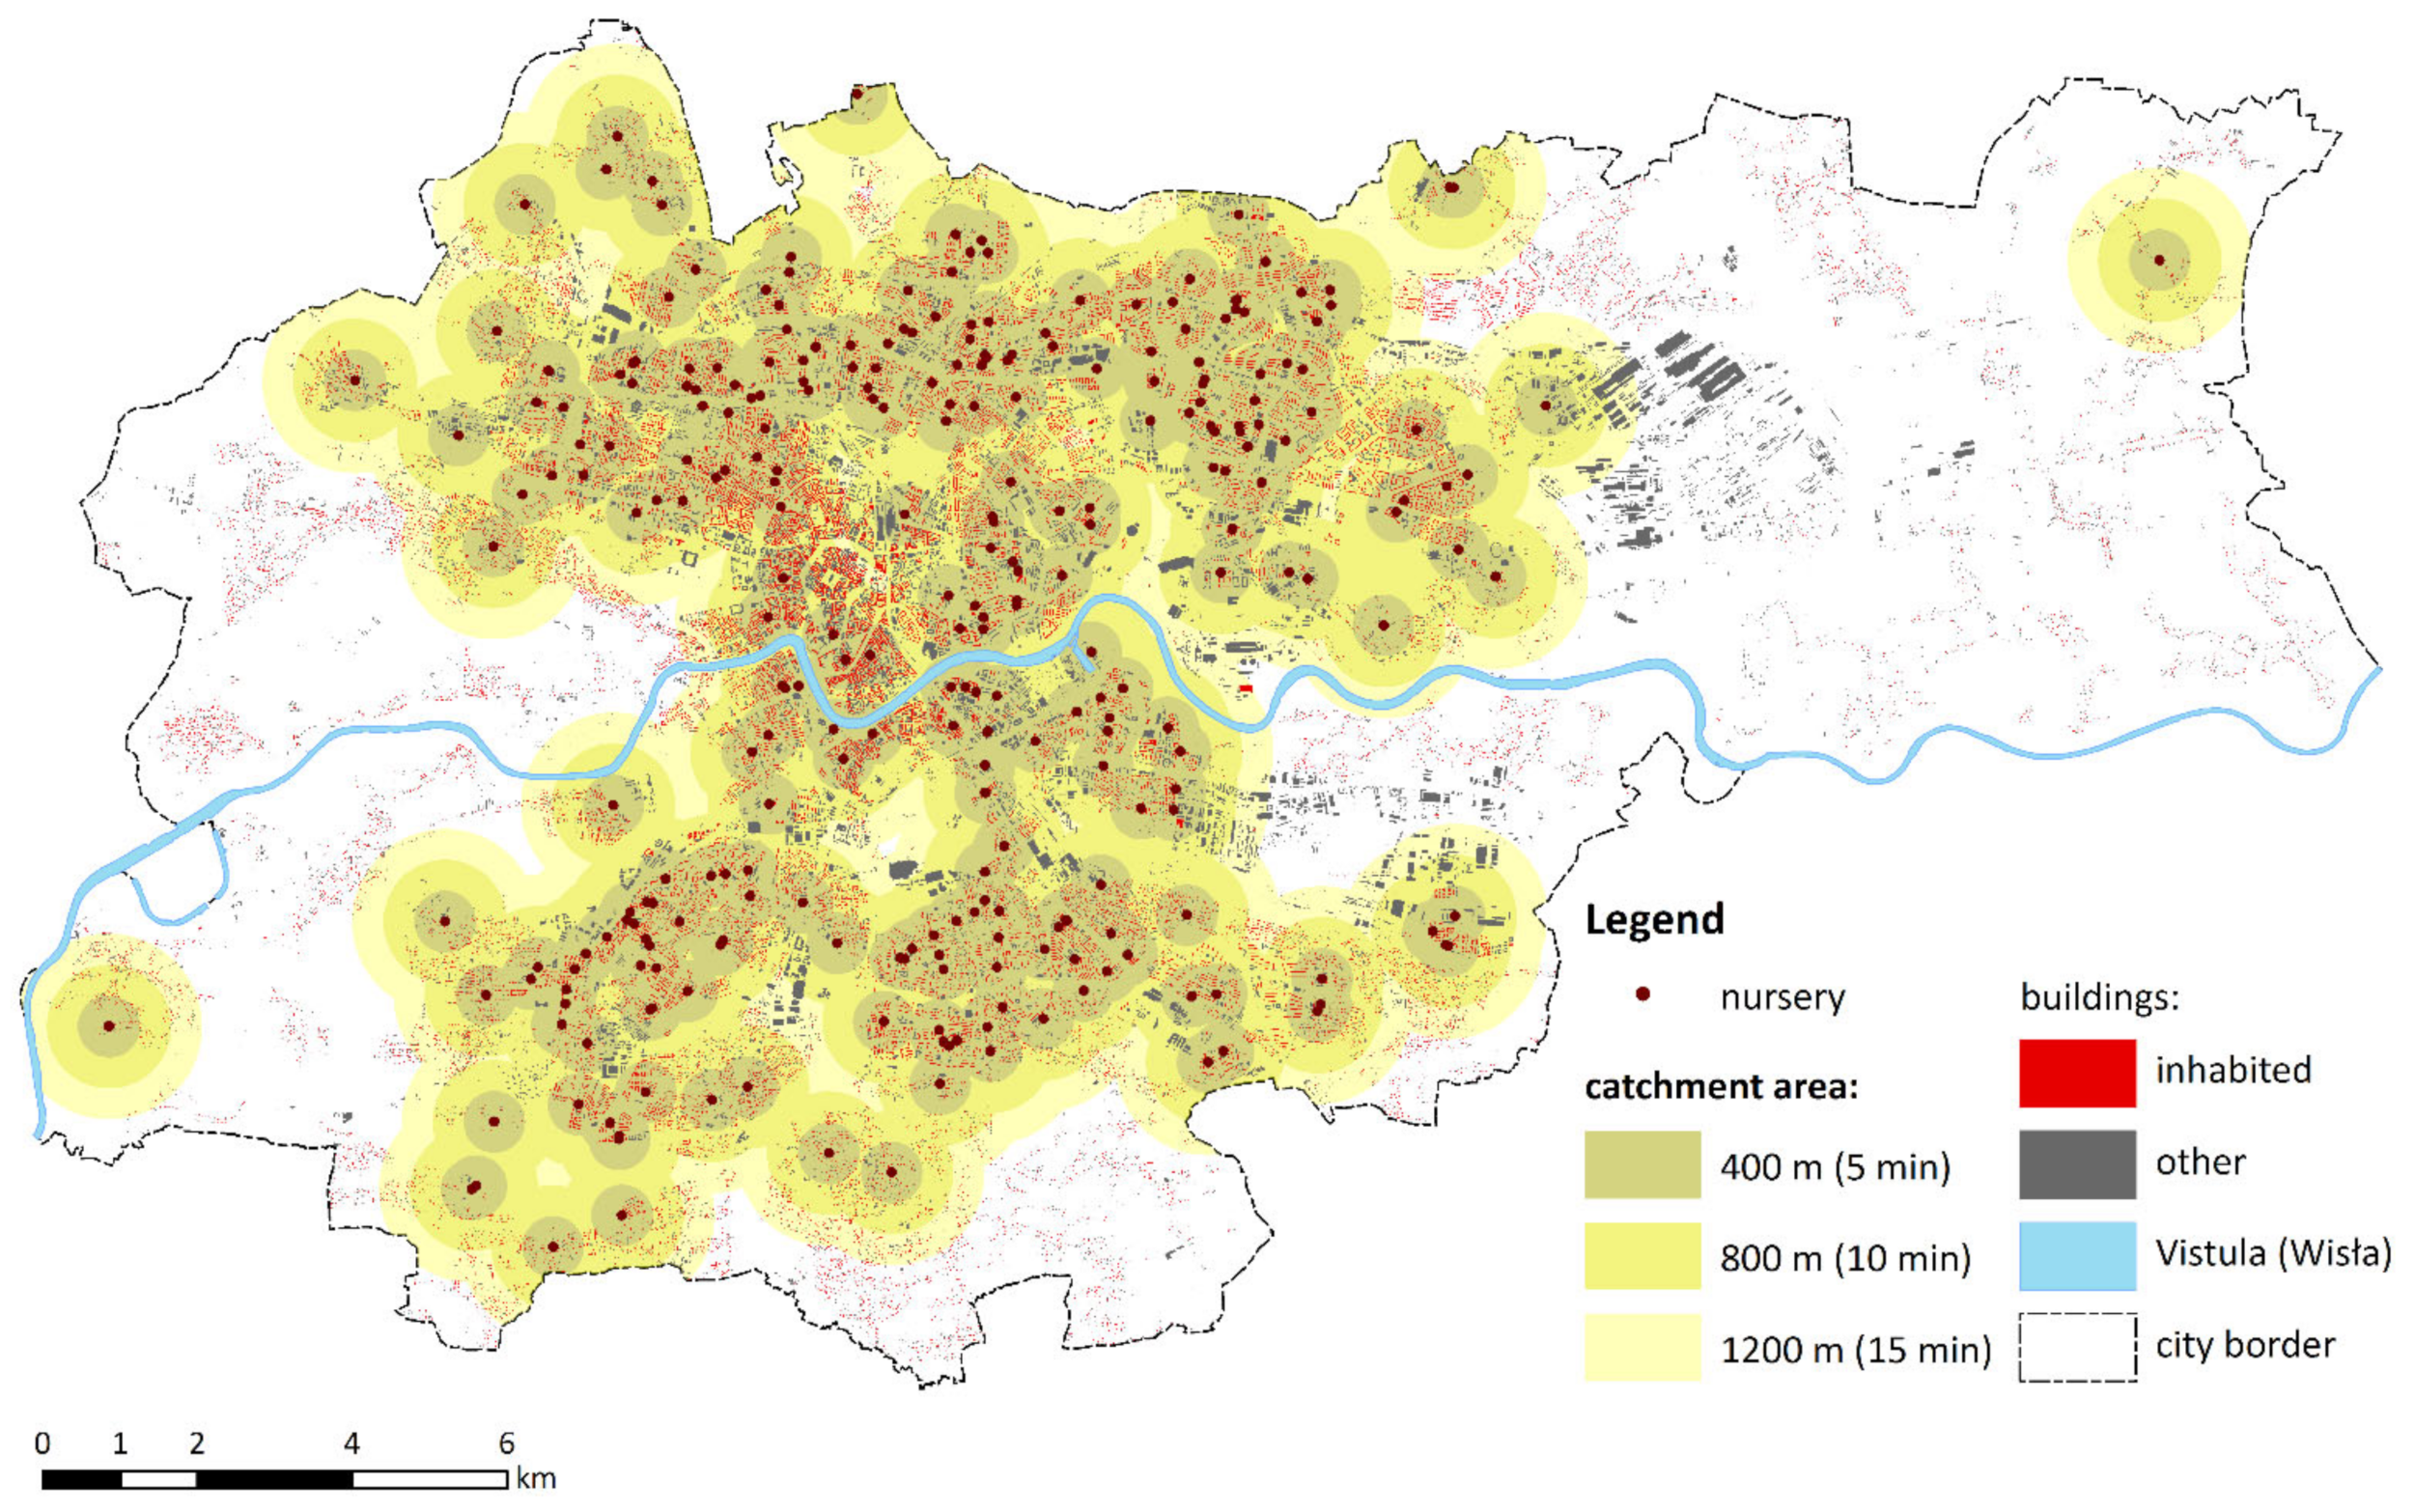
Figure A1. Nurseries.
Sustainability 14 07103 g0a1
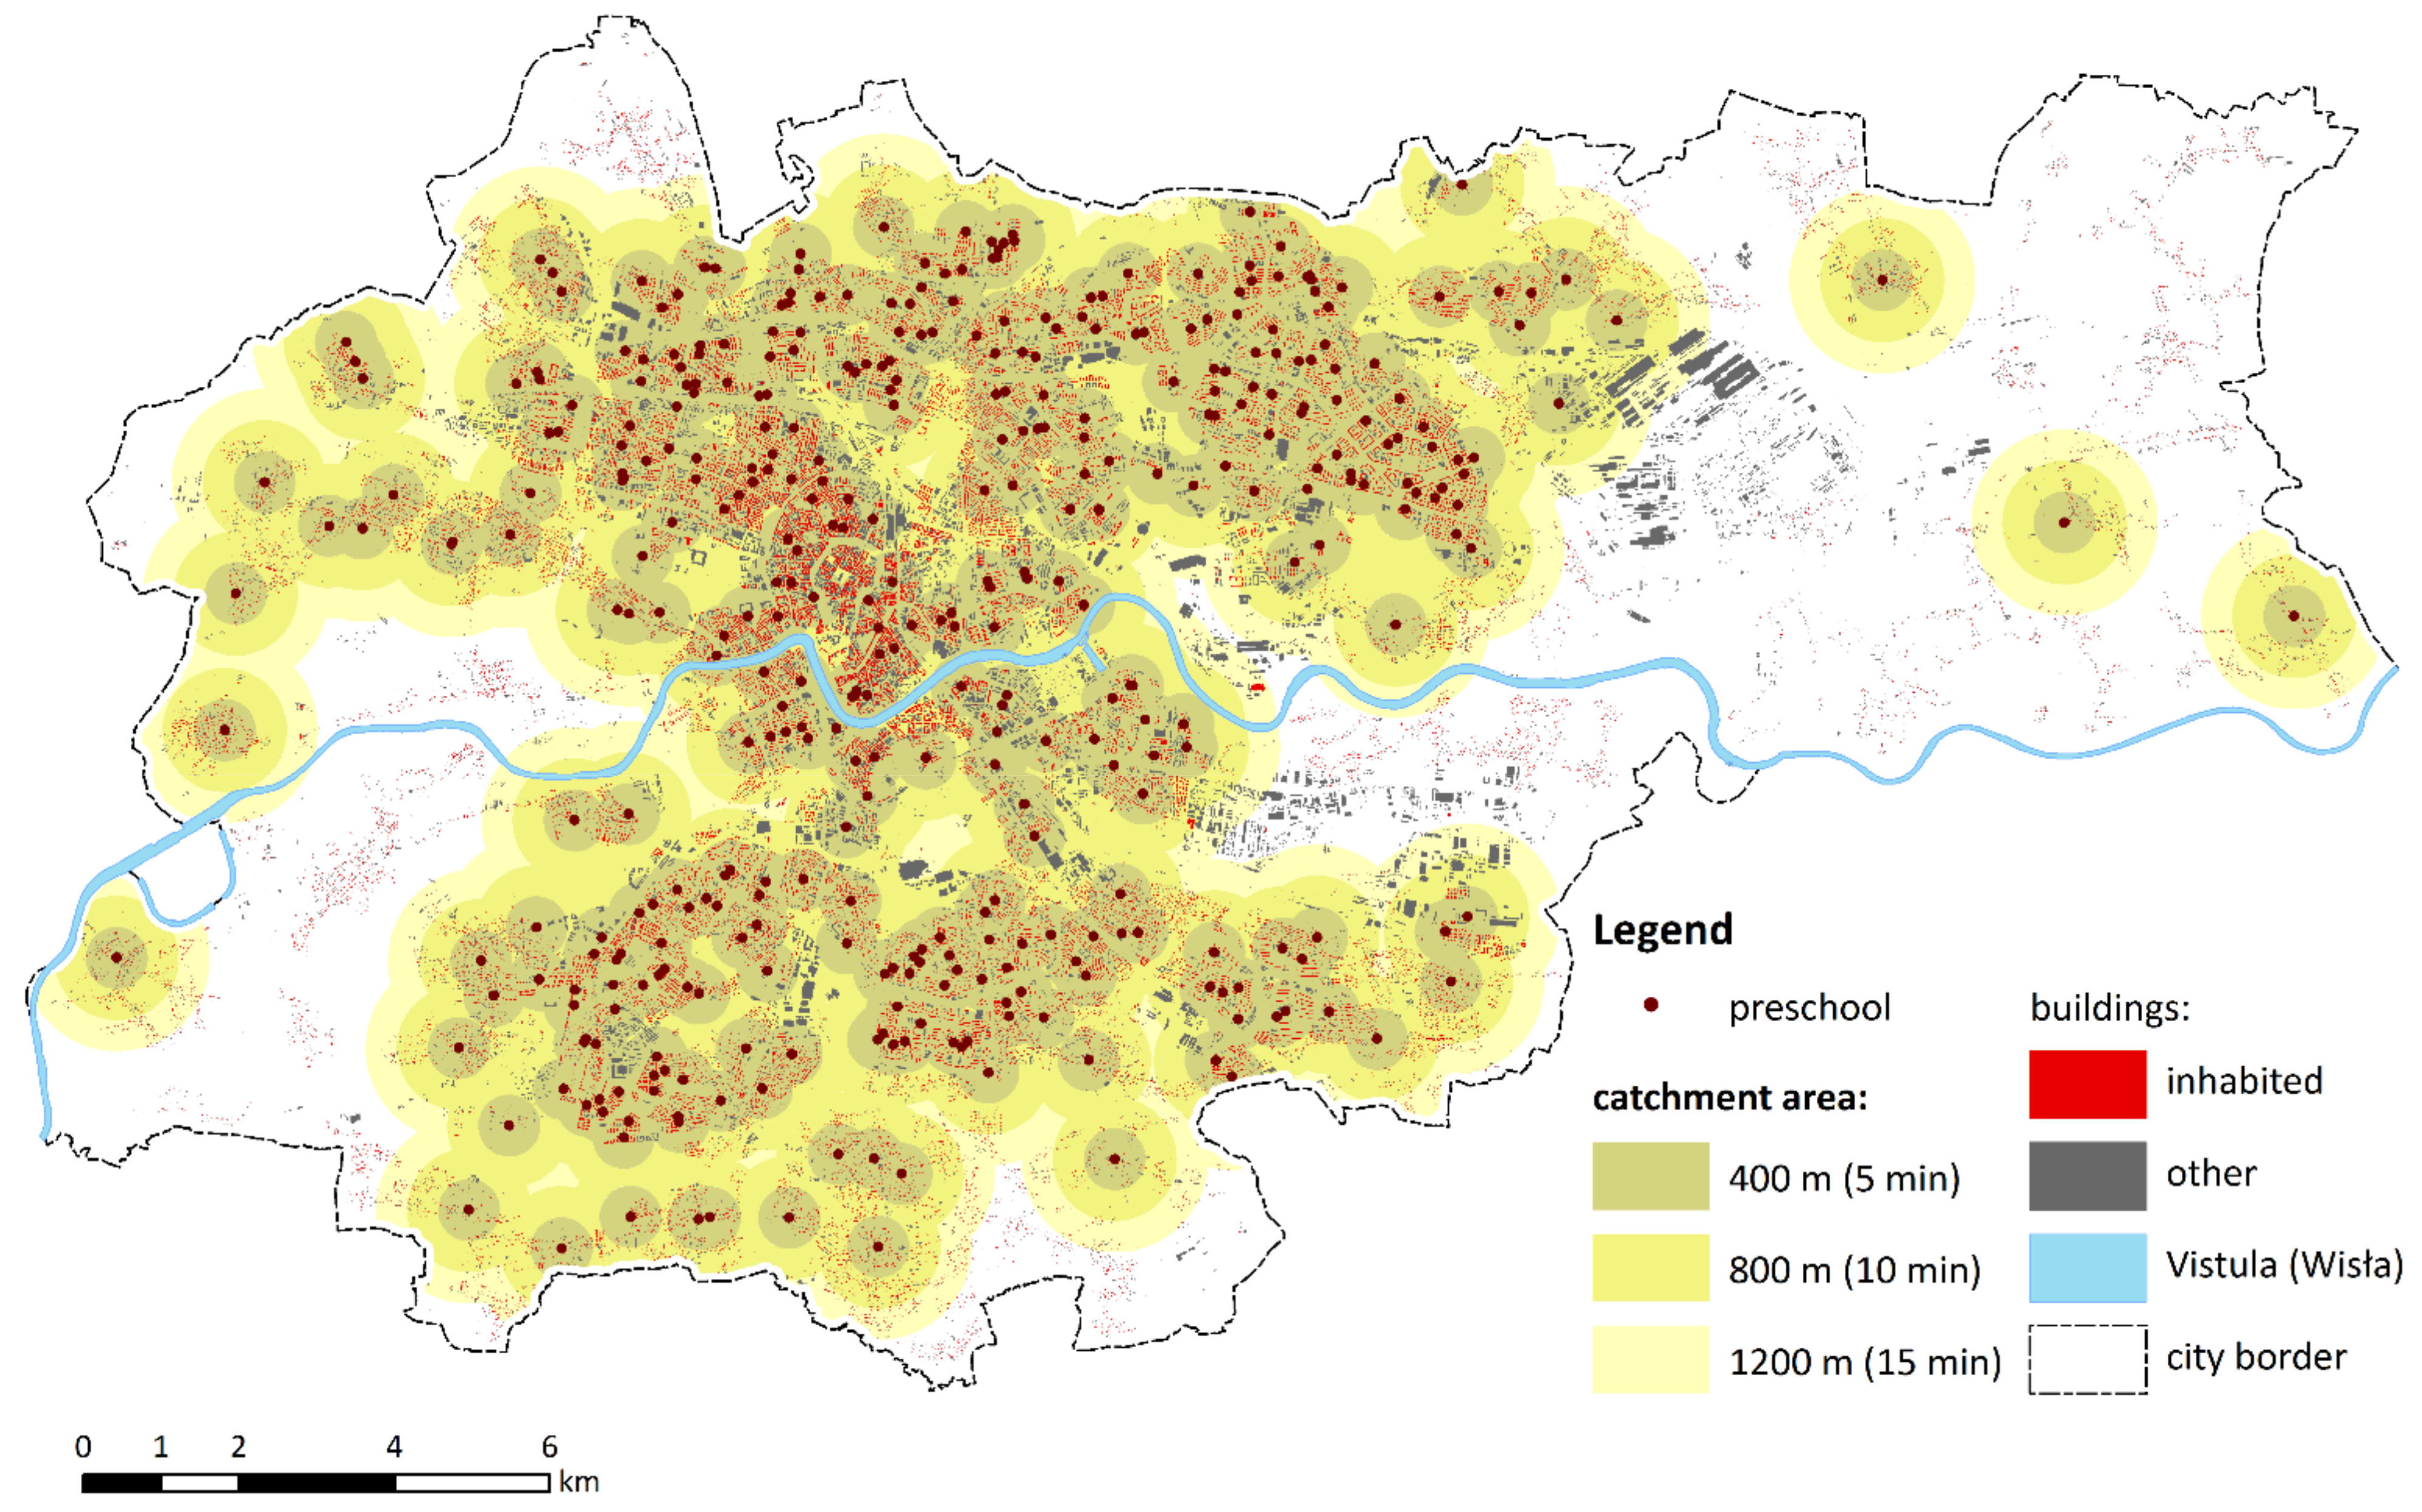
Figure A2. Preschools.
Sustainability 14 07103 g0a2
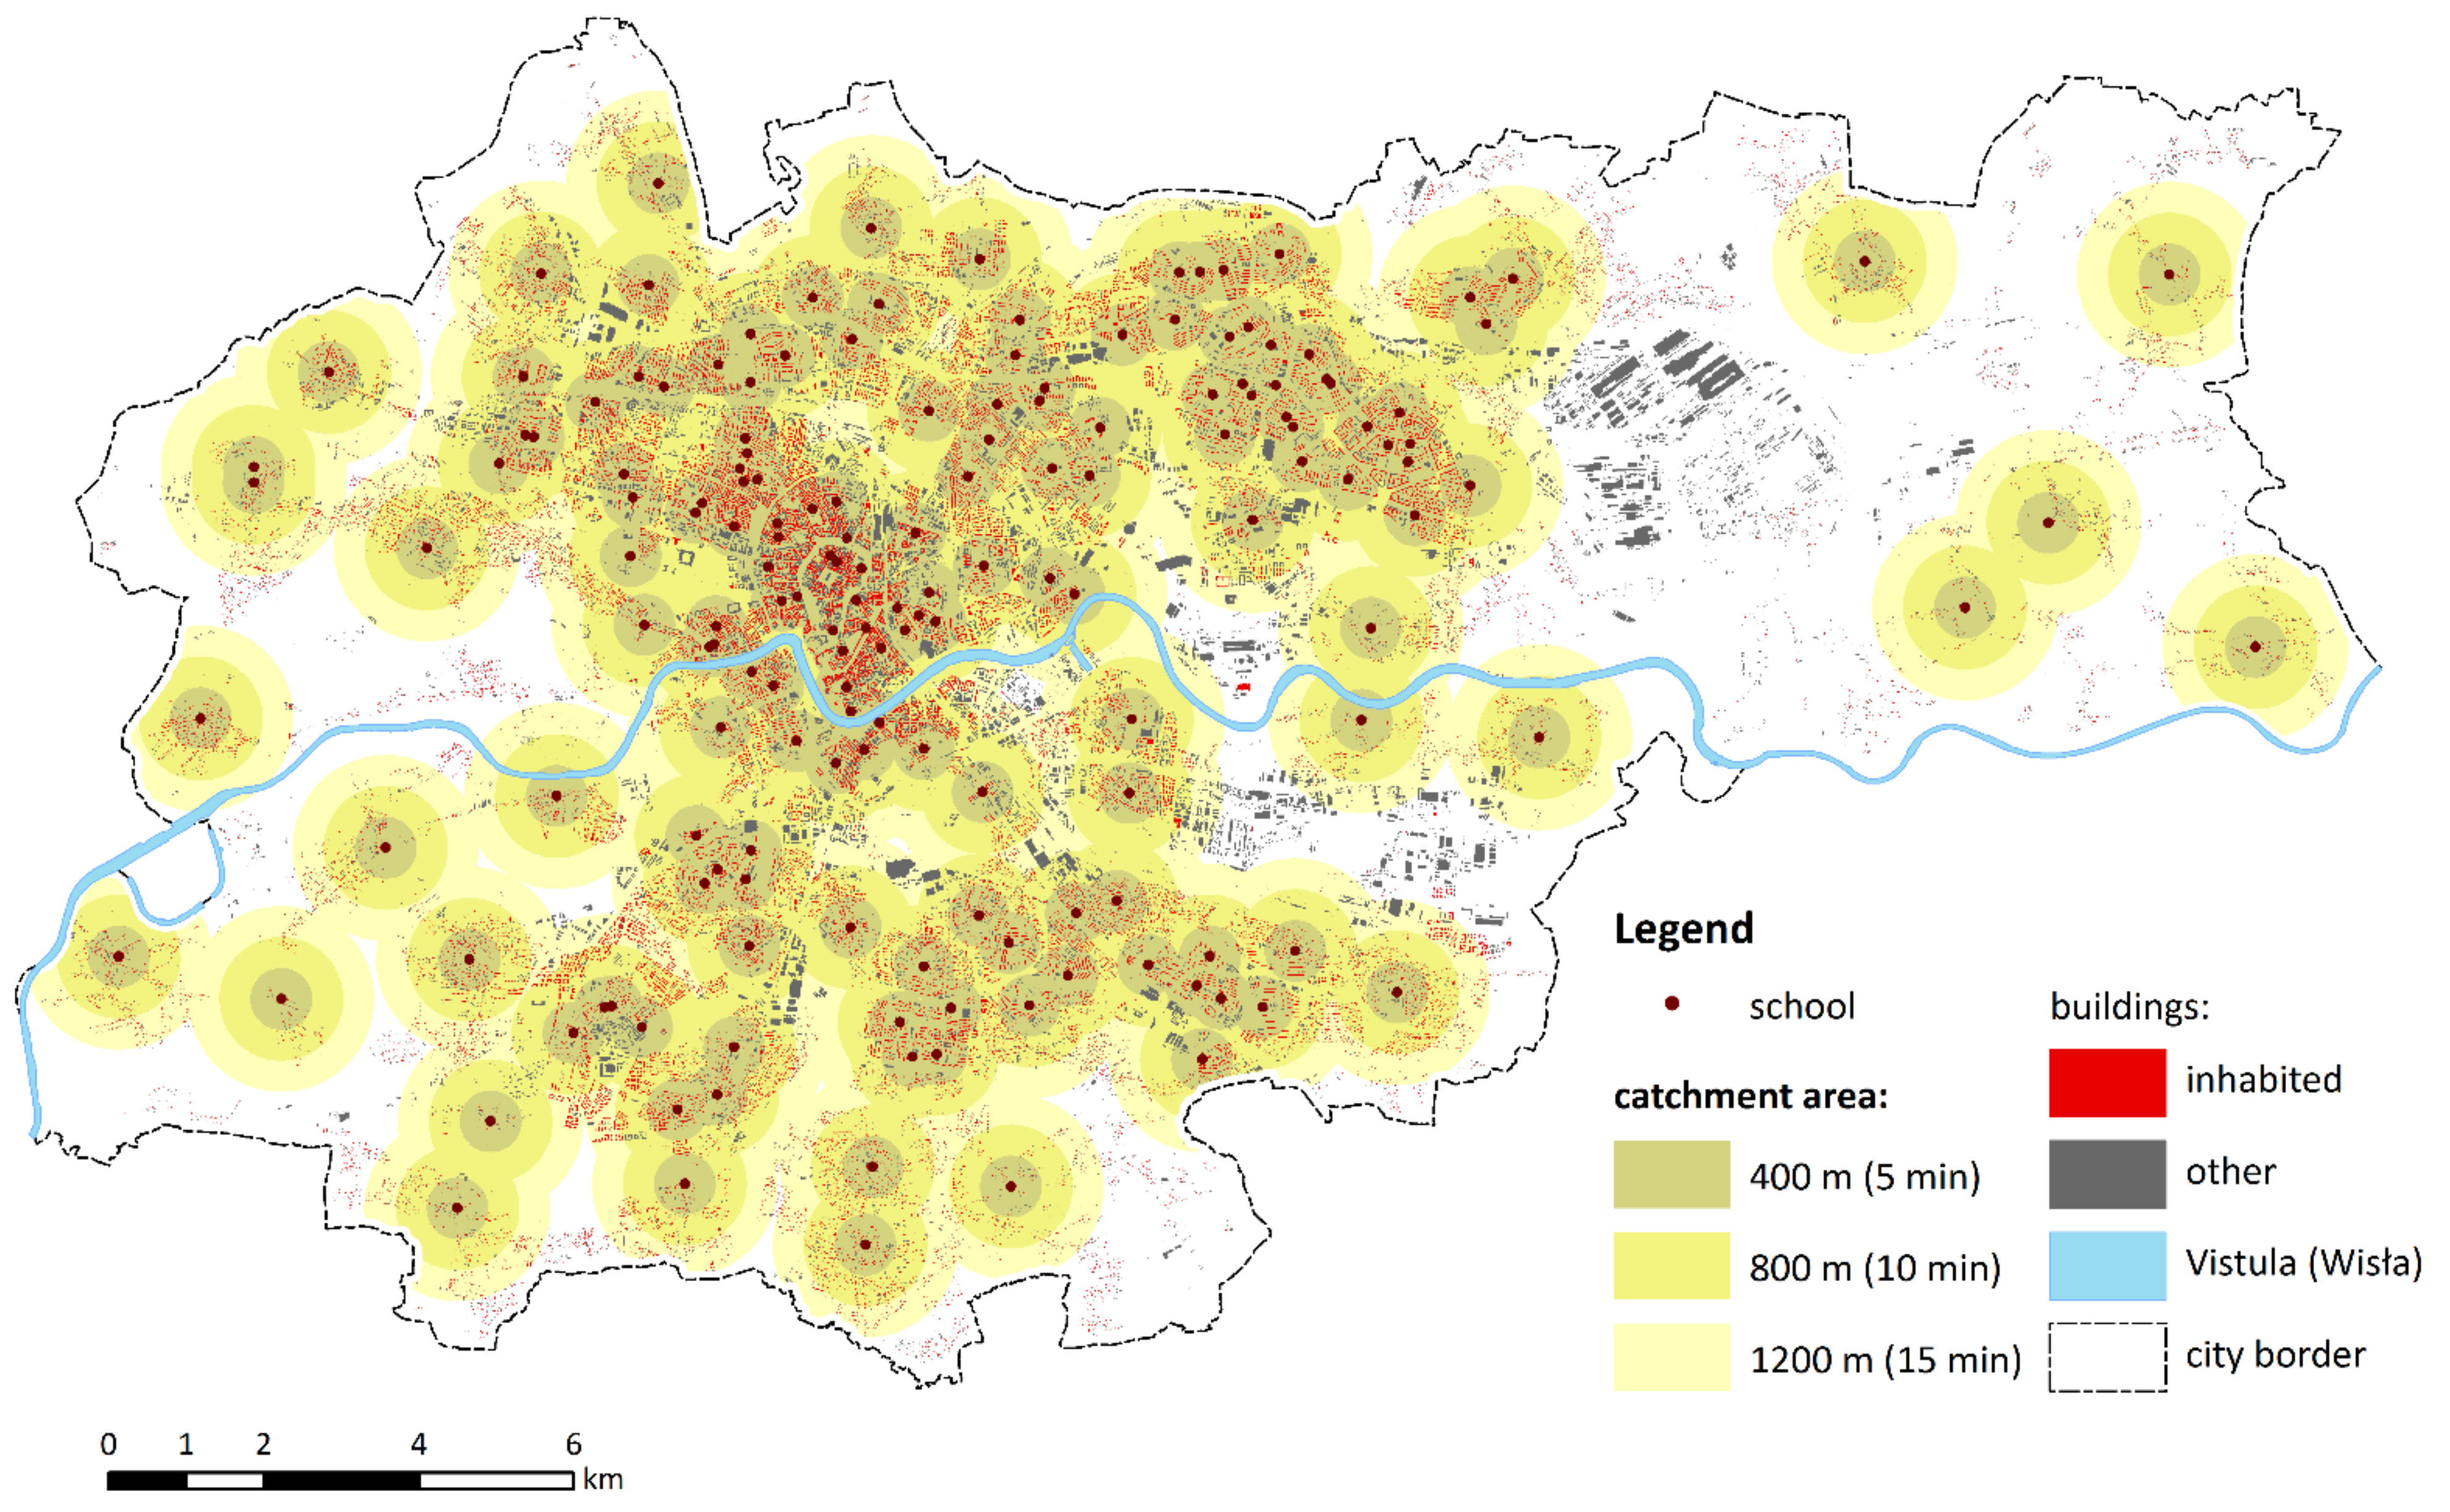
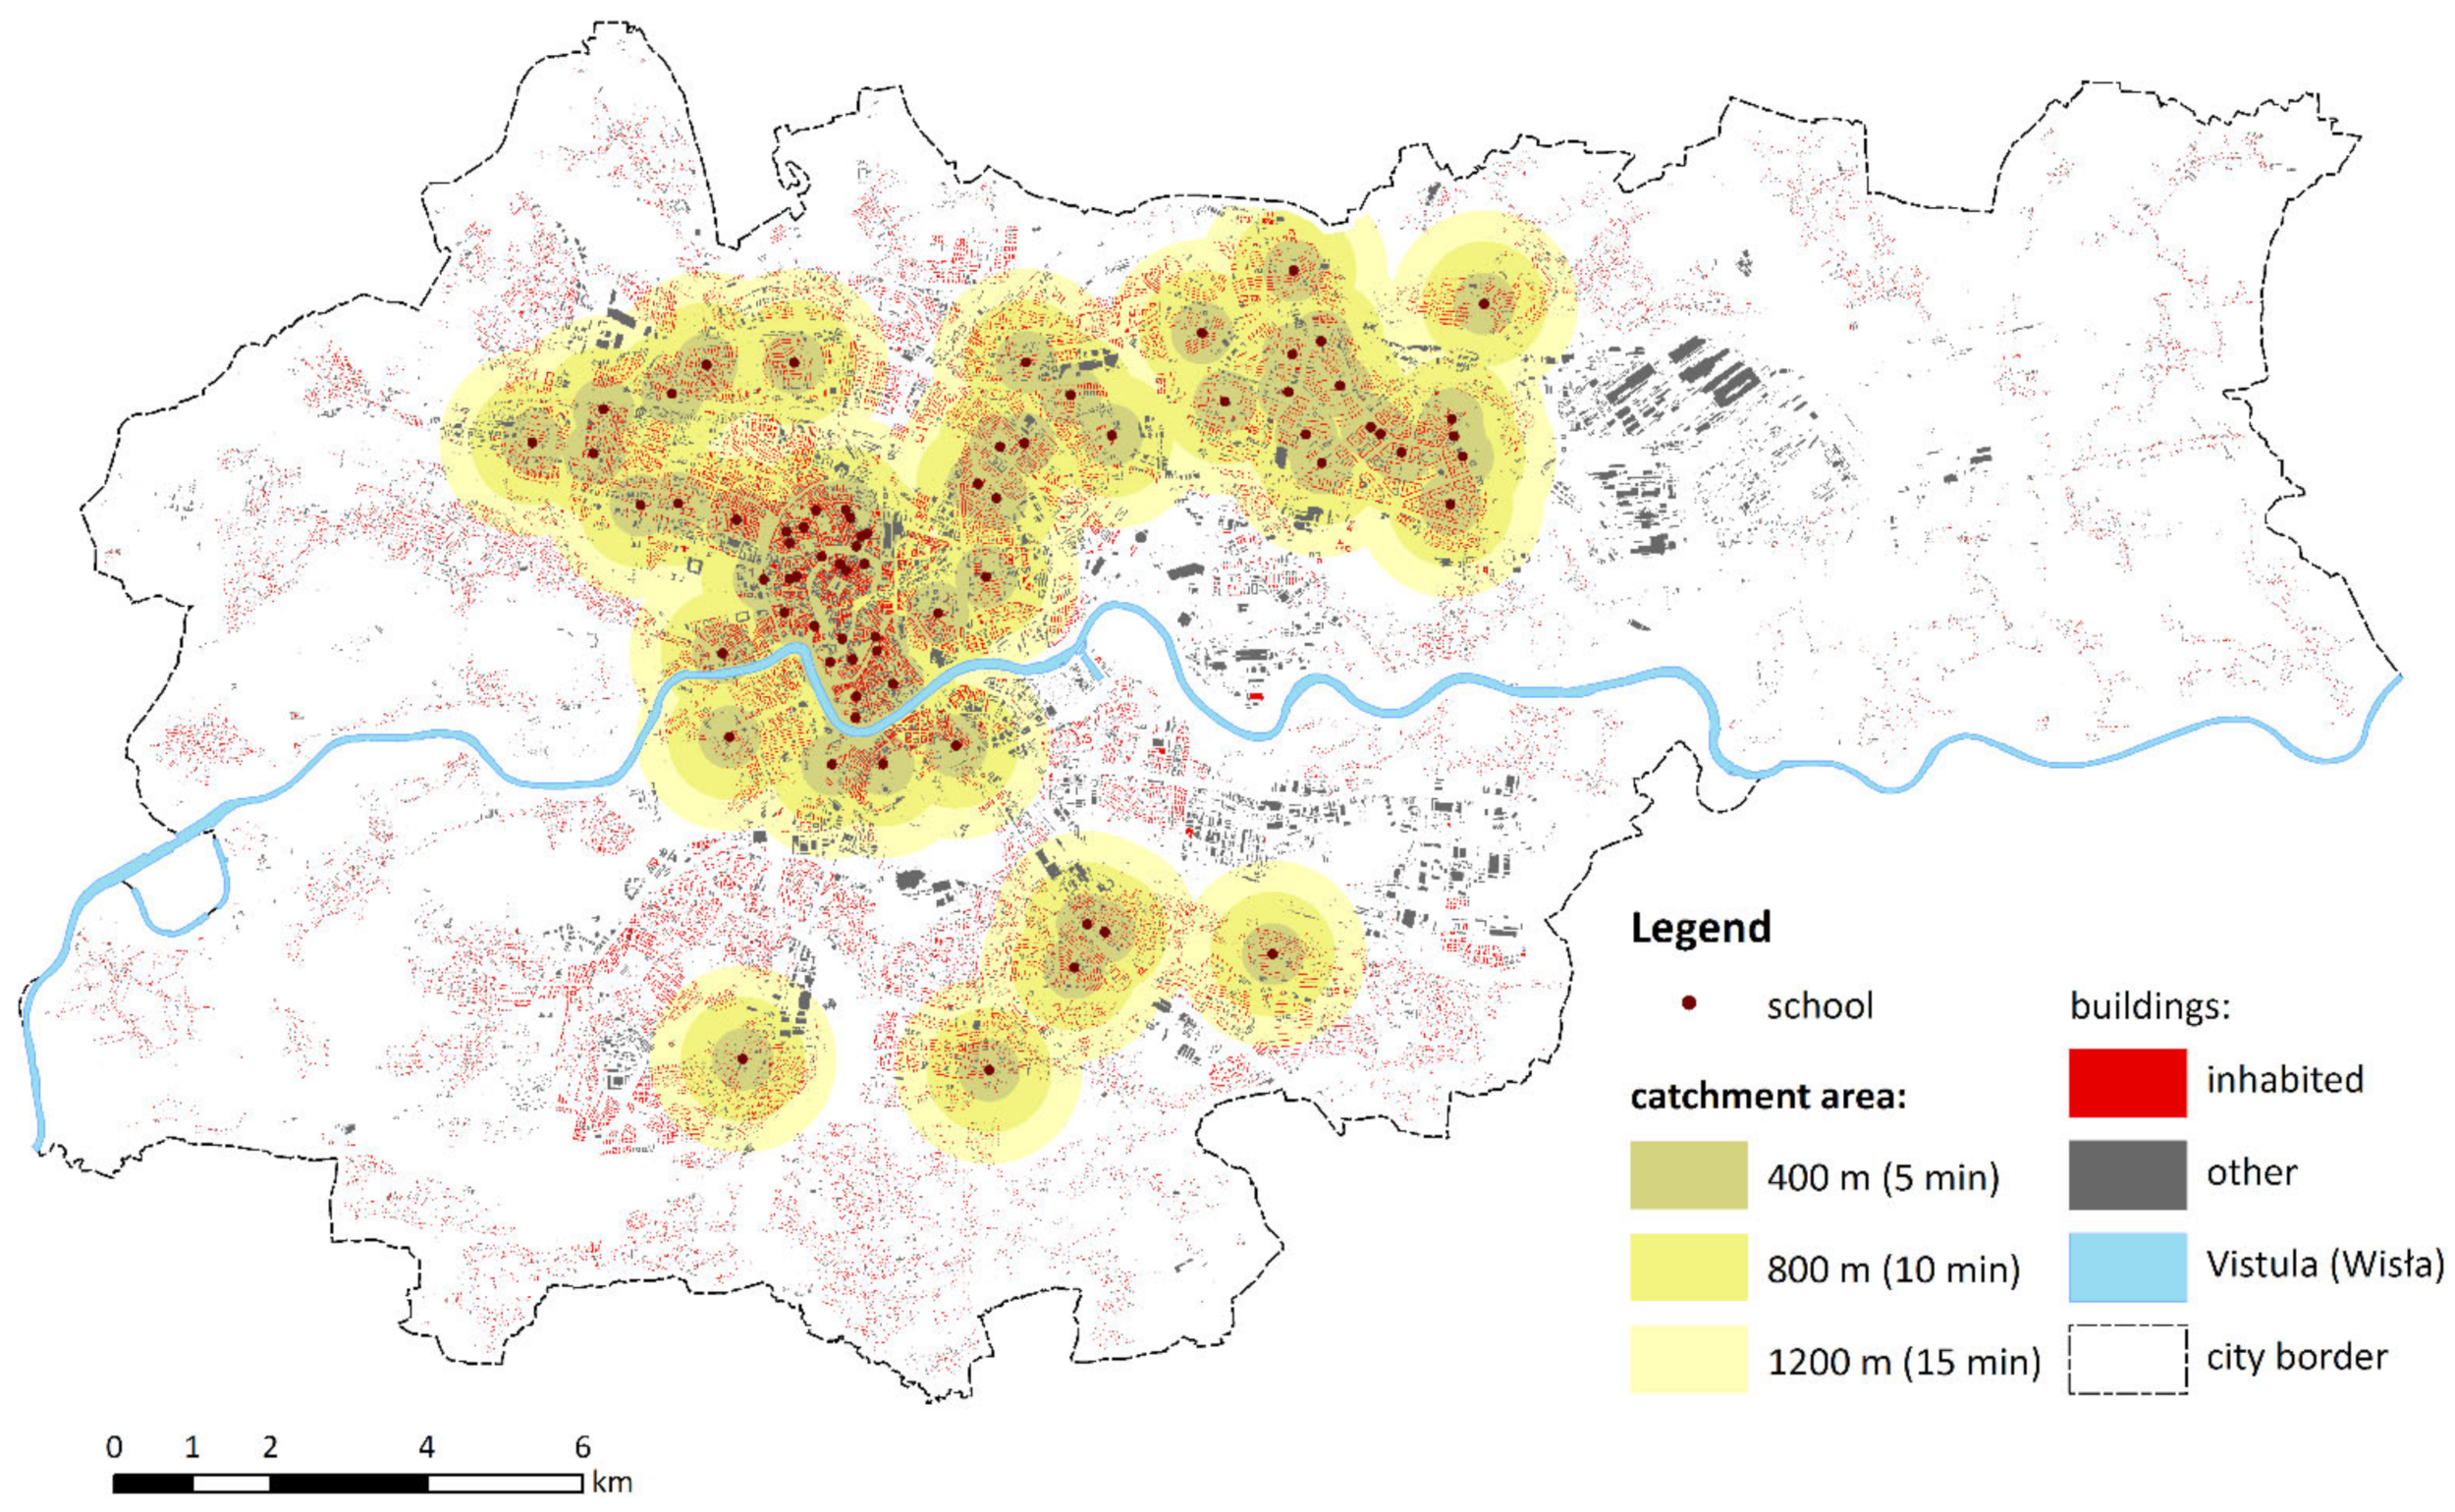
Figure A3. Primary schools.
Sustainability 14 07103 g0a3
Figure A4. Secondary schools.
Sustainability 14 07103 g0a4
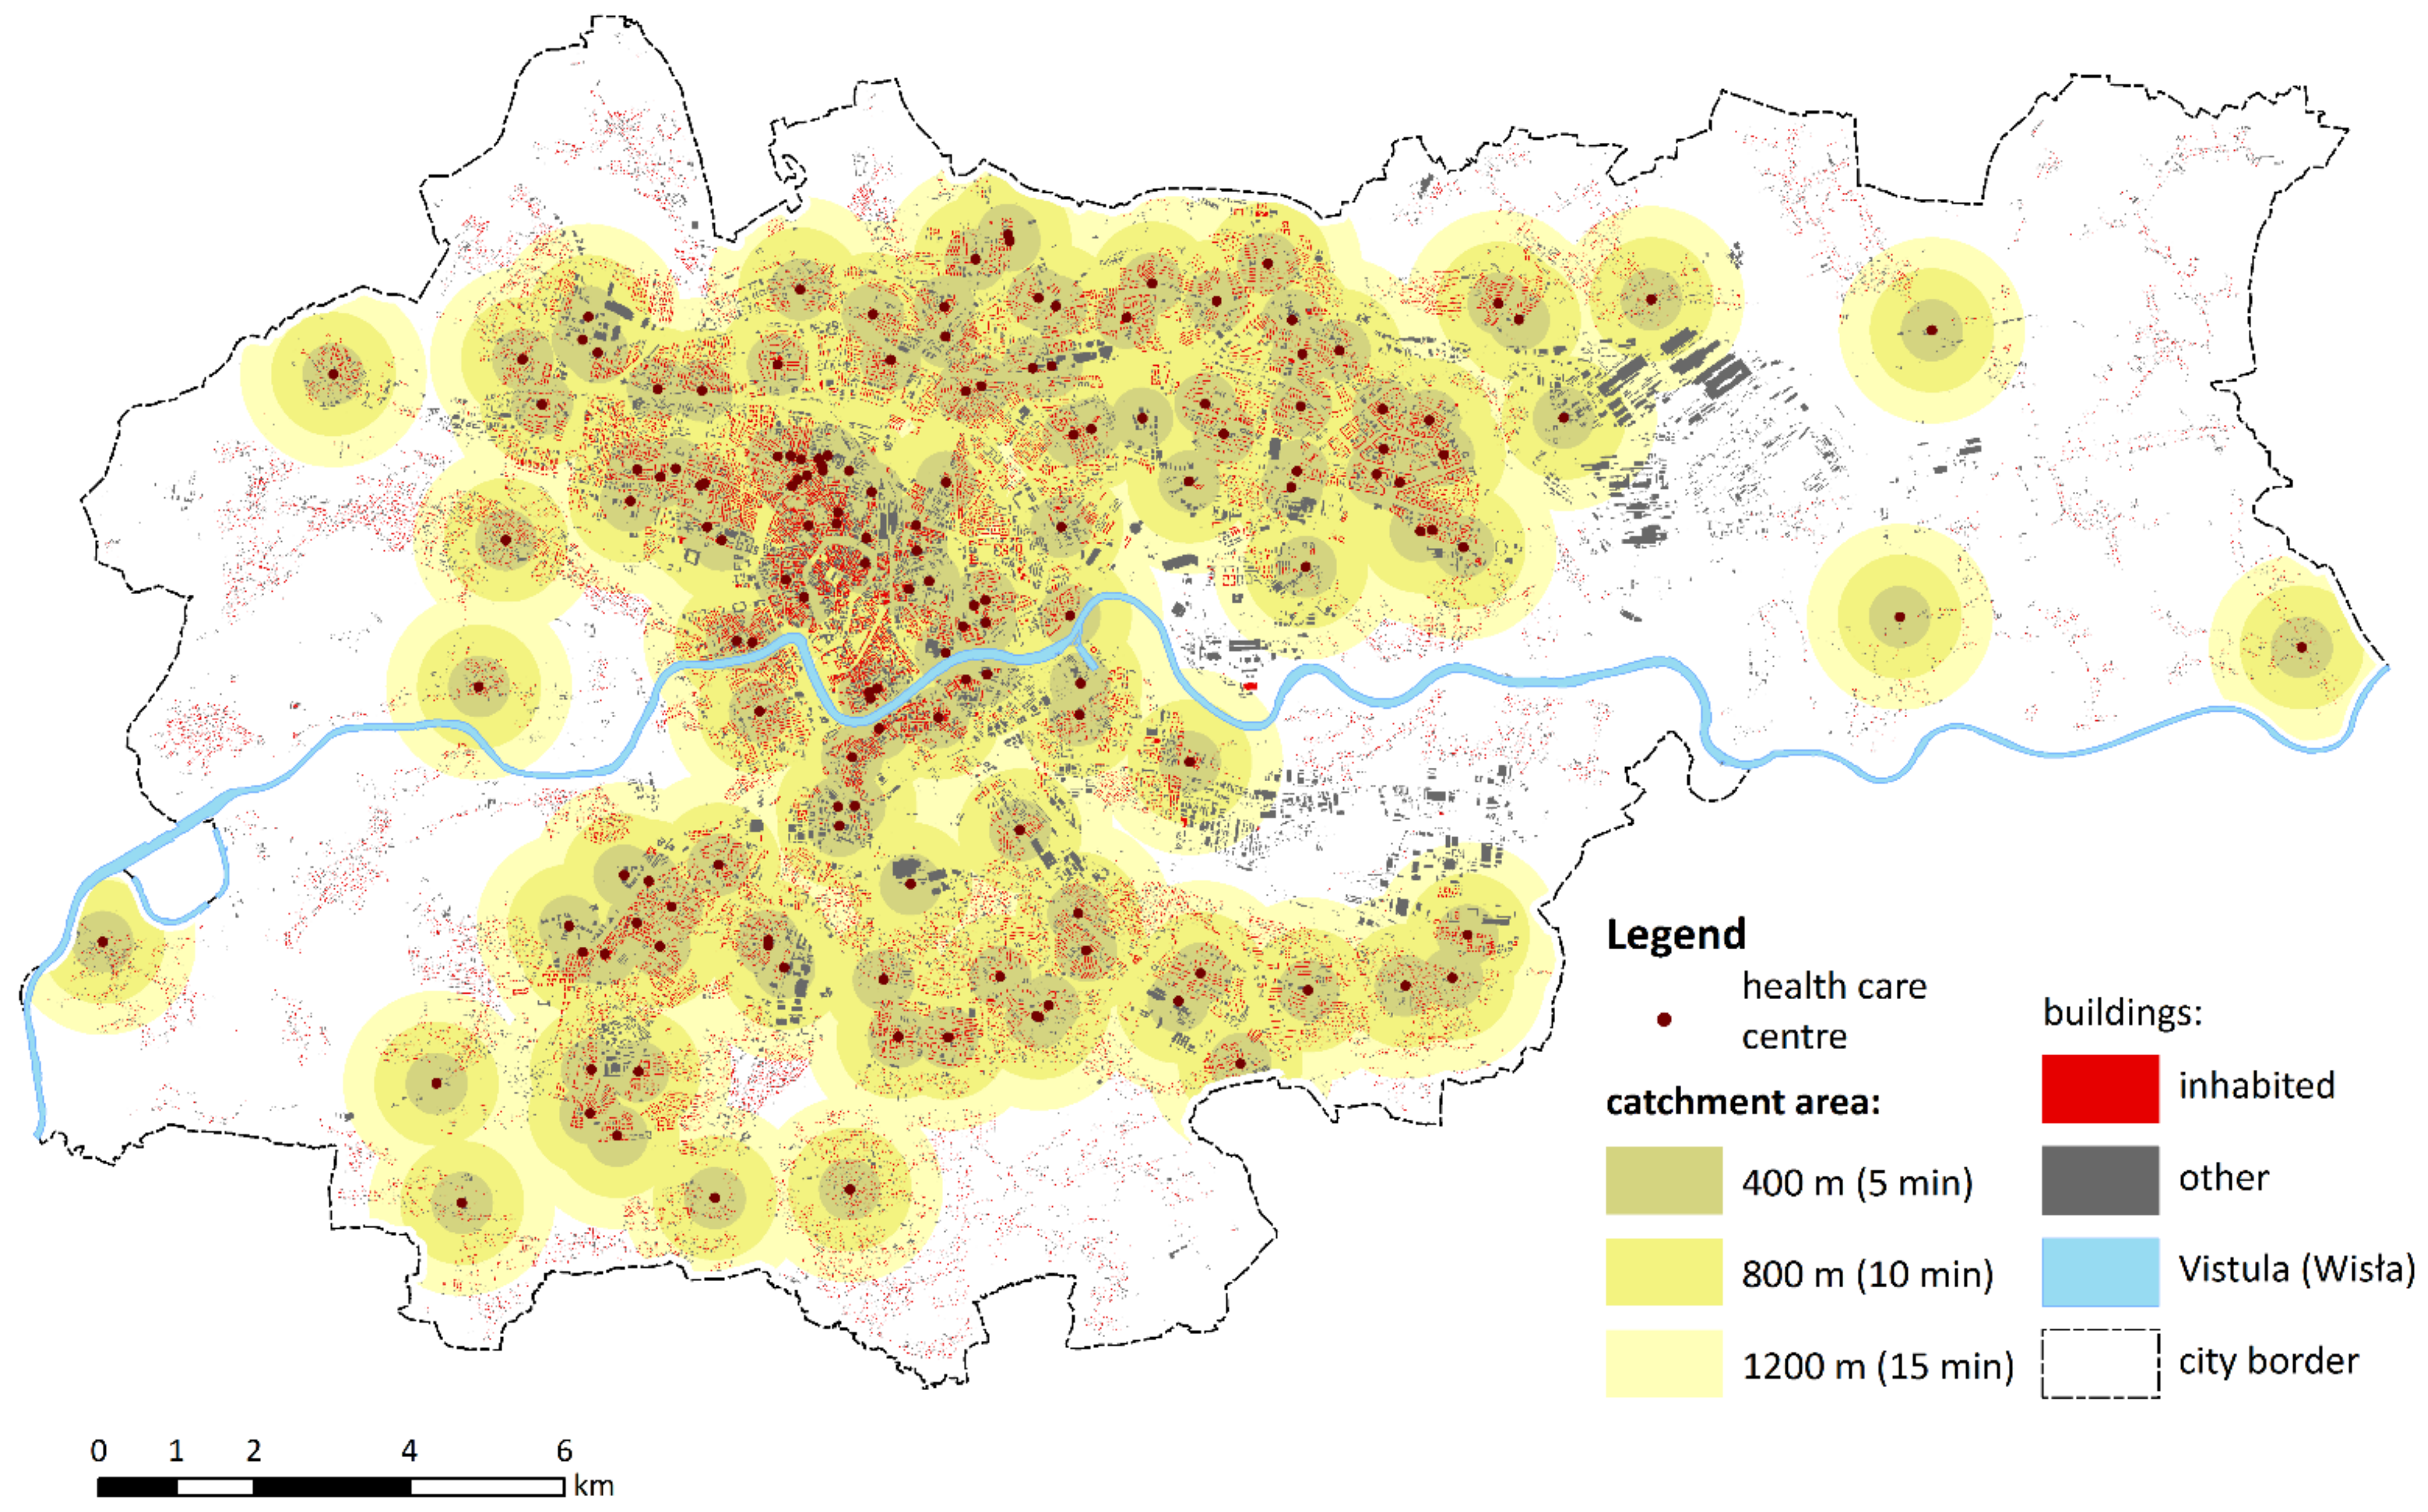
Figure A5. Primary health care centres.
Sustainability 14 07103 g0a5
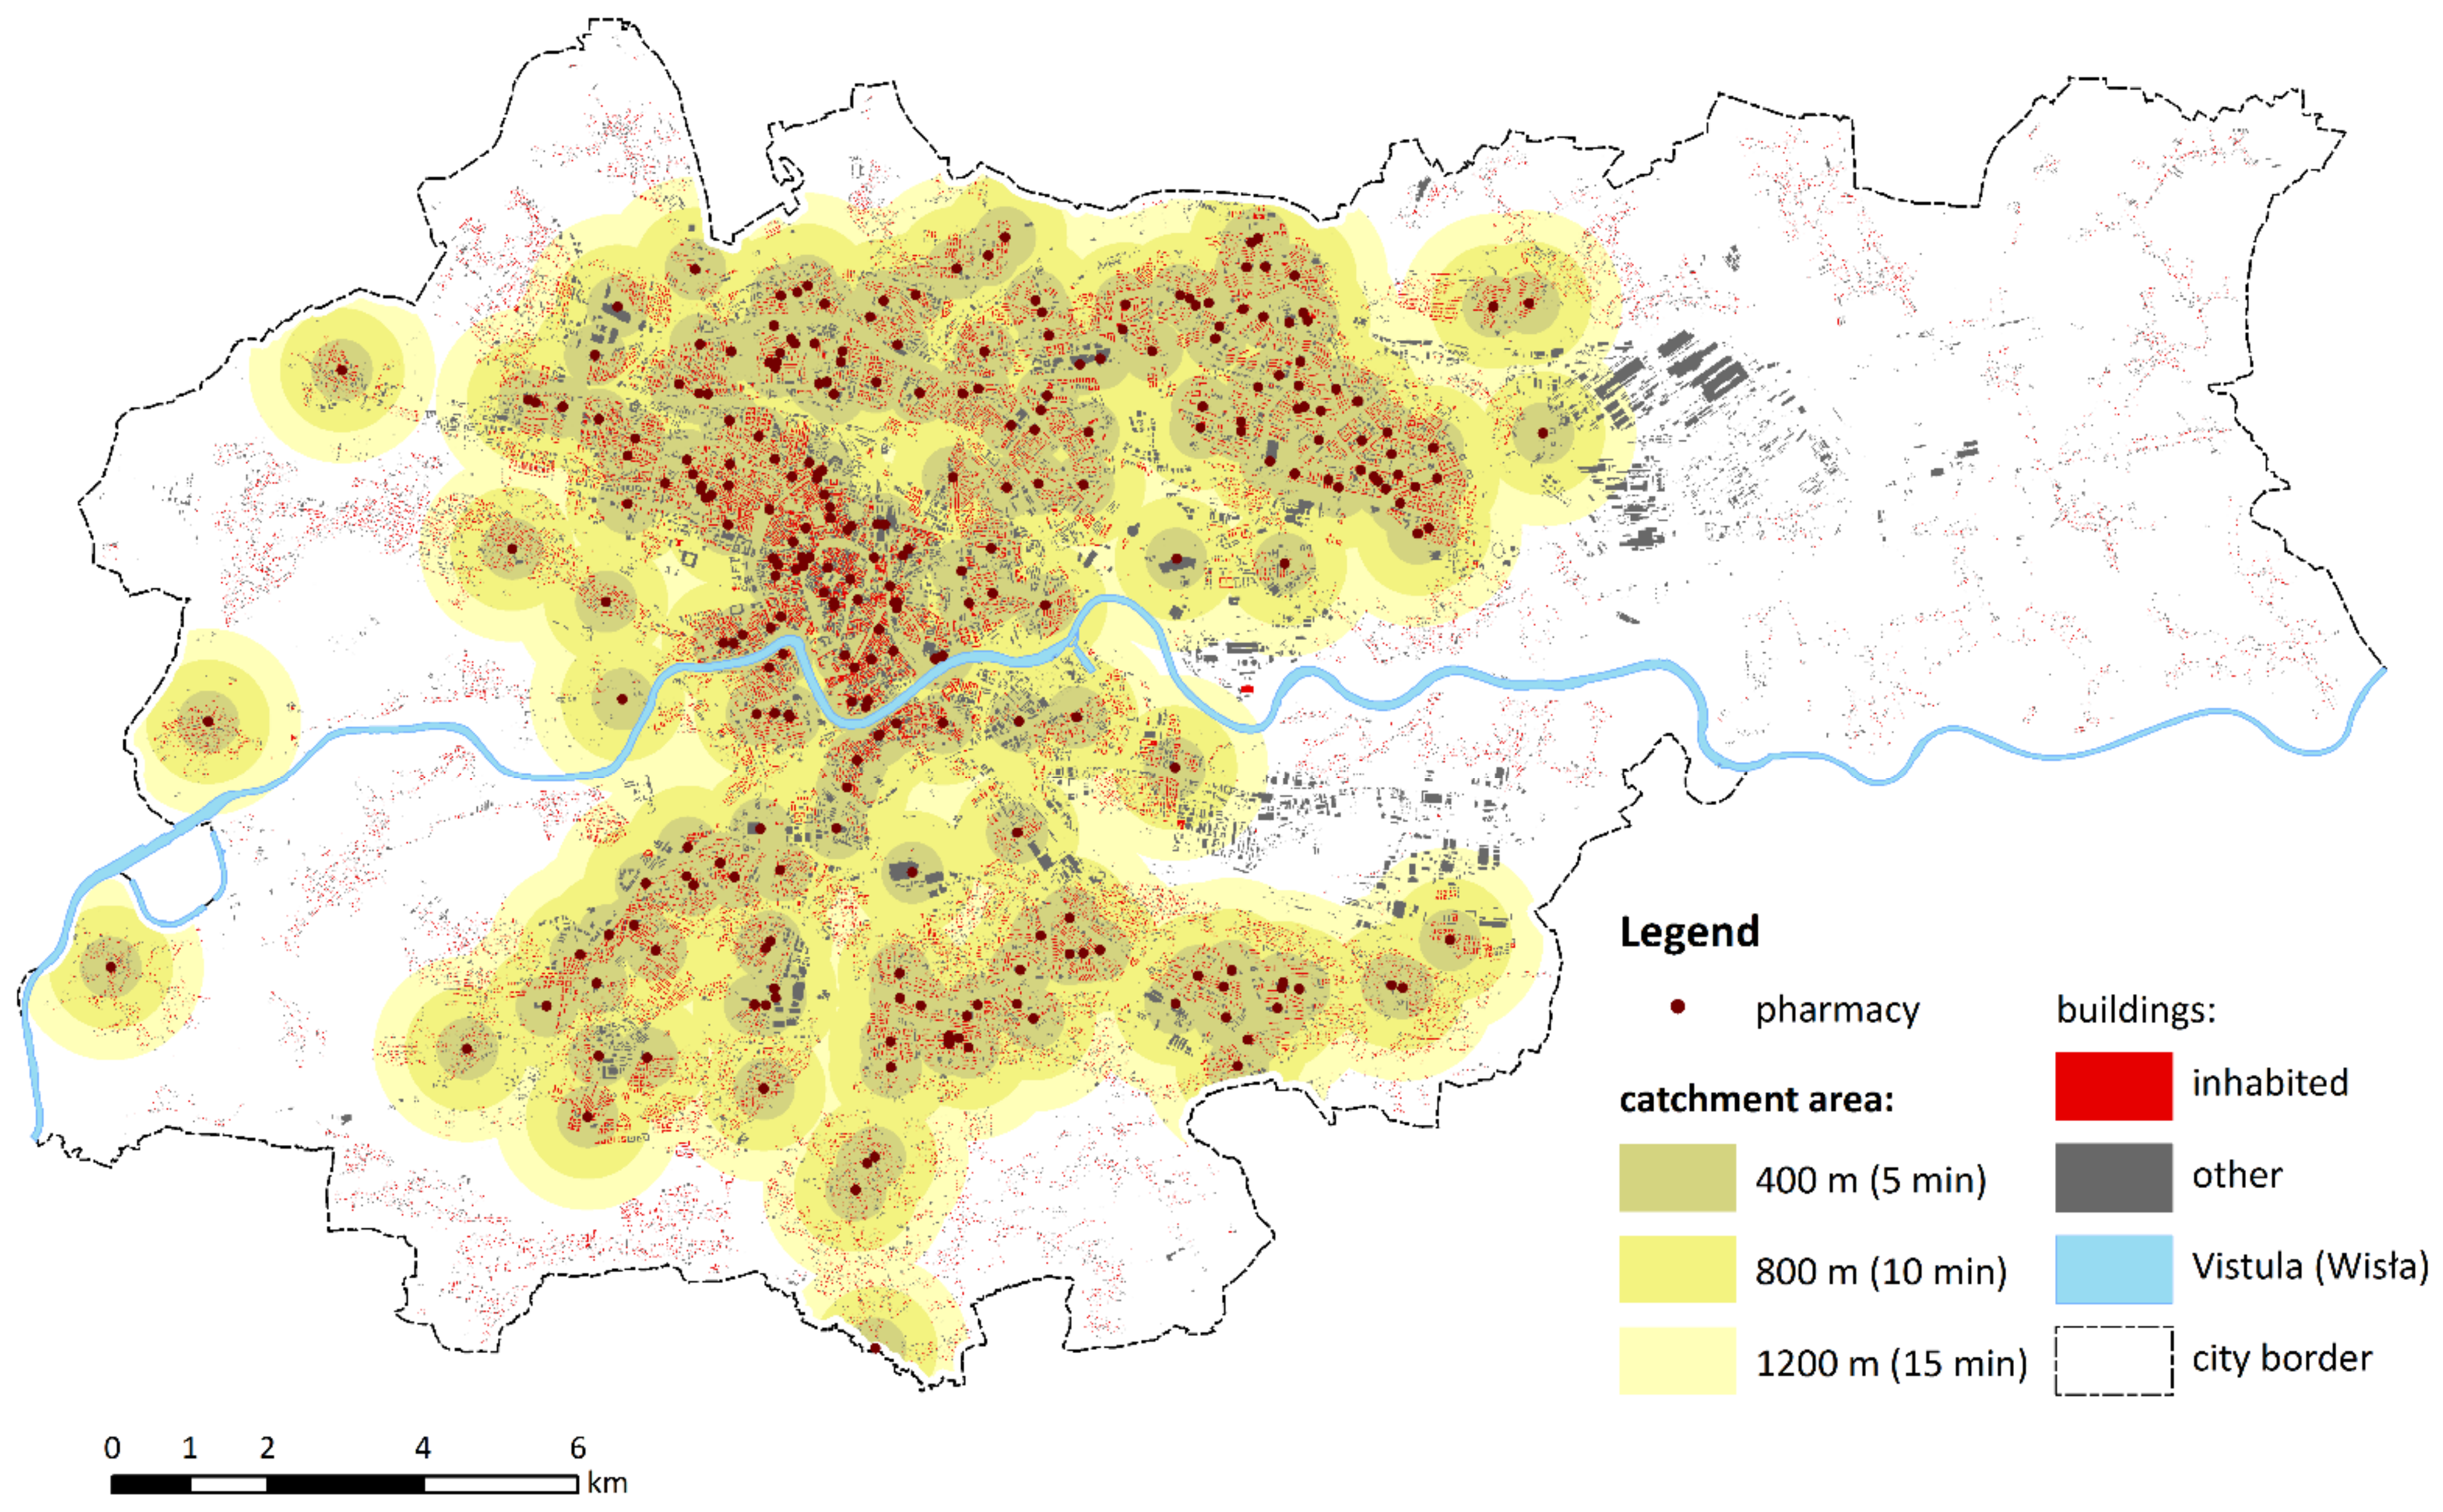
Figure A6. Pharmacies.
Sustainability 14 07103 g0a6
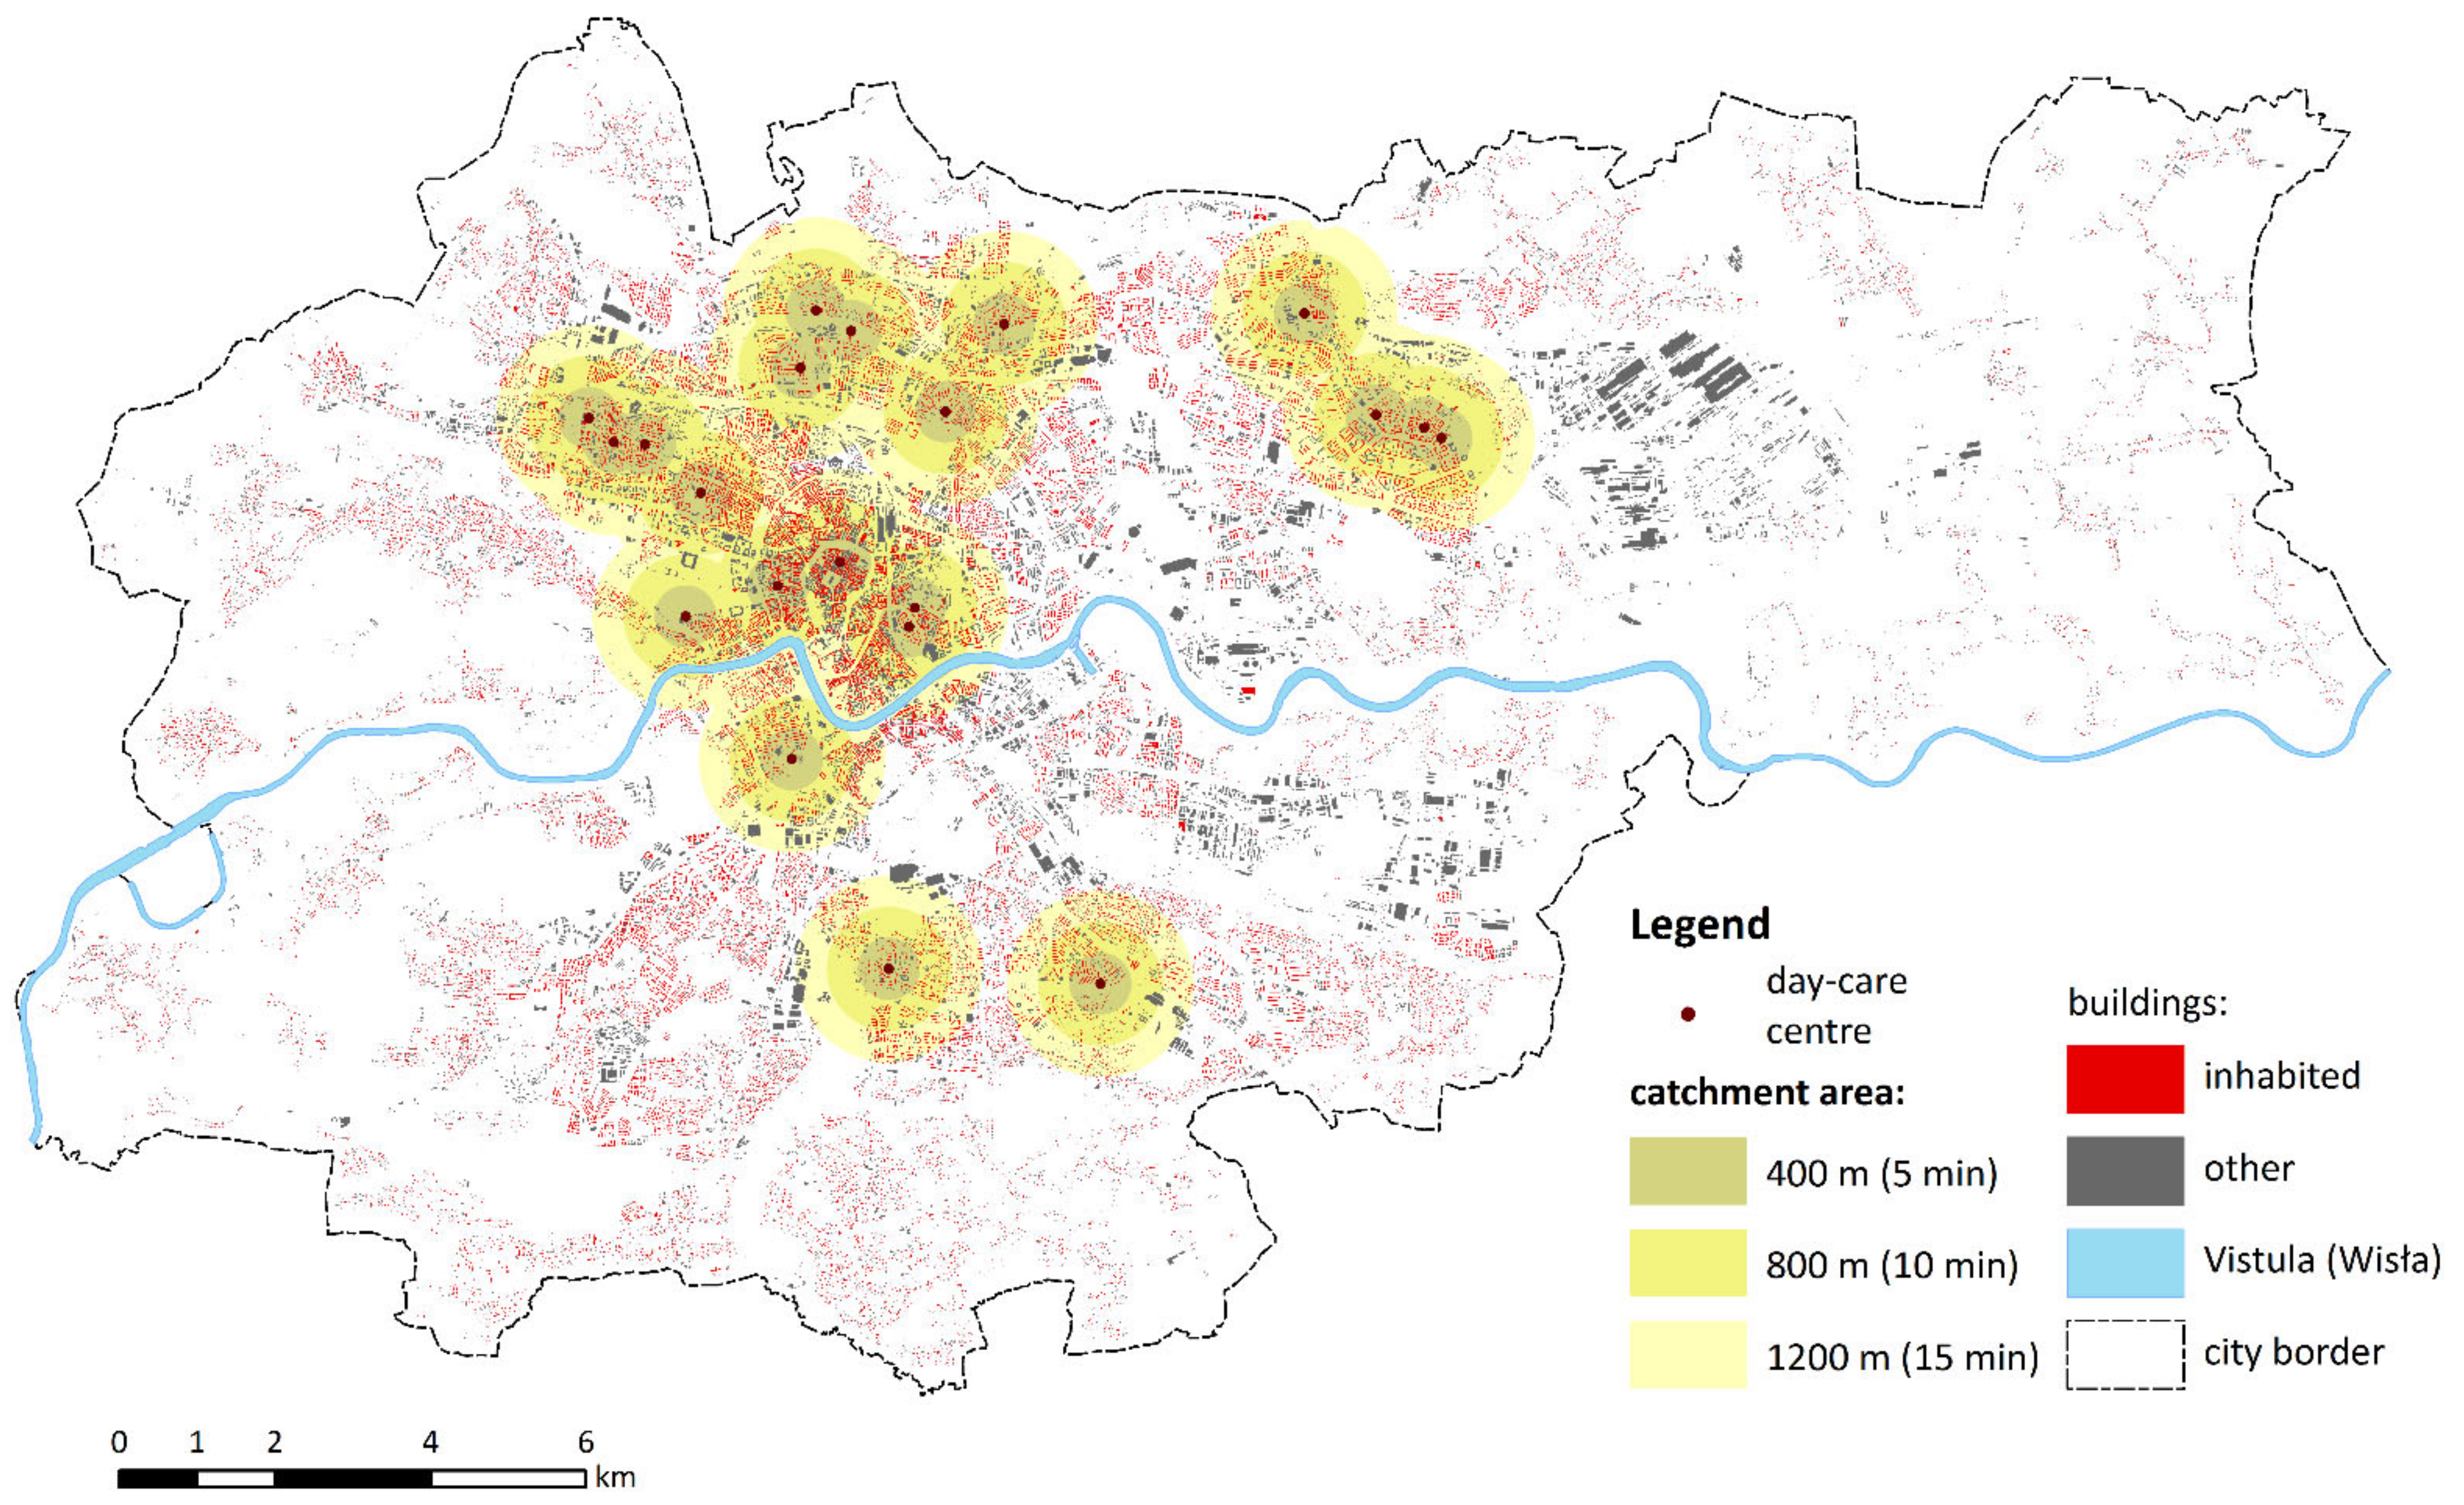
Figure A7. Day-care centres for seniors.
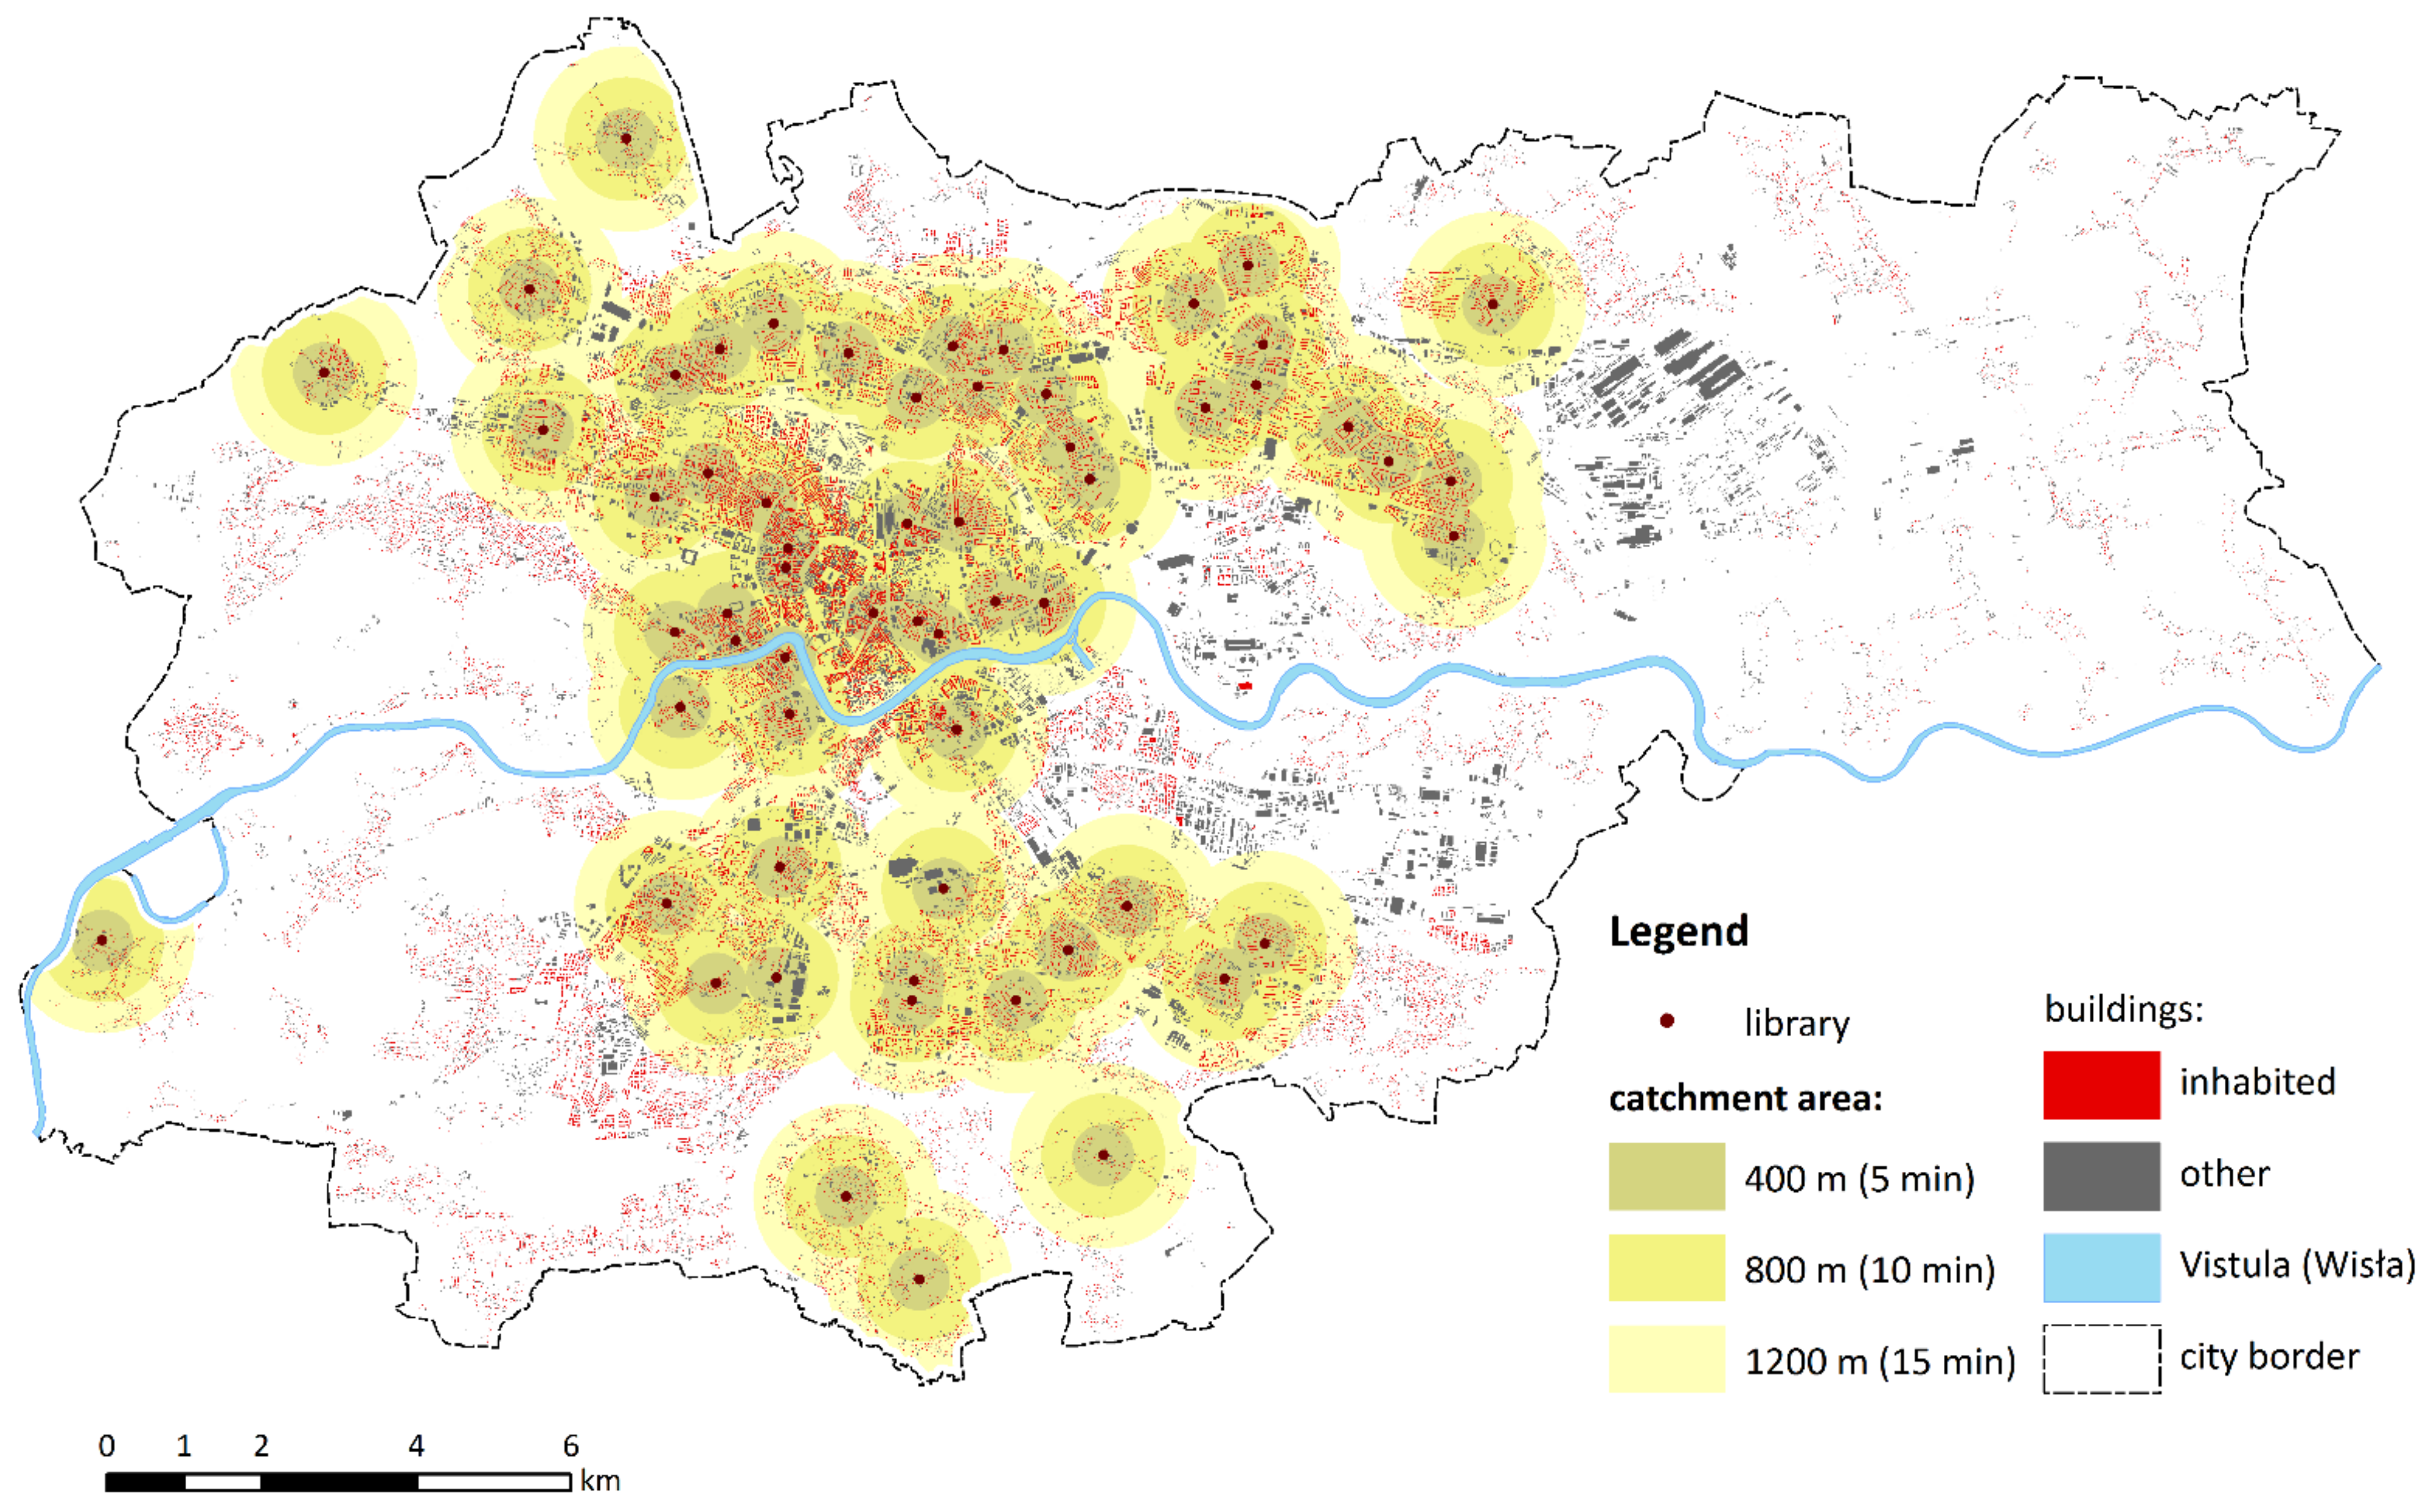
Sustainability 14 07103 g0a7
Figure A8. Libraries.
Sustainability 14 07103 g0a8
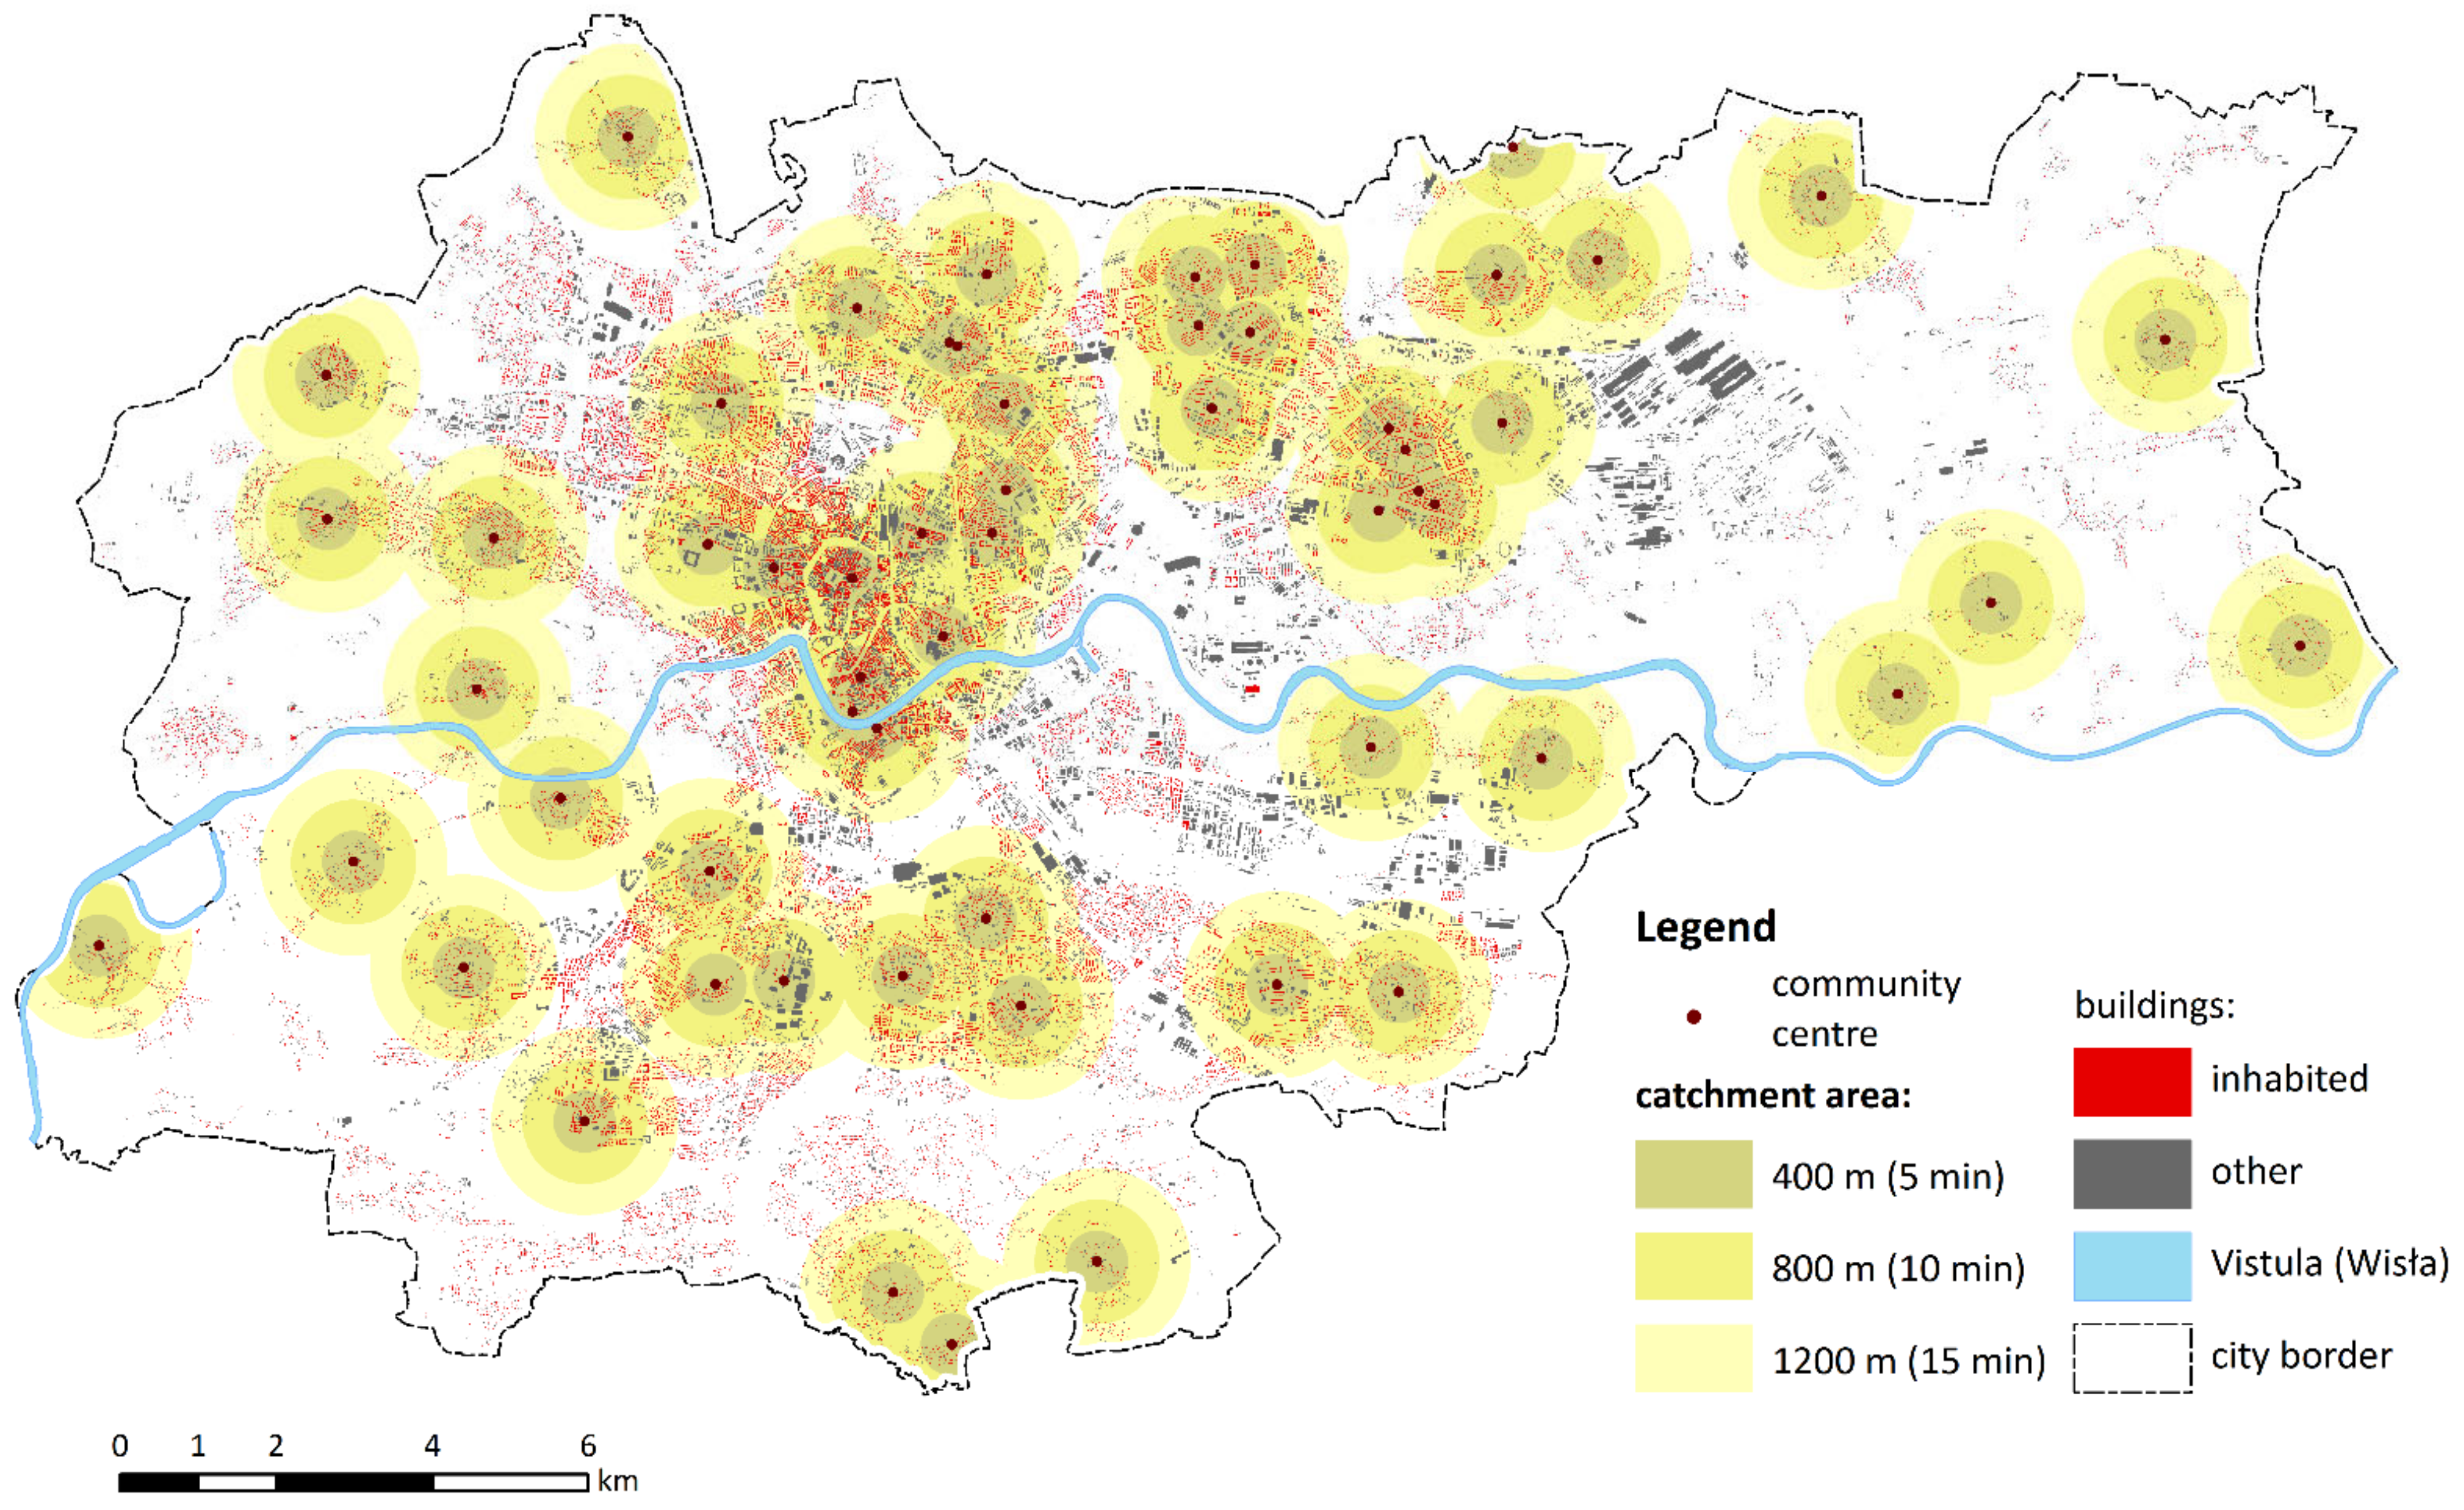
Figure A9. Community centres.
Sustainability 14 07103 g0a9
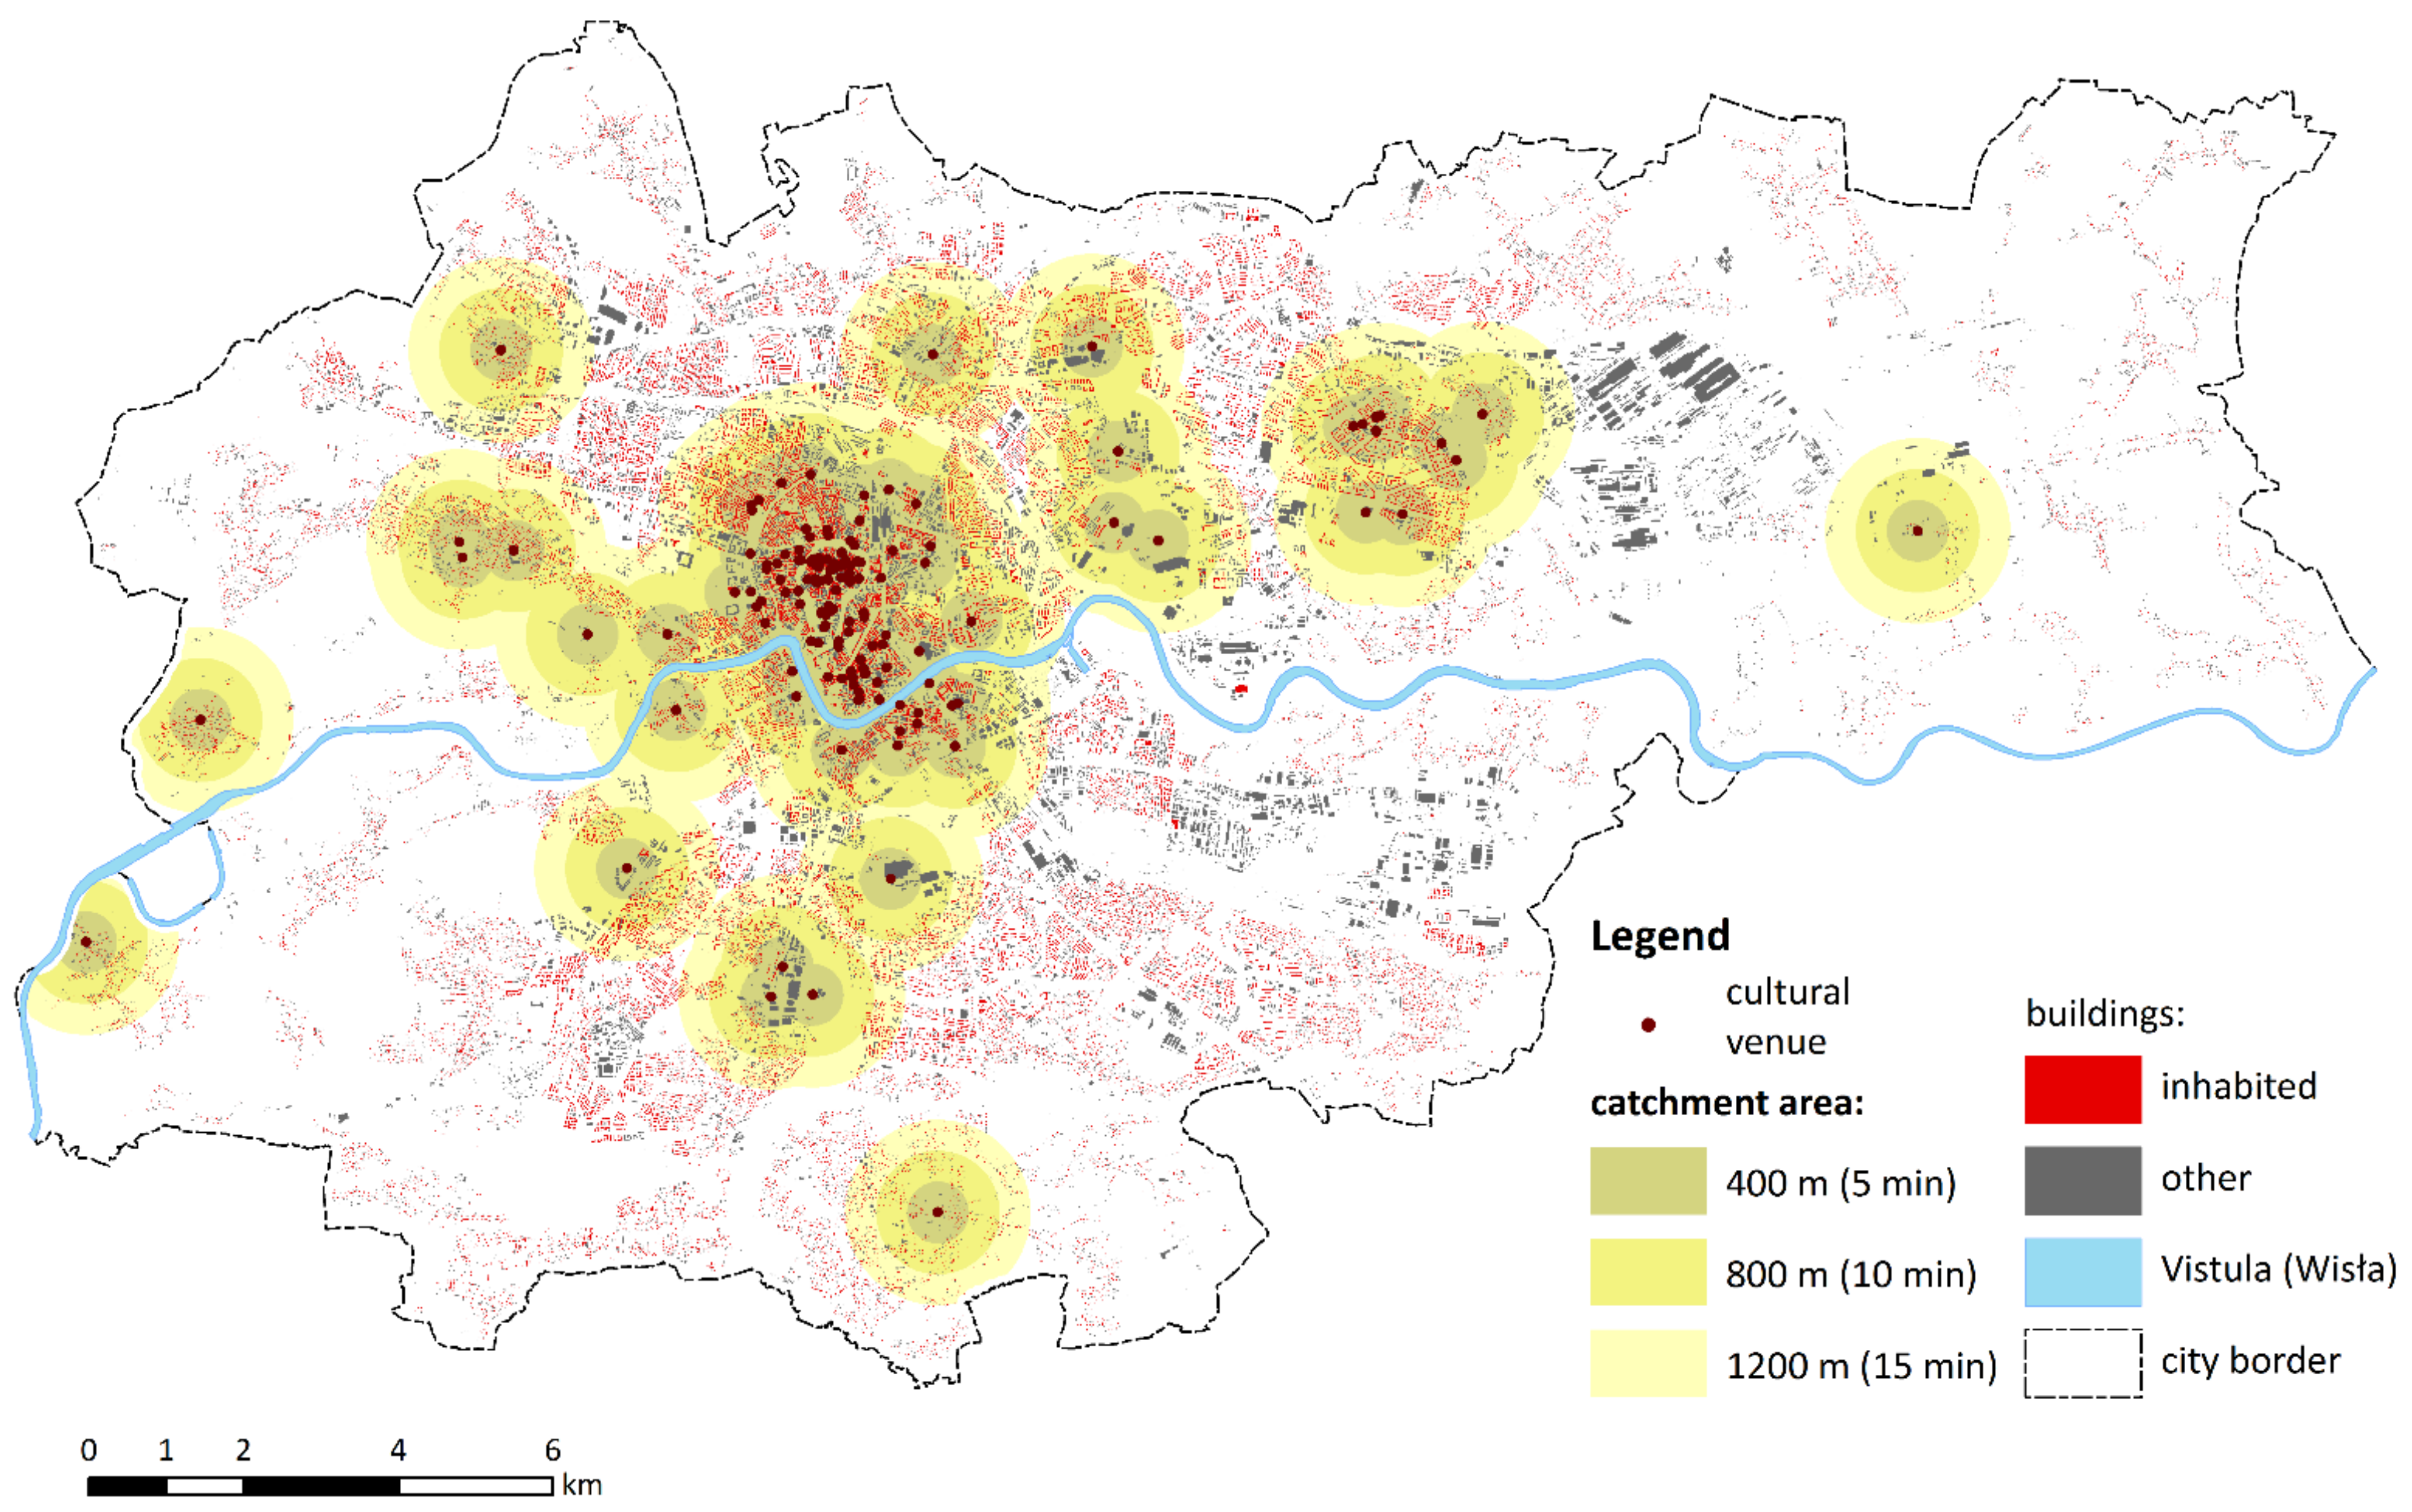
Figure A10. Cultural venues.
Sustainability 14 07103 g0a10
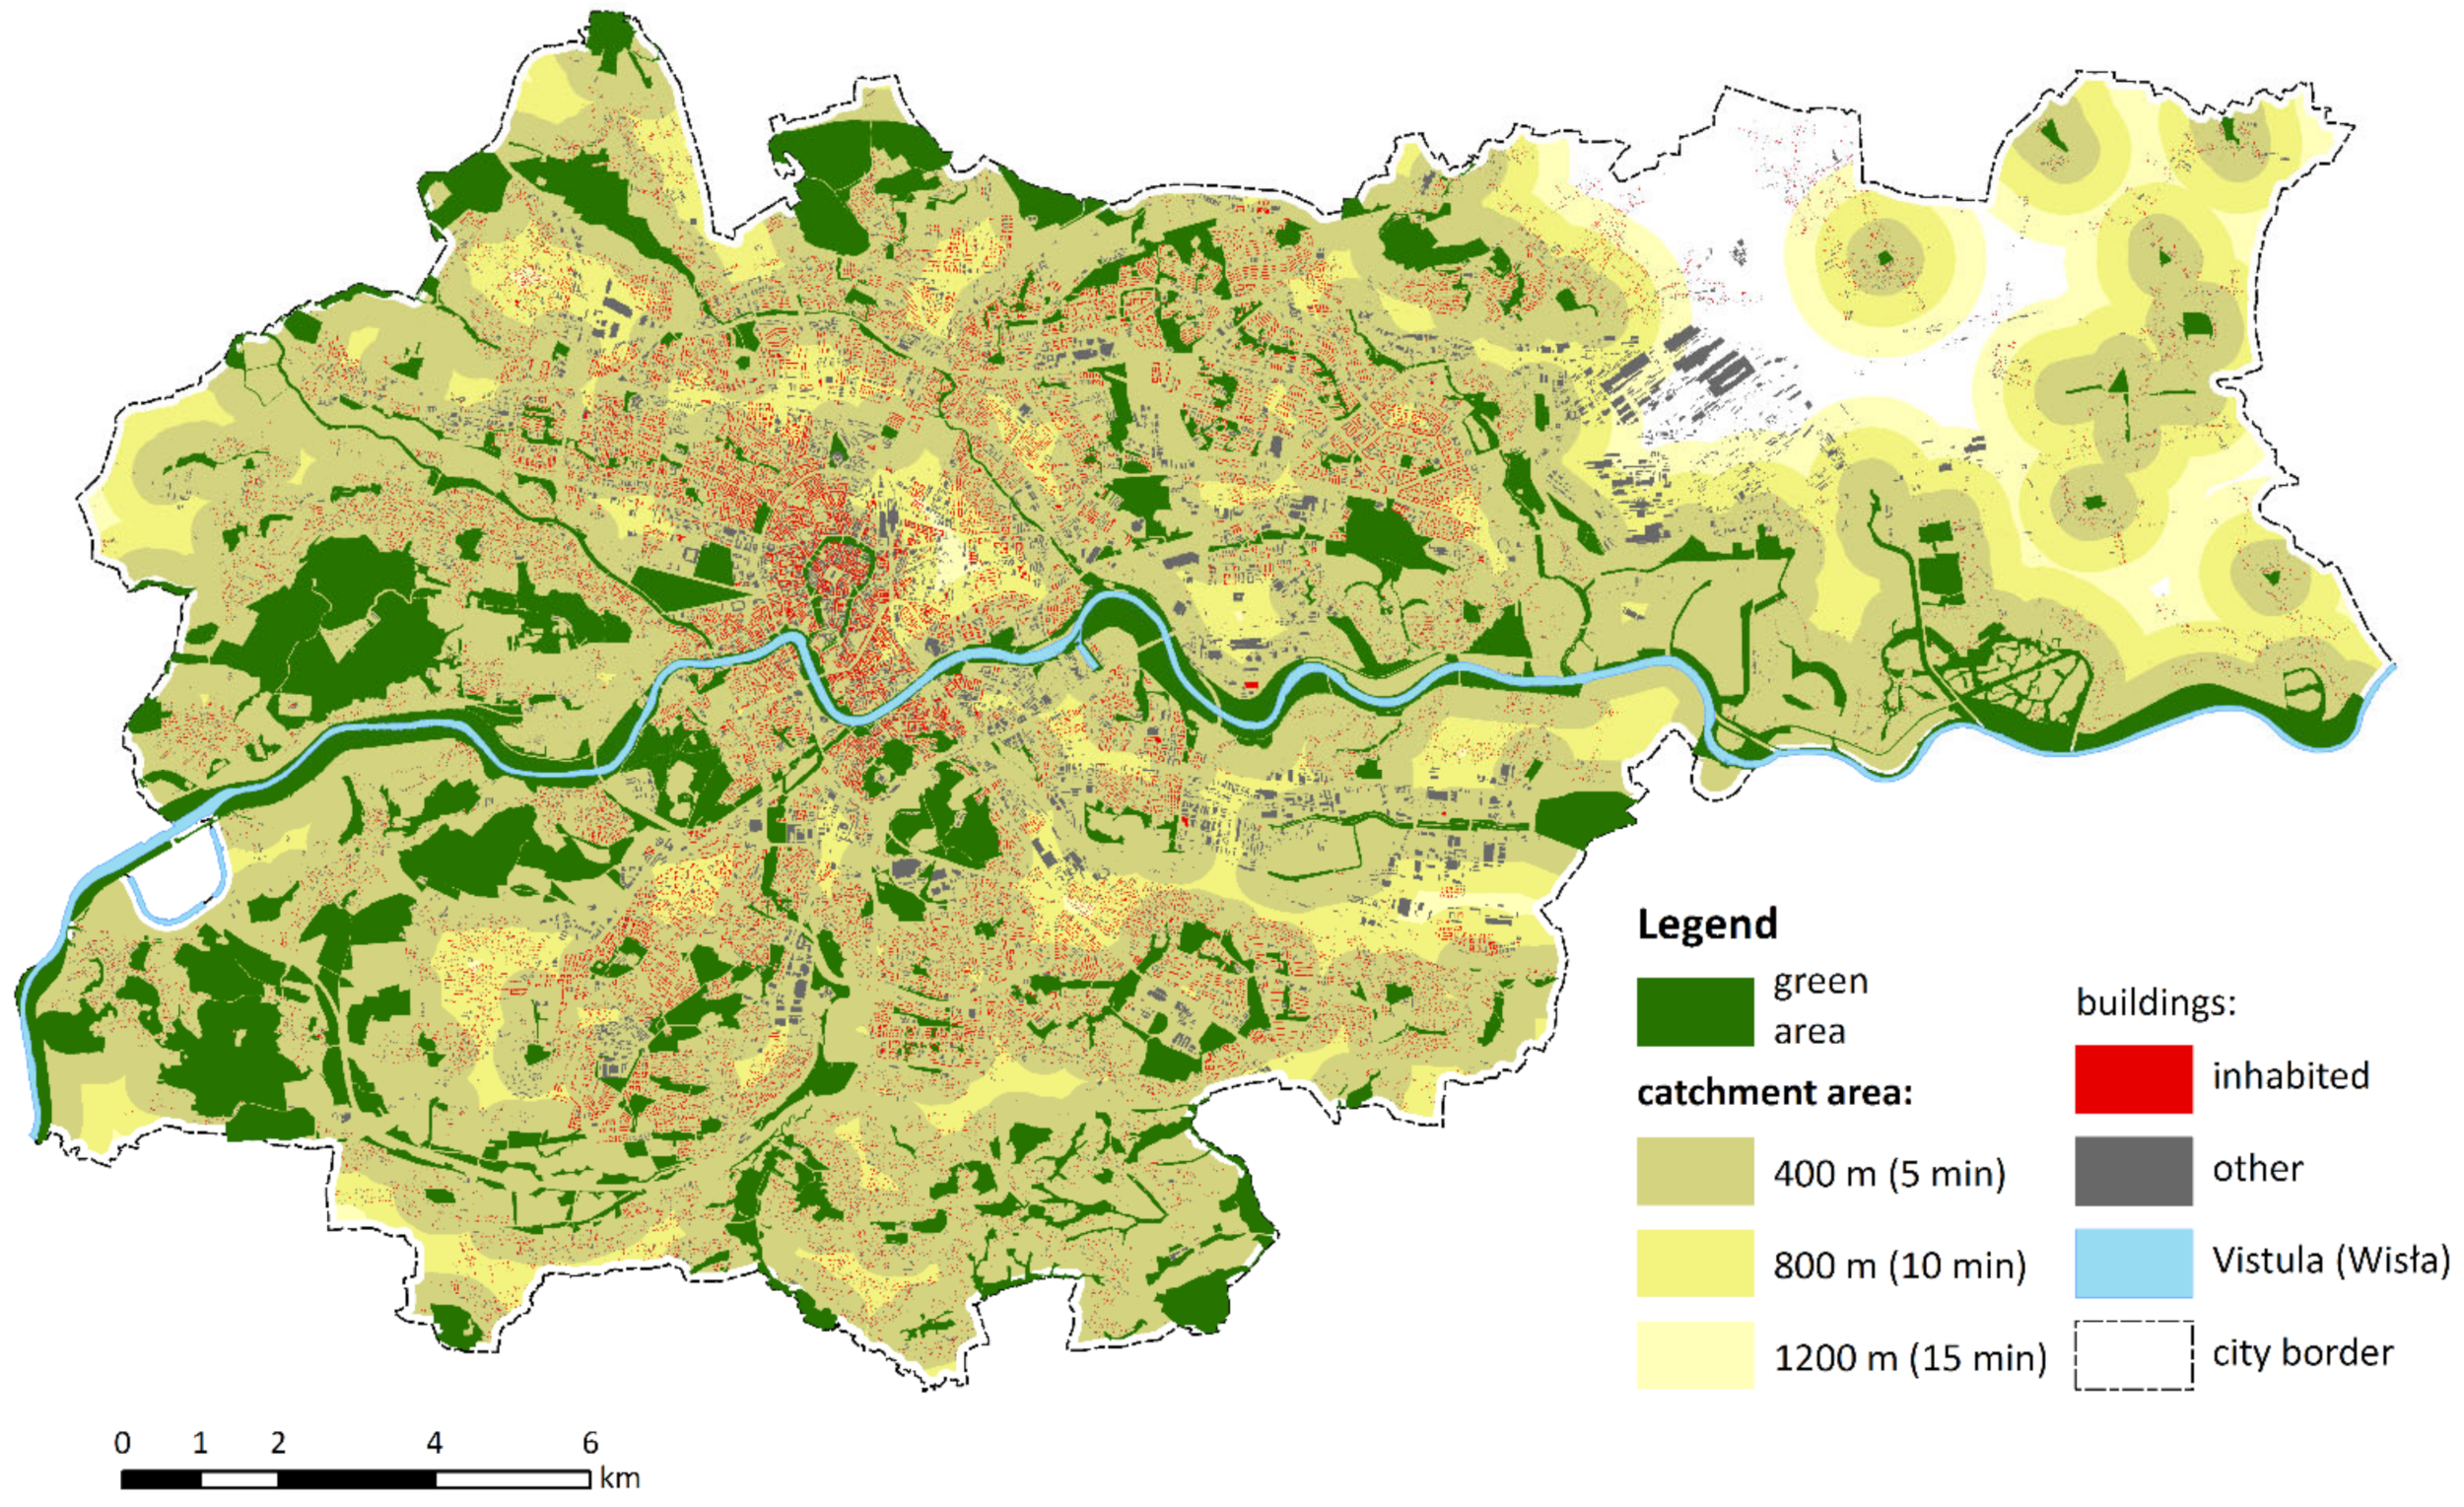
Figure A11. Green areas with an area exceeding 2ha.
Sustainability 14 07103 g0a11
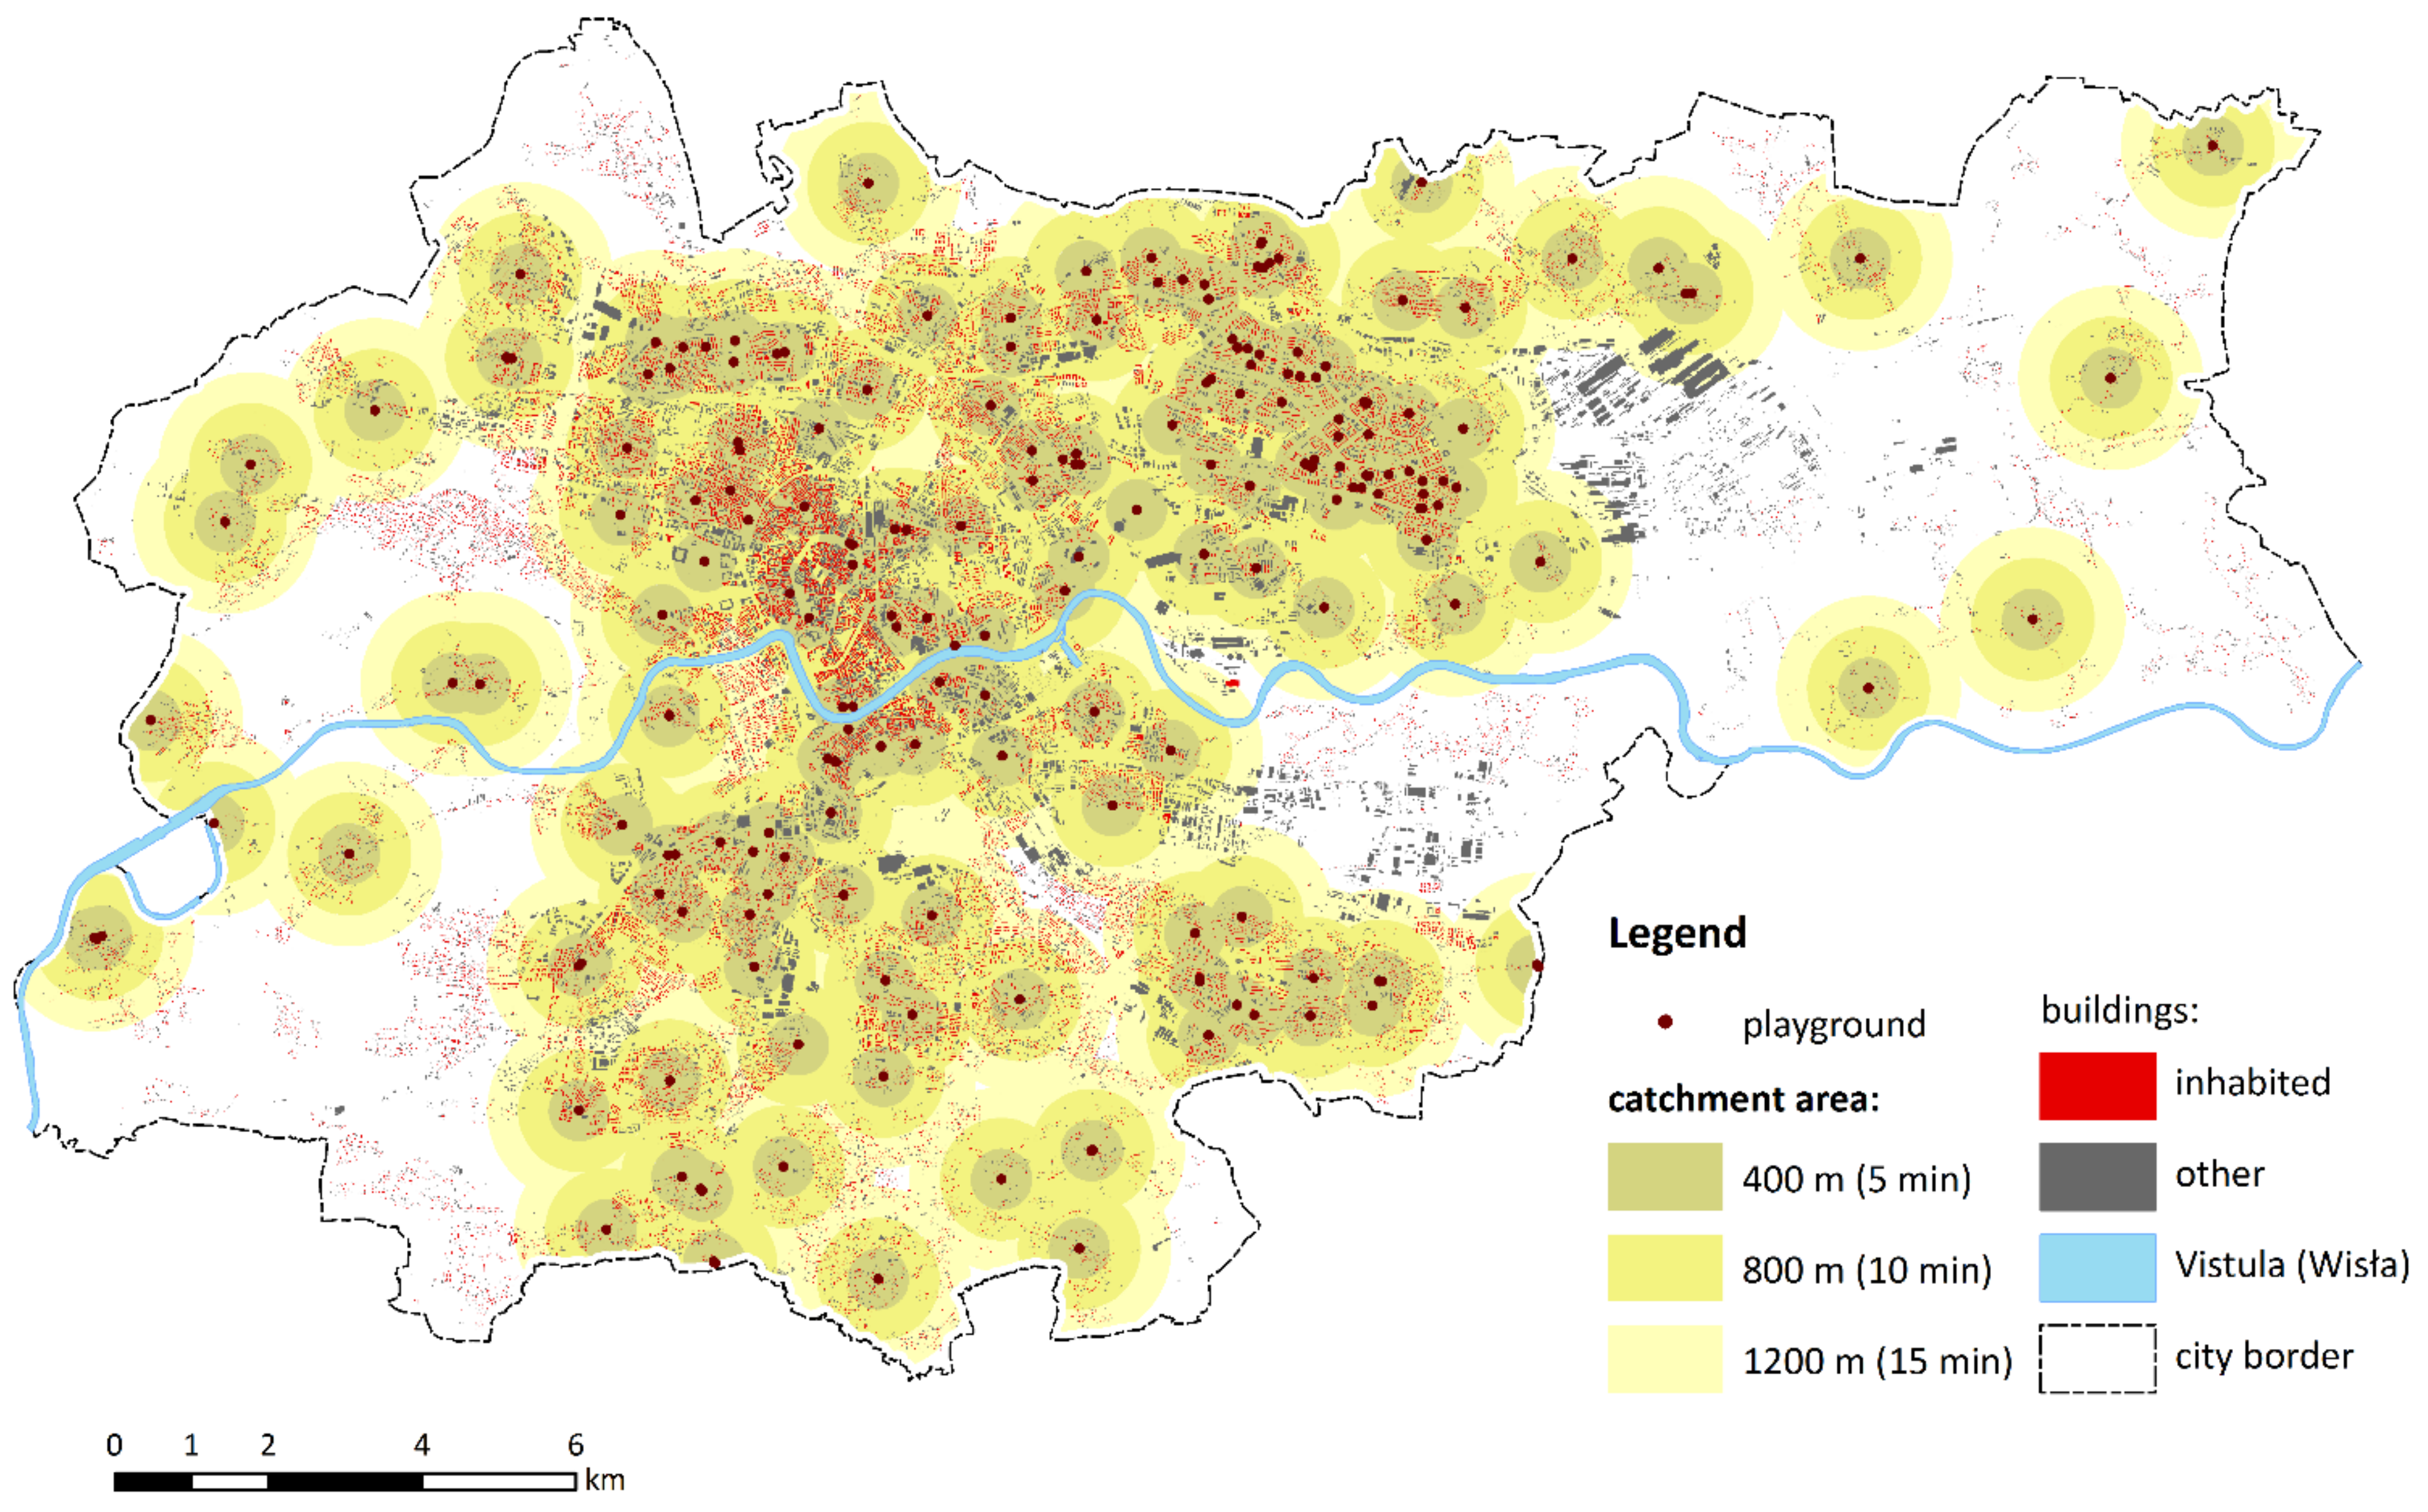
Figure A12. Playgrounds for children.
Sustainability 14 07103 g0a12
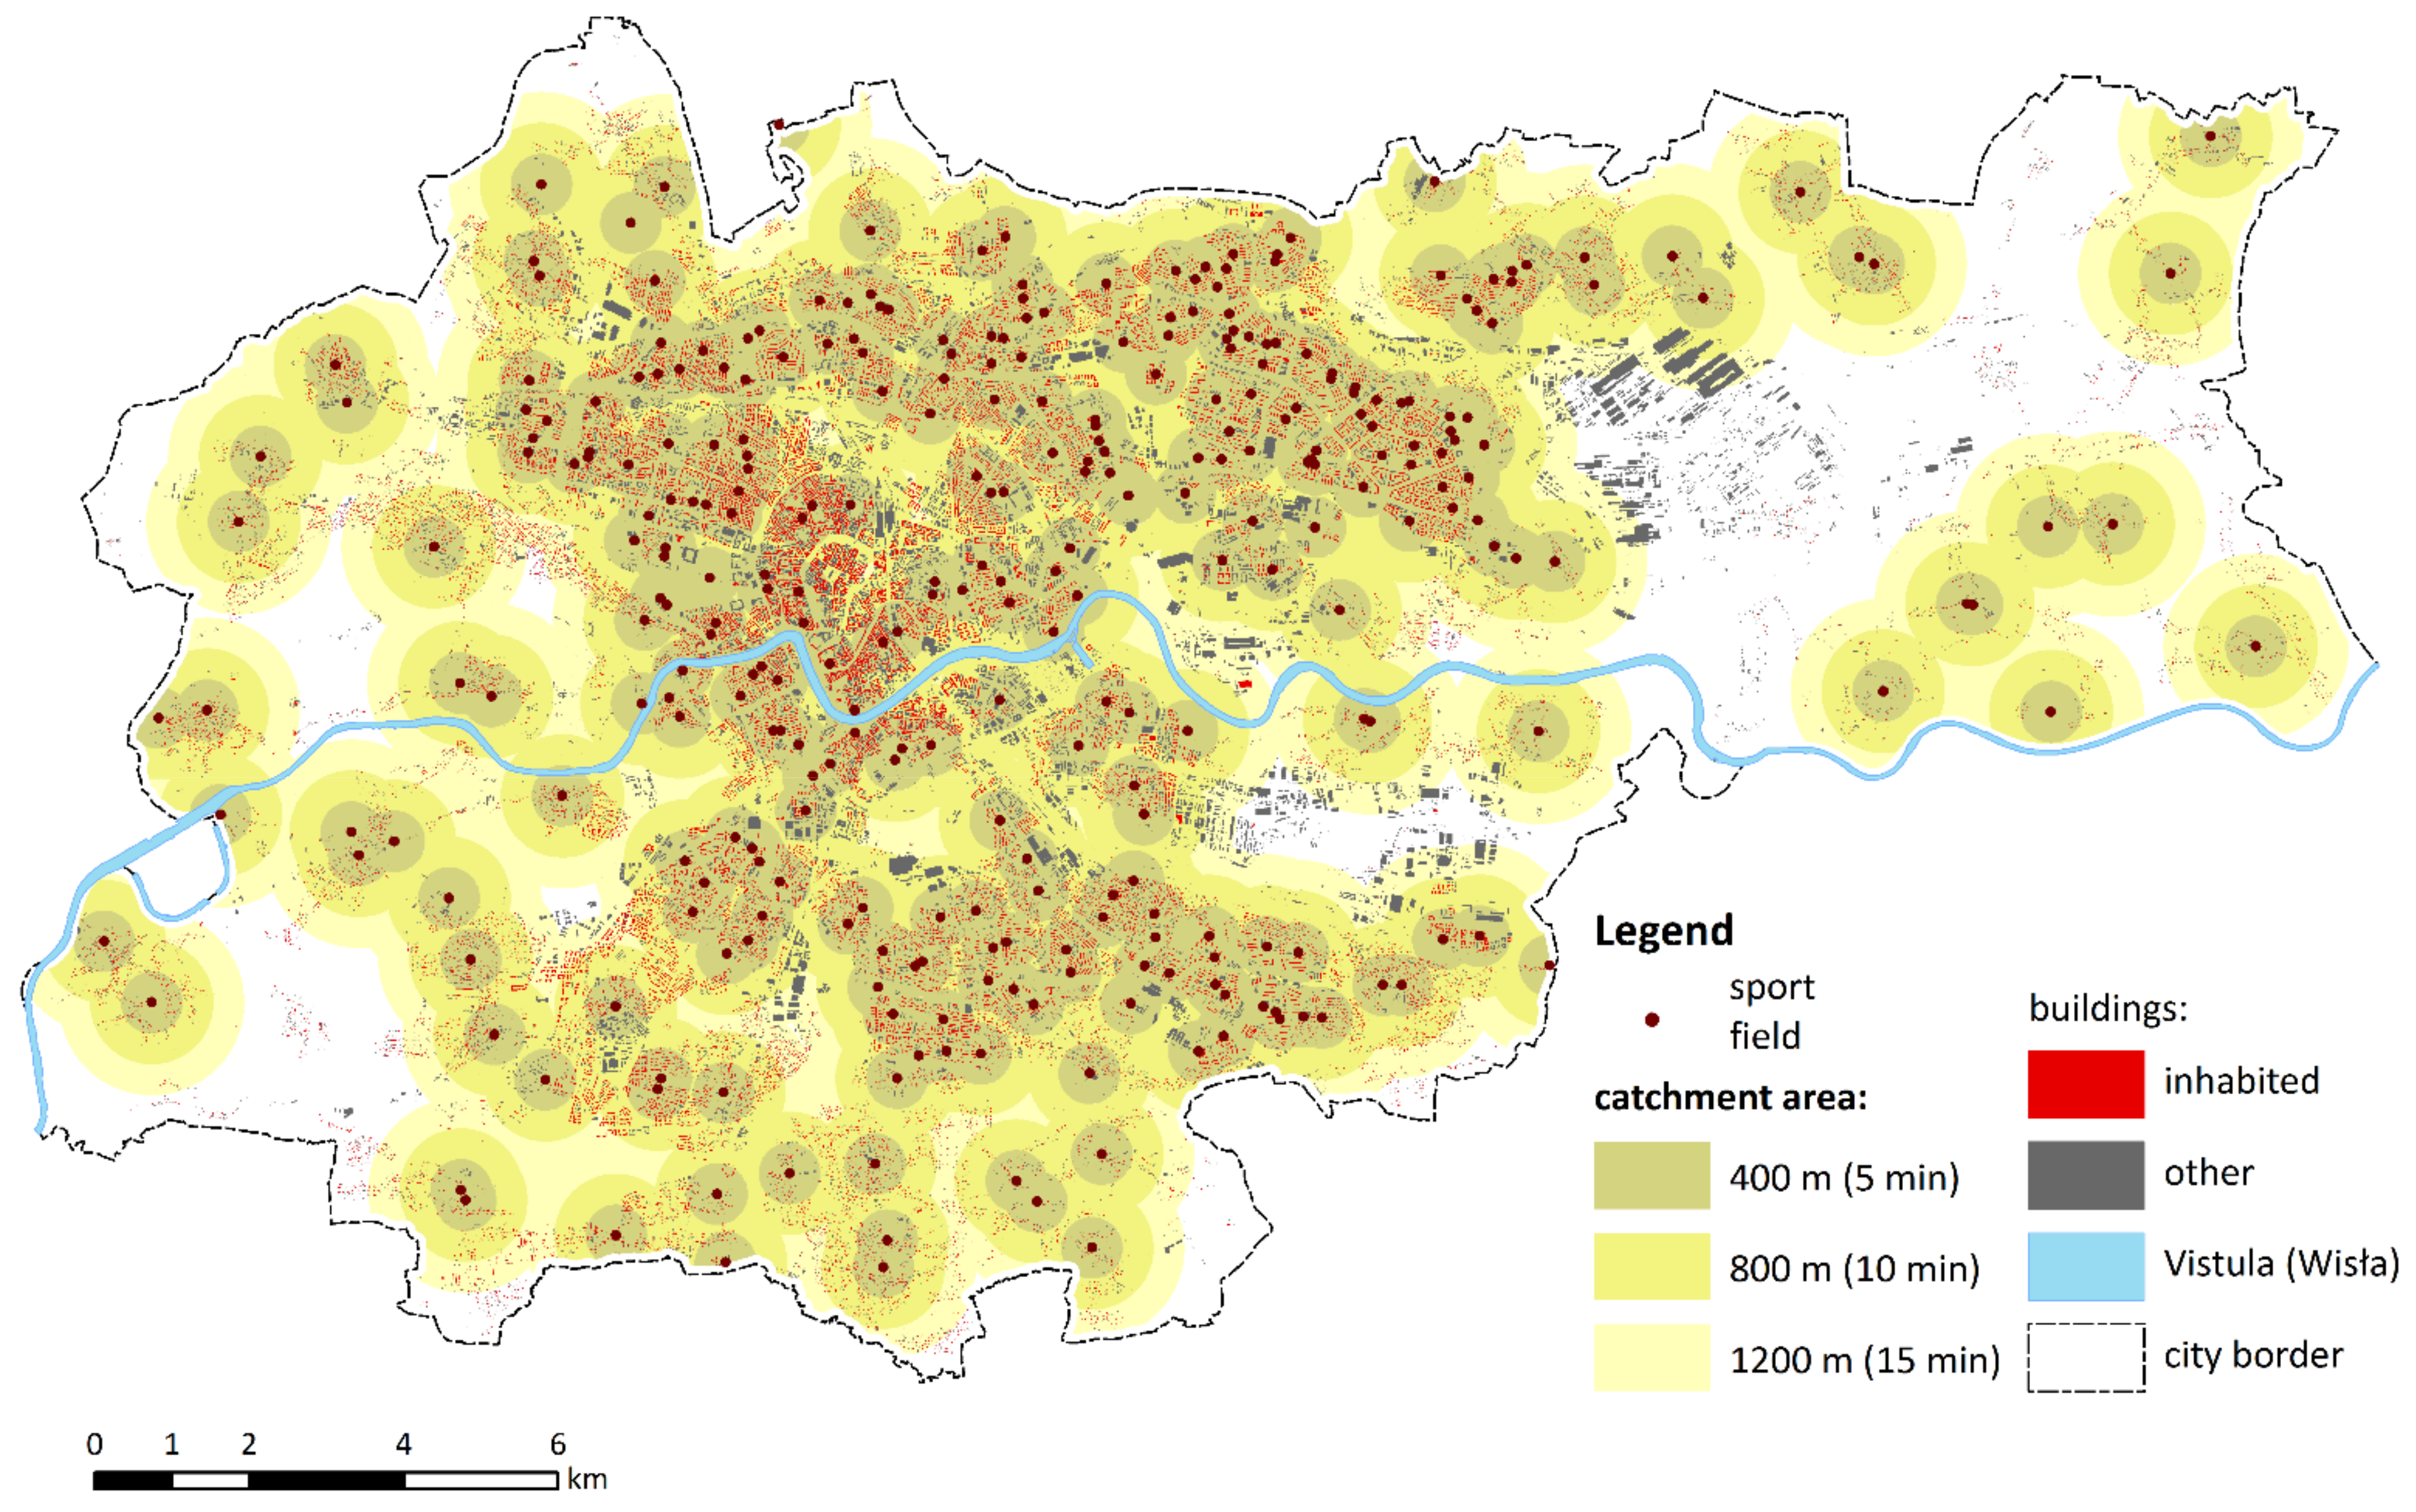
Figure A13. Public sports fields for team games.
Sustainability 14 07103 g0a13
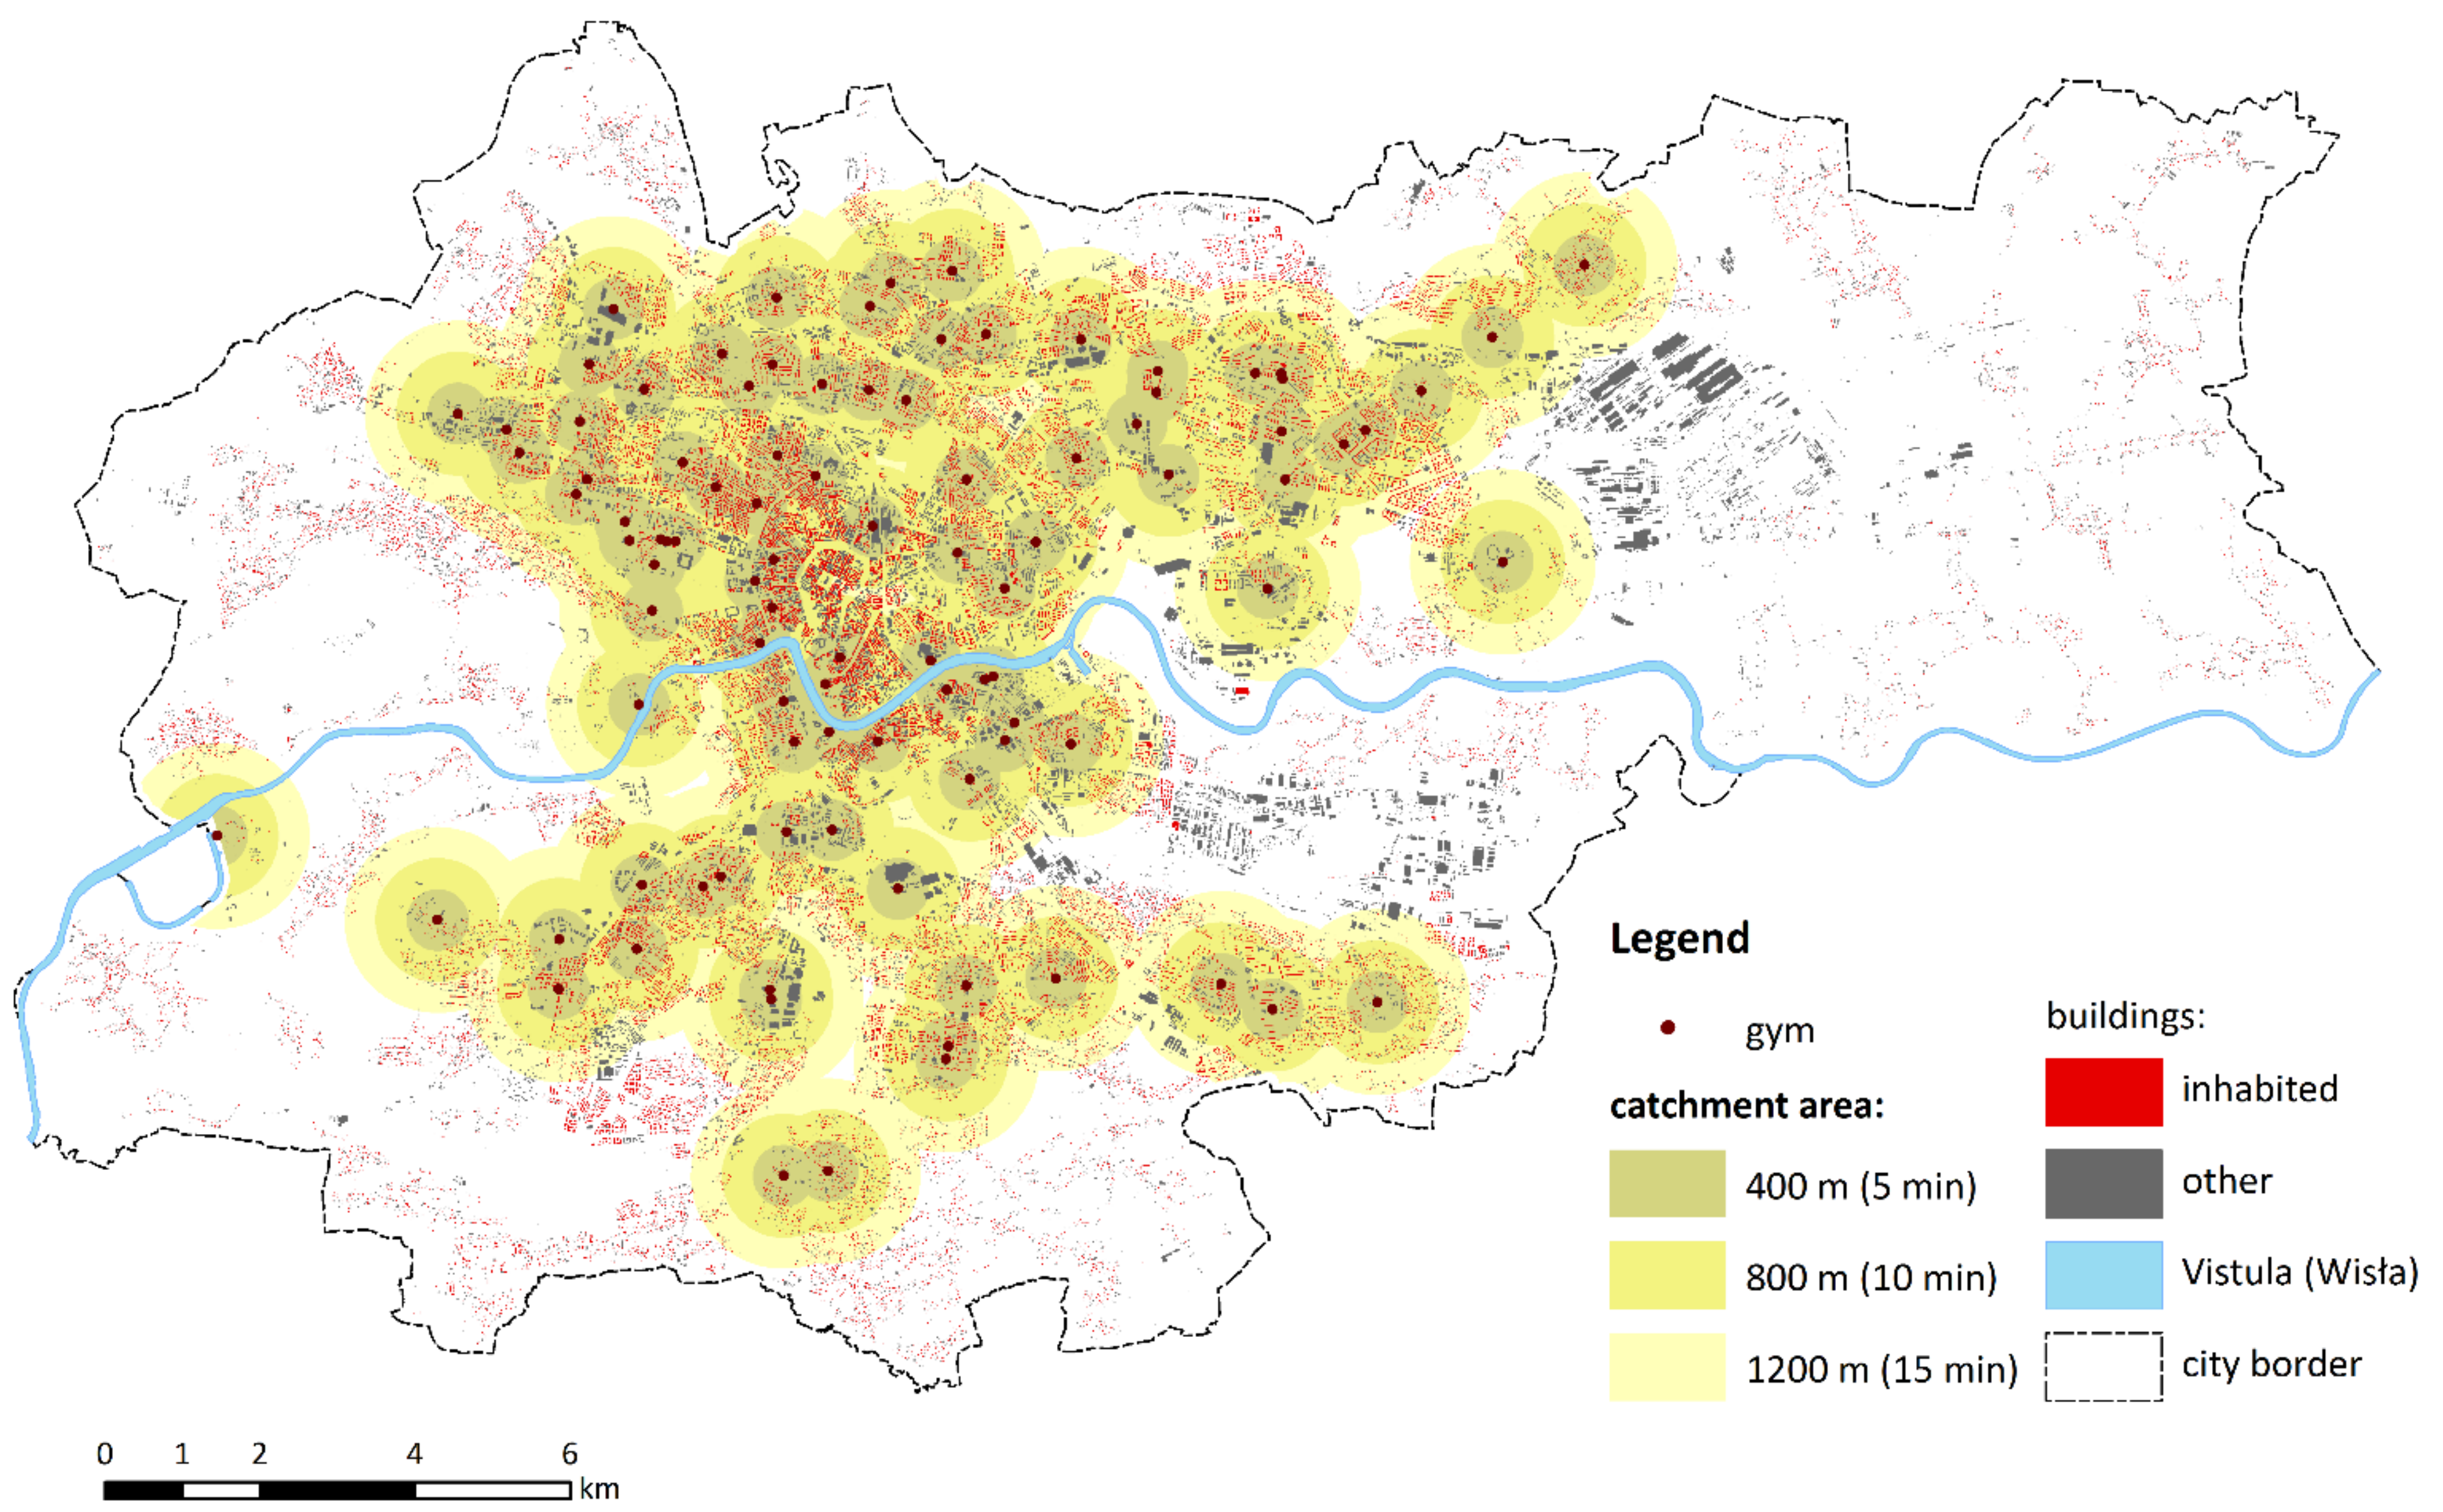
Figure A14. Gyms, fitness clubs.
Sustainability 14 07103 g0a14
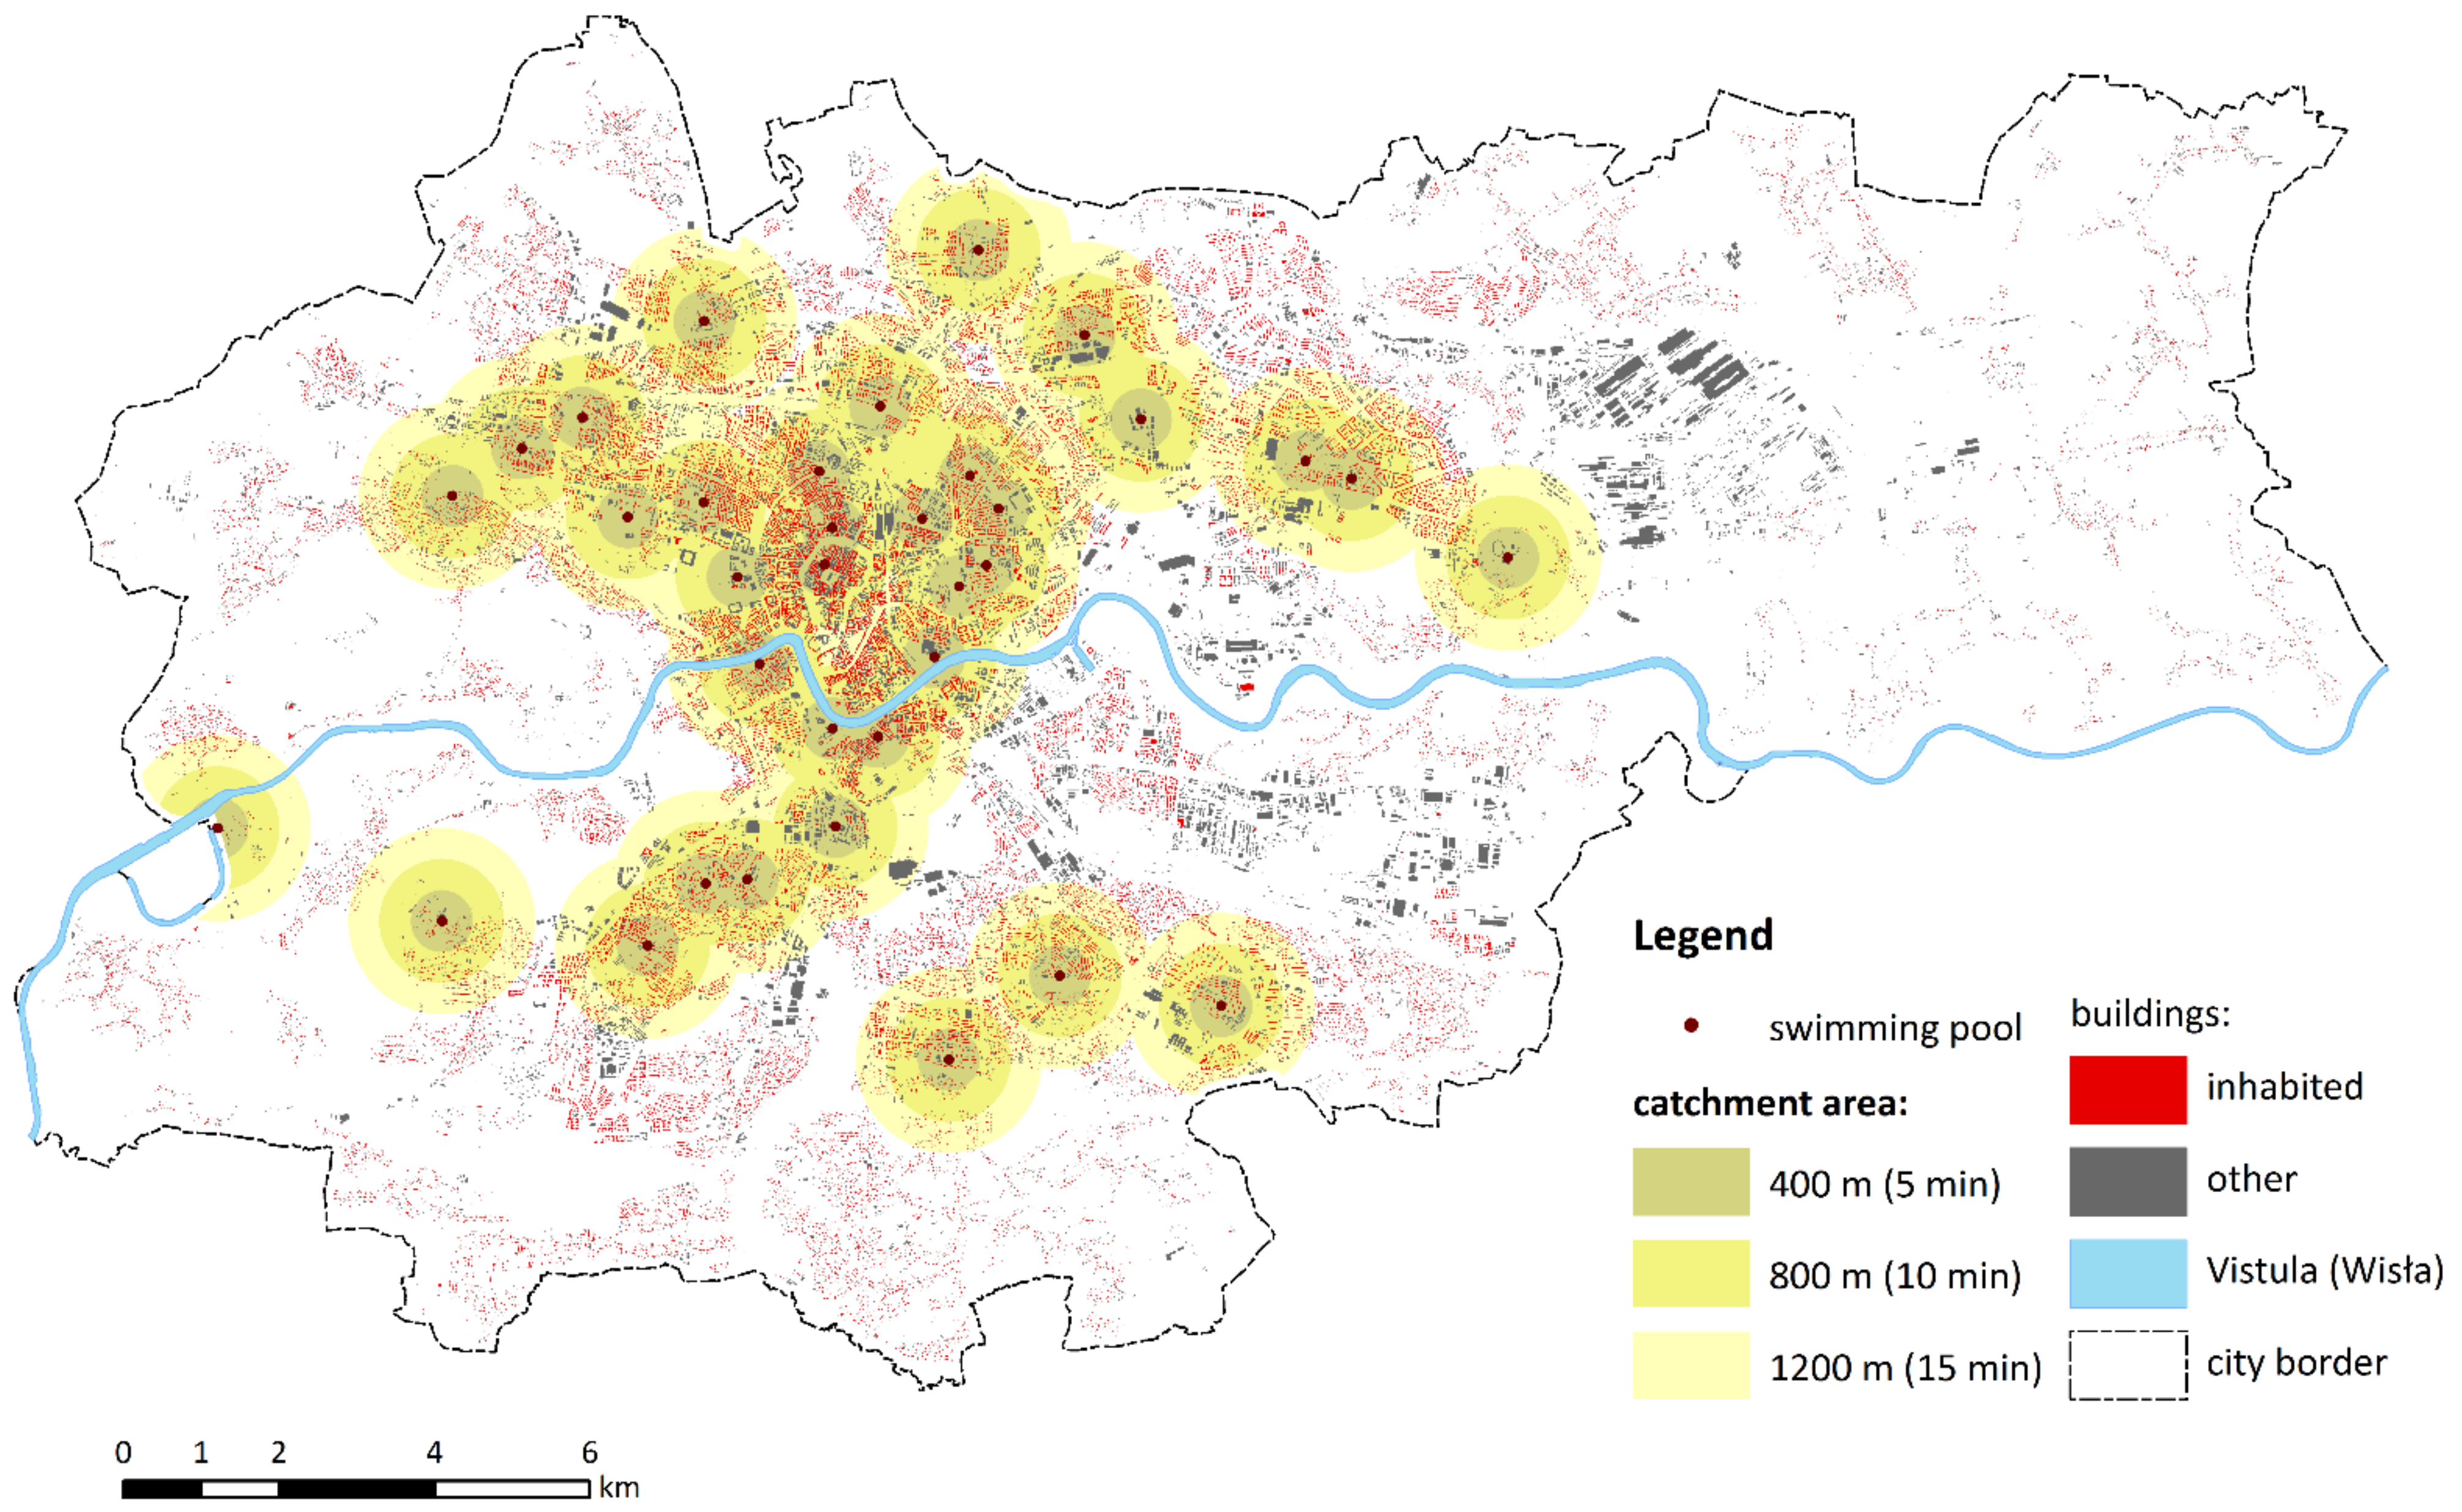
Figure A15. Indoor swimming pools.
Sustainability 14 07103 g0a15
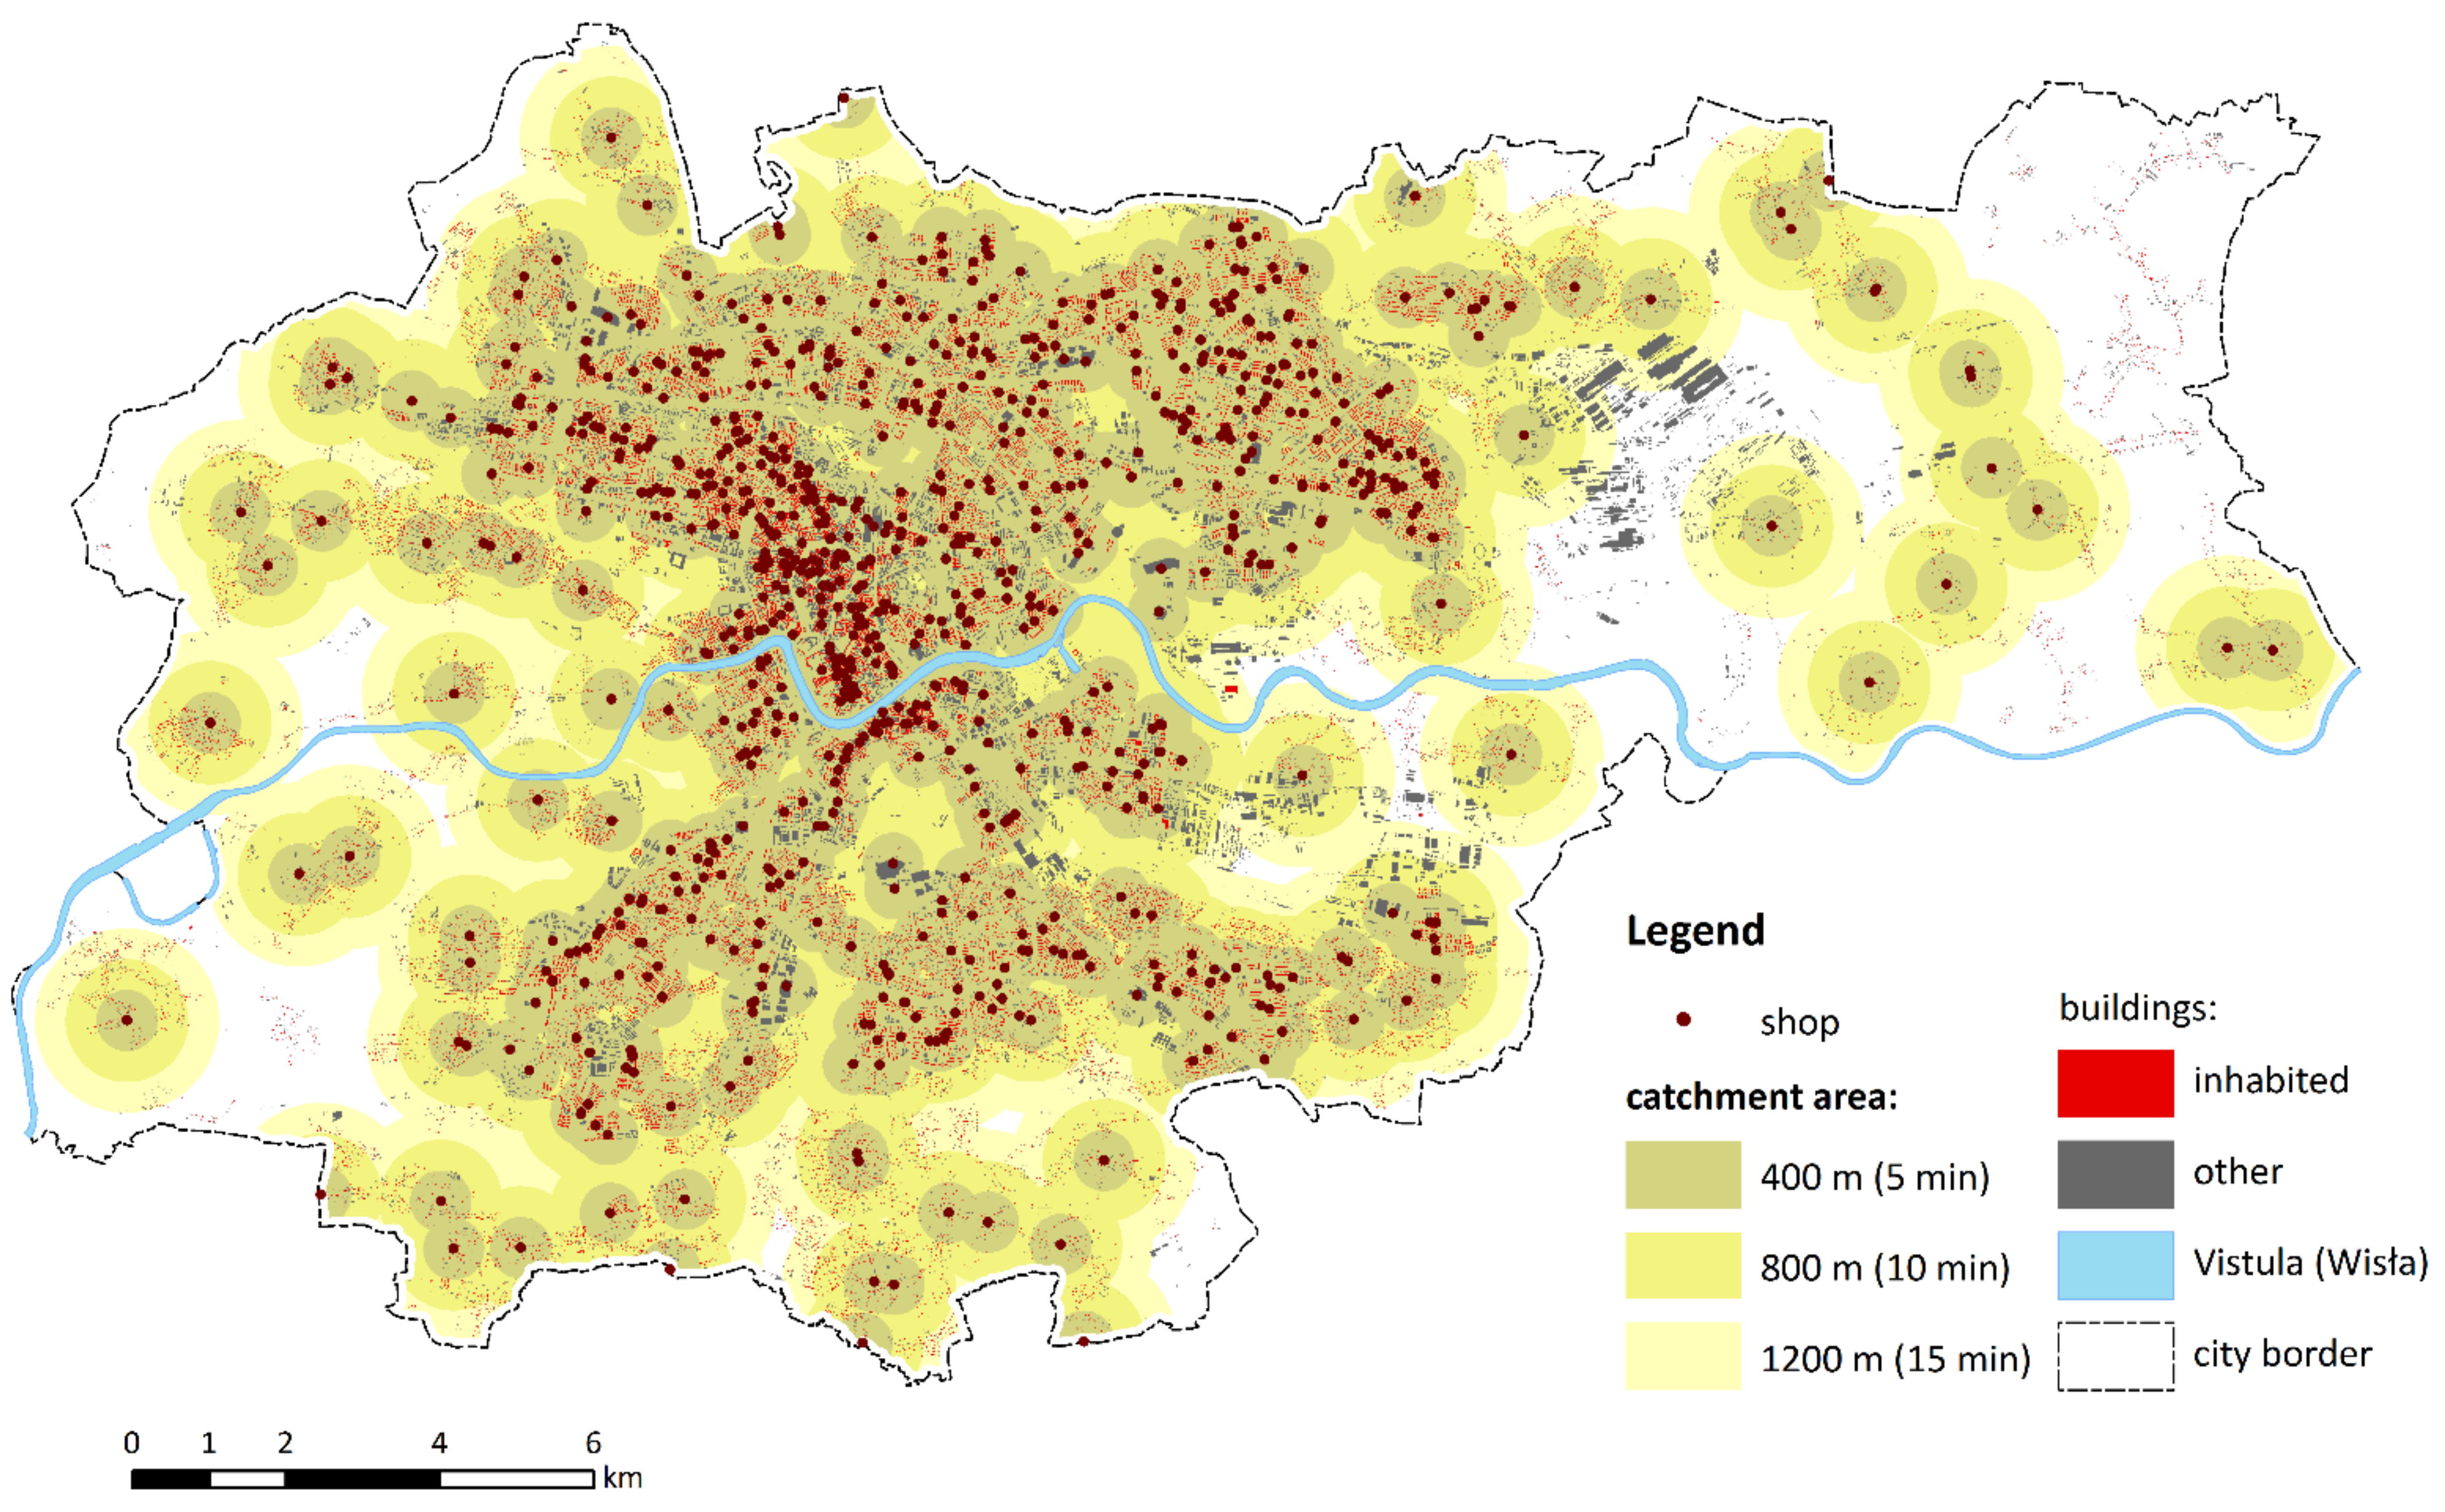
Figure A16. Grocery shops.
Sustainability 14 07103 g0a16
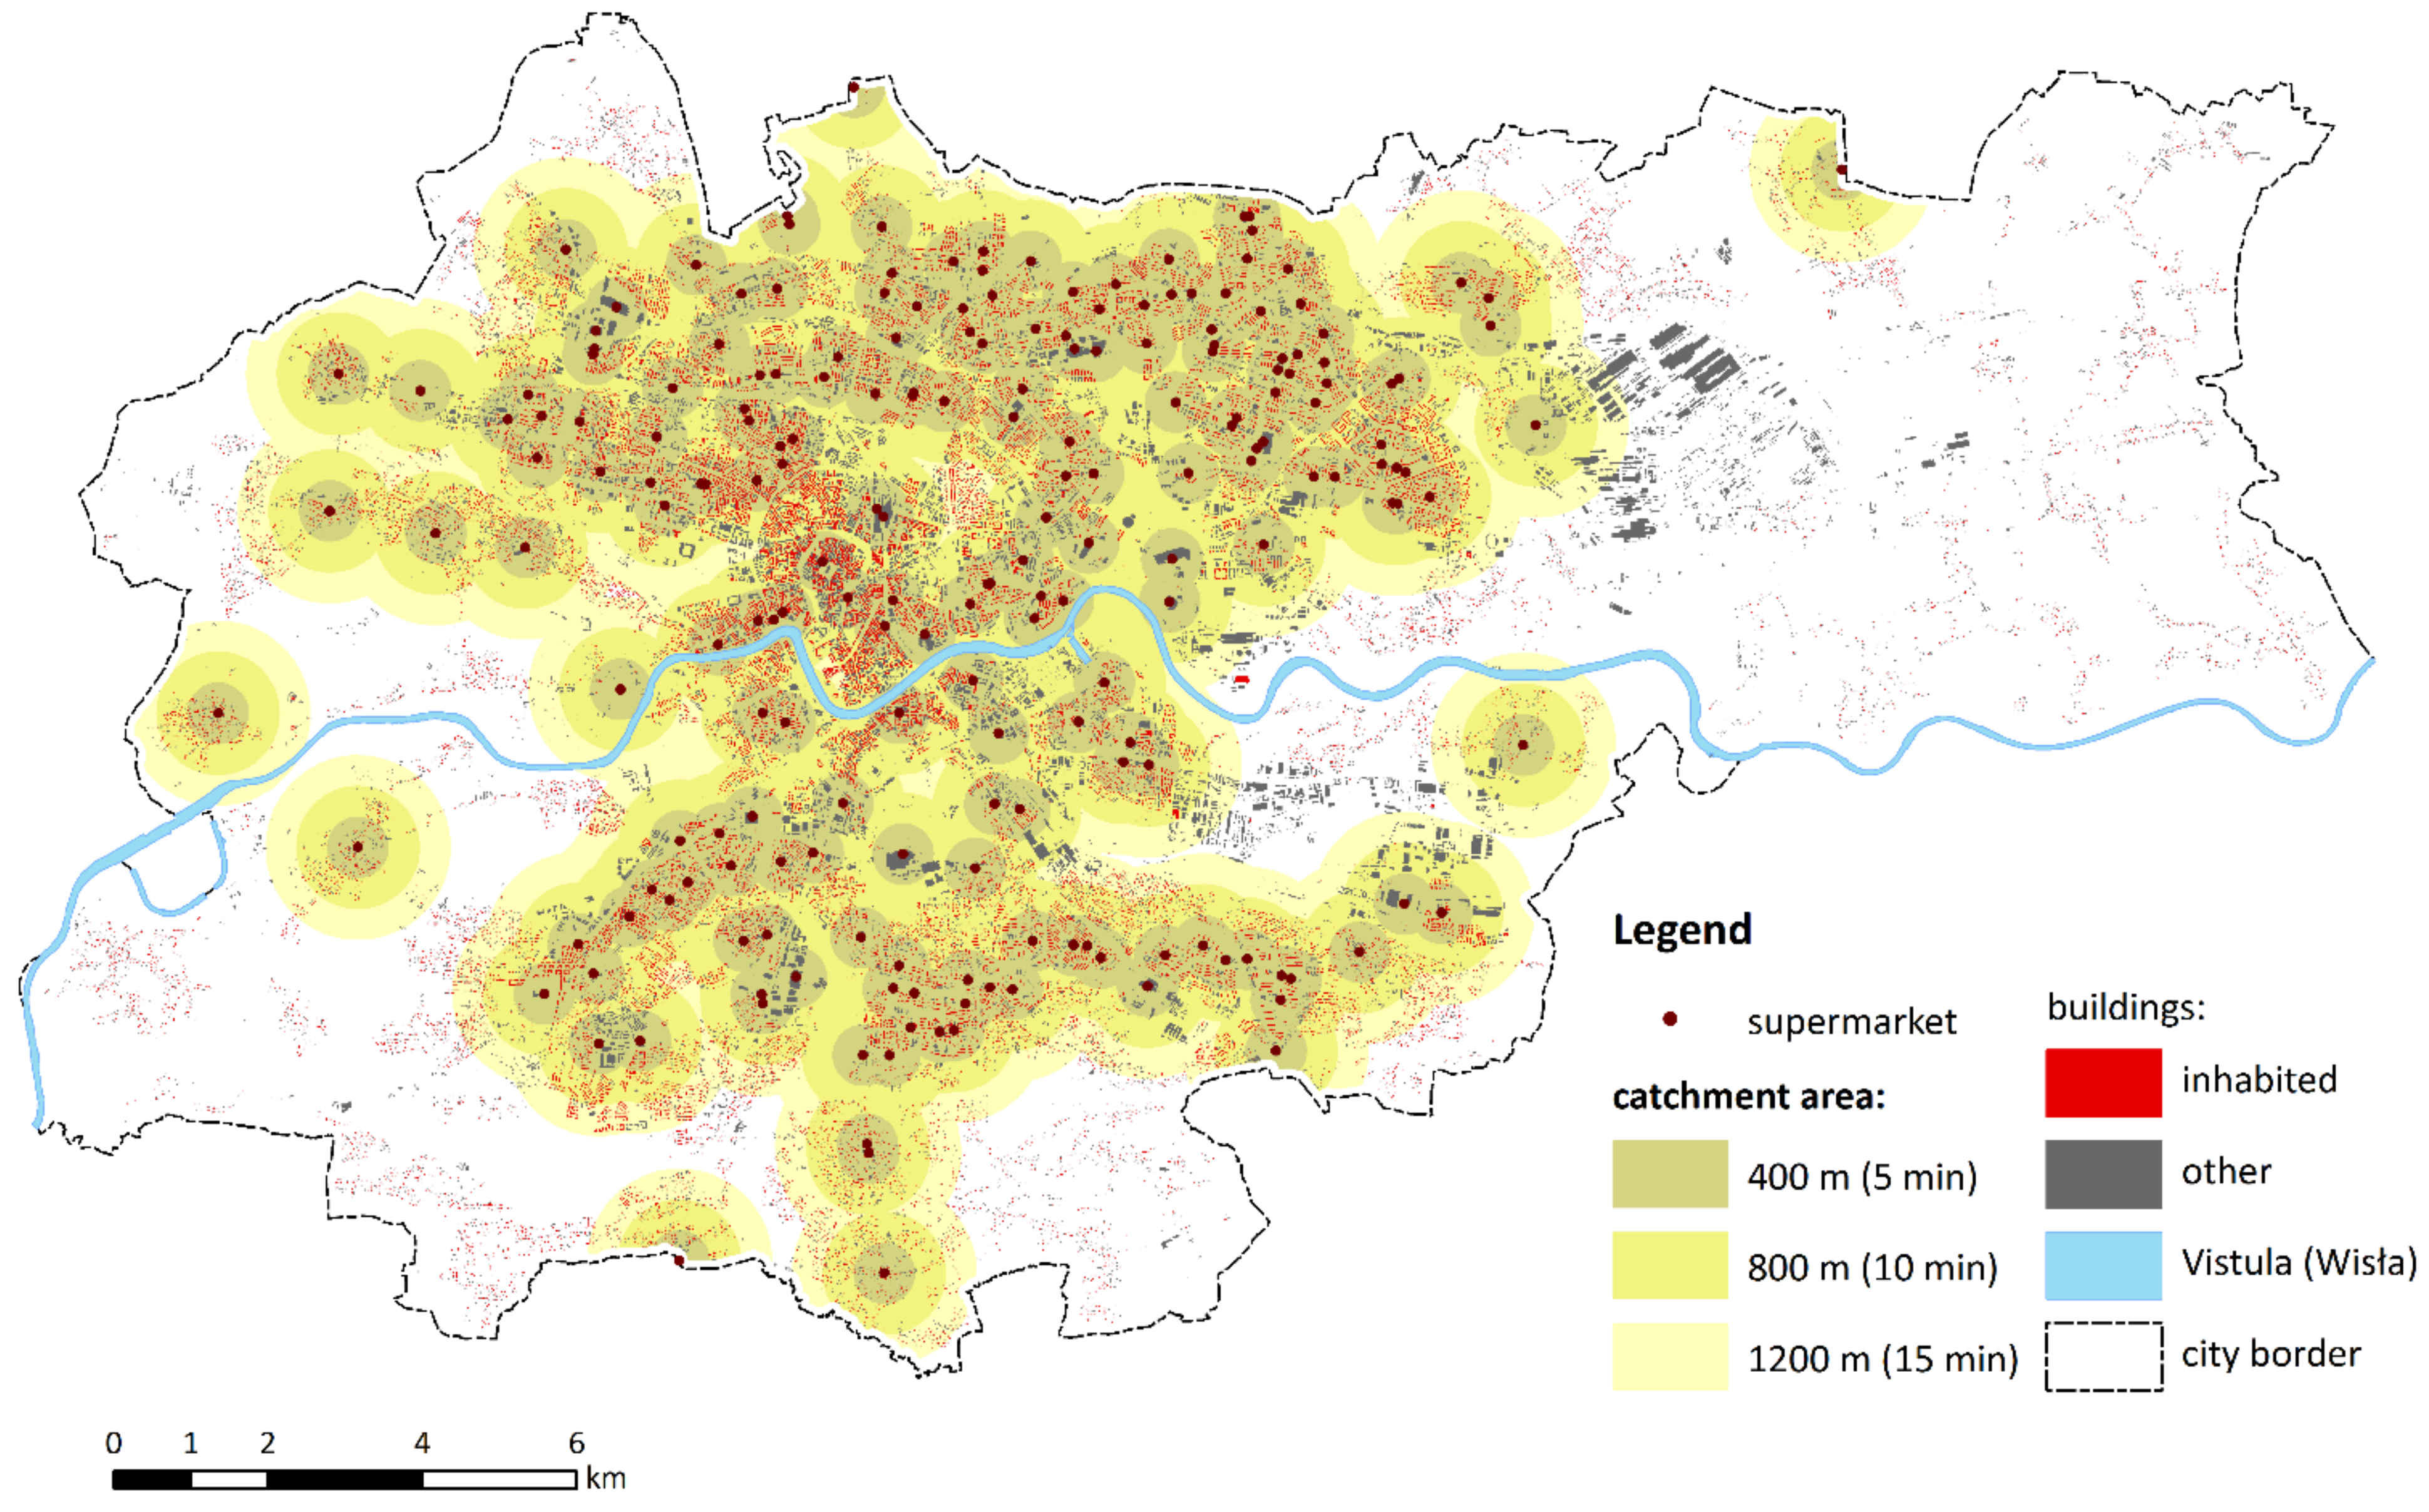
Figure A17. Supermarkets.
Sustainability 14 07103 g0a17
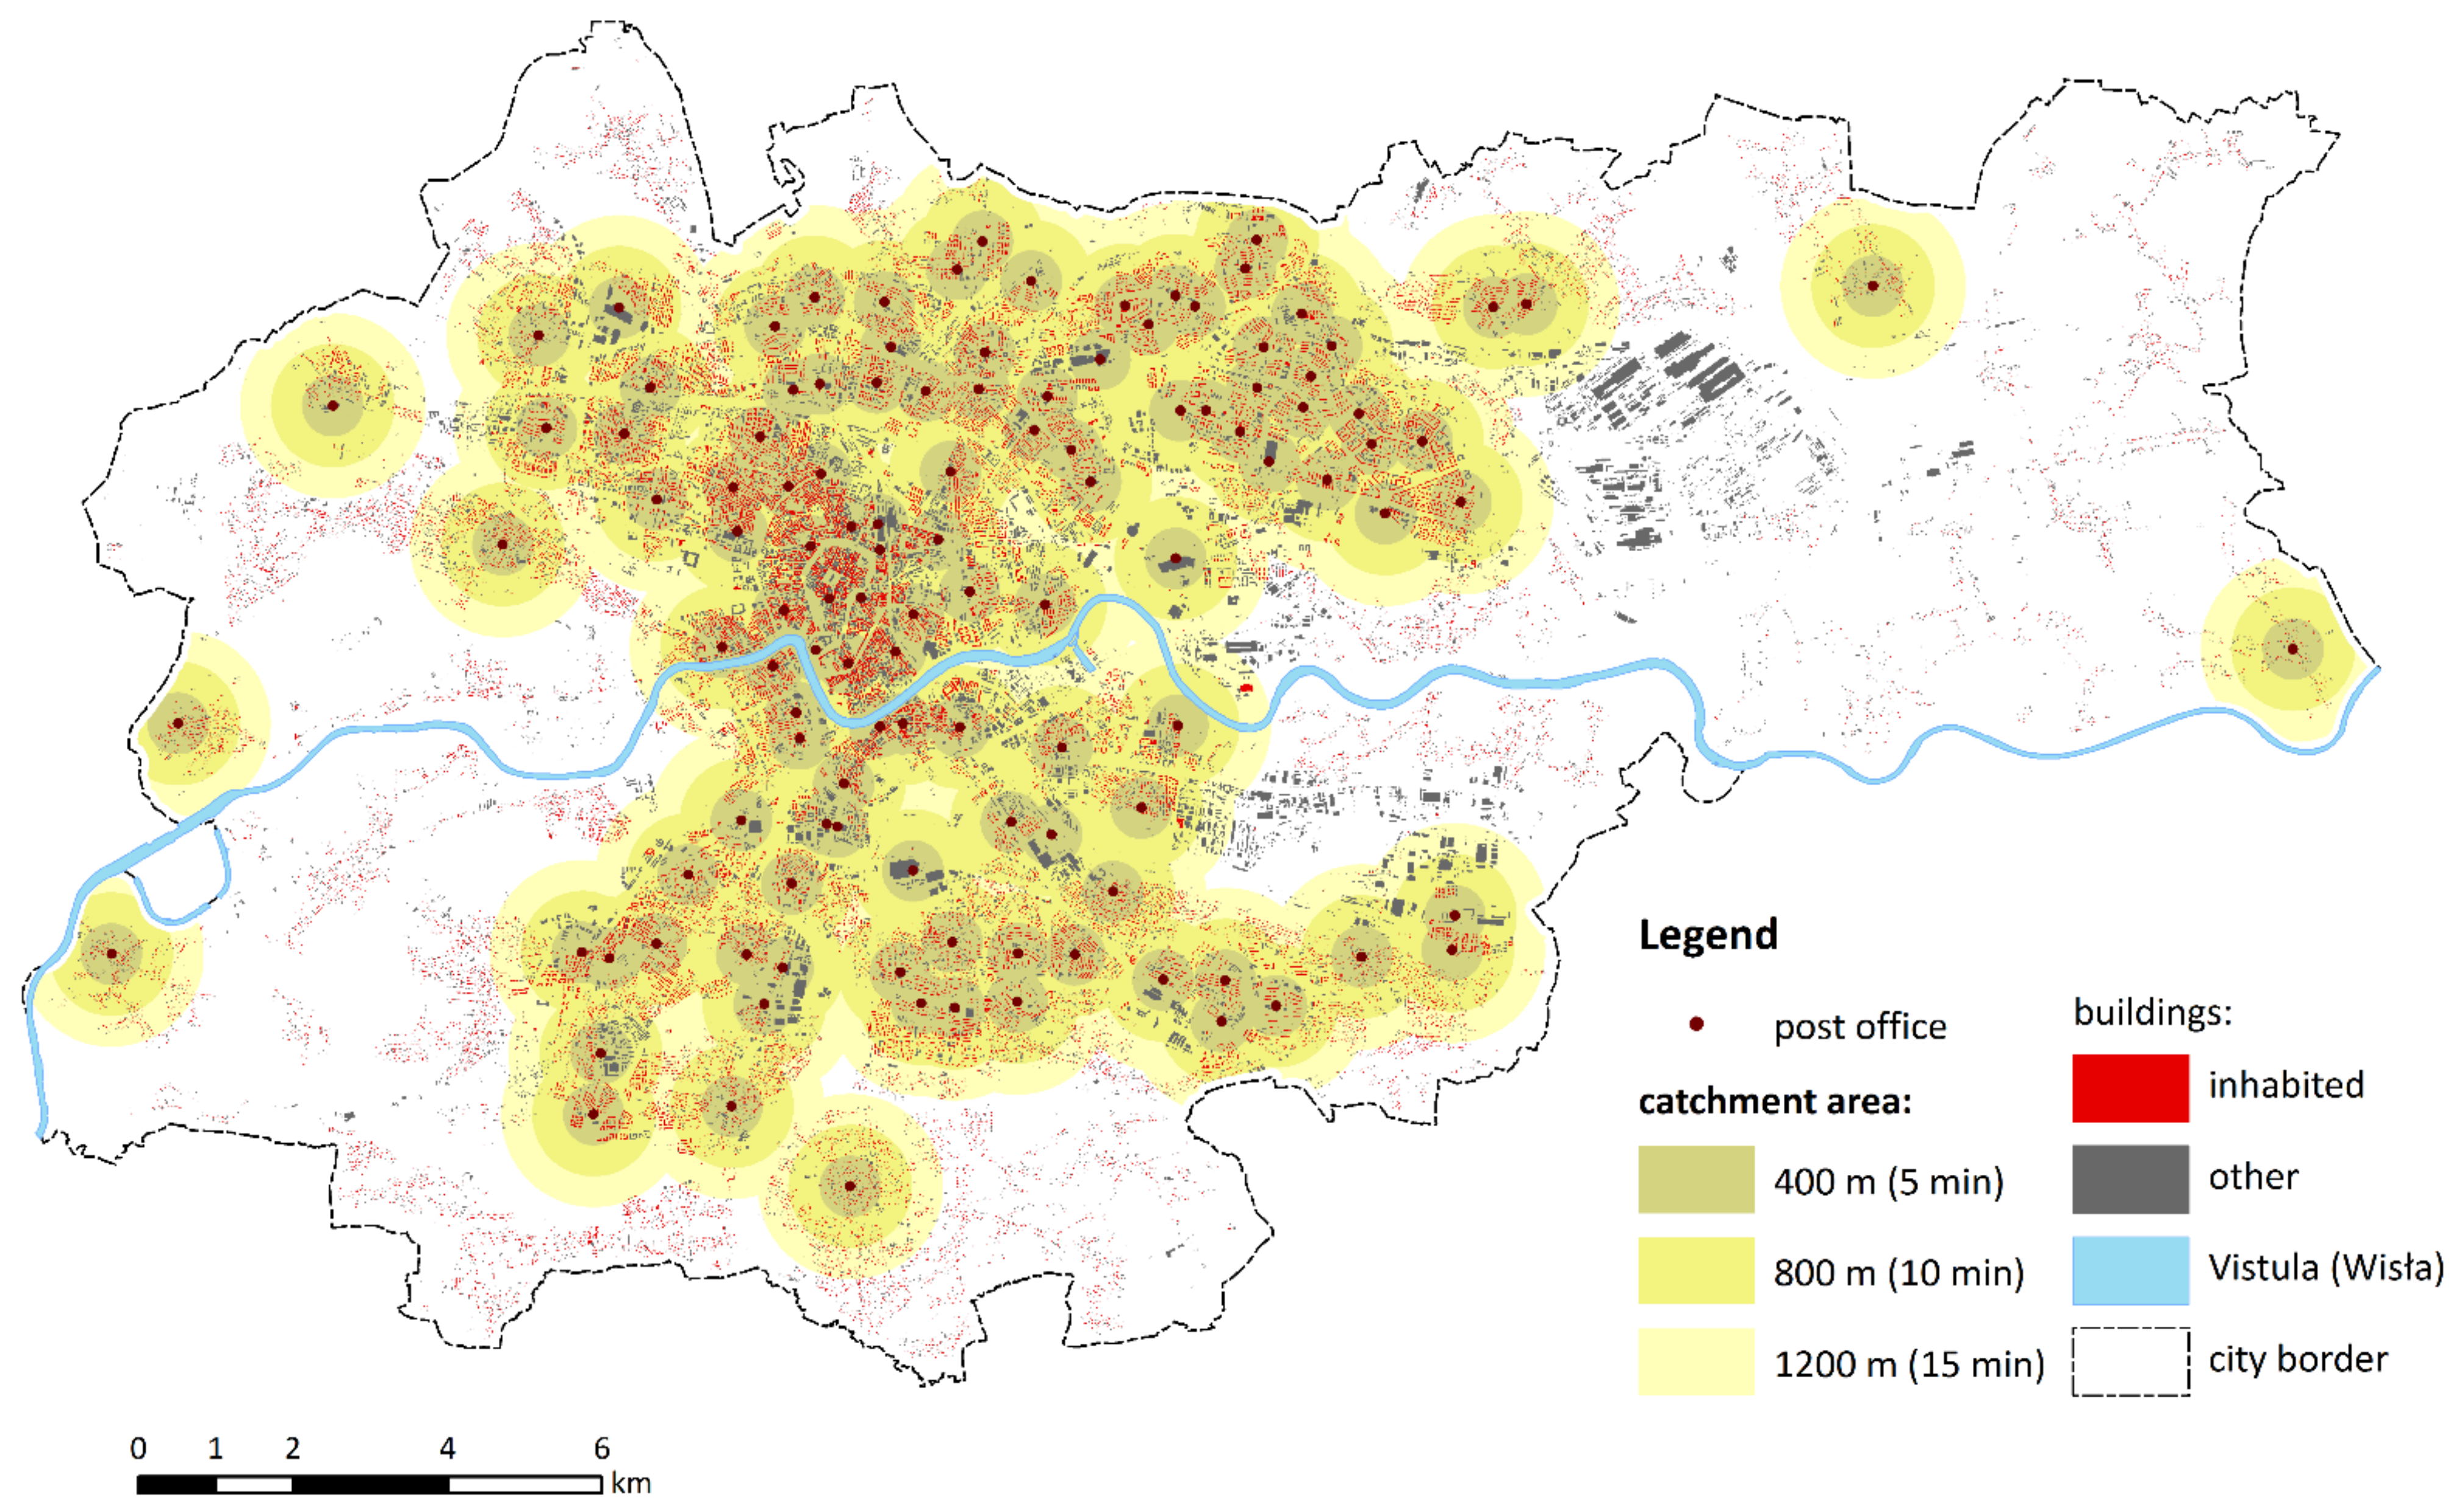
Figure A18. Post offices.
Sustainability 14 07103 g0a18
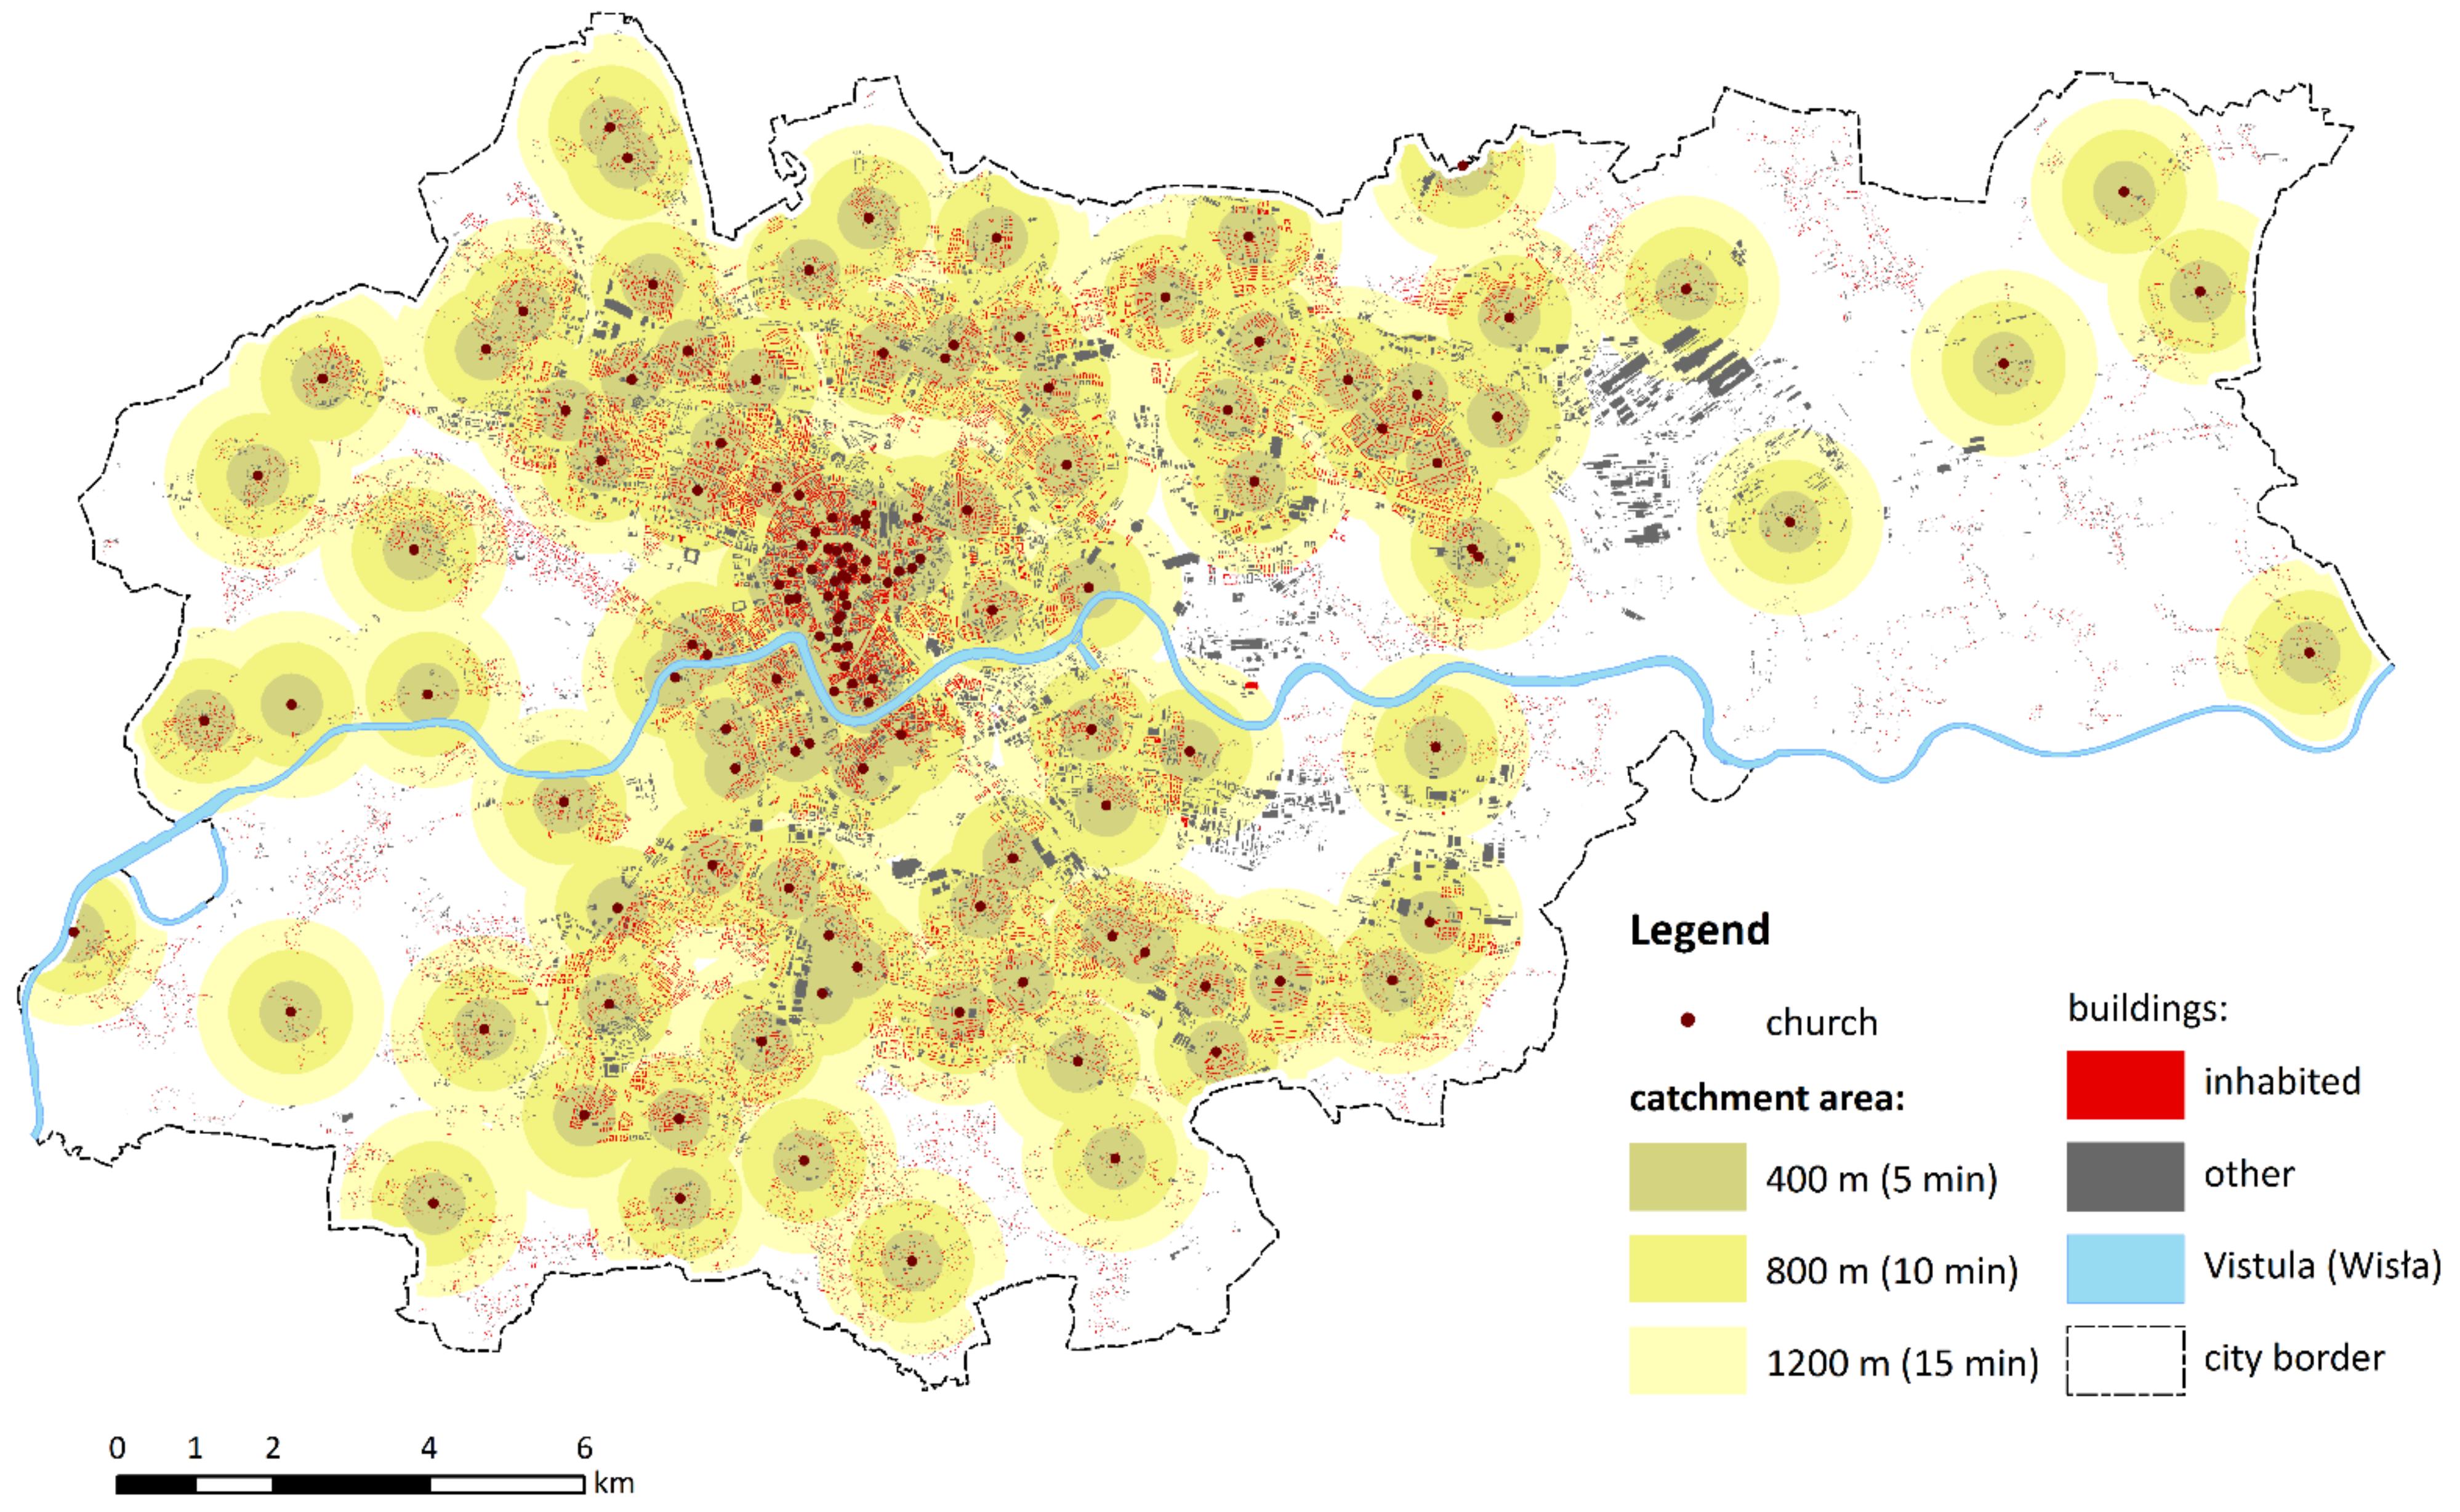
Figure A19. Catholic churches.
Sustainability 14 07103 g0a19
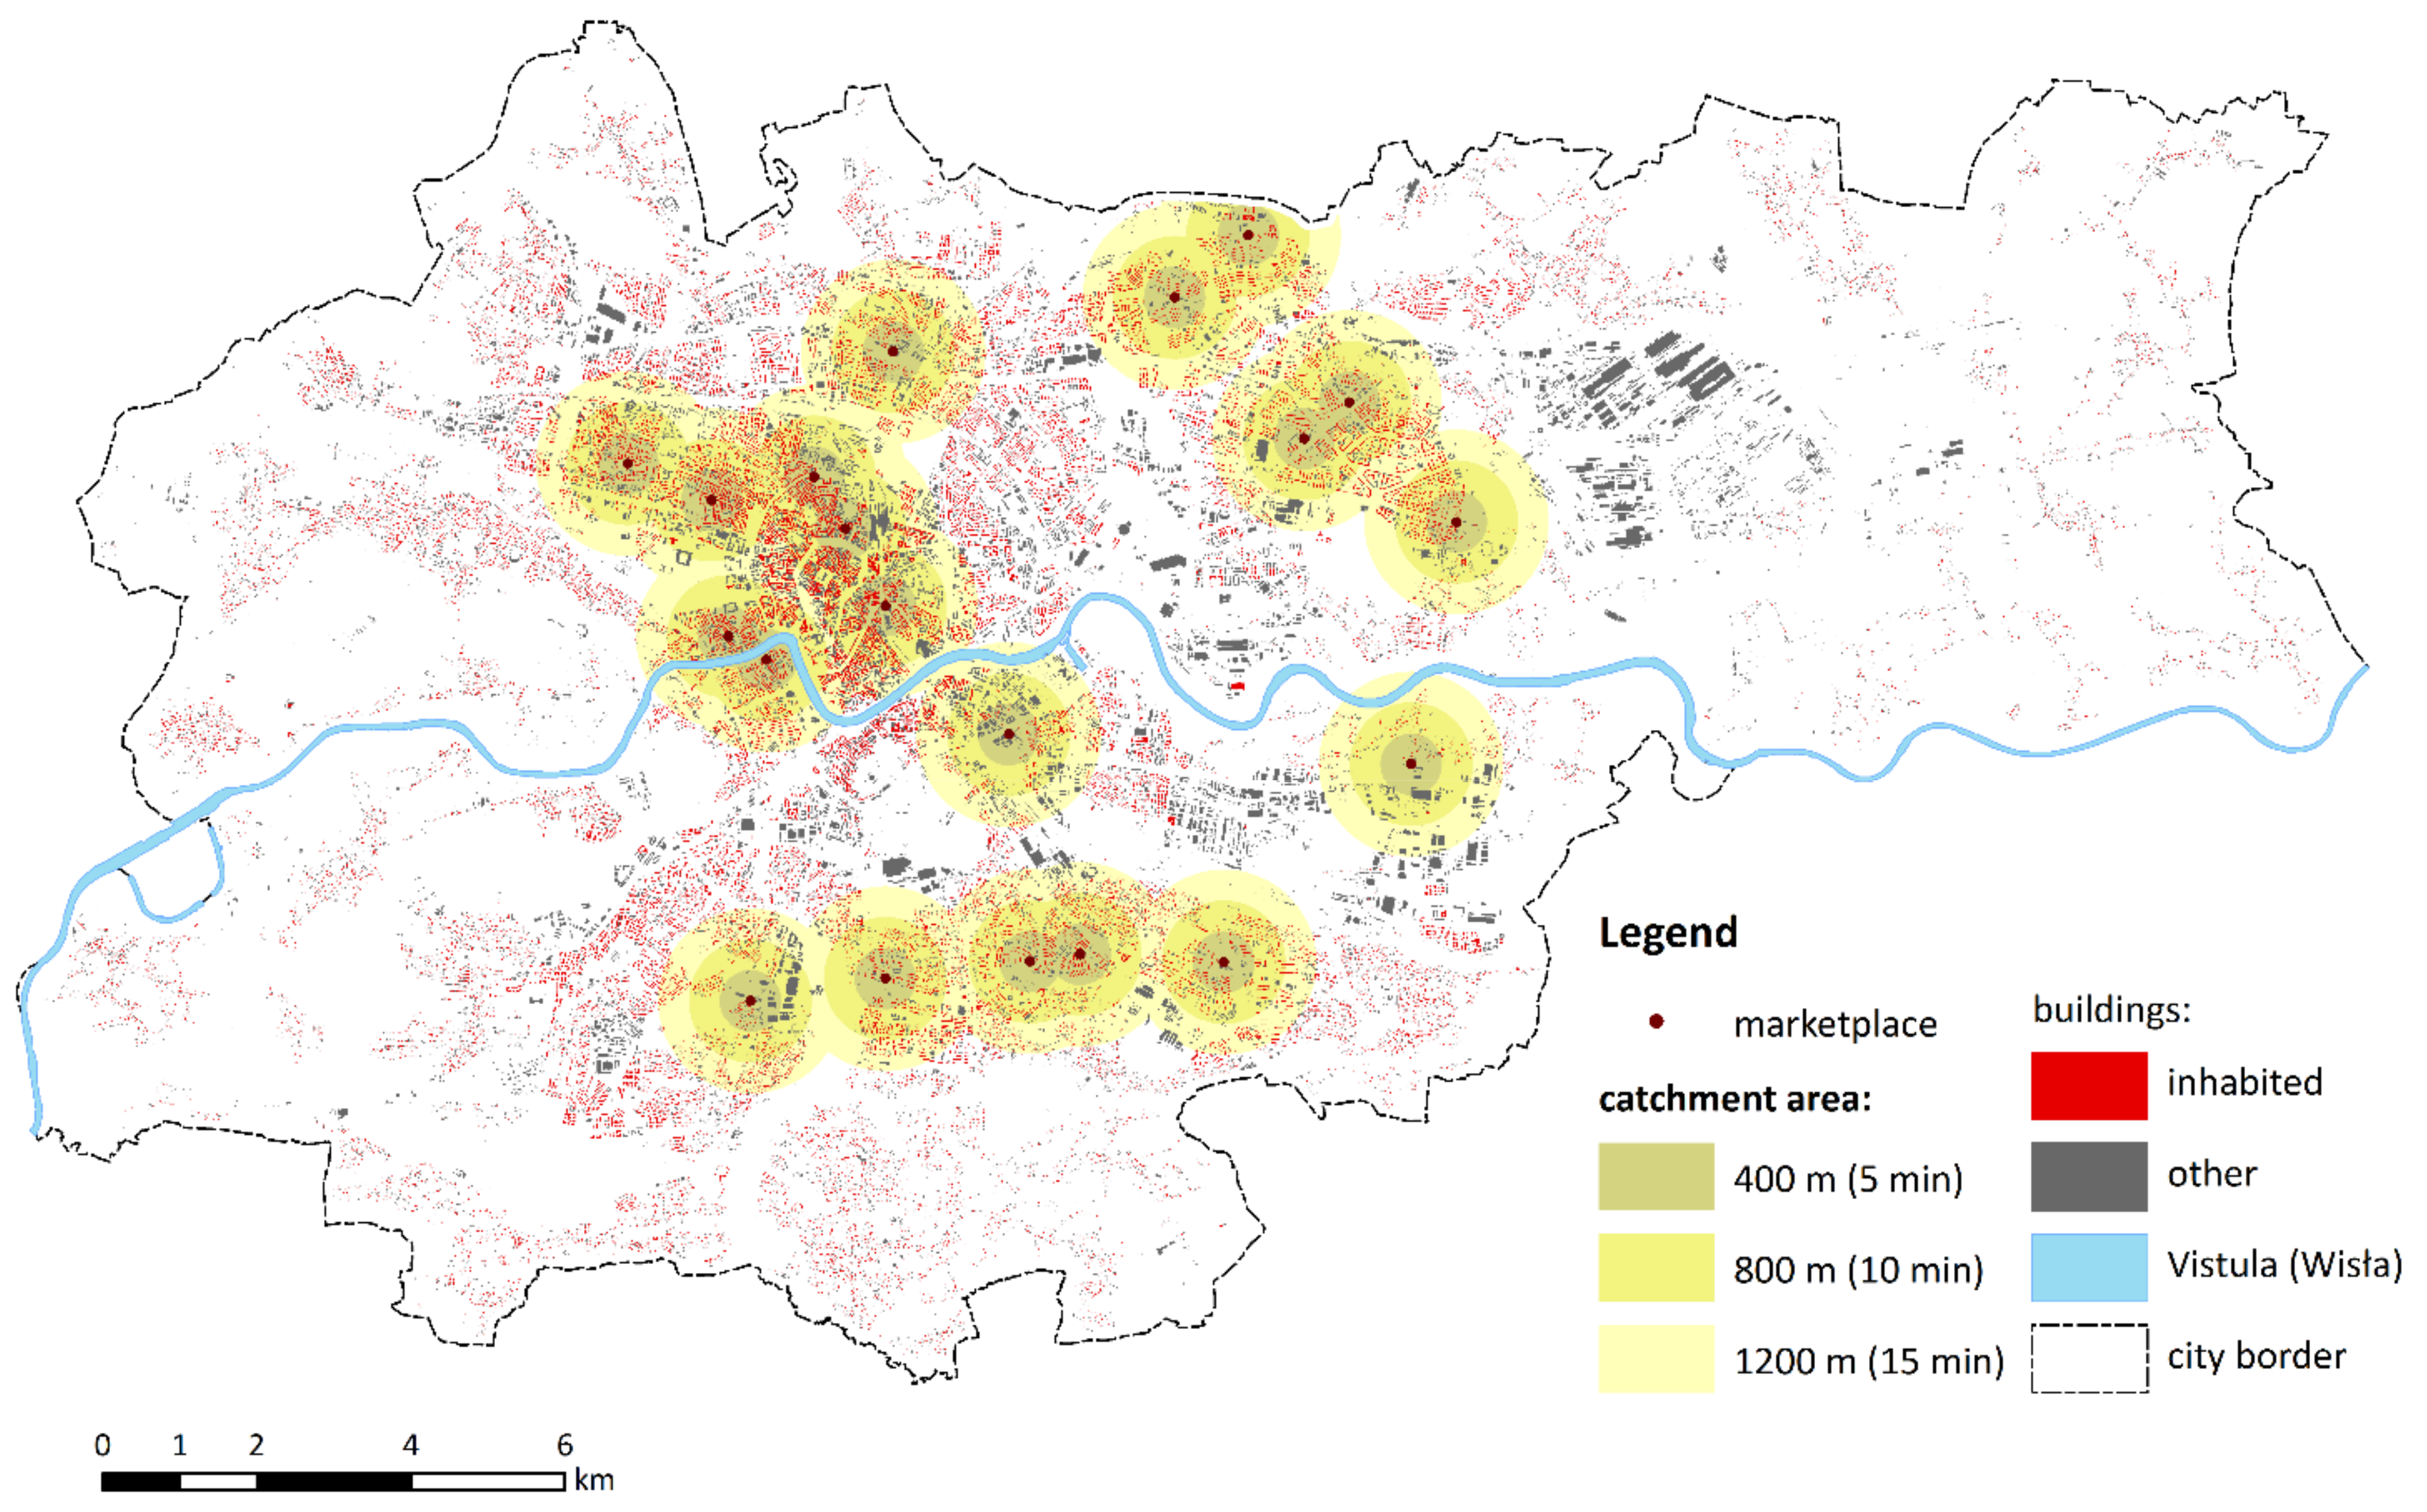
Figure A20. Marketplaces.
Sustainability 14 07103 g0a20
Figure A21. Restaurants.
Sustainability 14 07103 g0a21
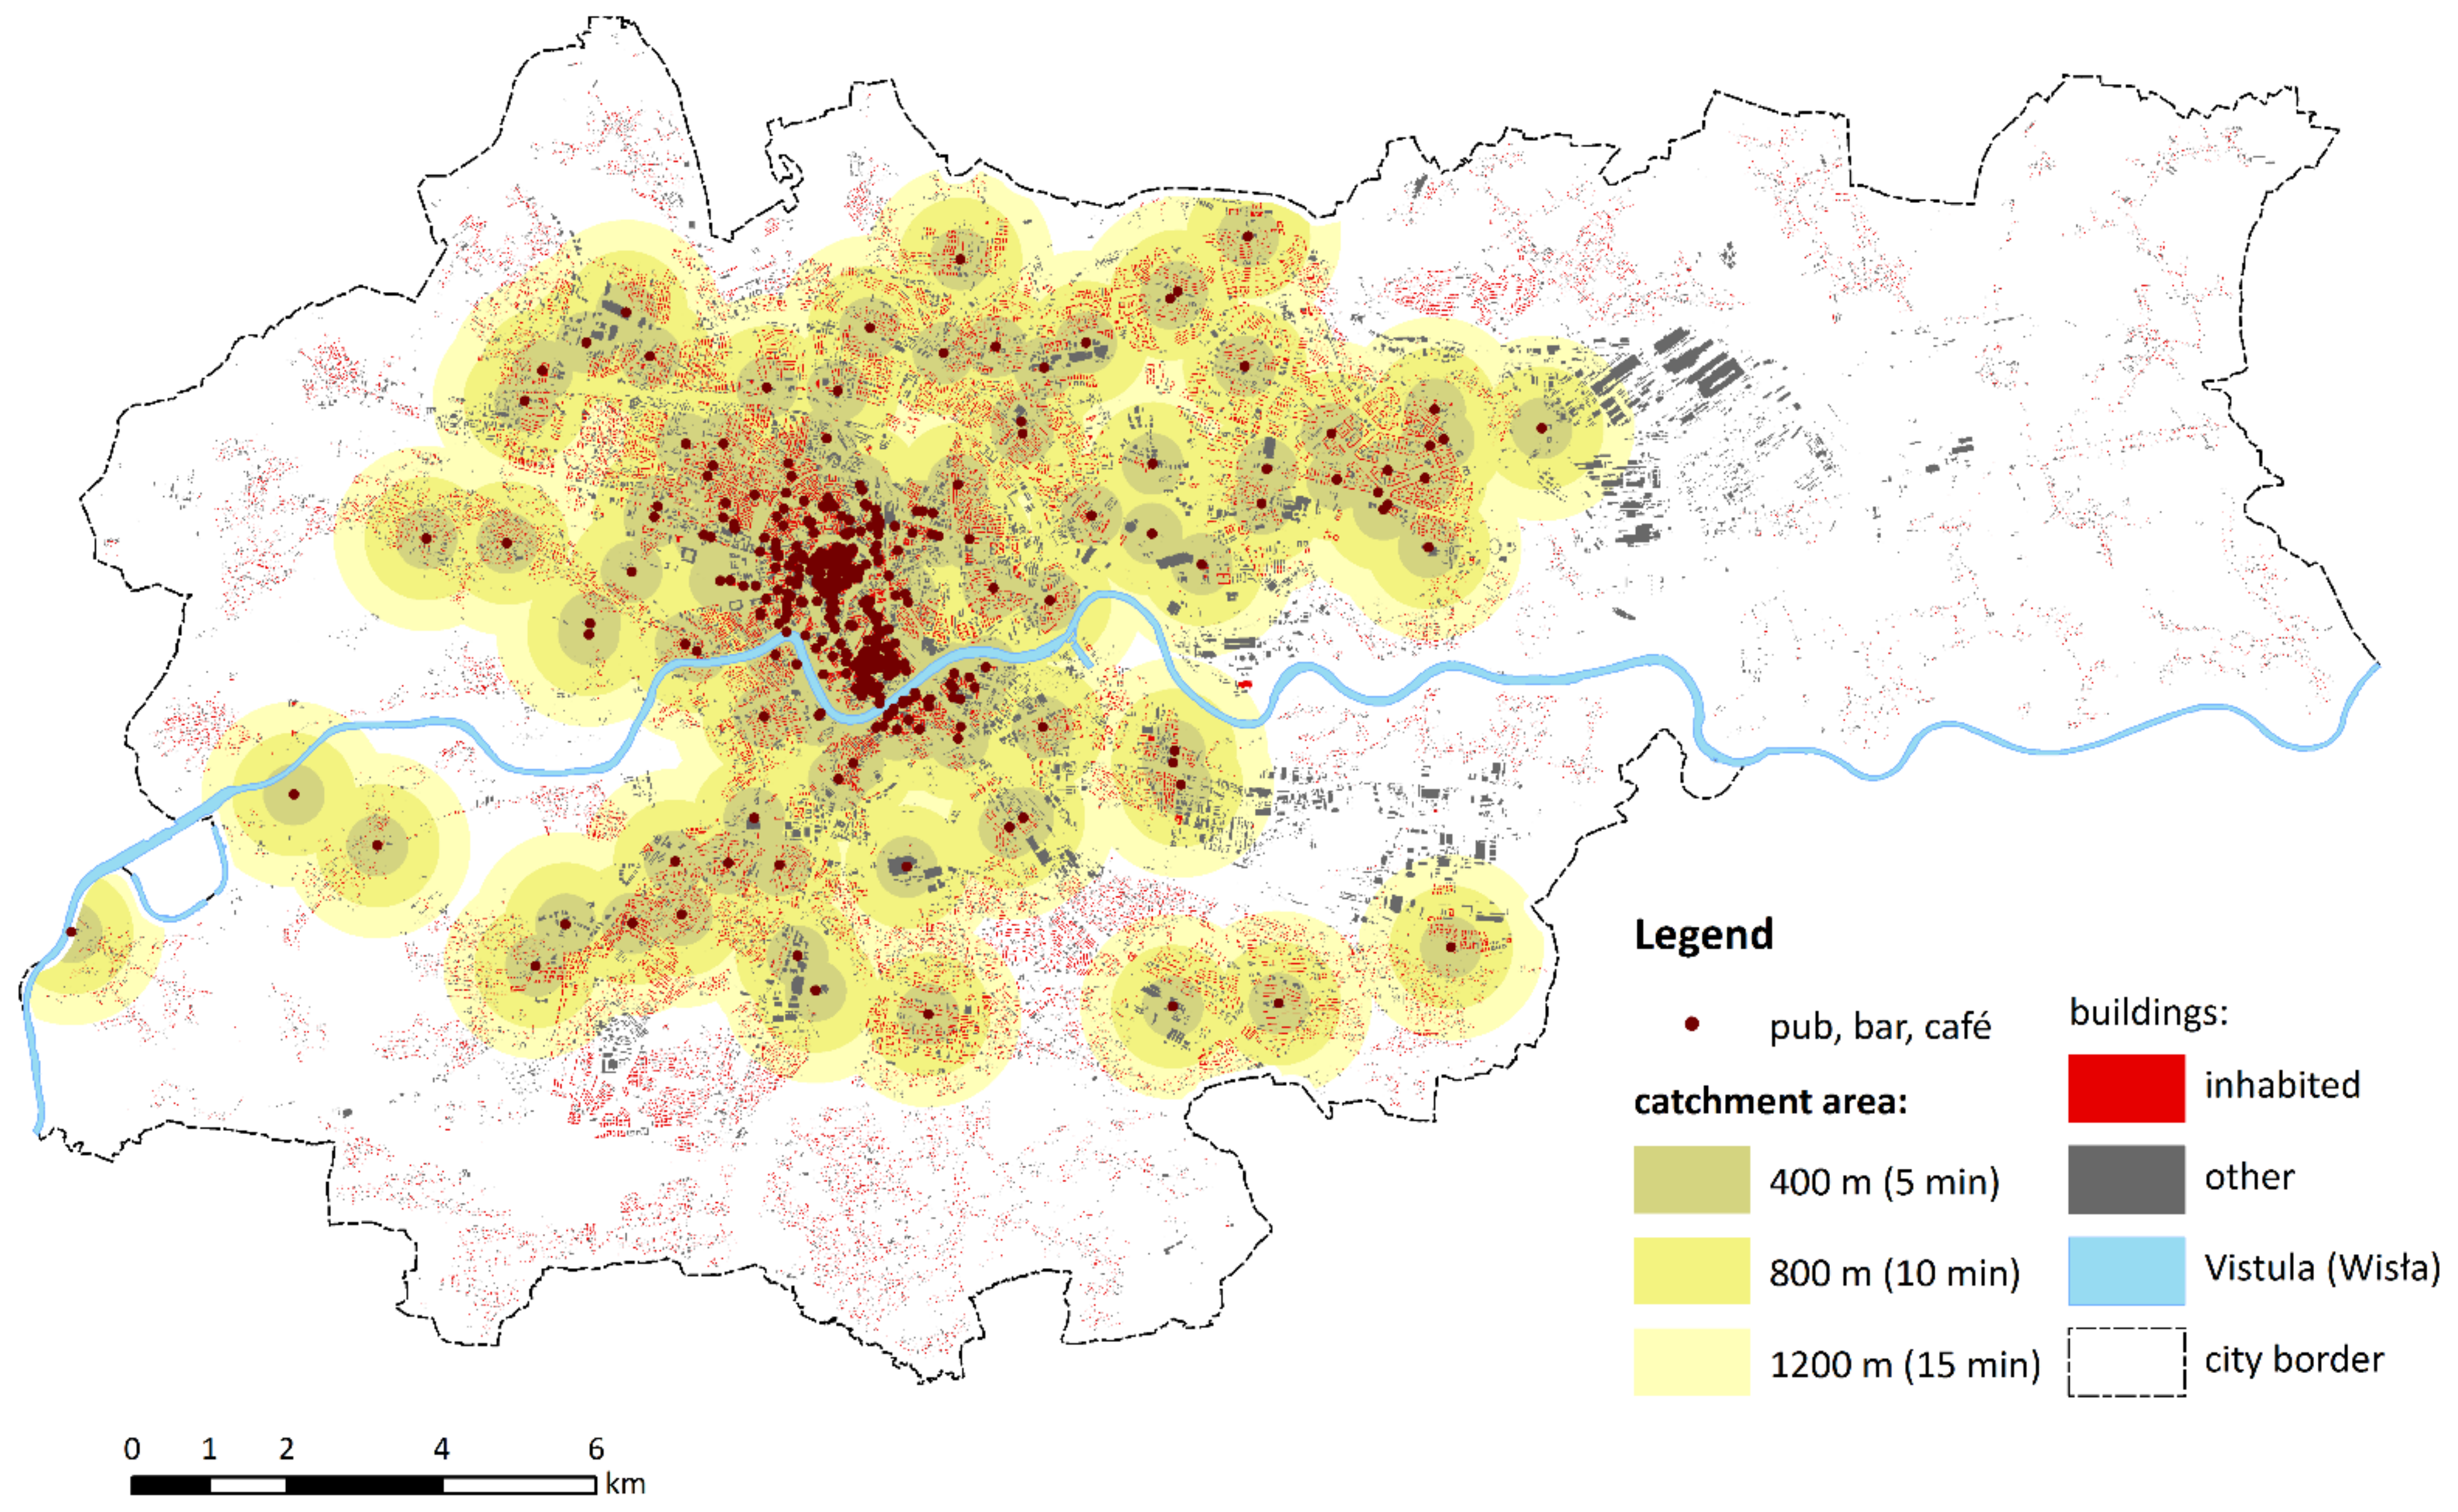
Figure A22. Pubs, bars, cafés.
Sustainability 14 07103 g0a22
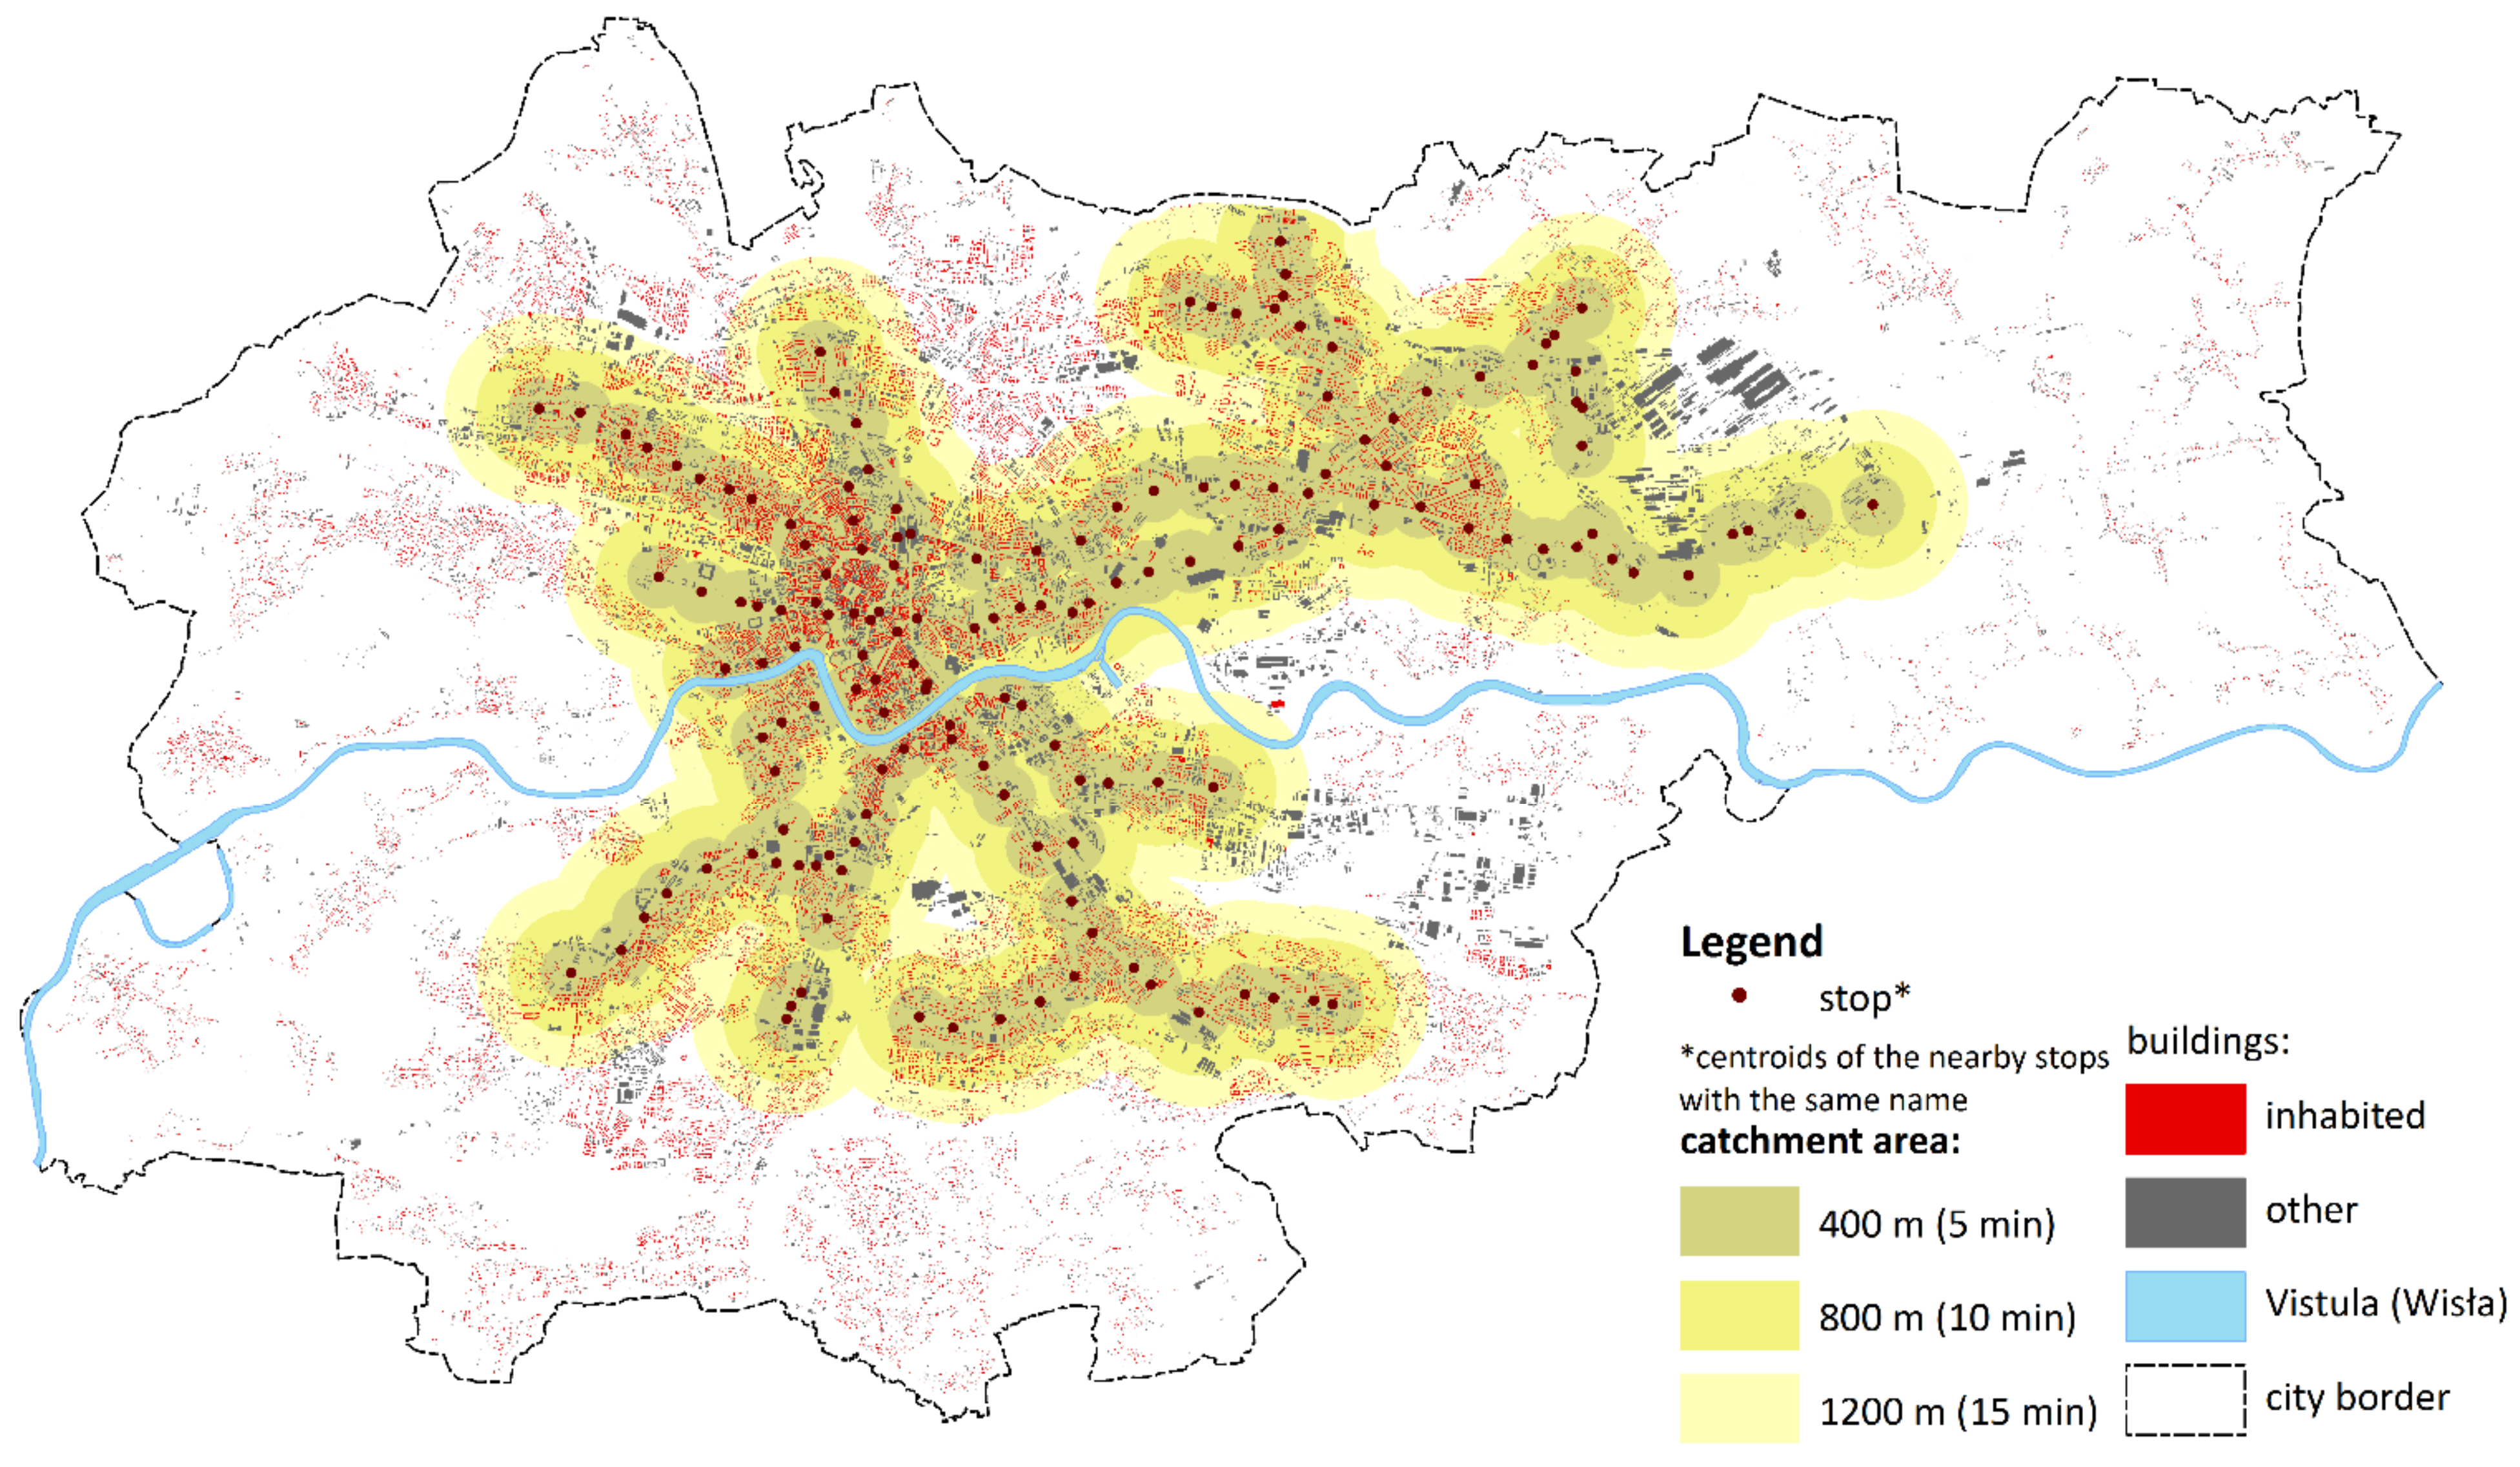
Figure A23. Public transport stops (trams and buses).
Sustainability 14 07103 g0a23
Figure A24. Tram stops.
Sustainability 14 07103 g0a24
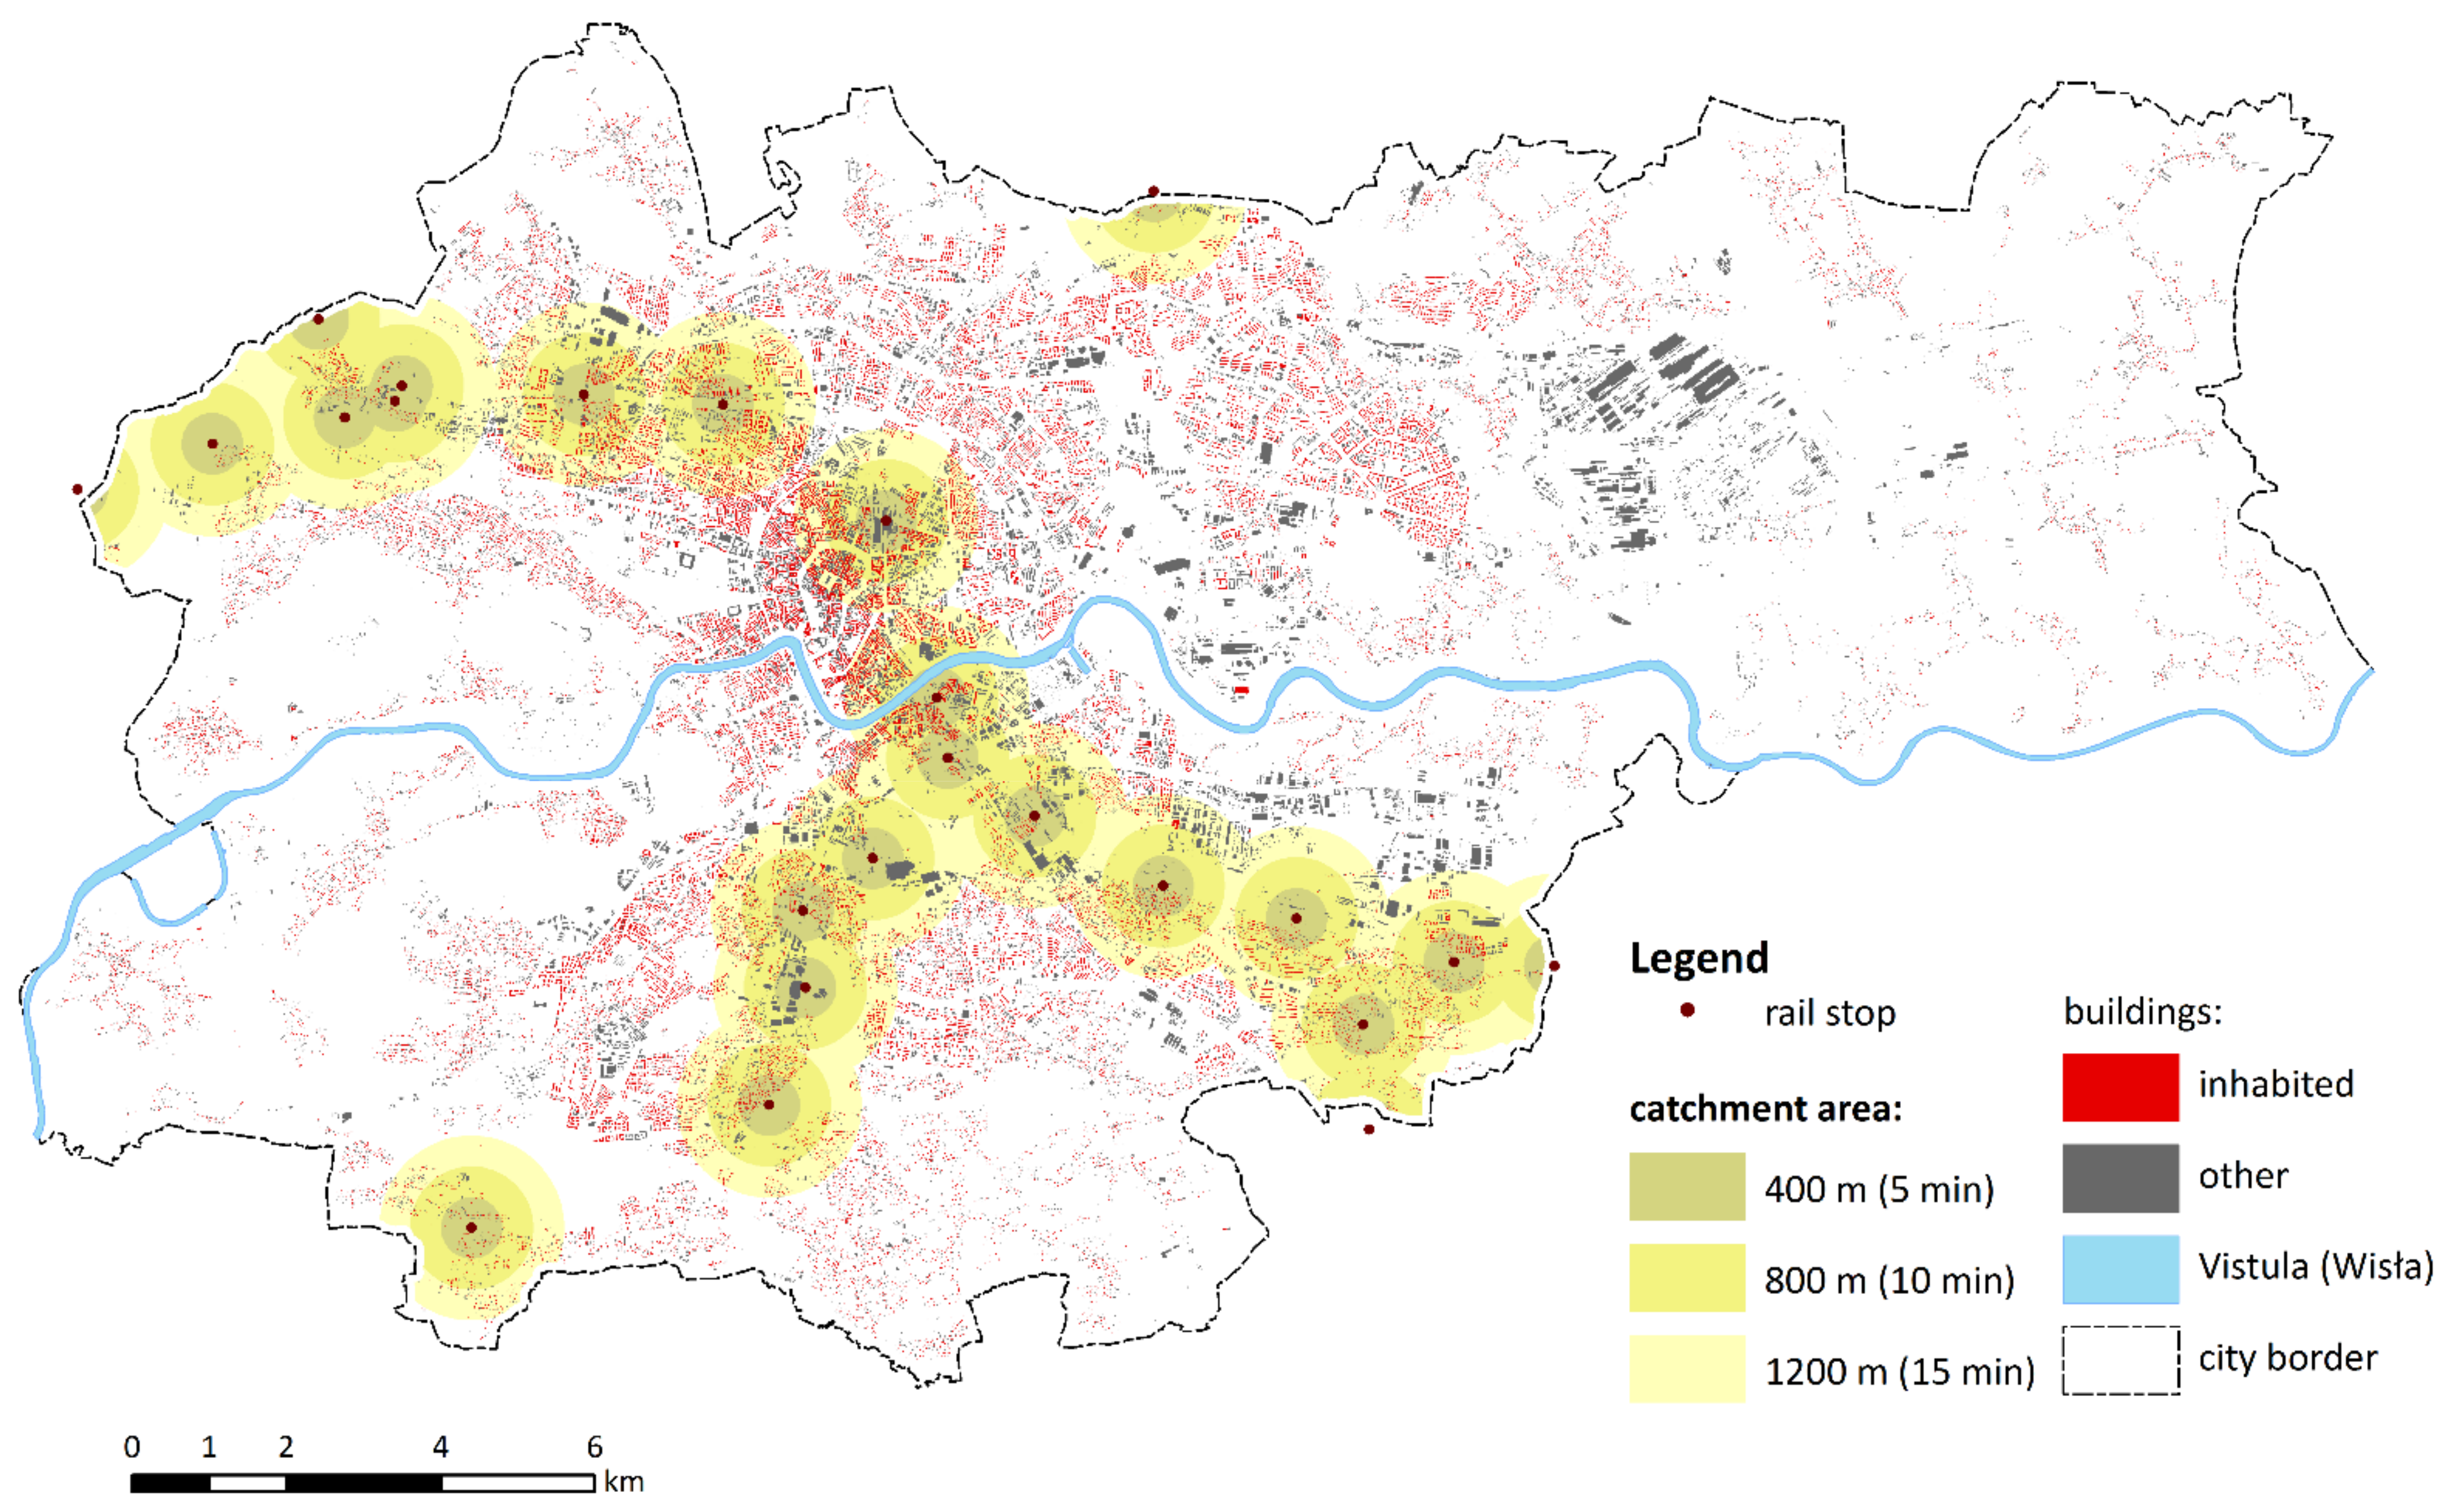
Figure A25. Rapid transit/commuter rail stops.
Sustainability 14 07103 g0a25

References

  1. Moreno, C.; Allam, Z.; Chabaud, D.; Gall, C.; Prationg, F. Introducing the “15-minute City”: Sustainability, Resilience and Place Identity in Future Post-Pandemic Cities. Smart Cities 2021, 4, 93–111. [Google Scholar] [CrossRef]
  2. A Collection Dedicated to the 15-Minute City; Entrepreneurship Territory Innovation Chair, Sorbonne Business School. Paris 1 Panthéon-Sorbonne: Paris, France, 2020. Available online: https://chaire-eti.org/wp-content/uploads/2021/01/15-minute-city-collection.pdf (accessed on 21 March 2022).
  3. Perry, C.A. Housing for the Machine Age; Russell Sage Foundation: New York, NY, USA, 1939. [Google Scholar]
  4. Jacobs, J. The Death and Life of Great American Cities; Random House Inc.: New York, NY, USA, 1961. [Google Scholar]
  5. Talen, E. (Ed.) Charter of the New Urbanism: Congress for the New Urbanism, 2nd ed.; McGraw Hill Professional: New York, NY, USA, 2013. [Google Scholar]
  6. United Nations. Transforming Our World: The 2030 Agenda for Sustainable Development (A/RES/70/1); United Nations: New York, NY, USA, 2015; Available online: https://sustainabledevelopment.un.org/content/documents/21252030%20Agenda%20for%20Sustainable%20Development%20web.pdf (accessed on 24 March 2022).
  7. United Nations. New Urban Agenda, Habitat III; United Nations: New York, NY, USA, 2016; Available online: https://habitat3.org/the-new-urban-agenda (accessed on 4 March 2022).
  8. The New Leipzig Charter. The Transformative Power of Cities for the Common Good, Adopted at the Informal Meeting of EU Urban Affairs Ministers on 30 November 2020. Available online: https://ec.europa.eu/regional_policy/en/newsroom/news/2020/12/12-08-2020-new-leipzig-charter-the-transformative-power-of-cities-for-the-common-good (accessed on 4 March 2022).
  9. O’Sullivan, F. Paris Mayor: It’s Time for a “15-Minute City”. Available online: https://www.bloomberg.com/news/articles/2020-02-18/paris-mayor-pledges-a-greener-15-minute-city (accessed on 11 March 2022).
  10. Open Streets. Strategies, Actions and Tools for Cycling and Walking, Ensuring Distancing Measures within the Urban Travel and Towards a Sustainable Mobility. Available online: https://www.comune.milano.it/documents/20126/7117896/Open+streets.pdf/d9be0547-1eb0-5abf-410b-a8ca97945136?t=1589195741171 (accessed on 11 March 2022).
  11. Nuestro Compromiso de Hacer de Buenos Aires Una Ciudad a Escala Humana. Available online: https://www.buenosaires.gob.ar/noticias/nuestro-compromiso-de-hacer-de-buenos-aires-una-ciudad-escala-humana (accessed on 11 March 2022).
  12. The Portland Plan. Prosperous. Educated. Healthy. Equitable. Available online: https://www.portlandonline.com/portlandplan/index.cfm?c=58776 (accessed on 11 March 2022).
  13. Plaza de Mercado Siete de Agosto. Available online: https://www.c40reinventingcities.org/en/students/winning-projects/plaza-de-mercado-siete-de-agosto-1450.html (accessed on 11 March 2022).
  14. Plan Policy. Available online: https://www.cltfuture2040plan.com/content/goal-1-10-minute-neighborhoods-0 (accessed on 11 March 2022).
  15. The New Official Plan. Available online: https://engage.ottawa.ca/the-new-official-plan/news_feed/15-minute-neighbourhoods (accessed on 11 March 2022).
  16. Plan Melbourne 2017–2050. Available online: https://planmelbourne.vic.gov.au/home (accessed on 11 March 2022).
  17. 20-Minute Neighborhoods in Detroit. Available online: https://www.planetizen.com/node/87154/20-minute-neighborhoods-detroit (accessed on 11 March 2022).
  18. The Pulse of Greater Sydney 2020. Available online: https://www.greater.sydney/pulse-of-greater-sydney-2020/pi-2-30-minute-city (accessed on 11 March 2022).
  19. Proposed Ordinance Amendments Available for Public Review/Comment. Available online: https://www.houstontx.gov/planning/Commissions/committee_walkable-places.html (accessed on 11 March 2022).
  20. Barcelona Superblock: New Stage. Available online: https://ajuntament.barcelona.cat/superilles/en/ (accessed on 24 March 2022).
  21. Pozoukidou, G.; Chatziyiannaki, Z. 15-Minute City: Decomposing the New Urban Planning Eutopia. Sustainability 2021, 13, 928. [Google Scholar] [CrossRef]
  22. O’Gorman, S.; Dillion-Robinson, R. 20 Minute Neighbourhoods in a Scottish Context; Climate Exchange Scotland; Ramboll on behalf of Centre of Expertise Connecting Climate Change and Policy: Edinburgh, UK, 2021. [Google Scholar] [CrossRef]
  23. White Paper. Paris Northgates Project. 15 min. City–30 min. Territory; Urban and Territorial Transitions, Entrepreneurship Territory Innovation Chair, Sorbonne Business School. Paris 1 Panthéon-Sorbonne: Paris, France, 2019. Available online: http://chaire-eti.org/wp-content/uploads/2019/12/White-Paper-2019.pdf (accessed on 11 March 2022).
  24. O’Connell, S. Can Dublin Become a 15-Minute City? Available online: https://www.irishtimes.com/special-reports/future-of-our-cities/can-dublin-become-a-15-minute-city-1.4560646 (accessed on 11 March 2022).
  25. English, J. The Commuting Principle That Shaped Urban History. Available online: www.bloomberg.com/news/features/2019-08-29/the-commuting-principle-that-shaped-urban-history (accessed on 24 March 2022).
  26. Marchetti, C. Anthropological Invariants in Travel Behaviour. Technol. Forecast. Chang. 1994, 47, 75–88. [Google Scholar] [CrossRef] [Green Version]
  27. Duany, A.; Steuteville, R. Defining the 15-Minute City, Public Square. Available online: https://www.cnu.org/publicsquare/2021/02/08/defining-15-minute-city (accessed on 20 March 2022).
  28. C40 Cities Climate Leadership Group, C40 Knowledge Hub. 15-minute Cities: How to Create Connected Places. Available online: https://www.c40knowledgehub.org/s/article/15-minute-cities-How-to-create-connected-places?language=en_US (accessed on 20 March 2022).
  29. Gil Solá, A.; Vilhelmson, B. Negotiating Proximity in Sustainable Urban Planning: A Swedish Case. Sustainability 2019, 11, 31. [Google Scholar] [CrossRef] [Green Version]
  30. C40 Cities Climate Leadership Group, C40 Knowledge Hub. 15-minute Cities: How to Ensure a Place for Everyone. Available online: https://www.c40knowledgehub.org/s/article/15-minute-cities-How-to-ensure-a-place-for-everyone?language=en_US (accessed on 24 March 2022).
  31. 15-Minute City: Urban Mobility Solution to the Environment. Available online: https://www.intertraffic.com/news/15-minute-city-urban-mobility-solution-to-environment/ (accessed on 20 March 2022).
  32. C40 Cities Climate Leadership Group, C40 Knowledge Hub. How to Build Back Better with a 15-Minute City. Available online: https://www.c40knowledgehub.org/s/article/How-to-build-back-better-with-a-15-minute-city?language=en_US (accessed on 24 March 2022).
  33. Śleszyński, P. Dostępność czasowa i jej zastosowania. Przegląd Geogr. 2014, 86, 171–215. Available online: https://rcin.org.pl/dlibra/show-content/publication/edition/47053?id=47053 (accessed on 20 March 2022). [CrossRef]
  34. Micek, G. Bliskość Geograficzna Przedsiębiorstw Zaawansowanego Przemysłu i Usług a Przepływy Wiedzy; IGiGP UJ: Krakow, Poland, 2017. [Google Scholar]
  35. Taylor, Z. Dostępność miejsc pracy, nauki i usług w obszarach wiejskich jako przedmiot badań geografii społeczno-ekonomicznej—Próba analizy krytycznej. Przegląd Geogr. 1979, 69, 261–283. [Google Scholar]
  36. Guzik, R. Przestrzenna Dostępność Szkolnictwa Ponadpodstawowego; Instytut Geografii i Gospodarki Przestrzennej UJ: Krakow, Poland, 2003. [Google Scholar]
  37. Wiśniewski, R.; Marcińczak, S.; Goliszek, S.; Stępniak, M. Dostępność Przestrzenna do Usług Publicznych w Polsce; Prace Geograficzne no. 261; IGIPZ PAN: Warsaw, Poland, 2017. [Google Scholar]
  38. Haugen, K. The Accessibility Paradox. Everyday Geographies of Proximity, Distance and Mobility. Ph.D. Dissertation, Department of Geography and Economic History, Umeå University, Umeå, Sweden, 2012. [Google Scholar]
  39. Hoogendoorn, S.P.; Daamen, W.; Transportation Research Board. Free Speed Distributions for Pedestrian Traffic. In Proceedings of the Transportation Research Board 85st Annual Meeting (TRB 2006), Washington, DC, USA, 22–26 January 2006; pp. 1–13. [Google Scholar]
  40. Moreno, C. The 15 Minutes-City: For a New Chrono-Urbanism! Available online: https://www.moreno-web.net/the-15-minutes-city-for-a-new-chrono-urbanism-pr-carlos-moreno/ (accessed on 11 March 2022).
  41. Sisson, P. What Is a 15-Minute City? Available online: https://citymonitor.ai/environment/what-is-a-15-minute-city (accessed on 24 March 2022).
  42. C40 Cities Climate Leadership Group, C40 Knowledge Hub, 15-minute Cities: How to Create ‘Complete’ Neighbourhoods. Available online: https://www.c40knowledgehub.org/s/article/15-minute-cities-How-to-create-complete-neighbourhoods?language=en_US (accessed on 24 March 2022).
  43. Lydon, M.; Garcia, A. Tactical Urbanism: Short-Term Action, Long-Term Change; Island Press: Washington, DC, USA, 2015; Volume 2. [Google Scholar]
  44. Purchla, J. Jak Powstawał Nowoczesny Krakow. Studia nad Rozwojem Budowlanym Miasta w Okresie Autonomii Galicyjskiej; Wydawnictwo Literackie: Krakow, Poland, 1979; pp. 52–53, 210–211. [Google Scholar]
  45. Sumorok, A. The idea of the socialist city. The case of Nowa Huta. Czasopismo Techniczne. Architektura 2015, 112, 303–340. [Google Scholar]
  46. Gorczyca, K. Wielkie Osiedla Mieszkaniowe -Diagnoza Stanu Obecnego, Podejmowane Działania Rewitalizacyjne Rewitalizacja Miast Polskich, Przestrzenne Aspekty Rewitalizacji: Śródmieścia, Blokowiska, Tereny Poprzemyslowe, Pokolejowe I Powojskowe; Jarczewski, W., Ed.; Instytut Rozwoju Miast: Krakow, Poland, 2009; pp. 89–124. [Google Scholar]
  47. Pluta, M. Spatial planning in Poland in the context of ‘inspire’ rules and amendment to the Spatial Planning and Development Act. Geomat. Landmanag. Landsc. 2016, 4, 159–168. [Google Scholar] [CrossRef]
  48. Bank Danych Lokalnych. Główny Urząd Statystyczny. Available online: https://bdl.stat.gov.pl (accessed on 7 May 2022).
  49. Izdebski, H. Ideologia i Zagospodarowanie Przestrzeni; LEX Wolter Kluwer Polska: Warsaw, Poland, 2013; pp. 124–135. [Google Scholar]
  50. Paszkowski, Z. Tendencje w rozwoju polskiej urbanizacji. In Przestrzeń Życia Polaków; Sepioł, J., Ed.; SARP: Warsaw, Poland; pp. 15–36. Available online: http://www.sarp.org.pl/pliki/1908_53fdc64bb3140-pzp_spistresci_1.pdf (accessed on 7 May 2022).
  51. Raport o Ekonomicznych Stratach i Społecznych Kosztach Niekontrolowanej Urbanizacji w Polsce 2014. Available online: https://frdl.org.pl/static/upload/store/import/pliki/frdl/document/zalaczniki_artykuly/Raport_Ekonomiczny_29.10.2013_calosc.pdf (accessed on 7 May 2022).
  52. Weng, M.; Ding, N.; Li, J.; Jin, X.; Xiao, H.; He, Z.; Su, S. The 15-minute walkable neighbourhoods: Measurement, social inequalities and implications for building healthy communities in urban China. J. Transp. Health 2019, 13, 259–273. [Google Scholar] [CrossRef]
  53. Happach, M. (Ed.) Czy Żyjemy Lokalnie? Raporty z Planowania Warszawy; Warsaw City Council: Warsaw, Poland, 2021; Available online: https://architektura.um.warszawa.pl/documents/12025039/21022710/RAPORT_Z_PLANOWANIA_WARSZAWY_cz.4_Czy+żyjemy+lokalnie.pdf/60305769-0713-7bf6-d2fb-828e941eeb7e?t=1624471781098 (accessed on 20 March 2022).
  54. Zarządzenie Nr 2282/2019 Prezydenta Miasta Krakowa z dnia 09.09.2019 r. w Sprawie Określenia Kierunków Rozwoju i Zarządzania Terenami Zieleni w Krakowie na Lata 2019–2030. Available online: https://www.bip.krakow.pl/zarzadzenie/2019/2282/ (accessed on 24 March 2022).
  55. Bromley, R.D.F.; Tallon, A.R.; Roberts, A.J. New populations in the British city centre: Evidence of social change from the census and household surveys. Geoforum 2007, 38, 138–154. [Google Scholar] [CrossRef]
  56. Lityński, P.; Hołuj, A. Macroeconomic Perspective on Urban Sprawl: A Multidimensional Approach in Poland. Land 2021, 10, 116. [Google Scholar] [CrossRef]
  57. Hołuj, A. Externalities in the Light of Selected Spatial Economy Issues-Contribution to the Discussion. Eur. Res. Stud. 2021, 24, 3–21. [Google Scholar] [CrossRef]
  58. Bairoch, P. Cities and Economic Development: From the Dawn of History to the Present; University Chicago Press: Chicago, IL, USA, 1988. [Google Scholar]
  59. Hołuj, A.; Ilba, M.; Lityński, P.; Majewski, K.; Semczuk, M.; Serafin, P. Photovoltaic Solar Energy from Urban Sprawl: Potential for Poland. Energies 2021, 14, 8576. [Google Scholar] [CrossRef]
  60. Nijkamp, P.; Verhoef, E.T. Externalities in the Urban Economy; Tinbergen Institute Discussion Paper: Amsterdam, The Netherlands, 2003; Available online: https://papers.tinbergen.nl/03078.pdf (accessed on 24 March 2022).
  61. Mankiw, N.G. Principles of Microeconomics, 5th ed.; Cengage Learning: Boston, MA, USA, 2009. [Google Scholar]
  62. Laffont, J.J. Externalities. In The New Palgrave Dictionary of Economics; Vernengo, M., Cladenety, E.P., Rosser, B.J., Jr., Eds.; Palgrave Macmillan: London, UK, 2017. [Google Scholar] [CrossRef]
  63. Krugman, P.; Wells, R. Economics, 2nd ed.; Worth Publishers: New York, NY, USA, 2009. [Google Scholar]
  64. Kapp, K.W. Social Costs and Social Benefits—A Contribution to Normative Economics. In Probleme der Normativen Ökonomik und der Wirtschaftspolitischen Beratung; Beckerath, E., Giersch, H., Eds.; Duncker & Humblot: Berlin, Germany, 1963. [Google Scholar]
  65. Lucas, R.E., Jr. On the mechanics of economic development. J. Monet. Econ. 1988, 22, 3–42. [Google Scholar] [CrossRef]
  66. Romer, P.M. Increasing returns and long-run growth. J. Polit. Econ. 1986, 94, 1002–1037. [Google Scholar] [CrossRef] [Green Version]
  67. Krugman, P.R. Cities in Space: Three Simple Models; National Bureau of Economic Research: Cambridge, MA, USA, 1991. [Google Scholar]
  68. Murphy, K.M.; Shleifer, A.; Vishny, R.W. Industrialization and the big push. J. Political Econ. 1989, 97, 1003–1026. [Google Scholar] [CrossRef]
  69. Uchwała Nr CXII/1700/14 z Dnia 9 Lipca 2014 r. w Sprawie Uchwalenia Zmiany “Studium Uwarunkowań i Kierunków Zagospodarowania Przestrzennego Miasta Krakowa”. Available online: https://www.bip.krakow.pl/?id=48 (accessed on 7 May 2022).
  70. Tracz, M.; Semczuk, M. Wpływ Turystyki na Zmianę Funkcji Przestrzeni Miejskiej na Przykładzie Krakowa. Biuletyn Komitetu Przestrzennego Zagospodarowania Kraju PAN; Polska Akademia Nauk: Warsaw, Poland, 2018; No 272; pp. 272–284. [Google Scholar]
  71. Romańczyk, K. Pułapki rewitalizacji. Przypadek Krakowa. Studia Reg. Lokalne 2018, 4, 5–25. [Google Scholar]
  72. Hołuj, A.; Zawilińska, B. Planning Documents Issued in Poland at the Municipal Level. Example of the Krakow Metropolitan Area. J. Settl. Spat. Plan. 2013, 4, 122–124. [Google Scholar]
  73. Dudzic-Gyurkovich, K. Urban Development and Population Pressure: The Case of Młynówka Królewska Park in Krakow, Poland. Sustainability 2021, 13, 1116. [Google Scholar] [CrossRef]
  74. Hołuj, D.; Hołuj, A. Mechanisms of Densification of the City in the Neoliberal Economy—A Case Study: The Surroundings of the Eastern Part of the Former Airport Runway Rakowice-Czyżyny in Krakow. Bull. Geogr. Socio-Econ. Ser. 2015, 27, 81–93. [Google Scholar] [CrossRef] [Green Version]
Figure 1. Map of Krakow.
Sustainability 14 07103 g001
Figure 2. Percentage of Krakow’s residents living within walking distance of service facilities.
Sustainability 14 07103 g002
Figure 3. Areas of Krakow located within 15 min of service provision facilities.
Sustainability 14 07103 g003
Figure 4. Areas of Krakow located outside 15 min of service provision facilities (deficit areas).
Sustainability 14 07103 g004
Figure 5. Correlation between different types of residential areas and areas of 15-minute proximity and deficit.
Sustainability 14 07103 g005
Table 1. Facilities included in the study.
Category of NeedsFacilityData Source, Access Date
15-Minute City (Minimal Version)15-Minute City (Optimal Version)
Education and childcarenurserynurseryMSIP, 31 July 2021
preschoolpreschool
primary school *primary school *
secondary school *
Health careprimary healthcare centreprimary healthcare centreMSIP, 31 July 2021
pharmacypharmacy
day care centre
CulturelibrarylibraryMSIP, 31 July 2021
community centrecommunity centreOSM
Krakow’s BIP
www.bip.krakow.pl/?sub_dok_id=644, 3 August 2021
cultural venues: cinema, museum, concert hall, theatre, art gallery (collectively)OSM
Krakow’s website
www.krakow.pl/kultura/35702,artykul,katalog_instytucji.html,
13 August 2021
Green areas, recreation and sportsgreen areas with an area of 2 hagreen areas with an area of 2 haDirections for the development and management of green areas in Krakow for 2019–2030; OSM and https://krakowwzieleni.pl,
23 August 2021
playgrounds for childrenplaygrounds for childrenMSIP, 5 August 2021
communal sports fields for team gamescommunal sports fields for team gamesOSM
Krakow’s website
www.krakow.pl/instcbi/247778,,2589,3,wyszukiwarka.html,
18 August 2021
indoor gym/fitness clubindoor gym/fitness club
indoor swimming pool
Shopping and servicesgrocery shop (any)food supermarket (larger shop)OSM
Websites of retail chains, 26 August 2021
post officepost officeOSM
https://placowki.poczta-polska.pl, 5 August 2021
Catholic churchCatholic churchOSM, 7 May 2021
market square
restaurant
pub/café
Public transport stop (access on foot within 10 min)any typetramMSIP
Centroids of groups of same-name stops, 31 June 2021
OSM—rail stops (excluded from proximity area)
* state and private facilities, excluding special and adult schools. Abbreviations: BIP—Bulletin of Public Information; MSIP—Municipal Spatial Information System; OSM—OpenStreetMap; PRG—State Register of Borders; UMK—Krakow City Hall. Source: Own study.
Table 2. Areas of service deficits within the 15-minute isochrone (cf. Figure 4).
Area NoDeficits
1preschool, primary school, primary health care centre, pharmacy, playground, gym/fitness club, post office
2primary health care centre, pharmacy, library, community centre, gym/fitness club, post office
3nursery, preschool, primary school, primary health care centre, pharmacy, library, gym/fitness club, post office, church
4nursery, preschool, primary school, primary health care centre, pharmacy, library, community centre, playground, sports field, gym/fitness club, shop, post office
5preschool, primary health care centre, pharmacy, library, community centre, gym/fitness club, post office
6nursery, preschool, primary health care centre, pharmacy, library, playground, gym/fitness club, post office
7nursery, preschool, primary school, primary health care centre, pharmacy, playground, gym/fitness club, post office
8pharmacy, library, community centre, playground, gym/fitness club, post office, crèche
9nursery, preschool, primary health care centre, pharmacy, library, community centre, playground, gym/fitness club, shop, post office, church
10nursery, primary health care centre, pharmacy, library, playground, gym/fitness club, post office
Source: own study.
Publisher’s Note: MDPI stays neutral with regard to jurisdictional claims in published maps and institutional affiliations.

