Abstract
Waste Electric and Electronic Equipment (WEEE) is a prominent and increasing waste stream for which the Commission of the European Union has put in place ambitious recycling targets. However, these targets can only be achieved by ensuring that both industry and governments develop adequate infrastructure and policies for recycling plastics in an economically and technically optimal manner. Unfortunately, a quantitative overview of WEEE plastics covering the composition of waste streams down to the product component level and describing polymer and additive concentrations, is currently lacking. This hinders policymakers and recyclers in making strategic decisions regarding WEEE plastics recycling. Therefore, a novel method is proposed in this paper combining experimental results with findings from prior literature in order to provide sound quantitative insights into the volume and characteristics of the plastics content of WEEE collected in the European Union. The provided overview was obtained through a combination of proprietary experimental data and a statistical data integration method. More specifically, over 3800 samples awere analysed through manual composition analysis, FTIR, and XRF. The obtained results were integrated with data from prior literature through a novel data integration methodology based on linear opinion pools. The obtained results confirm that distinct plastic types can be found in different product categories and that flame retardants are only found in high concentrations in specific waste streams or components thereof. Hence, the presented analysis provides a quantitative substantiation for the separate collection and treatment of specific waste streams in order to reduce the complexity of the mix of plastic types and allow for the more cost-efficient and higher quality recycling of plastics.
1. Introduction
Waste Electric and Electronic Equipment (WEEE, or e-waste) is a substantial and increasing waste flow. An estimated 4.0 million tonnes of WEEE was collected in the European Union (EU), including associated Nordic states and the United Kingdom, in 2018 [1]. The proportion of plastics in WEEE varies by category, with estimates typically in the 15–20% range [2]. With WEEE recycling goals predominant in global policymaking, WEEE metals and rare-earth elements fractions have received notable academic and industrial attention. However, the ambitious recycling targets and the non-negligible plastic presence in WEEE require that plastics recycling is taken into consideration.
Unfortunately, the complexity of the WEEE plastics fraction imposes a challenge for Material Recovery Facilities (MRFs) [3]. While WEEE metals have large recycling rates, most WEEE plastics today are directed to energy recovery [2,3,4]. WEEE plastics recycling is further challenged by recently-imposed legislation restricting the presence of hazardous substances [5,6,7] in recycled plastics.
Unfortunately, a robust quantitative overview of WEEE plastics covering the composition of waste streams down to the product component level and describing polymer and additive concentrations is currently lacking. While results often rely on Eurostat [1], WF-Reptool [8], or Prosum [9] databases (e.g., [10,11,12]), these results are based on self-reporting by EU Member States or recycling facilities, a methodology that lacks transparency, is not reproducible, and is likely based on estimates rather than empirical evidence. Furthermore, this data collection methodology is not void of conflicts of interest, and the resulting databases are not publicly available. This data are aggregated to the level of incoherent large collection categories (e.g., “large equipment” or “small equipment + small IT and telecommunication equipment”) which are too coarse for the needs of decisionmakers at the level of the individual product.
The lack of scientific data on a finer level hinders policymakers and recyclers in strategic decision making regarding WEEE plastics recycling. Therefore, a method is proposed herein to systematically map the most crucial characteristics of the WEEE stream from a plastics recycling perspective. This paper’s contribution is threefold. First, it provides a systematic methodology for data collection and plastic waste stream analysis. Second, it provides a systematic method for integration of (prior) research on waste composition. Third, it provides the results of large-scale plastic sampling analysis and a complete quantitative overview of the WEEE plastics (WEEEp) stream in the European Union at collection through the adoption of the presented analysis and data aggregation methods. The overview is of direct and practical use for policy makers and recyclers targeting the increase of recycling rates through better informed management of input streams, as well as to other industrial value chains aiming to take recyclability into account in best practices requiring better mapping of complete material streams.
2. Background: Waste Electric and Electronic Equipment Plastics in the European Union
2.1. The WEEEp Value Chain
WEEE collection and treatment is formally the responsibility of original equipment manufacturers (OEMs), distributors, and Member States. In practice, WEEE collection is delegated to non-profit or commercial institutions as joint initiatives for extended producer responsibility. These institutions either organize further treatment or organize tenders in which they negotiate the conditions for the treatment of WEEE with third parties, commonly referred to as preprocessors. By gathering information about collected WEEE, preprocessors facilitate synergies between waste collection sites and recycling facilities. Preprocessors generate income through extended producer responsibility agreements with OEMs and through their role in facilitating information exchange [11,13,14,15].
In turn, material recycling facilities (MRFs) are companies that gather specific waste streams. Subsequently, they apply sequences of liberation and sorting steps in order to harvest raw materials from each waste stream [13,15,16,17,18]. Various preprocessors and MRFs specialize in WEEE plastics [11,15,18] and treat electronic shredder residue (ESR) from different MRFs after the removal of non-plastics. Those MRFs specializing in WEEEp engage in more specialized plastic sorting and compounding processes, producing specific polymer compounds that are modified, granulated, and prepared for resale to OEMs.
2.2. International Regulations
The Basel convention [19,20], of which the EU Member States are signatories, prohibits the export of waste containing hazardous substances. Its prime objective is limiting the transit of hazardous substances from developed to less developed nations. While the convention came into effect in 1992, its most recent revision took place in 2019 [19] and covered plastics containing hazardous substances. Roughly of all globally plastic waste collected between 1992 and 2018 [21] was exported to China. Due to China’s rapid development, local industrial demand for WEEEp became saturated with local supply of recycled plastics. Furthermore, imported waste plastics were typically poorly decontaminated, resulting in environmental burdens [22]. For these reasons, a Chinese import ban on waste came into effect in January 2018 [21]. Naturally, the introduction of the ban requires European Union Member States to implement policies to enhance domestic recycling and reduce waste generation in order to achieve their existing circularity targets.
Within the European Union, the electric and electronic equipment (EEE) and WEEE value chains are regulated through a number of transnational legal works. Directive 2012/19/EU [23] is commonly referred to as the WEEE directive. In addition to introducing a WEEE categorization system and recycling and recovery targets per category, the directive imposes operational constraints. These constraints can affect product categorization; for instance, certain product types may require specific detoxification steps after collection. Specifically, the WEEE directive requires that either 65% of the electric and electronic equipment (EEE) put on market in the three preceding years is recycled, or 85% of the WEEE generated in a particular year. These targets are difficult to reach, as it is estimated that only of WEEE was properly collected in 2020 [24]. The remaining WEEE is disposed of improperly (ca. ; e.g., in waste bins), collected outside of the formal WEEE industry (ca. ), or unaccounted for (ca. ).
Hazardous substances in the EEE value chain are regulated by two directives introduced by the European Commission, both of which have been revised in numerous amendments. Directive EC 1907/2006 [25] is known as Registration, Evaluation, Authorization and restriction of Chemicals (REACH). REACH provides guidelines for the production, import, and use of hazardous materials in the EU. Directive 2002/95/EC [5] is commonly referred to as Restriction of Hazardous Substances 1 (RoHS 1). This directive introduces concrete restrictions on the concentrations of a set of substances in EEE that are hazardous for humans or the environment. While REACH prohibits the use and trade of plastics with hazardous content, the Basel convention prohibits their export. In consequence, non-RoHS-compliant plastics are typically incinerated for energy recovery.
RoHS 1 was implemented in 2006 and contains restrictions on the concentrations of six hazardous substances (cadmium (Cd): max. 100 ppm; lead (Pb), mercury (Hg), hexavalent chromium (Cr VI), polybrominated biphenyl (PBB), and polybrominated diphenyl ether (PBDE): max. 1000 ppm). It has been updated in Directive 2011/65/EU [6] (RoHS 2); RoHS 2 came in effect in 2013 and restricts the presence of the same hazardous substances as RoHS 1, while placing a heavier burden of proof on OEMs. The most recent implementation is RoHS 2, augmented by restrictions on four additional substances as mandated by Amendment 2015/863 [7] (DEHP, BBP, DBP, DHBP: 1000 ppm). This amendment came into effect in July 2019. The substances introduced in the amendment are not prevalent in WEEE plastic fraction [26].
2.3. Quantifying WEEEp Collection and Recycling
The quantities studied from different perspectives in this paper are visualized in Figure 1. Ideally, all of these quantities would be easily estimated. This would allow policy and the recycling industry to avoid mixing different waste categories involving plastics that are distinct and difficult to separate mechanically, enabling optimized recycling, as the plastic compositions of particular streams could be taken into account in devising recycling treatment strategies. Likewise, if it were possible to identify waste streams in which certain additives have a significant presence, the risks of hazardous substances in recycled plastics could be substantially reduced.
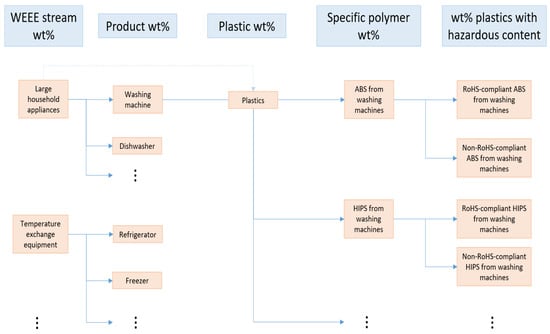
Figure 1.
Structure of properties to be quantified.
The uncertainty resulting from latent variables and lack of documentation on WEEEp streams is clearly reflected in the scientific literature. WEEEp statistics differ significantly from one source to another. Even the definitions of collected WEEE streams can vary between studies. A substantial number of papers do not report WEEEp statistics for individual products, only for categories as a whole. This information is included in this document, as it can augment the more specific data, particularly as the latter are rare and many WEEE streams are mostly comprised by only a small number of products. The United Nations University has repeatedly proposed subdividing the WEEE categories into 54 specific harmonized product classes (indexed by “UNU-keys”) [27,28]. To date, these standardized categories have yet to be widely adopted in the scientific literature. Most of the quantities outlined here are discussed in [11,12] from a unilateral perspective.
3. Materials
3.1. Sample Collection
Our results were obtained through a combination of prior data integration and proprietary experiments. For the latter, a total of 3607 samples were provided by the Italian WEEE management consortium Erion [29]. Samples were supplied in two formats: in the form of disks with diameters of 55 mm and as electronic shredder residue (ESR) in the form of flakes. ESR samples were taken from a stream of mixed plastics originating from one product type or one component of a product after the removal of non-plastics. While the size of ESR flakes varied, most flakes were thinner than 5 mm, with minimum width up to 60 mm and surfaces of around 800 mm on average. ESR samples were either analysed directly or analyzed after further size reduction. Samples in the latter case are referred to as size-reduced flakes, and are roughly 27 mm in volume, with little variance. Figure 2 shows examples of collected samples in the three configurations.
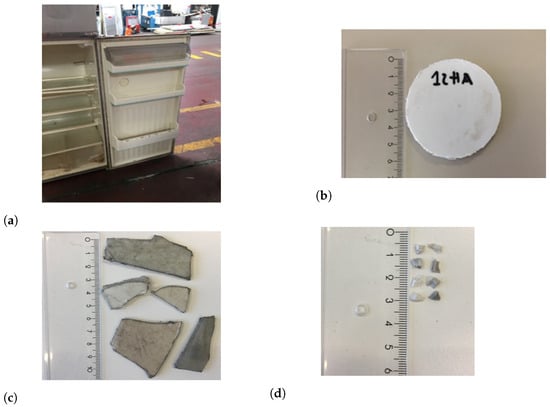
Figure 2.
Different configurations of collected samples. (a) Refrigerator; a disk was taken from the door. (b) Disk obtained from refrigerator. (c) ESR flakes. (d) ESR flakes after size reduction.
Each of the three sample configurations has advantages and disadvantages. Disks are difficult to collect, and sampling campaigns to obtain them hinder a recycling facility’s normal operations. However, the metadata that can be gathered about disks are much more detailed than that from ESR, as while ESR is obtained from a large stream of WEEEp originating from a common WEEE product, each disk is taken individually. As such, information such as the sampled product component, manufacturer, and model of the sample is available. This is relevant information, for instance, in the evaluation of added value of disassembly steps during treatment. In most cases, this makes it possible to retrieve the location and year of development, which helps in exposing temporal and geographic trends in product design.
ESR originates from a stream of shredded products. As such, metadata on the individual product level were unavailable for this sampling configuration. However, compared to disks, ESR flakes are easier to acquire in large quantities. In addition, the more random method of sample taking may avoid sources of bias that are present when taking disk-shaped samples; For instance, one disk was taken from each product (or a component thereof), disregarding the underlying mass proportionality. After manual composition analysis, a subset of ESR flakes was taken. Samples were labeled and the different subsequent analyses were performed.
Size-reduced ESR flakes have the advantage that each flake is of roughly the same size. This removes potential biases when taking subsamples, as the probability of selecting any one size-reduced flake at random becomes more uniformly distributed (cf. the section on subsampling). Furthermore, the small size of size-reduced flakes reduces weight differences between samples that can arise due to differences in density. This allows for statistical experiments in which the number of samples is representative of sample size, rather than of the total analyzed mass, which in turn allows for more robust data gathering. However, size-reduced flakes cannot be labeled and stored individually, meaning that individual data points cannot be reanalyzed. This complicates the application of multiple analysis methods, such as the combination of spectroscopy with density measurements.
3.2. Analysis
Samples were analyzed by a combination of manual composition analysis (MCA), Fourier-Transform Infrared Spectroscopy (FTIR), and X-ray fluorenscence (XRF). Composition analyses were conducted manually. Base polymer composition analysis was conducted through FTIR using a Thermo Scientific™ Nicolet™ iS™ instrument (Thermo Electron Scientific Instruments LLC, Madison, WI, USA, ISO certified) with the associated OMNIC™ [30] software. Presence of hazardous substances was measured through XRF using an OXFORD™ X-MET3000 TXR+ instrument (Oxford Instruments, Abingdon, UK) and customary interface. This instrument had detection limits of 5 ppm for Br; 40 ppm for Cd; 14 ppm for Hg; 24 ppm for Pb and 16 ppm for Ni [31].
The Omnic® software is equipped with a collection of built-in plastic reference libraries. These were augmented by 86 custom reference spectra. These custom spectra were either provided by project partners or were obtained from waste samples and analyzed using laser-induced breakdown spectroscopy (LIBS), density, FTIR, and/or XRF systems. The custom and manually verified spectra allowed for the identification of materials more specific to WEEE, such as PP with significant concentrations of fillers. Table 1 provides an overview of the spectra, showing the status (virgin or recyclate), origin, and number of samples indicated per base polymer type.

Table 1.
Custom FTIR spectra added to OMNIC™ built-in reference library.
The XRF setup was tested on a set of ten reference spectra, of which the bromine concentration was known in advance. The set-up consistently overestimated the actual bromine presence with small but significant margins. The discrepancy between the actual bromine level and the overestimation became more pronounced for larger concentrations. The measurement results can therefore be interpreted as conservative estimates. Similar behavior was observed for the other five RoHS substances.
4. Methods
4.1. Data Integration
In prior research, statistics were not presented in the form of point-estimates. Furthermore, metadata (number of samples, number of sampled sites, potential biases, latent variables) are scarce or absent. For these reasons, classical meta-analysis methods fall short. Therefore, treating source material as expert opinions to be leveraged is considered more appropriate; in particular, we adopted an axiomatic approach. Contrary to behavioral approaches and Bayesian approaches, the axiomatic approach is applicable to waste composition data, where metadata are scarce, results are not reported in the form of point-estimates, and the reliability of references cannot be empirically examined (see [32,33] for an overview of conditions under which each integration method is most appropriate).
In particular, we computed a weighted average of results from multiple sources. Weights in the computation are indicators of references’ relative reliability. An obtained weighted average is referred to as a linear opinion pool [33]. The most challenging factor in obtaining a reliable linear opinion pool is the calibration method, that is, evaluating the weights.
For calibration, a set of criteria was identified in order to gain insight into each reference’s reliability. These criteria were based on metadata from the references. In case data in a source were obtained from prior research endeavors, the metadata of the original publication were taken into account. Concretely, the following criteria were taken into consideration:
- Conventionality/scientific scrutiny: data points published in peer-reviewed scientific documents (papers, books or chapters therein, theses) with reproducible experimental setups should be assigned more weight than data points from less formal sources (self-reporting, opaque integrations, etcetera). Common academic metrics (average number of citations per year, impact factor of journal) may be taken into account as well.
- Age: recent data sources should be assigned more weight than older references. The increase in reliability of more recently published data should be non-linear, such that the most recent data sets are allocated a proportionally significantly larger weight.
- Methodology: references are weighted based on the estimated reliability of their data analysis methodologies, sample sizes, number of locations sampled, and provided estimates of generality.
Additional methods were adopted to integrate sub-factors of each criterion and to obtain an overall opinion pool; these are detailed below.
The conventionality coefficient was evaluated as follows. If a reference was not peer-reviewed, its impact factor was set to zero. Scores were then assigned proportionally to impact factors in the ranges of zero through seven and over five numeric classes, with values ranging from zero to one. The average number of citations per year was then computed for each reference. By taking this average, the effect of accumulated citations over a long period of time can be evened out. The resulting number was again subdivided into five numeric classes ranging from zero to one. The resulting two scores were added and divided by two, producing the overall conventionality indicator. By taking the sum rather than the product, a large number of citations can compensate for a reference not being peer-reviewed. The overall computation method is illustrated in Figure 3. Proprietary data were assigned a conventionality score of zero in order to avoid bias.
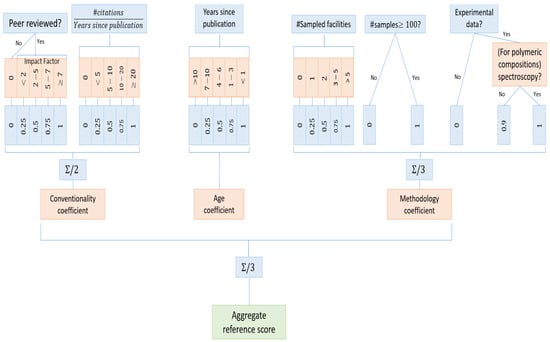
Figure 3.
Computation of reference scores.
The age coefficient was computed in a similar manner. References that were at least ten years old were assigned an age score of zero. Increments between four other numeric age classes were then not constant. This places more emphasis on relatively recent data, as older references are discounted proportionally to their age. This reflects that data become increasingly less reliable over time, as waste streams are continuously changing in composition. The concrete computation method is provided in Figure 3.
Finally, the methodology coefficient was computed based on four attributes. The number of facilities sampled was again evaluated on a five-tier scale. The score for the number of samples was allocated more leniently. Each reference with at least 100 samples was considered reliable in this regard and assigned a score of one. One metric was used to infer the reliability of measurement equipment and the statistical conclusions of each reference. The default value of this metric was one if the reference reported experimentally-obtained data. If the data were obtained through self-reporting or integration of prior studies, the value of the metric was set to zero. For polymer composition statistics, spectroscopic analysis methods were considered the most reliable. If other methods were used in a particular reference, such as pyrolysis in [34], the metric was discounted to . This is illustrated in Figure 3.
A weighted average of the conventionality, age, and methodology coefficients provided a score for each reference. These scores then served as weights in linear opinion pools. For the purposes of this paper, we simply take the arithmetic mean of the coefficients. It should be noted that more involved weighted averages could balance the underlying importance of the different factors. Here, each reference was assigned a score in this manner, and the scores played a role in computing the linear opinion pools.
Suppose a linear opinion pool is computed for a particular characteristic of the WEEE(p) stream. Suppose k references are available. Let be the score of reference . Furthermore, let be the quantity of interest, as reported in reference . Suppose further that a subset R of references provides statistics on this characteristic. Then, the integrated quantity is computed using Equation (1). In order to quantify the uncertainty, the weighted standard deviation can be computed according to Equation (2).
The overall method is visualized in Figure 3. Data obtained from proprietary data analysis were taken into consideration with the following parameters: zero for conventionality; one for age; and one for methodology. The specific scores are provided in Table 2.
Table 2.
References, metadata, and scoring. “#cit.”: number of citations; “IF”: impact factor; “#facilities”: number of distinct sites at which samples were collected; “#samples”: number of samples taken (in [14], three containers were selected at random and the frequency of products was measured by wt%); “Meth.”: methodology; “Exp.”: proprietary experimental data.
4.2. Subsampling
Subsamples of the flake and size-reduced flake samples were taken in order to retain a sufficient amount of flakes for archiving and future research endeavors. The samples were transported and stored in plastic bags. This likely resulted in an uneven distribution of flakes in the bag, in which small flakes with larger densities were concentrated in the lower half of each bag. Likewise, larger and less dense flakes would tend to end up in the upper half. Therefore, the design of a reliable subsampling protocol was paramount. The subsampling protocol adhered to was based on [57,58,59], and consisted of the following steps:
- Spread out all the flakes on a flat surface;
- Stir the flakes by hand for at least two minutes;
- Arrange the flakes in a square (ideally, this square is “flat” in the sense that no flake ends up on top of any other flake);
- Use rope and a ruler to superimpose a regular grid on the square of flakes;
- Label the cells in the grids with labels cells;
- Blindly draw one sample from each cell in the assigned cell order;
- Repeat Step 6 until a subsample of the desired size is obtained.
The outlined protocol is illustrated in Figure 4. The selection of the grid sizes was left to the researcher, as it depended on the size of the square. The optimal grid size satisfies the condition that each grid is sampled exactly the same number of times exactly when the selected subsample reaches the desired mass. While this was hard to anticipate fully, it provided a heuristic for grid size selection.
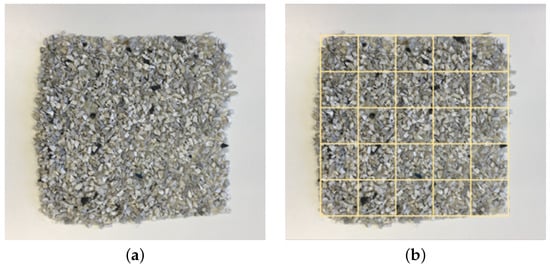
Figure 4.
Subsampling protocol illustrated for size-reduced flakes. (a) Samples arranged in a homogeneous square. (b) Grid superimposed over the samples.
Following this procedure, the selection probability of each flake was not affected by its density. The square being flat removes the risk of lighter samples being located on top of heavier samples. Thanks to the stirring, heavier samples that were centered to the bottom in a storage configuration were distributed equally over the square. Furthermore, in the event of samples with certain characteristics being cohesively concentrated, the grid-based selection procedure removes bias towards disproportionate selection. Due to the homogeneous flake size, each flake in a grid has the same selection probability. For these reasons, the outlined sampling procedure generates a reliable random sample.
5. Results and Discussion
5.1. Proprietary Data Collection
Experimental results for polymeric compositions through FTIR are provided in Table 3. Note that the second column indicates the sample type (disk, flake, reduced flake). The results corroborate findings that compositions of cooling and freezing equipment are highly concentrated in polystyrene. Furthermore, the complexity of compositions is substantial in small equipment. In particular, this latter stream is much richer in relatively valuable plastics such as a PC/ABS blend. In the table which is extended with statistics from prior research, note that professional coffee makers and domestic coffee makers have substantially different plastic compositions. They differ in most common base polymers, with professional coffee machine plastics consisting mainly of PC/ABS blends and domestic ones of more inexpensive styrenics. This indicates a strong correlation between application and plastic composition.
Table 3.
Polymeric compositions of WEEE product components at collection from proprietary experiments. Percentages are rounded. For styrenics, the ABS percentage is indicated in parentheses and the remaining percentage is PS. The abbreviation “F” indicates results obtained using ESR flake samples, “RF” indicates size-reduced ESR flake samples, and “D” indicates disk samples. Polyurethane foam is not included in plastic weight percentages. For television sets and monitors, all samples were taken from back covers. Under PP, additives are indicated in parentheses in the following order: wt% pure PP, wt% PP + CaCO, PP + talc, PP + glass-fibre.
Table 4 contains the results of XRF analyses for detection of hazardous substances from RoHS 1 and 2. The table indicates the number of samples and weight percentages of substances possibly exceeding RoHS 2 thresholds per polymer for each product analyzed in the format of reduced flakes. The RoHS directive restricts specific brominated flame retardants (polybrominated biphenyl or PBB and polybrominated diphenyl ether or PBDE). However, the specific flame retardant could not be determined in the provided experimental setup. Therefore, the bromine concentration is provided instead as a proxy for the more specific restricted substances. Numbers reported in the figure indicate the weight percentages and number of samples for which the bromine concentration exceeds the RoHS thresholds for PBB and PBDE (1000 ppm), except where indicated with an asterix (*) for excessive cadmium levels. The results show that bromine concentrations are particularly challenging in styrenics from TVs and monitors (with the exception of liquid chrystal display (LCD) monitors), professional coffee machines, and printers. In professional coffee machines, they may prevail in PC/ABS as well. Note, however, that printers are relatively rich in PC/ABS, which was not significantly contaminated according to the experiments. Note further that small weight percentages of significantly contaminated fractions occur regardless of base polymers in SHA products. This again indicates the relative complexity of the WEEE SHA plastics stream. The strong presence of bromine in the television and screen waste category and its presence in traces in other categories is corroborated by prior research (see [26,35,56,60,61,62]).
Table 4.
Weight percentage (number of samples) of disks (TV/monitor) or ESR flakes (other products) exceeding the RoHS threshold per product and per material. Example: 9.12 wt% (two samples) of all pure PP flake samples from washing machines exceeded the RoHS threshold. Percentages with an “*” indicate that the product exceeded the cadmium threshold. All other percentages exceeded bromine thresholds. See Table 3 (under “Exp. (F)” and TVs and monitors under “Exp. (D)”) for the total number and mass of samples.
5.2. Data Integration
Total WEEE collection mass is based on [1]. Several sources were available for estimating the relative mass proportions of collection categories. An overview of these sources and the corresponding integrated quantities is provided in Table 5. Note that while the WEEE directive commenced a new classification system for WEEE in August 2018, most available literature on WEEE categorization predates this change. Thus, the statistics here are reported in accordance with either the old classification system or the more specific classifications adhered to in practice. The post-August 2018 WEEE directive more closely resembles this latter classification system. However, televisions and screens are not a distinct collection category in the directive, though they are typically collected as a distinct category in practice. Relative masses per product in these streams, as well as the mass percentage of plastics therein, are detailed in Table 6. Polymer compositions recorded in prior literature are provided in Table 7. In Figure 5, these results are integrated with the proprietary empirical data (Table 3), providing an overall depiction of WEEE (plastics) at collection in the European Union.
Table 5.
Distribution of WEEE categories at collection. Integrated results are documented in the format “mean (standard deviation)”. Outliers in gray typeset were too plant-specific and were thus excluded.
Table 6.
Product and plastics compositions; “int.”: integrate weight percentages. Outliers indicated in gray typesetting, which were excluded from integration, may nonetheless provide insights into proportionality.
Table 7.
Polymeric distributions of small household appliances at collection. For styrenics, the ABS percentage is indicated in parentheses and the remaining percentage is PS. The abbreviation “Exp.” indicates experimentally obtained results; “F” indicates results obtained using ESR flake samples, while “RF” indicates size-reduced ESR flake samples.
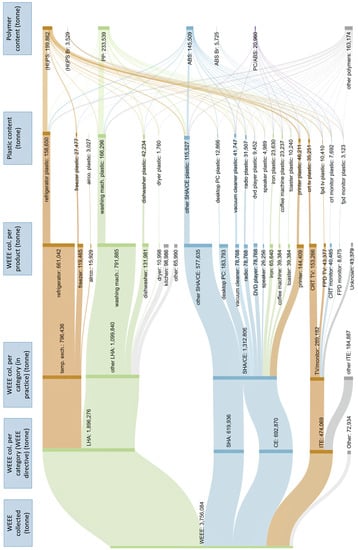
Figure 5.
WEEE(p) in tonnes at collection in the European Union.
The colors in Figure 5 indicate the most prevalent base polymer type of each fraction. Refrigerators, freezers, air-conditioners, printers, cathode-ray tube (CRT) TVs, and flat-panel display (FPD) TVs are rich in (high-impact) polystyrene (HI)PS. Of these products, both CRT and FPD TVs have a significant risk of being contaminated by bromine content (possibly PBB or PBDE, restricted under RoHS). Note that refrigerator and freezer plastics are primarily white or light colored, while the other mentioned products are typically black or dark colored. Keeping these two streams separated may lead to more value recovery, as light (HI)PS recyclates are more valuable.
Table 6 indicates that the SHA/CE stream is largely constituted by a limited number of products; 56 wt% of the stream is constituted by only nine product types. Corroborating the empirical findings, the literature indicates that these product types often have fairly homogeneous polymeric compositions, as evident from Table 7. In certain cases, they are constructed primarily out of polymers that can be separated mechanically with relative ease (such as ABS and PP; see [13,16,18,63]). Recall that the collected WEEE fraction in the European Union represents roughly 33% of generated WEEE in this area, with low collection rates disproportionately affecting the SHA/CE category [44]. Efforts towards improved collection and recycling in this category could thus significantly increase WEEE recycling rates. Regarding LHA, targeting product components in isolation is a promising strategy to increase the purity of recycled plastics.
For a significant fraction (roughly 34 wt%) of small household appliances and consumer equipment (SHA/CE) products, ABS is the polymer present in the largest concentration. This includes desktop PCs, vacuum cleaners, radios, DVD players and speakers. While prior studies indicate that cadmium may have a significant presence in the ABS content of the SHA/CE stream, proprietary XRF experiments of ABS from WEEE vacuum cleaners did not indicate cadmium presence. While CRT and FPD monitors are rich in ABS, both the prior literature and the proprietary results indicate a strong bromine presence in their plastics.
Washing machines, dishwashers, and various SHA/CE products (clothing irons, coffee machines, toasters, combined roughly 11 wt% of SHA/CE) are primarily composed of PP. The concentrations of additives involved vary widely, with washing machines primarily consisting of calcium carbonate-filled PP, while most PP in SHA/CE products is unfilled. While plastics from end-of-life (ELV) vehicles are known to be rich in PP [64], the generally dark color of ELV vehicle plastic streams versus the light color of the outlined WEEE products provides an argument against blending these PP streams for optimal value recovery.
Table 8 includes available data on the presence of hazardous substances in specific WEEE streams. For SHA, these studies are limited to the overall stream and provide no insight on the level of specific products or components thereof. Prior studies indicate that cadmium content may be a difficulty when processing SHA and televisions and screens. The prior literature indicates that lead may pose a challenge in the television and monitor category [35].
Table 8.
Presence of RoHS substances in WEEE plastics documented in prior research: “🞮” means a substance is present in concentrations not exceeding RoHS limits; “🞮🞮” means a substance is present in concentrations exceeding RoHS limits; percentages indicate the weight percentage of samples exceeding the RoHS limits.
The stream of small household appliances is dominated by a small number of products with relatively homogeneous polymeric composition. Furthermore, treating particular components of large household appliances in isolation may increase the quality of the output polymer. The correlation between plastic type and application is again stressed. Such correlations may be present for geographical location of waste collection as well, with geographical, cultural, and socio-economic differences affecting waste concentrations in different areas.
6. Conclusions
This paper has presented a method of systematically quantifying the characteristics of WEEE that are pivotal from a plastics recycling perspective. The presented method integrates empirical experiments and the results of prior studies.
Three sample preparation methods for experimentally obtaining the latter two quantities are subsequently provided. The merits of each of these methods is detailed, as there were differences in efficiency, statistical scope, and access to important metadata; subsampling and sample analysis techniques are described as well, and a novel data integration method for intelligently leveraging available insights is provided. We applied experimental methods were to proprietary samples; these are embedded in the data integration method along with results from prior studies. This culminates in a structured overview of WEEE (plastics) composition at the collection stage of the value chain in the European Union. The obtained overview is of great value for both policy makers and recyclers in establishing and fulfilling WEEE recycling targets through informed treatment of WEEE plastics.
The crucial quantities of the WEEE stream for plastics recyclers are identified. These include the mass distributions of WEEE categories at collection, products in these categories, plastic content in these products, particular polymers among these plastics, and risk of contamination with hazardous substances.
The main limitation of this work is the scarcity of data. Particularly for very specific products, only a small number of studies were available, providing limited insights in the presence of fillers or actual plastic content. This made it difficult to obtain a full overview of all relevant quantities, although we are confident that the main plastic waste stream has been correctly mapped with the presented methodology.
Future research and policy steps should target the establishment and maintainenance of a transparent and reliable monitoring framework for WEEE and WEEE plastics collected in the European Union. From a policy point of view, this could mean a requirement that recyclers systematically test WEEE streams and make the results accessible. From a research point of view, it means acquiring primary data more frequently and relying less on outdated references. Should additional (meta)data become available, the incorporation of location in the described data integration method would represent an important refinement. Likewise, the description of the proposed WEEE characteristics at the level of the UNU-key would be an important step towards standardizing research results.
Author Contributions
Conceptualization: A.B., J.R.P., D.C., W.D., L.C., A.A. and J.R.D.; Methodology: A.B., J.R.P., D.C. and J.R.D.; Validation: J.R.P., D.C. and J.R.D.; Formal analysis: A.B. and J.R.P.; Resources: J.R.P., L.C. and A.A.; writing—original draft preparation: A.B.; writing—review and editing: J.R.P., D.C. and J.R.D.; visualization: A.B.; supervision: J.R.P., D.C., W.D., L.C. and J.R.D.; project administration: J.R.P. and J.R.D.; funding acquisition: J.R.P. All authors have read and agreed to the published verion of the manuscript.
Funding
The reported research was conducted as part of PolyCE (Post-Consumer High-tech Recycled Polymers for a Circular Economy), a European Commission Horizon 2020-funded project.
Institutional Review Board Statement
Not applicable.
Informed Consent Statement
Not applicable.
Data Availability Statement
Proprietary data are available at the Centre for Industrial Management/Traffic and Infrastructure, Katholieke Universiteit Leuven, Leuven, Belgium.
Conflicts of Interest
The authors have no conflict of interest to declare that are relevant to the content of this article.
References
- EUROSTAT Waste Statistics—Electrical and Electronic Equipment. 2020. Available online: https://ec.europa.eu/eurostat/statistics-explained/index.php?oldid=325361#Electronic_equipment_.28EEE.29_put_on_the_market_and_WEEE_processed_in_the_EU (accessed on 23 May 2022).
- Buekens, A.; Yang, J. Recycling of WEEE plastics: A review. Off. J. Eur. Union 2012, 16, 415–434. [Google Scholar] [CrossRef]
- Gaidajis, G.; Angelakoglou, K.; Aktsoglou, D. E-Waste: Environmental Problems and Current Management. J. Eng. Sci. Technol. Rev. 2010, 3, 193–199. [Google Scholar] [CrossRef]
- Cui, J.; Forssberg, E. Mechanical Recycling of Waste Electric and Electronic Equipment: A review. J. Hazard. Mater. 2003, 3, 243–263. [Google Scholar] [CrossRef]
- European Commission. Directive 2002/95/EC of the European Parliament and of the Council of 27 January 2003 on the restriction of the use of certain hazardous substances in electrical and electronic equipment. Off. J. Eur. Union 2003, 039, 19–23. [Google Scholar]
- European Commission. Directive 2011/65/EU of the European Parliament and of the Council: On the restriction of the use of certain hazardous substances in electrical and electronic equipment. Off. J. Eur. Union 2011, 174, 88–110. [Google Scholar]
- European Commission. Commission Delegated Directive (EU) 2015/863: Amending Annex II to Directive 2011/65/EU of the European Parliament and of the Council as regards the list of restricted substances. Off. J. Eur. Union 2015, 137, 10–12. [Google Scholar]
- WF-Reptool. 2022. Available online: https://www.wf-reptool.org/index.php/home (accessed on 23 May 2022).
- Huisman, J.; Leroy, P.; Tertre, F.; Ljunggren Söderman, M.; Chancerel, P.; Cassard, D.; Løvik, A.N.; Wäger, P.; Kushnir, D.; Susanne Rotter, V.; et al. Prospecting Secondary Raw Materials in the Urban Mine and Mining Wastes (ProSUM)—Final Report; ProSUM: Brussels, Belgium, 2017. [Google Scholar]
- Cardamone, G.; Ardolino, F.; Arena, U. About the Environmental Sustainability of the European Management of WEEE Plastics. Waste Manag. 2021, 126, 119–132. [Google Scholar] [CrossRef]
- Accili, A.; Campadello, L.; Vincenti, N.; Amadei, A.; Arienti, G.; Sala, M. Quantification of Material Flows Along the Entire Chain; PolyCE: Berlin, Germany, 2019. [Google Scholar]
- Colley-Jones, R.; Accili, A.; Campadello, L.; Emmerich, J. Plastics in Electronic Waste: Results from the PolyCE Project. In Electronic Waste Management; Eduljee, G., Harrison, R., Eds.; Royal Society of Chemistry: Croydon, UK, 2020; pp. 313–337. [Google Scholar]
- Berwald, A. Requirement-Specific Priority Plastics Guide; PolyCE: Berlin, Germany, 2018. [Google Scholar]
- Boudewijn, A.; Peeters, J.; Duflou, J.; Cattrysse, D. Product Clustering for Improved Collection, Sorting and Reprocessing and Optimized Recycling Economics, High Purity PCR Plastics Streams and Uptake; PolyCE: Berlin, Germany, 2019. [Google Scholar]
- Dimitrova, G.; Berwald, A.; Bates, M.; Bernasconi, R.; Kuehr, R.; Ragaert, K.; Slijkhuis, C. Roadblocks for the Circular Economy of WEEE Plastics: A Call for Informed Classification Practices. PolyCE Blog Entry. 2019. Available online: https://polyce-eu.medium.com/roadblocks-for-the-circular-economy-of-weee-plastics-a-call-for-informed-classification-practices-9fc8d2da90dd (accessed on 27 November 2019).
- Ragaert, K.; Delva, L.; Van Geen, K. Mechanical and Chemical Recycling of Solid Plastic Waste. Waste Manag. 2017, 69, 24–58. [Google Scholar] [CrossRef]
- Deloitte Consulting & Advisory CVBA/SCRL. (W)EEE 2016 Mass Balance and Market Structure in Belgium; Recupel: Brussels, Belgium, 2018. [Google Scholar]
- MBA Polymers Inc. Processes and Requirements for the Recovery of Plastics from Durable Goods. U.S. Patent No. US9,296,127 B2, 29 March 2016. [Google Scholar]
- European Commission. Commission Delegated Regulation (EU) 2020/2174 of 19 October 2020 amending Annexes IC, III, IIIA, IV, V, VII and VIII to Regulation (EC) No 1013/2006 of the European Parliament and of the Council on shipments of waste. Off. J. Eur. Union 2020, 433, 11–19. [Google Scholar]
- Basel Convention. Basel Convention: Controlling Transboundary Movements of Hazardous Wastes and Their Disposal. 2020. Available online: http://www.basel.int/Home/tabid/2202/Default.aspx (accessed on 23 May 2022).
- Brooks, A.; Wang, S.; Jambeck, J. The Chinese import ban and its impact on global plastic waste trade. Sci. Adv. Environ. Stud. 2018, 4. [Google Scholar] [CrossRef]
- Qu, S.; Guo, Y.; Ma, Z.; Chen, W.; Liu, J.; Liu, G.; Wang, Y.; Xu, M. Implications of China’s foreign waste ban on the global circular economy. Resour. Conserv. Recycl. 2019, 144, 252–255. [Google Scholar] [CrossRef]
- European Commission. Directive 2012/19/EU of the European Parliament and of the Council: On waste electrical and electronic equipment (WEEE). J. Mater. Cycles Waste Manag. 2014, 16, 415–434. [Google Scholar]
- Huisman, J.; Magalini, F.; Kuehr, R.; Khetriwal, D.; Deubzer, O. Material Flows of the Home Appliance Industry—CECED; CECED: Brussels, Belgium, 2020. [Google Scholar]
- European Commission. Regulation (EC) No 1907/2006 of the European Parliament and of the Council. Off. J. Eur. Union 2006, 396, 1–850. [Google Scholar]
- RoHS Guide. RoHS Restricted Substances (6 + 4). 2020. Available online: https://www.rohsguide.com/rohs-substances.htm (accessed on 23 May 2022).
- Huisman, J.; van der maesen, M.; Eijsbouts, R.; Wang, F.; Baldé, C.; Wielenga, C. The Dutch WEEE Flows; United Nations University, ISP-SCYCLE: Bonn, Germany, 2012. [Google Scholar]
- Balde, C.P.; Forti, V.; Gray, V.; Kuehr, R.; Stegmann, P. The Global E-Waste Monitor 2017: Quantities, Flows and Resources; United Nations University: Bonn, Germany; International Telecommunication Union: Geneva, Switzerland; International Solid Waste Association: Vienna, Austria, 2017. [Google Scholar]
- ERION Consortium. ERION. Ecodom, Remedia, Producer Responsibility. 2022. Available online: https://erion.it/en/ (accessed on 23 May 2022).
- Thermo Fischer Scientific. OMNIC Software Suite: Full-Featured FT-IR, NIR & Raman Spectroscopy Software; Thermo Fischer Scientific: Waltham, MA, USA, 2019. [Google Scholar]
- Oxford Instruments. X-MET3000 TXR+ Documentation; United Nations University, ISP-SCYCLE: Bonn, Germany, 2006. [Google Scholar]
- Clemen, R.; Winkler, R. Combining Probability Distributions From Experts in Risk Analysis. Risk Anal. 1999, 19, 187–203. [Google Scholar] [CrossRef]
- Genest, C.; Zidek, J. Combining Probability Distributions: A Critique and an Annotated Bibliography. Stat. Sci. 1986, 1, 114–135. [Google Scholar]
- Bovea, M.; Pérez-Belis, V.; Ibáñe Forés, V.; Quemades-Beltrán, P. Disassembly properties and material characterisation of household small waste electric and electronic equipment. Waste Manag. 2016, 53, 225–236. [Google Scholar] [CrossRef] [PubMed]
- Wang, F. E-Waste: Collect More, Treat Better Tracking Take-Back System Performance for Eco-Efficient Electronics Recycling; Delft University of Technology: Delft, The Netherlands, 2014. [Google Scholar]
- MBA Polymers (now MGG Polymers). Complex Waste Plastics Recycling Wish List. 2017. Available online: https://mbapolymers.com/news/complex-waste-plastics-recycling-wish-list/ (accessed on 18 December 2017).
- Mahesh, P.; Rajankar, P.; Kumar, V. Improving Plastic Management in Delhi A Report on WEEE Plastic Recycling; Toxics Link: New Delhi, India, 2012. [Google Scholar]
- Peeters, J.; Vanegas, P.; Kellens, K.; Wang, F.; Huisman, J.; Dewulf, W.; Duflou, J. Forecasting Waste Compositions: A case study on plastic waste of electronic display housings. Waste Manag. 2015, 46, 20–39. [Google Scholar] [CrossRef] [PubMed]
- Pizzol, M.; Andersen, M.; Thomsen, M. Greening of Electronics; The Danish Environmental Protection Agency: Odense, Denmark, 2012. [Google Scholar]
- Martinho, G.; Pires, A.; Sraiva, L.; Ribeiro, R. Composition of plastics from waste electrical and electronic equipment (WEEE) by direct sampling. Waste Manag. 2012, 32, 123–127. [Google Scholar] [CrossRef]
- Queriga, D.; Walther, G.; González-Benito, J.; Spengler, T. Evaluation of Sites for the Location of WEEE Recycling Plants in Spain. Waste Manag. 2008, 28, 181–190. [Google Scholar] [CrossRef]
- Baxter, J.; Walström, M.; Løkke, S. Plastic Value Chains: Case: WEEE (Waste Electric and Electronic Equipment) in the Nordic Region; Norden: Copenhagen, Denmark, 2014. [Google Scholar]
- ICER. ICER: Industry Council for Electronic Equipment Recycling. 2000. Available online: https://icer.org.uk/ (accessed on 23 May 2022).
- Magalini, F.; Huisman, J. WEEE Recycling Economics: The Shortcomings of the Current Business Model? EERA Presentation; United Nations University: Tokyo, Japan, 2018. [Google Scholar]
- Dimitrakakis, E.; Janz, A.; Bilitewski, B.; Gidarakos, E. Small WEEE: Determining recyclables and hazardous substances in plastics. J. Hazard. Mater. 2009, 161, 913–919. [Google Scholar] [CrossRef]
- Chancerel, P.; Rotter, S. Recycling-oriented characterization of small waste electricaland electronic equipment. Waste Manag. 2009, 29, 2336–2352. [Google Scholar] [CrossRef] [PubMed]
- Parajuly, K.; Wenzel, H. Potential for circular economy in household WEEE management. J. Clean. Prod. 2017, 151, 272–285. [Google Scholar] [CrossRef]
- Novak, E. Verwertungsmöglichkeiten für Ausgewählte Fraktionen aus der Demontage von ElektroaltgerÄTEN Kunststoffe; OFI Kunststoff Institut: Vienna, Austrtia, 2001. [Google Scholar]
- Achilias, D.; Antonakou, E. Chemical and Thermochemical Recycling of Polymers from Waste Electrical and Electronic Equipment; InTechOpen: London, UK, 2015. [Google Scholar]
- Stenvall, E.; Tostar, S.; Boldizar, A.; Foreman, M.; Möller, K. An Analysis of the Composition and Metal Contamination of Plastic from Waste Electrical and Electronic Equipment (WEEE). Waste Manag. 2013, 33, 915–922. [Google Scholar] [CrossRef] [PubMed]
- Freegard, K.; Tan, G.; Morton, R. Develop a Process to Separate Brominated Flame Retardants from WEEE Polymers—Final Report; The Waste & Resources Action Programme (WRAP): Banbury, UK, 2006. [Google Scholar]
- Maris, E.; Botane, P.; Wavrer, P.; Froelich, D. Characterizing plastics originating from WEEE: A case study in France. Miner. Eng. 2015, 76, 28–37. [Google Scholar] [CrossRef]
- Palmieri, R.; Bonifazi, G.; Serranti, S. Recycling-oriented characterization of plastic frames and printed circuitboards from mobile phones by electronic and chemical imaging. Waste Manag. 2014, 34, 2120–2130. [Google Scholar] [CrossRef] [PubMed]
- Jandric, A.; Part, F.; Fink, N.; Cocco, V.; Mouillard, F.; Huber-Humer, M.; Salhofer, S.; Zafiu, C. Investigation of the heterogeneity of bromine in plastic components as an indicator for brominated flame retardants in waste electrical and electronic equipment with regard to recyclability. J. Hazard. Mater. 2020, 390, 121899. [Google Scholar] [CrossRef]
- Drage, D.; Sharkey, M.; Abou-Elwafa Abdallah, M.; Berresheim, H.; Harrad, S. Brominated flame retardants in Irish waste polymers: Concentrations, legislative compliance, and treatment options. Sci. Total Environ. 2018, 625, 1535–1543. [Google Scholar] [CrossRef]
- Aldrian, A.; Lederstager, A.; Pomberger, R. Monitoring of WEEE plastics in regards to brominated flame retardants using handheld XRF. Waste Manag. 2015, 36, 297–304. [Google Scholar] [CrossRef]
- Gy, P. Sampling of Discrete Materials—A new introduction to the theory of sampling: I. Qualitative approach. Chemom. Intell. Lab. Syst. 2004, 74, 7–24. [Google Scholar] [CrossRef]
- Gy, P. Sampling of Discrete Materials: II. Quantitative—Sampling of zero-dimensional objects approach. Chemom. Intell. Lab. Syst. 2004, 74, 25–38. [Google Scholar]
- Gy, P. Sampling of Discrete Materials: III. Qualitative approach—Sampling of one-dimensional objects. Chemom. Intell. Lab. Syst. 2004, 74, 39–47. [Google Scholar]
- Wäger, P.; Schluep, M.; Müller, E. RoHS Substances in Mixed Plastics from Waste Electrical and Electronic Equipment; EMPA Materials Science and Technology: Dübendorf, Switzerland, 2010. [Google Scholar]
- Tange, L.; Van Houwelingen, J.; Peeters, J.; Vanegas, P. Recycling of Flame Retardant Plastics from WEEE, Technical and Environmental Challenges. Adv. Prod. Eng. Manag. 2013, 8, 67–77. [Google Scholar] [CrossRef][Green Version]
- Schlumer, M.; Gruber, L.; Mäurer, A.; Wolz, G.; Van Eldik, R. Characterisation of polymer fractions from waste electricaland electronic equipment (WEEE) and implicationsfor waste management. Chemosphere 2007, 67, 1866–1876. [Google Scholar] [CrossRef] [PubMed]
- Gent, M.; Menendez, M.; Toraño, J.; Diego, I. Recycling of plastic waste by density separation: Prospects for optimization. Waste Manag. Res. 2009, 27, 175–187. [Google Scholar] [CrossRef] [PubMed]
- Cardamone, G.; Ardolino, F.; Arena, U. Can plastics from end-of-life vehicles be managed in a sustainable way? Sustain. Prod. Consum. 2022, 29, 115–127. [Google Scholar] [CrossRef]
- Salhofer, S.; Tesar, M. Assessment of removal of components containing hazardous substances fromsmall WEEE in Austria. J. Hazard. Mater. 2011, 186, 1481–1488. [Google Scholar] [CrossRef] [PubMed]
Publisher’s Note: MDPI stays neutral with regard to jurisdictional claims in published maps and institutional affiliations. |
© 2022 by the authors. Licensee MDPI, Basel, Switzerland. This article is an open access article distributed under the terms and conditions of the Creative Commons Attribution (CC BY) license (https://creativecommons.org/licenses/by/4.0/).