Article

Impact Assessment of Changing Landcover on Flood Risk in the Indus River Basin Using the Rainfall–Runoff–Inundation (RRI)

Graduate School of Architecture and Civil Engineering, Toyohashi University of Technology, Toyohashi 441-8580, Aichi, Japan
*
Author to whom correspondence should be addressed.
Sustainability 2022, 14(12), 7021; https://doi.org/10.3390/su14127021
Submission received: 21 April 2022 / Revised: 31 May 2022 / Accepted: 6 June 2022 / Published: 8 June 2022

Abstract

:
Flooding is frequent in the province of Punjab, Pakistan, because the Indus River is a confluence point of five rivers. Researchers have primarily focused on the northern parts of the Indus basin and they have reported on simulation models that can be applied to the evaluation of flood risk. However, the inundation risks in the southern parts of the basin, including the impact of urbanization in this region, require a further assessment. The severity of flood disasters in the upper and lower reaches of the Indus basin are equally important because flash floods and riverine flooding pose a threat to densely populated areas. In this work, we aim to simulate flooding and the effects of landcover changes on inundation in the upper and lower Indus basin. Inundation was determined using the Rainfall–Runoff–Inundation (RRI) model with rainfall data from the monsoon season (00:00 UTC 1 July 2015–00:00 UTC 1 September 2015) as the input. After validating the model, sensitivity experiments were conducted to analyze the effect of landcover changes on the inundation of the Indus basin. The RRI model results showed that planting in the bare and vegetated areas led to minimum inundation in the Indus basin. Based on these results, planting between the Indus River and Chenab River could prevent flood disasters downstream of the confluence point as the discharge values reduced from 15,695.2 m3/s to 12,078.3 m3/s and 4373.7 m3/s to 2934.6 m3/s in the Indus River and Chenab River, respectively, before the confluence point. In contrast, urbanization in Punjab increased the risk of inundation after the confluence point caused by an increased discharge from 12,078.3 m3/s to 14,190.4 m3/s and 2934.6 m3/s to 4229.5 m3/s in the Indus River and Chenab River, respectively, before the confluence point.

1. Introduction

There are a significant number of minor, moderate, and major floods in Pakistan. These floods cause considerable damage to property and loss of human life. Manzoor et al. investigated historical flood events in Pakistan during the period from 1947 to 2011 [1]. They analyzed the damage by categorizing them into human, house, and monetary damage. They found that the most extensive damage to humans, houses, and the economy were caused by the floods of 1950, 1973, and 2010, respectively. The country has lost more than USD 38.169 billion in the past 73 years and approximately 13,262 lives due to flooding [2,3].
The factors influencing flooding in Pakistan include extreme rainfall due to cloud outbursts, climatic changes associated with the increasing temperature of the globe, and the socio-economic development of agricultural land. Pakistan is highly vulnerable to flooding due to its unique geography and dependence on water resources [4]. The main factors that affect flooding are rainfall and land cover change. Unplanned urbanization increases the risk of frequent flooding in the future [5]. Currently, Pakistan exceeds all its previous rainfall records; the rainfall trend is predicted to continue to rise in the future. The fluctuation in rainfall causes droughts and flooding in different places in Pakistan [6]. Pakistan is undergoing urban growth and development and the land use situation is expected to change in the future [7,8,9].
Flooding impact areas occur due to intense rainfall during the monsoon period in Pakistan and have an immense impact on the Indus basin. The Indus River is the longest river in Pakistan and its discharge depends on the runoff from the upstream mountain regions [10]. Climate change will impact glaciers in mountain regions and the peak discharge intensity is likely to increase in the Indus basin [10]. Previous studies have focused on flood risk evaluations of the upper Indus basin because of the presence of mountains and the difficulty in hazard management [11]. A detailed study on the behavior of floods downstream of the Indus River is essential, especially after the confluence point of the Chenab River and the Indus River. In 2015, the maximum peak discharge after the confluence point of these rivers caused a riverine flooding incident [12].
Figure 1 shows the increase in population density from 2010 to 2020 and the proximity to the waterways. Based on the population density data (Figure 1), highly populated urban areas situated just after the confluence coincide with the maximum discharge flow pathways and are, therefore, at a serious risk of flooding. There is limited research on categorizing the inundation areas according to the severity of damage in Pakistan. This area is the most flood-prone district (Rahim Yar Khan) according to the Provisional Disaster Management Authority (PDMA), Punjab, Pakistan [13]. This area has also been selected by researchers for flood hazard and agricultural risk management [14]. As the population of the Punjab province is projected to increase further, and as the current urban settlements located after the confluence are already in close proximity to the waterways, there are severe flooding risks to the district of Rahim Yar Khan.
The computational simulation of flooding using hydrological software is a common technique used for flood risk evaluations [15,16,17,18]. Several one-dimensional hydrological models such as HEC-HMS [19], TOPMODE [20], VIC [21], and IFAS [22] have been developed to analyze river discharges. However, one-dimensional hydrological models should be combined with hydraulic models to analyze inundation in a river basin. For the projection of inundation and the validation of such research, it is necessary to use two-dimensional simulation software. iRIC Nays2D [23], SOBEK [24], and the Rainfall–Runoff–Inundation (RRI) models are common two-dimensional computation models for inundation and water discharge. The RRI model is a two-dimensional hydrological model that calculates flooding based on both rainfall data and runoff [25]. The model can simulate inundation in both mountainous river basins and flat river basins [26]. RRI, unlike SOBEK and iRIC Nays2D, can simulate flooding over a larger basin area for a longer target observation period with relatively accurate results. Sayama et al. studied the Kabul River in Pakistan and conducted a simulation using RRI for runoff and inundation [18]. The simulation results from the 2010 flooding corresponded with the actual inundation map made through remote sensing. The simulation results also provided predictions about the damaged areas prior to the disaster with limited input information [18]. This model is also suitable for the input of landcover change data and can simulate inundation and discharge in a short period of time.
In this study, we examined the 2015 flood event that occurred in the densely populated area located downstream of the confluence point of the Indus and Chenab Rivers using the RRI simulation model. We aimed to comprehensively evaluate the inundation risks (inundation depth, peak inundation discharge, and inundation area) by considering extreme rainfall events over densely populated areas located downstream of the confluence point of the Indus and Chenab Rivers (Figure 2). In addition, sensitivity experiments for land use were conducted to reveal the impact of land-use change on inundation. This study contributes to the countermeasures for flooding at high-density population areas after the confluence point and the subsequent prevention of damage.

2. Materials and Methods

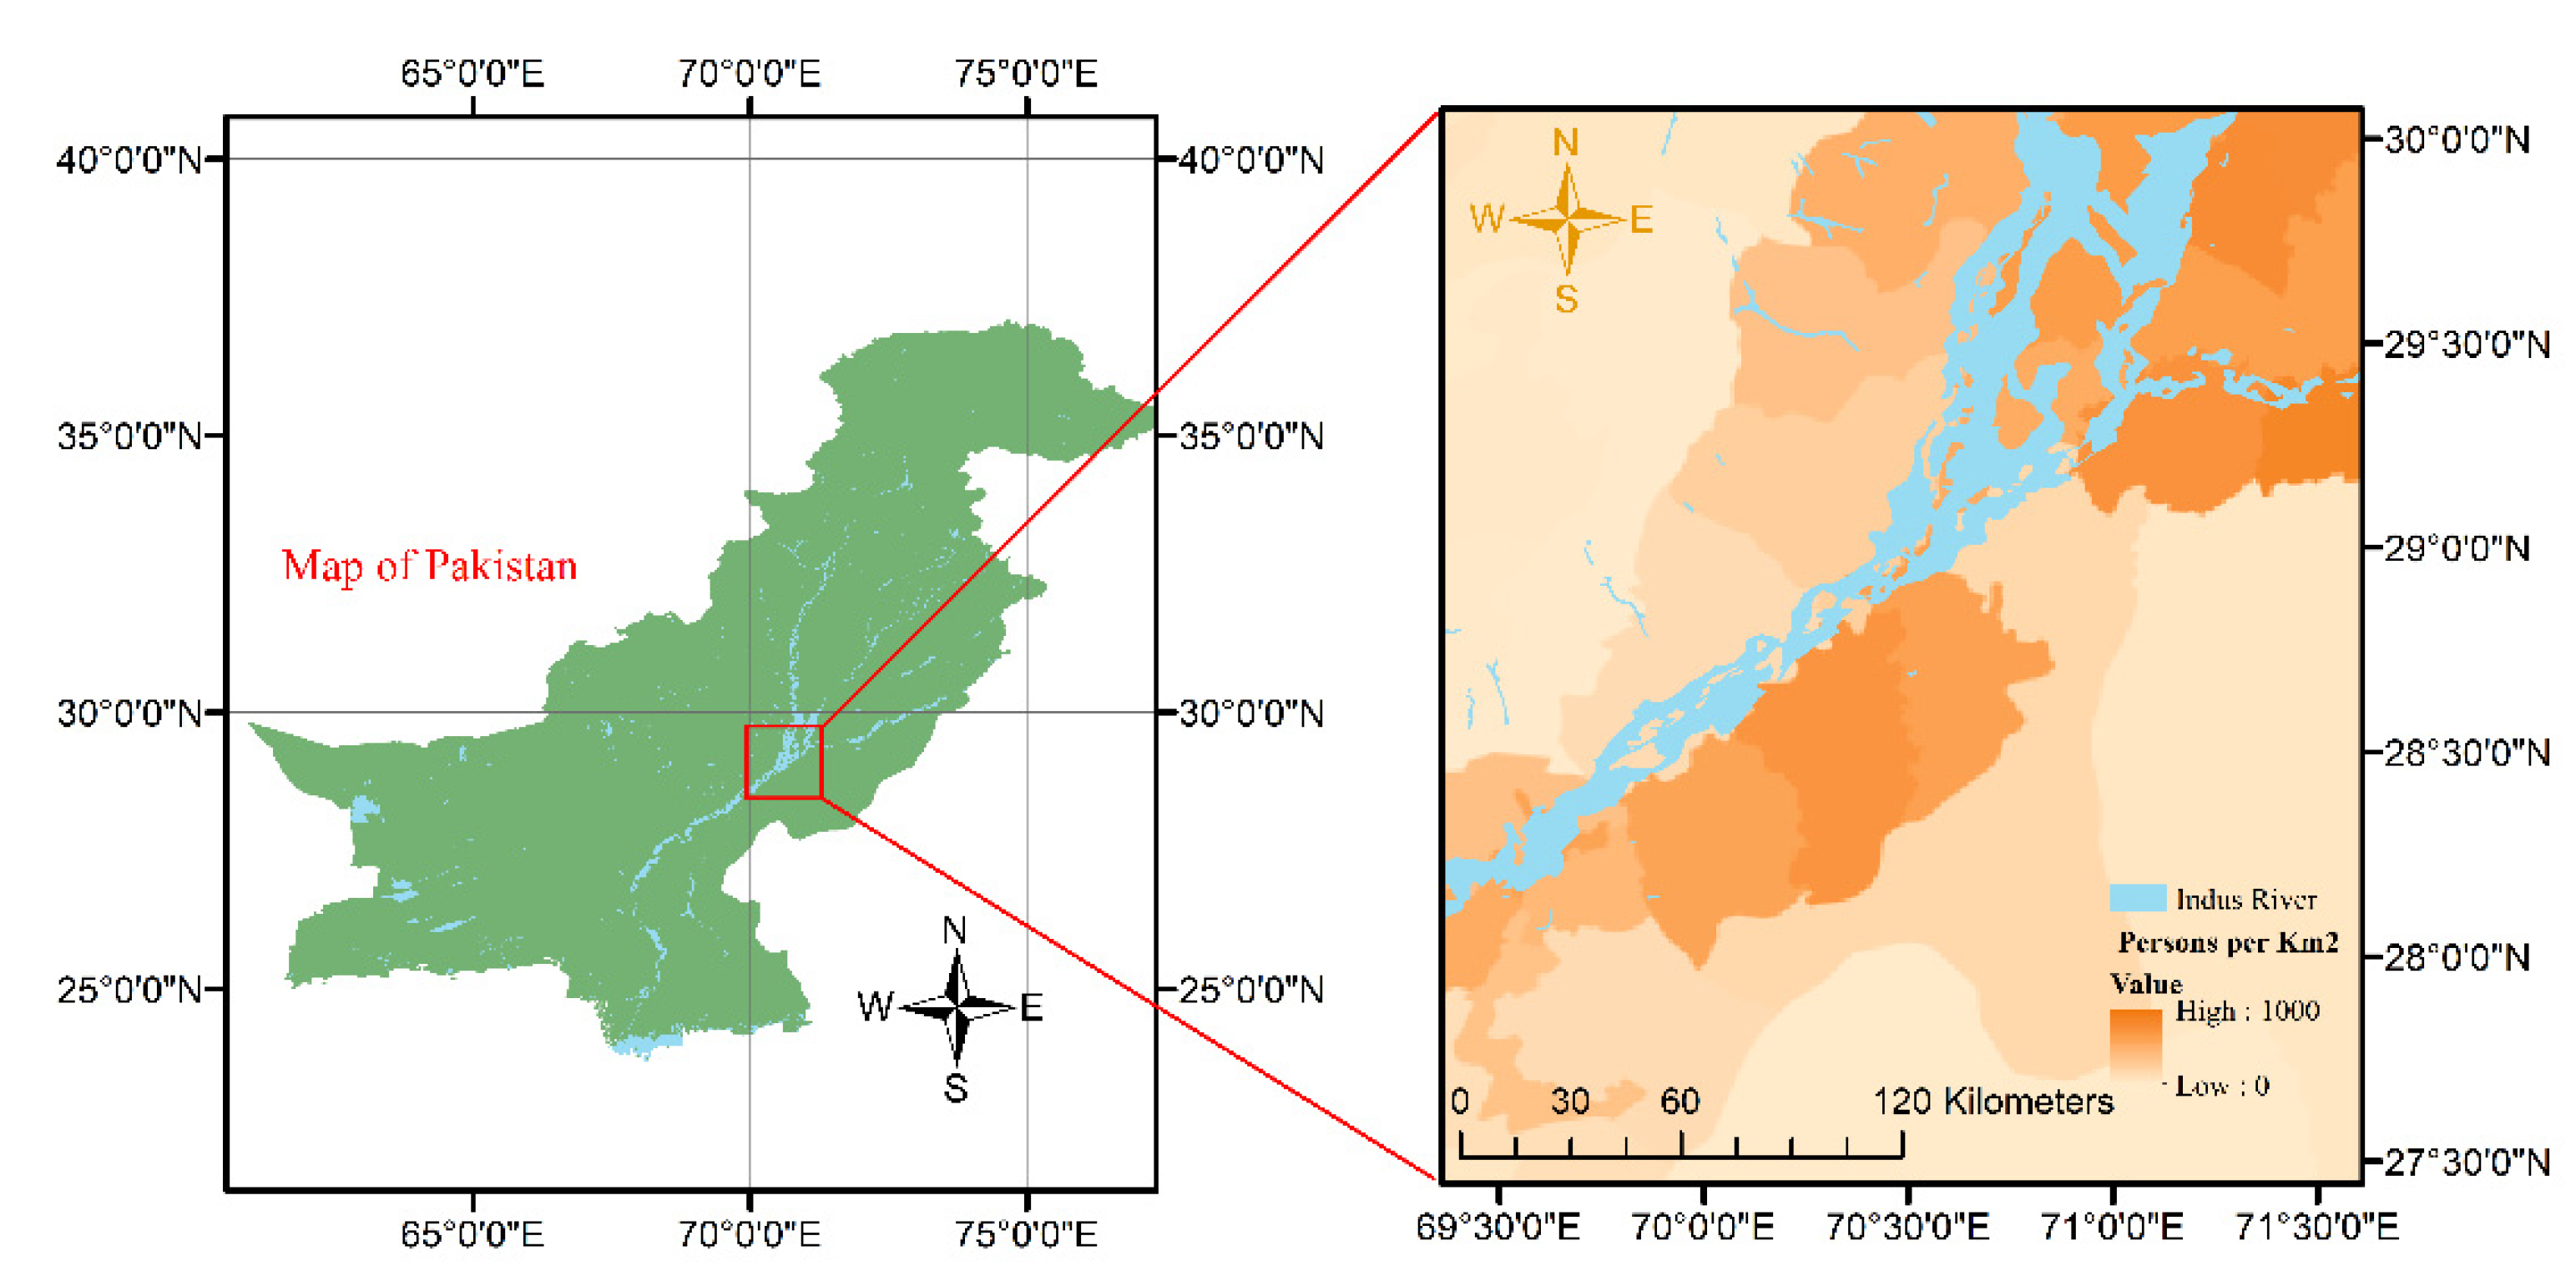
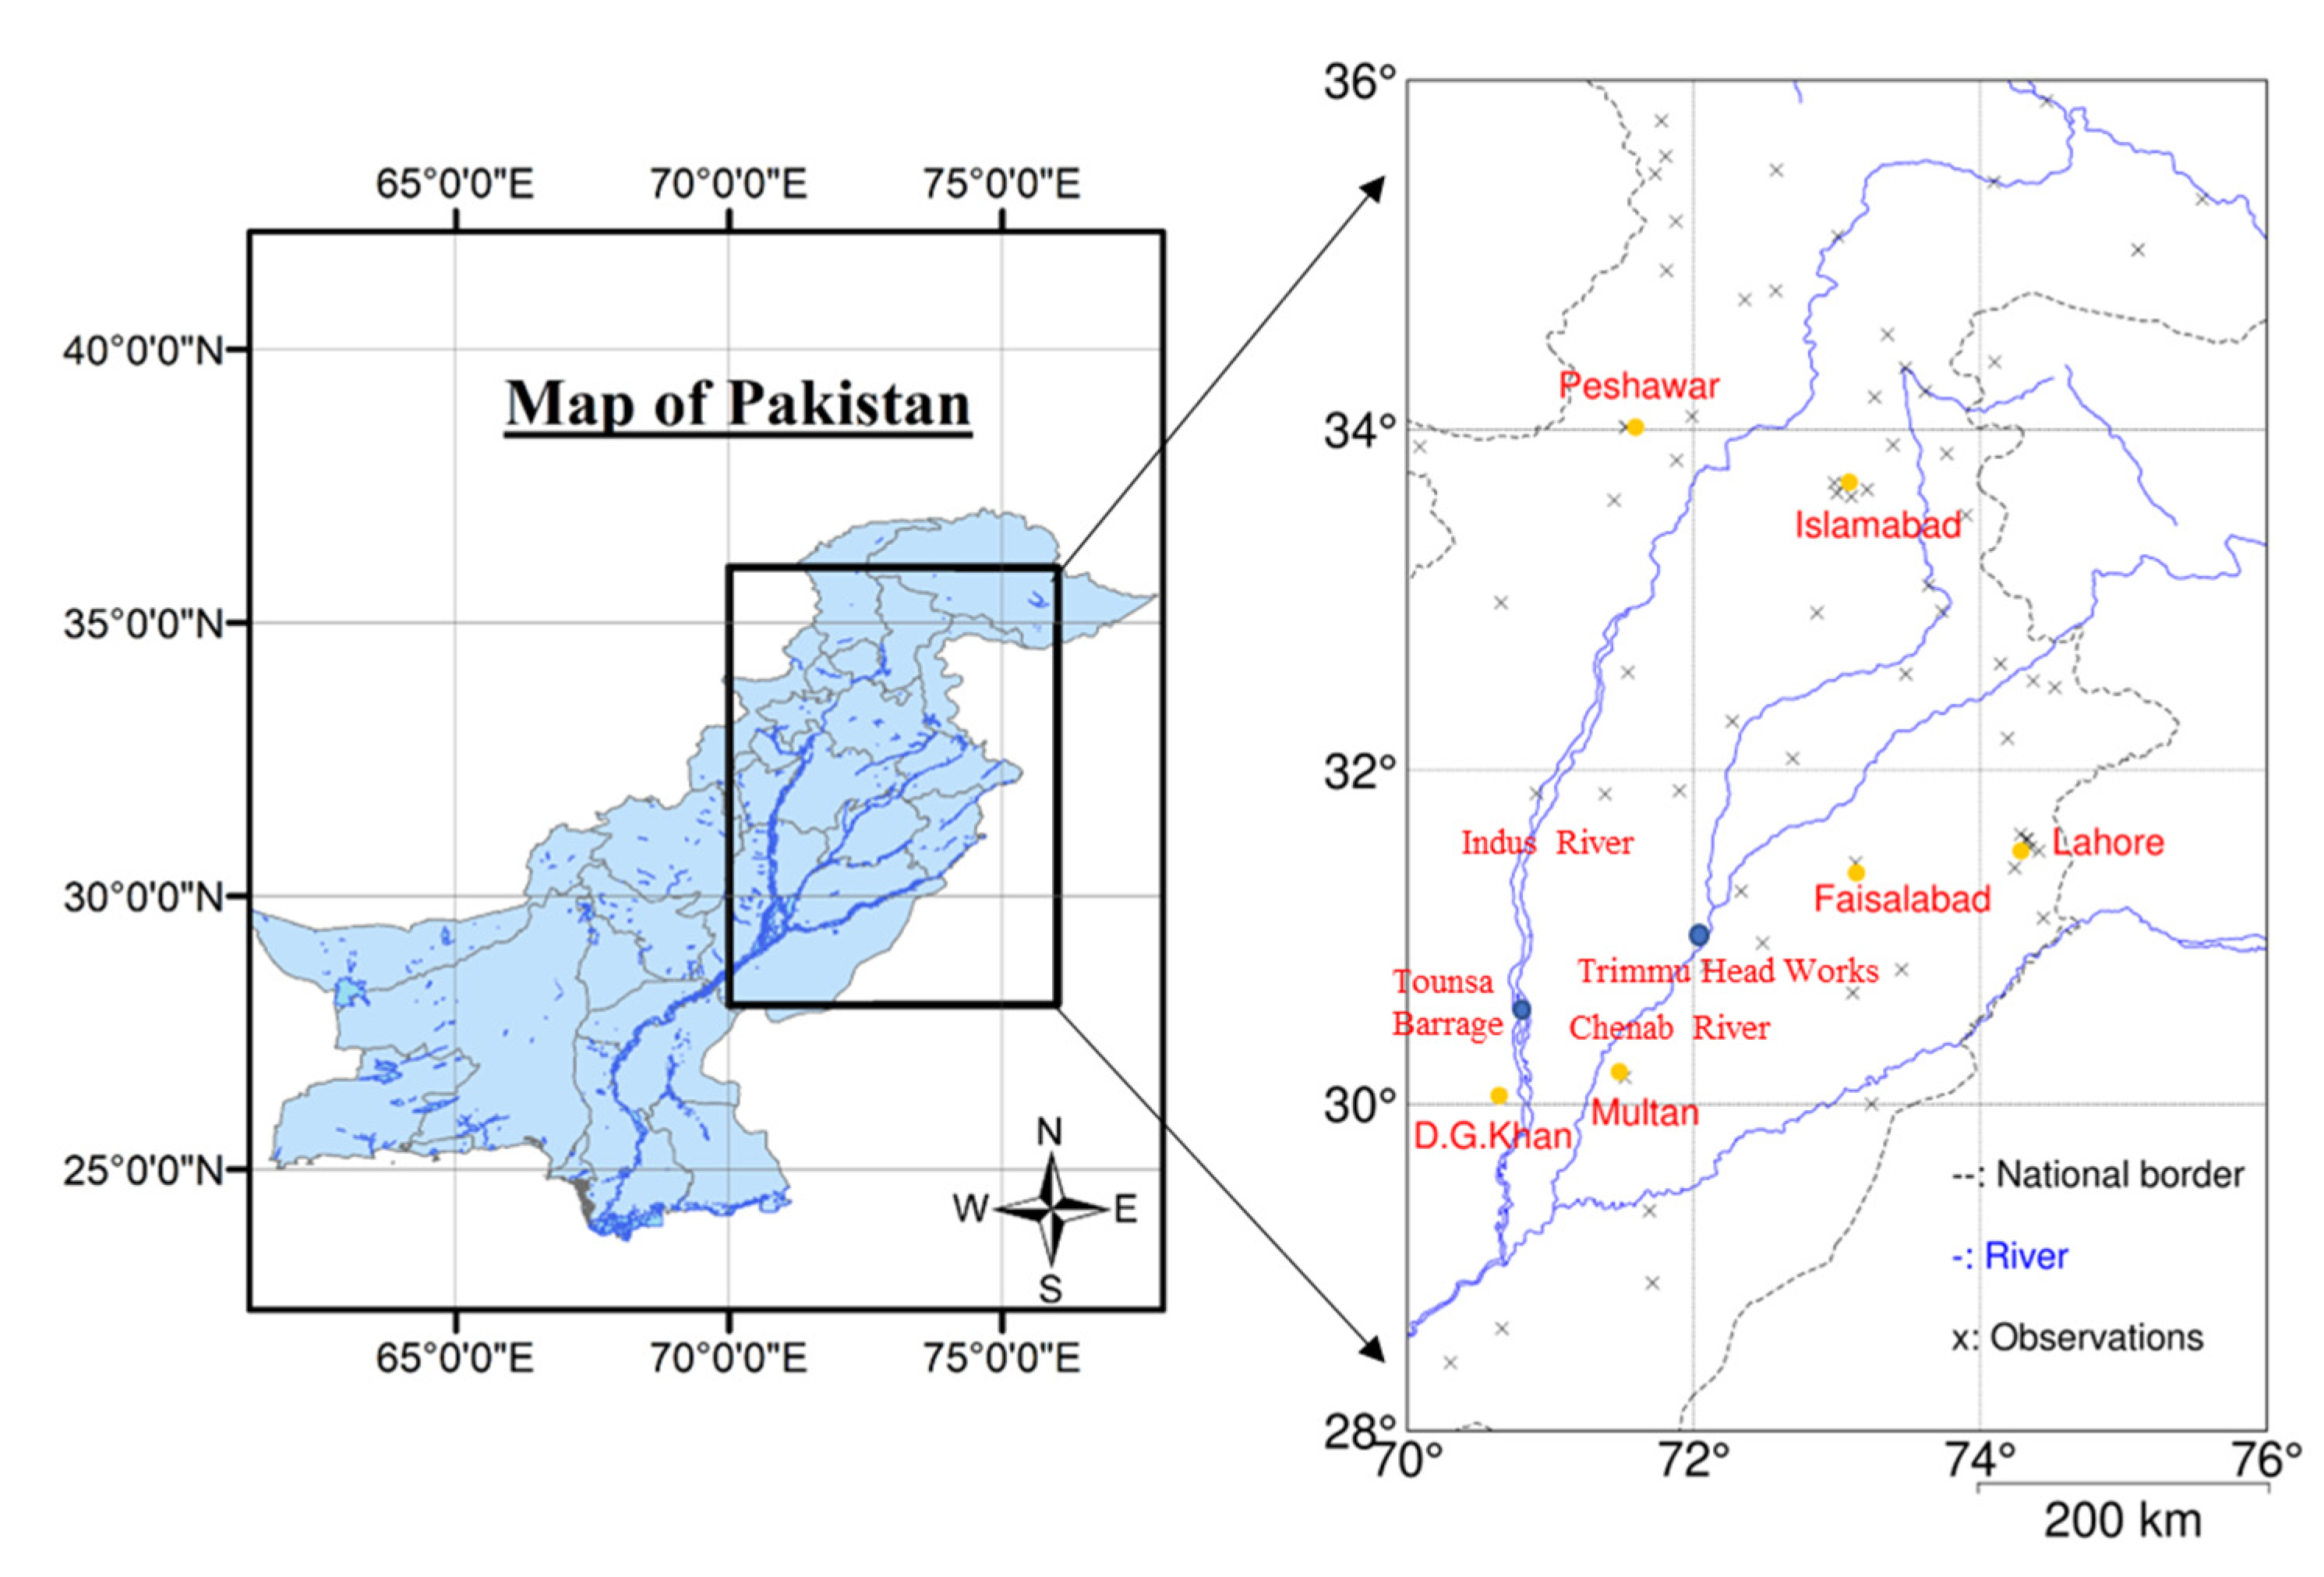
2.1. Description of the Study Area

The study area in the simulation included most areas of the Punjab province and several areas of the Khyber Pakhtunkhwa (KPK) and Gilgit Baltistan provinces (Figure 3). The upper areas of Punjab and KPK are mostly surrounded by mountains and have a higher rate of rainfall during the monsoon period [6]. The Indus River originates from the Himalayas and its water is replenished by the monsoon rainfall [27]. The Indus River is one of the longest rivers in South Asia (3200 km) and flows from the northern part of Pakistan into the Arabian Sea. In this territory, five rivers (Sutlej, Beas, Ravi, Chenab, and Jhelum) flow and combine with the Indus River, which surges peak discharges at the confluence point [28]. Previously, studies on flood risk evaluations focused on the mountainous parts of Pakistan (owing to its relatively high precipitation rate that occurs in a short period) and the narrow flow structure [12]. In the southern part of the Indus River, flooding also occurs due to high precipitation and the integration of the rivers. Therefore, the suitable management of flood prevention is also needed for the southern parts of the Indus River to avoid damage to properties and risk to human lives. The Punjab province is the most populated province in Pakistan, with rivers constantly flowing throughout the year. Owing to the characteristics of the low-lying area after the confluence point of the Chenab and Indus Rivers with the highest water flow discharge, this area is the most vulnerable to flooding [3,29,30].

2.2. Rainfall–Runoff–Inundation (RRI) Model

The RRI model is a hydrological and hydraulic integrated model developed by Sayama et al. [25]. The RRI model is a two-dimensional model capable of simultaneously simulating rainfall runoff and flood inundation. The model can simulate flood inundation using rainfall data. In the RRI model, the flow on the slope grid cells is calculated using a two-dimensional wave-diffusive model and the river channel flow is calculated using a one-dimensional wave-diffusive model. The model also simulates the lateral subsurface flow and vertical infiltration with the surface flow. Due to the steep slopes in mountainous regions, the lateral subsurface flow is more important than vertical infiltration and was, therefore, calculated as a discharge-to-hydraulic gradient relationship. The vertical infiltration flow was estimated using the Green–Ampt model. The model for calculating the slope grid cell flow used mass balance and momentum equations for a gradually varied and unsteady flow. The flow in the river grids was calculated using a one-dimensional wave equation. The cross-section of the river was assumed to be rectangular with a width of W, a depth of D, and an embankment height of He. The width and depth parameters (Cw, Cd) were found through the upstream contributing area, A (km2), of Equations (1) and (2).
W = C w A s w
D = C d A s d
The simulation results of RRI are sensitive to the cross-sectional parameters of a river. The river width parameters at the Guddu Barrage sites were obtained from Google Earth with the help of a known variable of the catchment area (Equation (3)). The depth parameters were obtained from a previous study [31] with a maximum limitation of 4.5 m (Equation (4)).
W = 3.5 A 0.45
D = 0.1 A 0.4
The topographical data inputs for the RRI simulation were the digital elevation model (DEM), the flow direction (DIR), and the flow accumulated (ACC) models, which were obtained from the Hydro SHEDS project of the U.S. Geological Survey (USGS). The coordinates of the selected areas were 28°58′30″ N, 70°31′00″ E to 29°17′30″ N, 70°46′30″ E (Figure 3). The total simulation area of the RRI model was 289,000 km2. The catchment area of the KPK and Gilgit Baltistan provinces were selected to estimate accurate results based on the high levels of precipitation and accumulation of water in those areas. The original resolution of the topographical data was 1/30 degrees, but it was scaled up to 1/60 degrees using the RRI program. The RRI model can upscale topographical files in both graphical and command interfaces. The high DEM resolution gave a high-resolution inundation map, but increased the computation time due to the large input study area. The validation of the control case and sensitive experiments required an extended time for the simulation with a high resolution, which was suitable for the computational functionality of the RRI model. The number of cells was 99,500, with a resolution of approximately 1.6 km (Table 1).

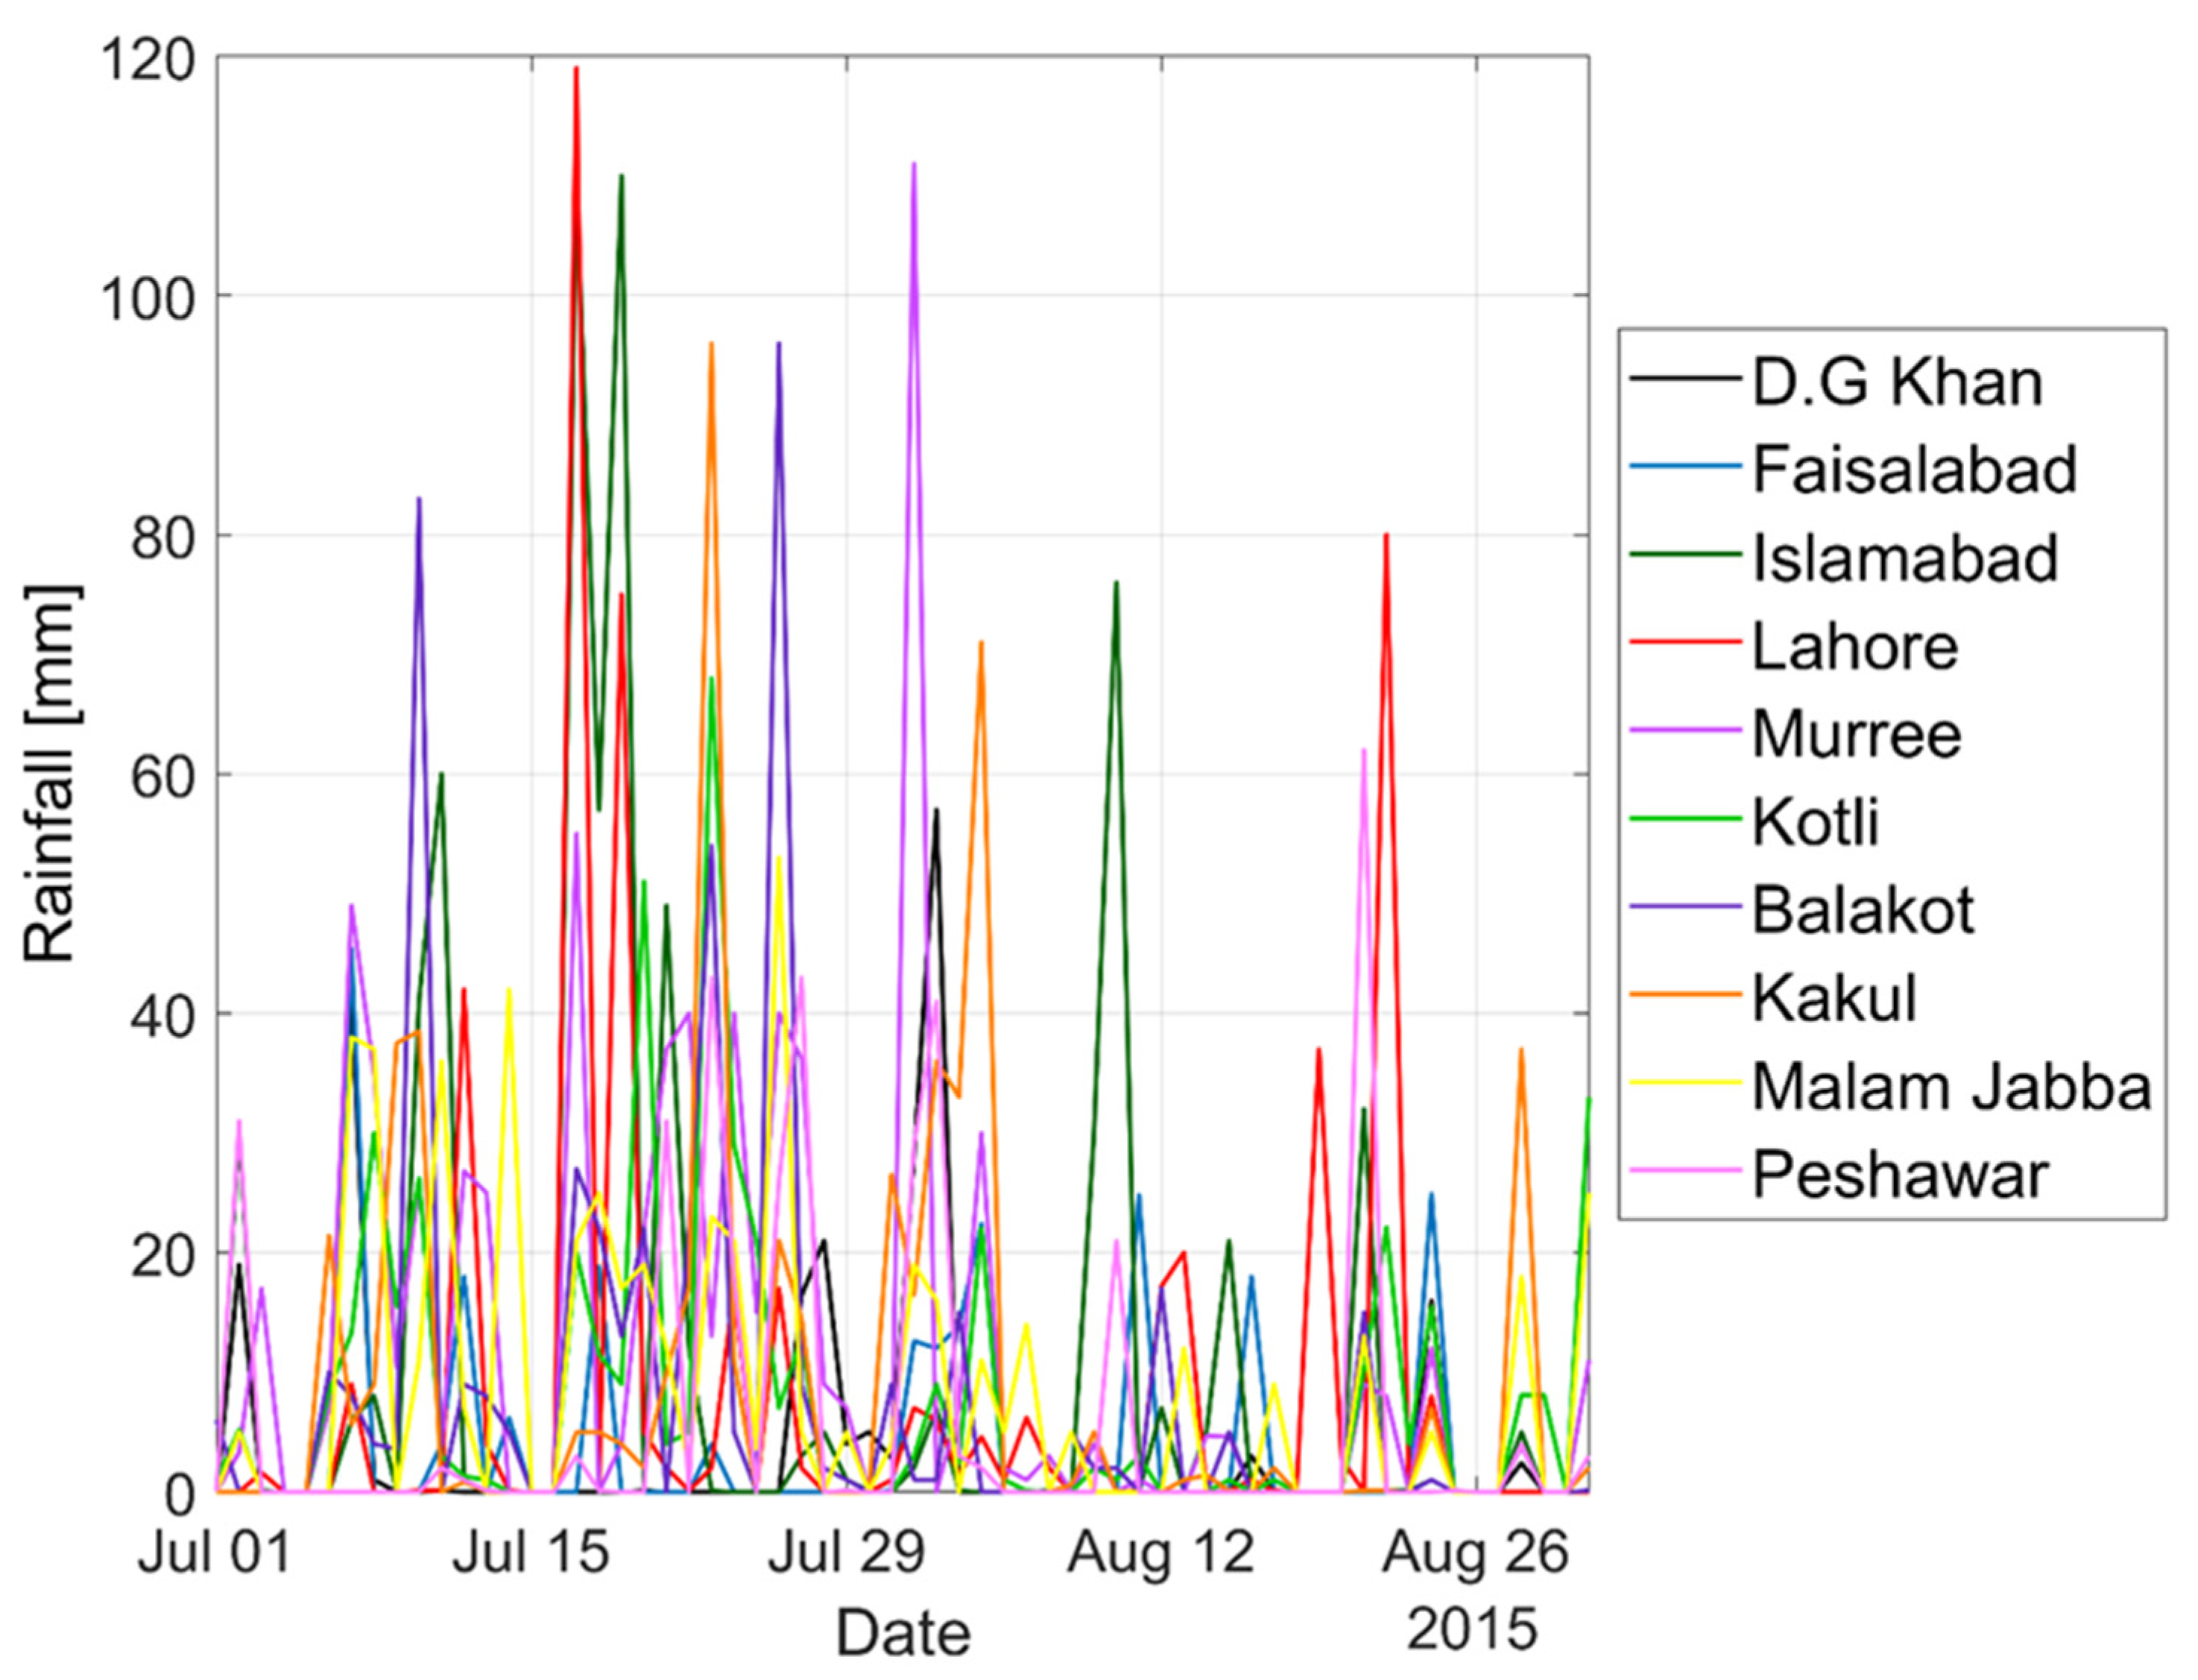
2.3. Gauged Rainfall and Runoff Data

The real-life rainfall data of the entire area under consideration were obtained from the Pakistan Meteorological Department (PMD) and were used as input data to obtain accurate results. The PMD is a science and service department that was established in 1947. It has rainfall observation points all over Pakistan. There were 70 sites of rainfall gauges distributed throughout the study area; these are denoted by × in Figure 3. The rainfall data were the daily average precipitation data recorded at 70 specific sites. The duration of the data was 00:00 UTC 1 July 2015–00:00 1 September 2015 with 62 days from the monsoon seasons. Monsoons in Pakistan are caused by the seasonal moisture-carrying winds that originate from the Bay of Bengal and move across into the Arabian Sea [32]. The winds enter Pakistan around mid-July and cause heavy rainfall from July to September. A few of the major sites of rainfall observation are mentioned in Figure 4. Intensive rainfall was observed from 15 July 2015 to 29 July 2015. The point rainfall data were converted to distributed rainfall data using the Thiessen polygon method [33].

2.4. Validation of the Results

For the validation of the RRI simulation results, the observed time series discharge at the Tounsa Barrage site (upstream of the Indus River, before the confluence point of the Indus and Chenab Rivers) and the Trimmu site (upstream of the Chenab River, before the confluence point of the Indus and Chenab Rivers) was obtained from a 2015 federal flood commission report and was compared with the simulated discharge. The statistical indicator used for the validation was the Nash–Sutcliffe efficiency (NSE) coefficient [34], which was calculated using Equation (5):
N S E = 1 t = 1 T Q c t Q o t 2 t = 1 T Q o t Q m 2
where Qc is the calculated discharge, Qo is the observed discharge, and Qm is the mean of the observed discharge; the ratio of the error variance of the modeled time series is divided by the variance of the observed time series. For the validation of the sites located after the confluence point of the Chenab and Indus Rivers, a moderate resolution image spectroradiometer (MODIS) and near real-time (NRT) global flood mapping from the National Aeronautics and Space Administration (NASA) were used. The key data sources of the MODIS NRT flood products are the Terra and Aqua satellites of NASA, which provide daily global coverage. The water detection algorithm uses a ratio of MODIS 250 m reflectance Band 1 to Band 2; a threshold on Band 7 identifies pixels as water. For the comparison between the observed and calculated values of the flooded areas, the fit value (%) [35] was calculated by dividing the common flooded inundation area ( I A o b s     I A s i m ) in RRI and MODIS by the total flooded area in RRI and MODIS ( I A o b s     I A   s i m ) (Equation (6)).
F i t = I A o b s     I A s i m I A o b s     I A   s i m

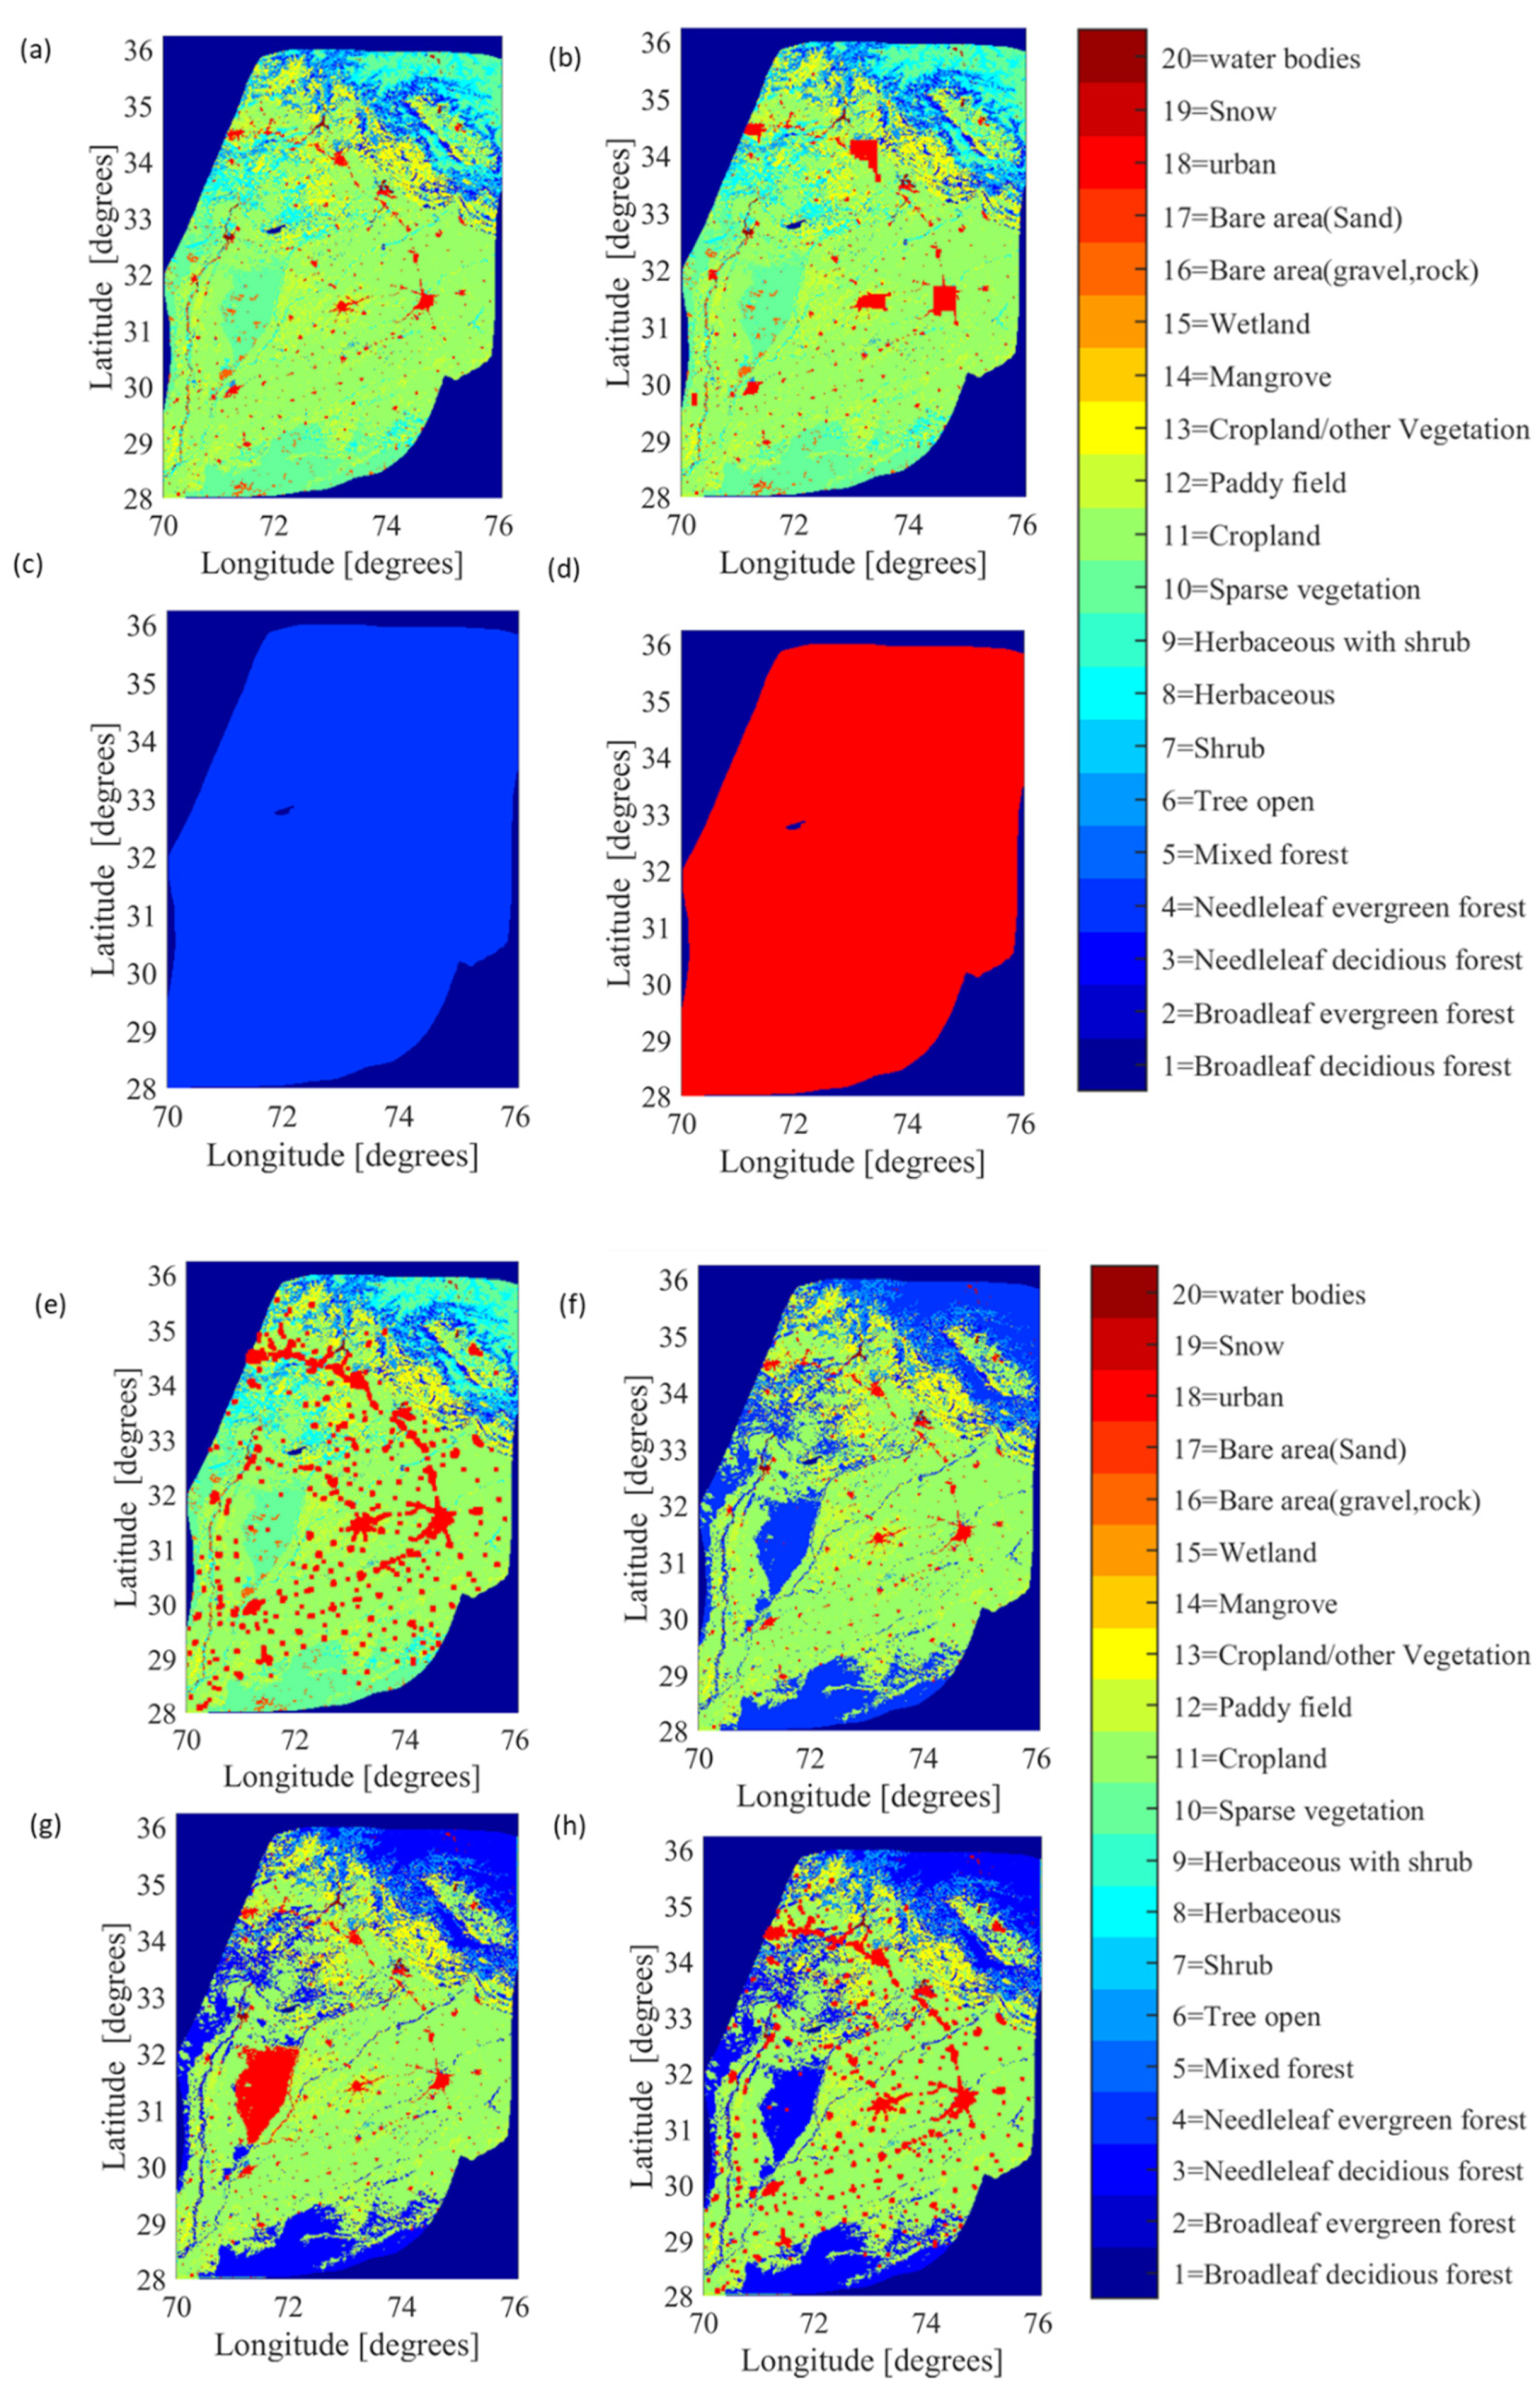
2.5. Sensitivity Experiments

The majority of the original land cover data in the RRI were represented by mixed forests in the northern parts of Pakistan (Case 1). The majority of the downstream basin area was cropland (Figure 5a). There were 20 distinct classifications of land cover. The original land cover data were classified as seven different land cover profiles. In Case 2, six major city areas of Pakistan (Lahore, Islamabad, Peshawar, Faisalabad, D.G. Khan, and Multan) were expanded (Figure 5b). The surrounding grids of these city areas were converted into urban grids. In Case 3, all the grids were converted into forests (parameter 4) (Figure 5c). In Case 4, all the grids of the study area in the RRI simulation were converted into urban grids (Figure 5d). In Case 5, the surrounding eight grids of the current urban grids were converted into urban grids (Figure 5e). In Case 6, shrubs, herbaceous and sparse vegetation, and bare area grids were converted into a forest (Figure 5f). In Case 7, the area between the Indus and Chenab Rivers was converted into an urban area combined with the Case 6 area (Figure 5g). In Case 8, Cases 5 and 6 were combined (with simultaneous planting and urbanization) (Figure 5h). All these cases are summarized in Table 2. Note that these sensitivity experiments were carried out without changing the water circulation (total rainfall and evaporation) in Pakistan.

3. Results and Discussion

3.1. Reproductive Experiments

The RRI simulation results were calibrated with the actual 2015 flood data obtained from the Federal Flood Commission, Ministry of Water and Power, Government of Pakistan. The time series curve of the discharges before the confluence point obtained from the RRI simulation was matched with the actual discharge curve of the 2015 monsoons at the Trimmu (Chenab River) and Tounsa Barrage (main Indus River) sites. The RRI parameter settings for satisfactory simulation results are listed in Table 1. The discharge curves for the complete monsoon duration obtained from the RRI simulation corresponded with the actual discharge curve obtained from the Pakistan flood commission report of 2015 (Figure 6). The NSE coefficients at the site of Tounsa and the site of Trimmu were 0.83 and 0.67, respectively. The unavailability of survey data for rivers in Pakistan as well as the large basin simulation area reduced the efficiency of the model. NSE coefficients of 0.8 and 0.7 obtained from the two-month rainfall simulation proved the high efficiency of the model. The peak discharge of the actual observed data at the Tounsa and Trimmu sites was 16,925.0 m3/s and 3814.3 m3/s, respectively, and closely matched the calculated peak discharge of 15,695.2 m3/s and 4373.7 m3/s, respectively. After calibrating the results, it was confirmed that the RRI model performed efficiently in the sensitivity experiments.
After the validation of the upstream discharge values, the downstream inundation values were validated for the accurate results of the flood projections for the sensitivity experiments. For the flood assessment, the RRI-simulated inundation area was extracted at the confluence point where the population density was the highest. The RRI-simulated model showed an inundation area, as seen in Figure 7c.
Due to the limited (actual) data recorded during the flooding of 2015, the RRI inundation area was compared with the satellite image from MODIS for that year (Figure 7b). The satellite MODIS data only depicted the inundation area; they did not reveal any information about the inundation depth to allow for a comparison with the simulation data. The MODIS data had four data values (no data available, no water, water bodies, and flooded area). Due to cloud cover, data were not available for the blue area in the MODIS image as shown in Figure 7b; however, the target area was not affected by clouds. The target areas in both RRI and MODIS (Figure 7c,d) were first extracted and then compared using interpolation to find the fit value for the validation. The fit value of the inundation area obtained from RRI and MODIS was 0.67, which showed a good agreement between the observed and the calculated data.

3.2. Sensitivity Experiments Using RRI

Figure 8, Figure 9 and Figure 10 show the results of the sensitivity experiments. Figure 8 shows the inundation area from RRI in each case. Figure 9 indicates the time series of the discharge of the sensitivity experiments at Tounsa Barrage. Figure 10 indicates the time series of the discharge of the sensitivity experiments at Trimmu head works. As land cover has a significant impact on the range of inundation and the magnitude of flooding, a total of eight cases were calculated, ranging from extreme to realistic cases (including the control case).
The land cover change in Cases 2 and 5 (Table 2) had a more severe flooding impact compared with the actual inundation case (Case 1, Figure 8b,e). The change in water level from Case 1 was not significant; however, a few grids in the upstream area around 31–33 degrees north showed inundation. Therefore, urbanization had an impact on the magnitude of flooding in the upstream area. Conversely, the scale of flooding at the confluence point was almost similar to the one in Case 1 (Figure 9 and Figure 10; yellow and brown). This was because the urbanized area was located far from the main river area and had a smaller impact on the main river flow. Case 3 (Table 2) showed no inundation areas in the sensitivity experiments (Figure 8c); here, the discharge was smaller than the other cases (Figure 9 and Figure 10; green). The recognition of each grid as a forest reduced the surface flows and prevented inundation. Case 4 (Table 2) had the worst inundation with the surrounding river areas inundated with water (Figure 8d). Figure 9 and Figure 10 (red) suggest that excessive development could lead to severe flooding. Case 6 (Table 2) had a large impact on the inundation area, the flow of the main Indus River, and the confluence point (Figure 8f). This trend could be explained by the rainfall intensity and planting position: planting vegetation, especially in the upper Indus basin, coincided with a high precipitation area and, therefore, reduced the impact of inundation on the upper Indus basin and the flow of the main river. Planting in the middle of the Chenab and Indus Rivers reduced the discharge at the Chenab River (Figure 10; purple). Ultimately, afforestation mainly impacted inundation at the confluence point by reducing the discharge value in the Chenab River. In Case 7 (Table 2), the Indus River flow had less flow discharge than the control (Case 1) (Figure 8g); this showed that development could occur whilst reducing the flooding scale by promoting planting alongside urbanization in the upper Indus basin. However, compared with Case 6, the development between the rivers could cause flooding near the confluence point areas. Case 8 also had a similar inundation pattern as Case 7 (Figure 8h). In this case, the current urban area was expanded whilst afforestation was promoted. The Pakistani government is currently implementing afforestation in the northern region, making this the most realistic case. A reduction of flooding in the upper regions of the Indus River was expected. However, the discharge was similar near the confluence point (Figure 9 and Figure 10; blue) to the control case due to urbanization, indicating that inundation would occur near the confluence point despite afforestation. We concluded that measures such as afforestation in the middle of both rivers are necessary to prevent flooding after the confluence point and that any development in that area will increase the inundation risk after the confluence point.
The discharge curves of the Tounsa Barrage and Trimmu head works sites upstream of the confluence point showed a pattern similar to that of the RRI inundation area. In the original case, Case 1, the peak discharge values at Tounsa Barrage and Trimmu head works were 15,695.2 m3/s and 4373.7 m3/s, respectively. Cases 3 and 4 had the lowest and highest discharge curves, respectively.
At Tounsa Barrage, the peak discharge values in Case 3 and Case 4 were 8970.0 m3/s and 16,968.7 m3/s, respectively (Figure 9). At Trimmu head works, the peak discharge values in Case 3 and Case 4 were 2814.7 m3/s and 5363.3 m3/s, respectively (Figure 10). Case 3 had a reduced surface flow due to infiltration. The discharge value in Case 4 was higher than that of Case 1 due to the development and limitation of the subsurface flow. In Cases 2 and 5, the discharge curves had the same pattern as that of the original case. At Tounsa Barrage, the peak discharge values were 15,718.9 m3/s and 15,723.5 m3/s, respectively, which were close to the original simulation case (15,695.2 m3/s). The reason behind the resemblance in the discharge values was that the urbanization location of the cities did not coincide with the precipitation impact area and main river flow area. This level of urbanization did not significantly affect the flood magnitudes. In the case of Tounsa Barrage, the peak discharge value declined from 15,695.2 m3/s to 12,078.3 m3/s in Case 6. A major drop from 4373.7 m3/s to 2934.6 m3/s was attributed to afforestation in Case 6 in the Chenab River. The afforestation between the rivers had a major impact on the main Chenab River flow. Case 7 had a rise in the discharge curve compared with that of the planting case (Figure 9 and Figure 10). Planting decreased the discharge value after the confluence point, especially in the upper Indus basin; because of the high precipitation in this area, it directly impacted the main Indus River flow. In the case of Tounsa Barrage, the peak discharge values in Case 7 and 8 were 13,932.3 m3/s and 14,190.4 m3/s, respectively. In the case of Trimmu head works, the peak discharge values in Case 7 and 8 were 4092.1 m3/s and 4229.5 m3/s, respectively. Compared with the Case 6 peak discharge of 12,078.3 m3/s, the increase in the peak discharge values in Case 7 and 8 showed that excessive development led to inundation after the confluence point despite any afforestation efforts. Therefore, planting (Case 6) had a relatively larger impact on the discharge value than urbanization, as shown in the previous results. In Figure 9 and Figure 10, as the discharge value increased, the peak of the discharge was delayed. This phenomenon of delaying the accumulation of water can be explained by the upstream Indus River flow. Many distributaries are connected to the Indus River, which leads to a slow accumulation of water in the main Indus River body. Consequently, the cases with larger maximum values tended to have a delayed peak.

4. Conclusions

This study investigated the impacts of land cover change on the Indus basin, particularly after the confluence point of the Indus and Chenab Rivers where the population density is high, whilst considering extreme rainfall. The assessment was accomplished using RRI model simulations with the rainfall data as the input. A model of the actual flood condition of 2015 was used to observe the responses of the land cover changes. The following results were found:
1.
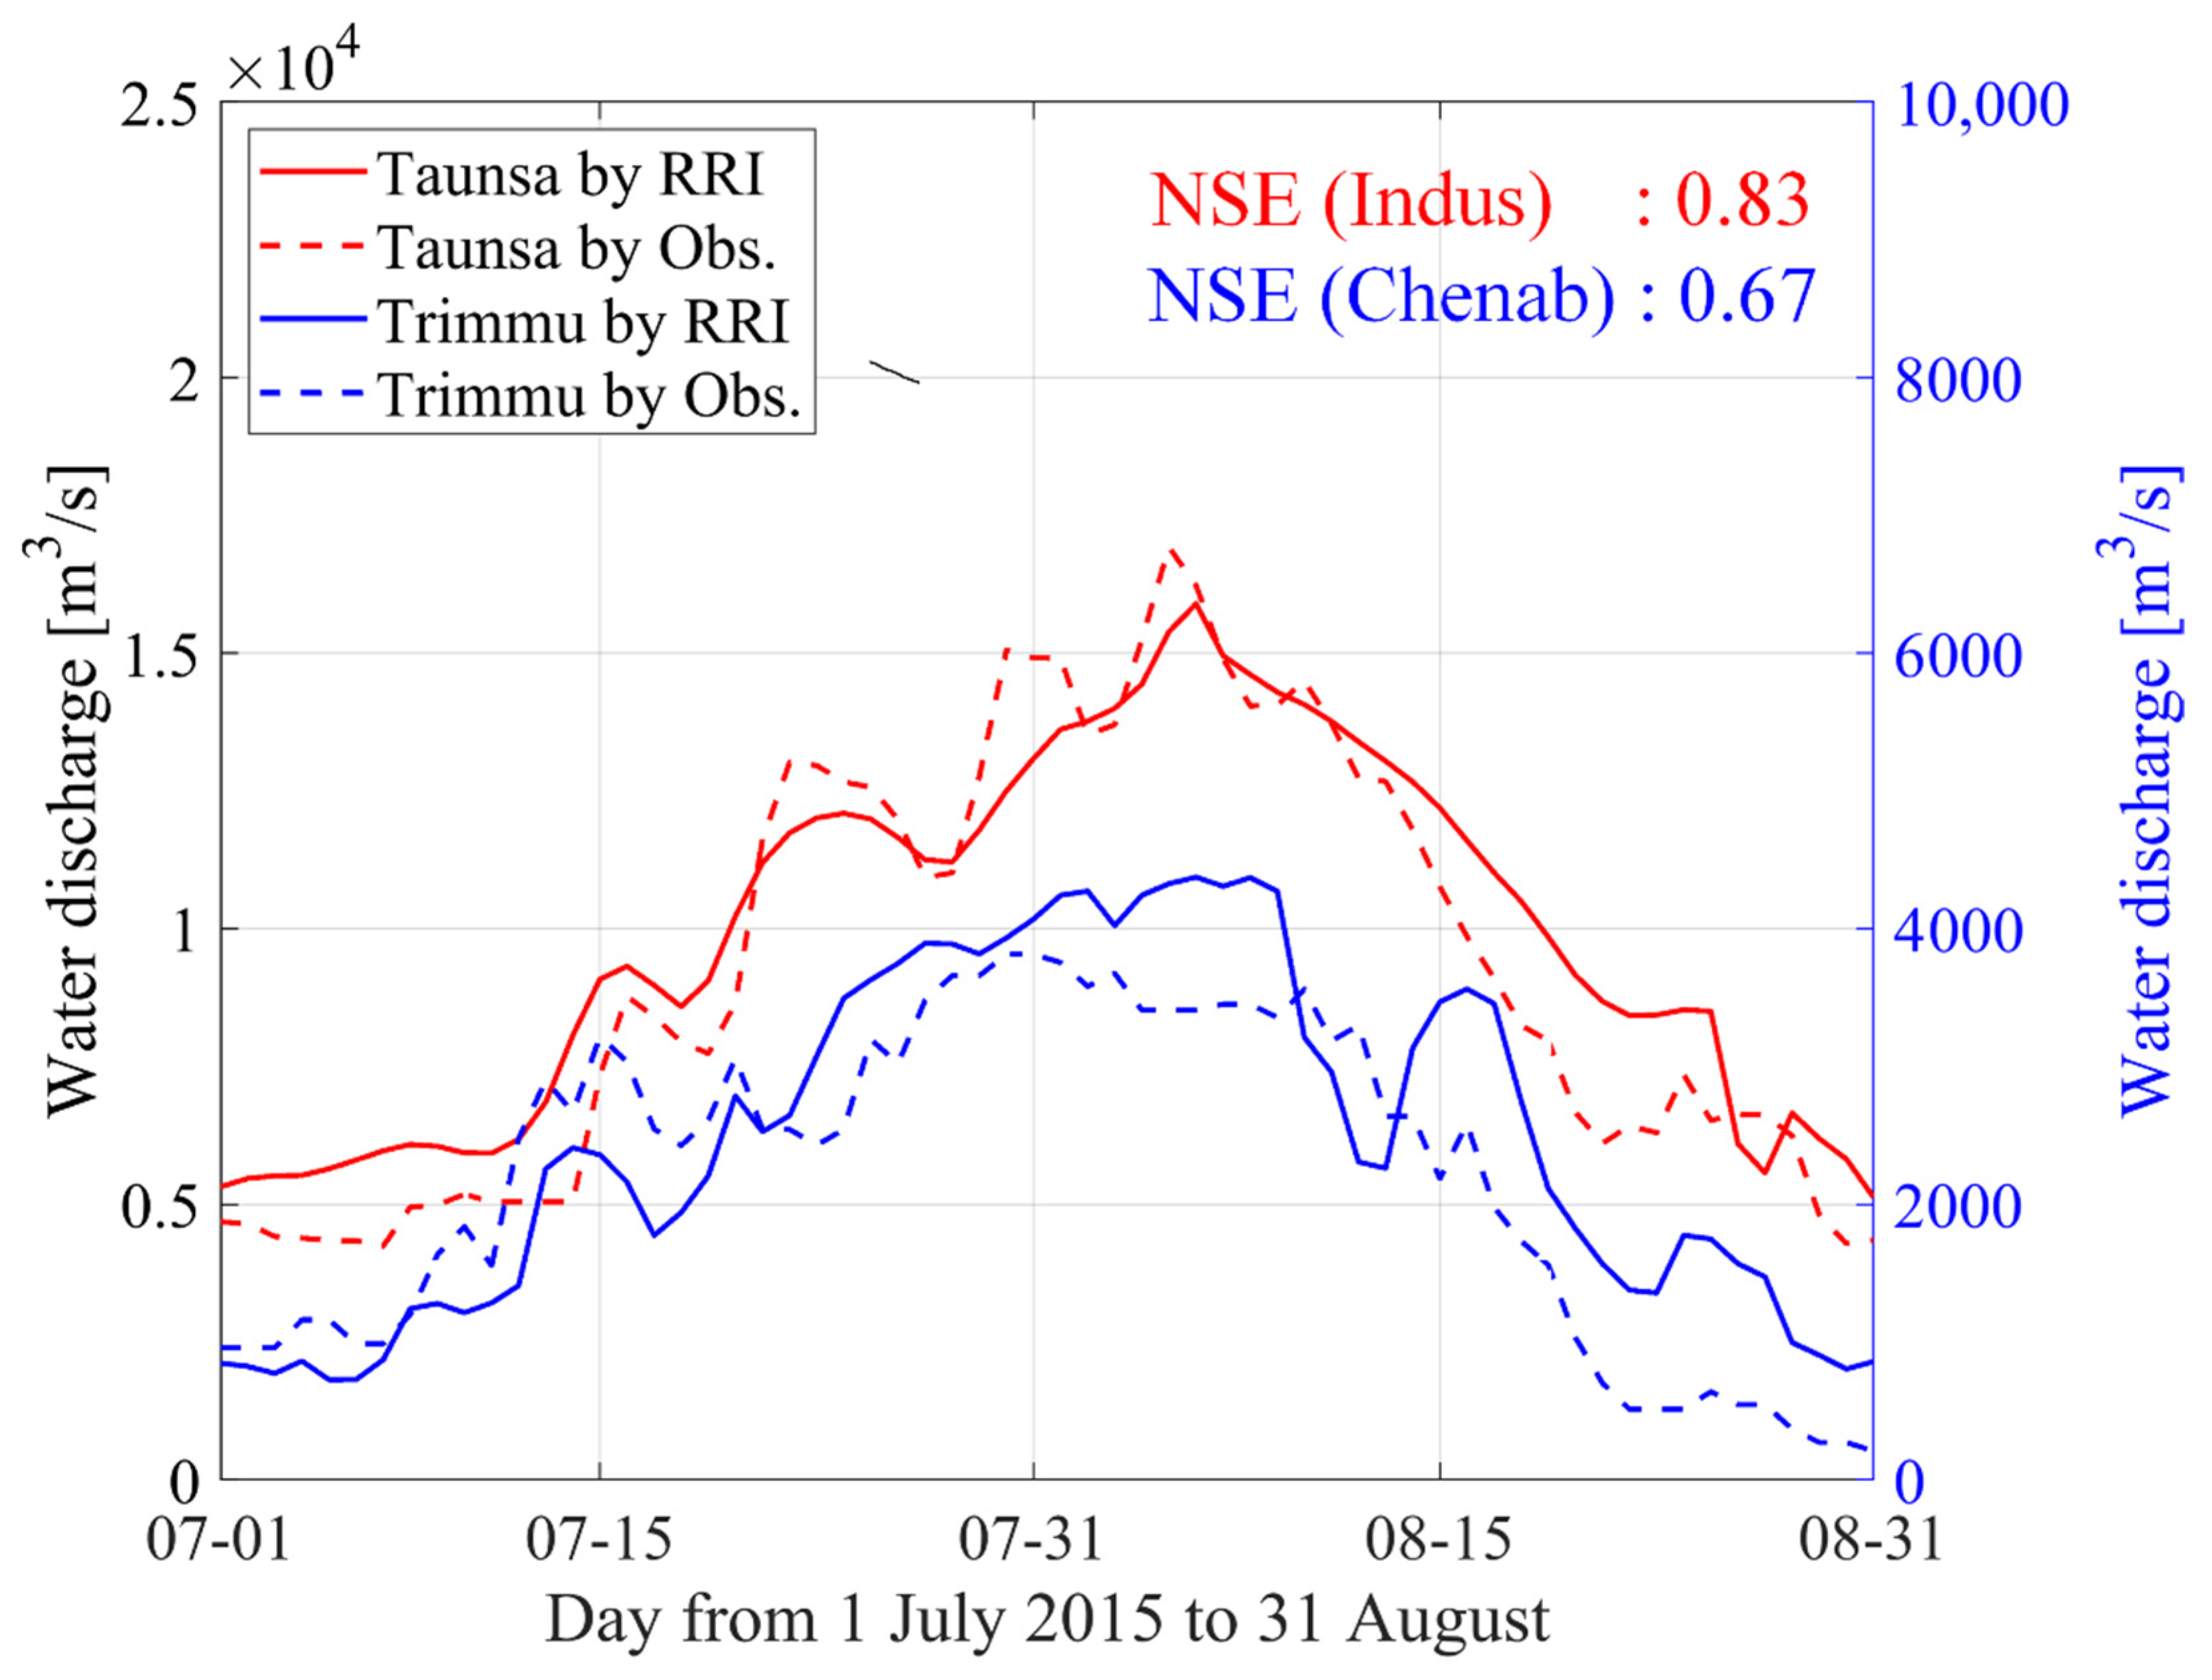
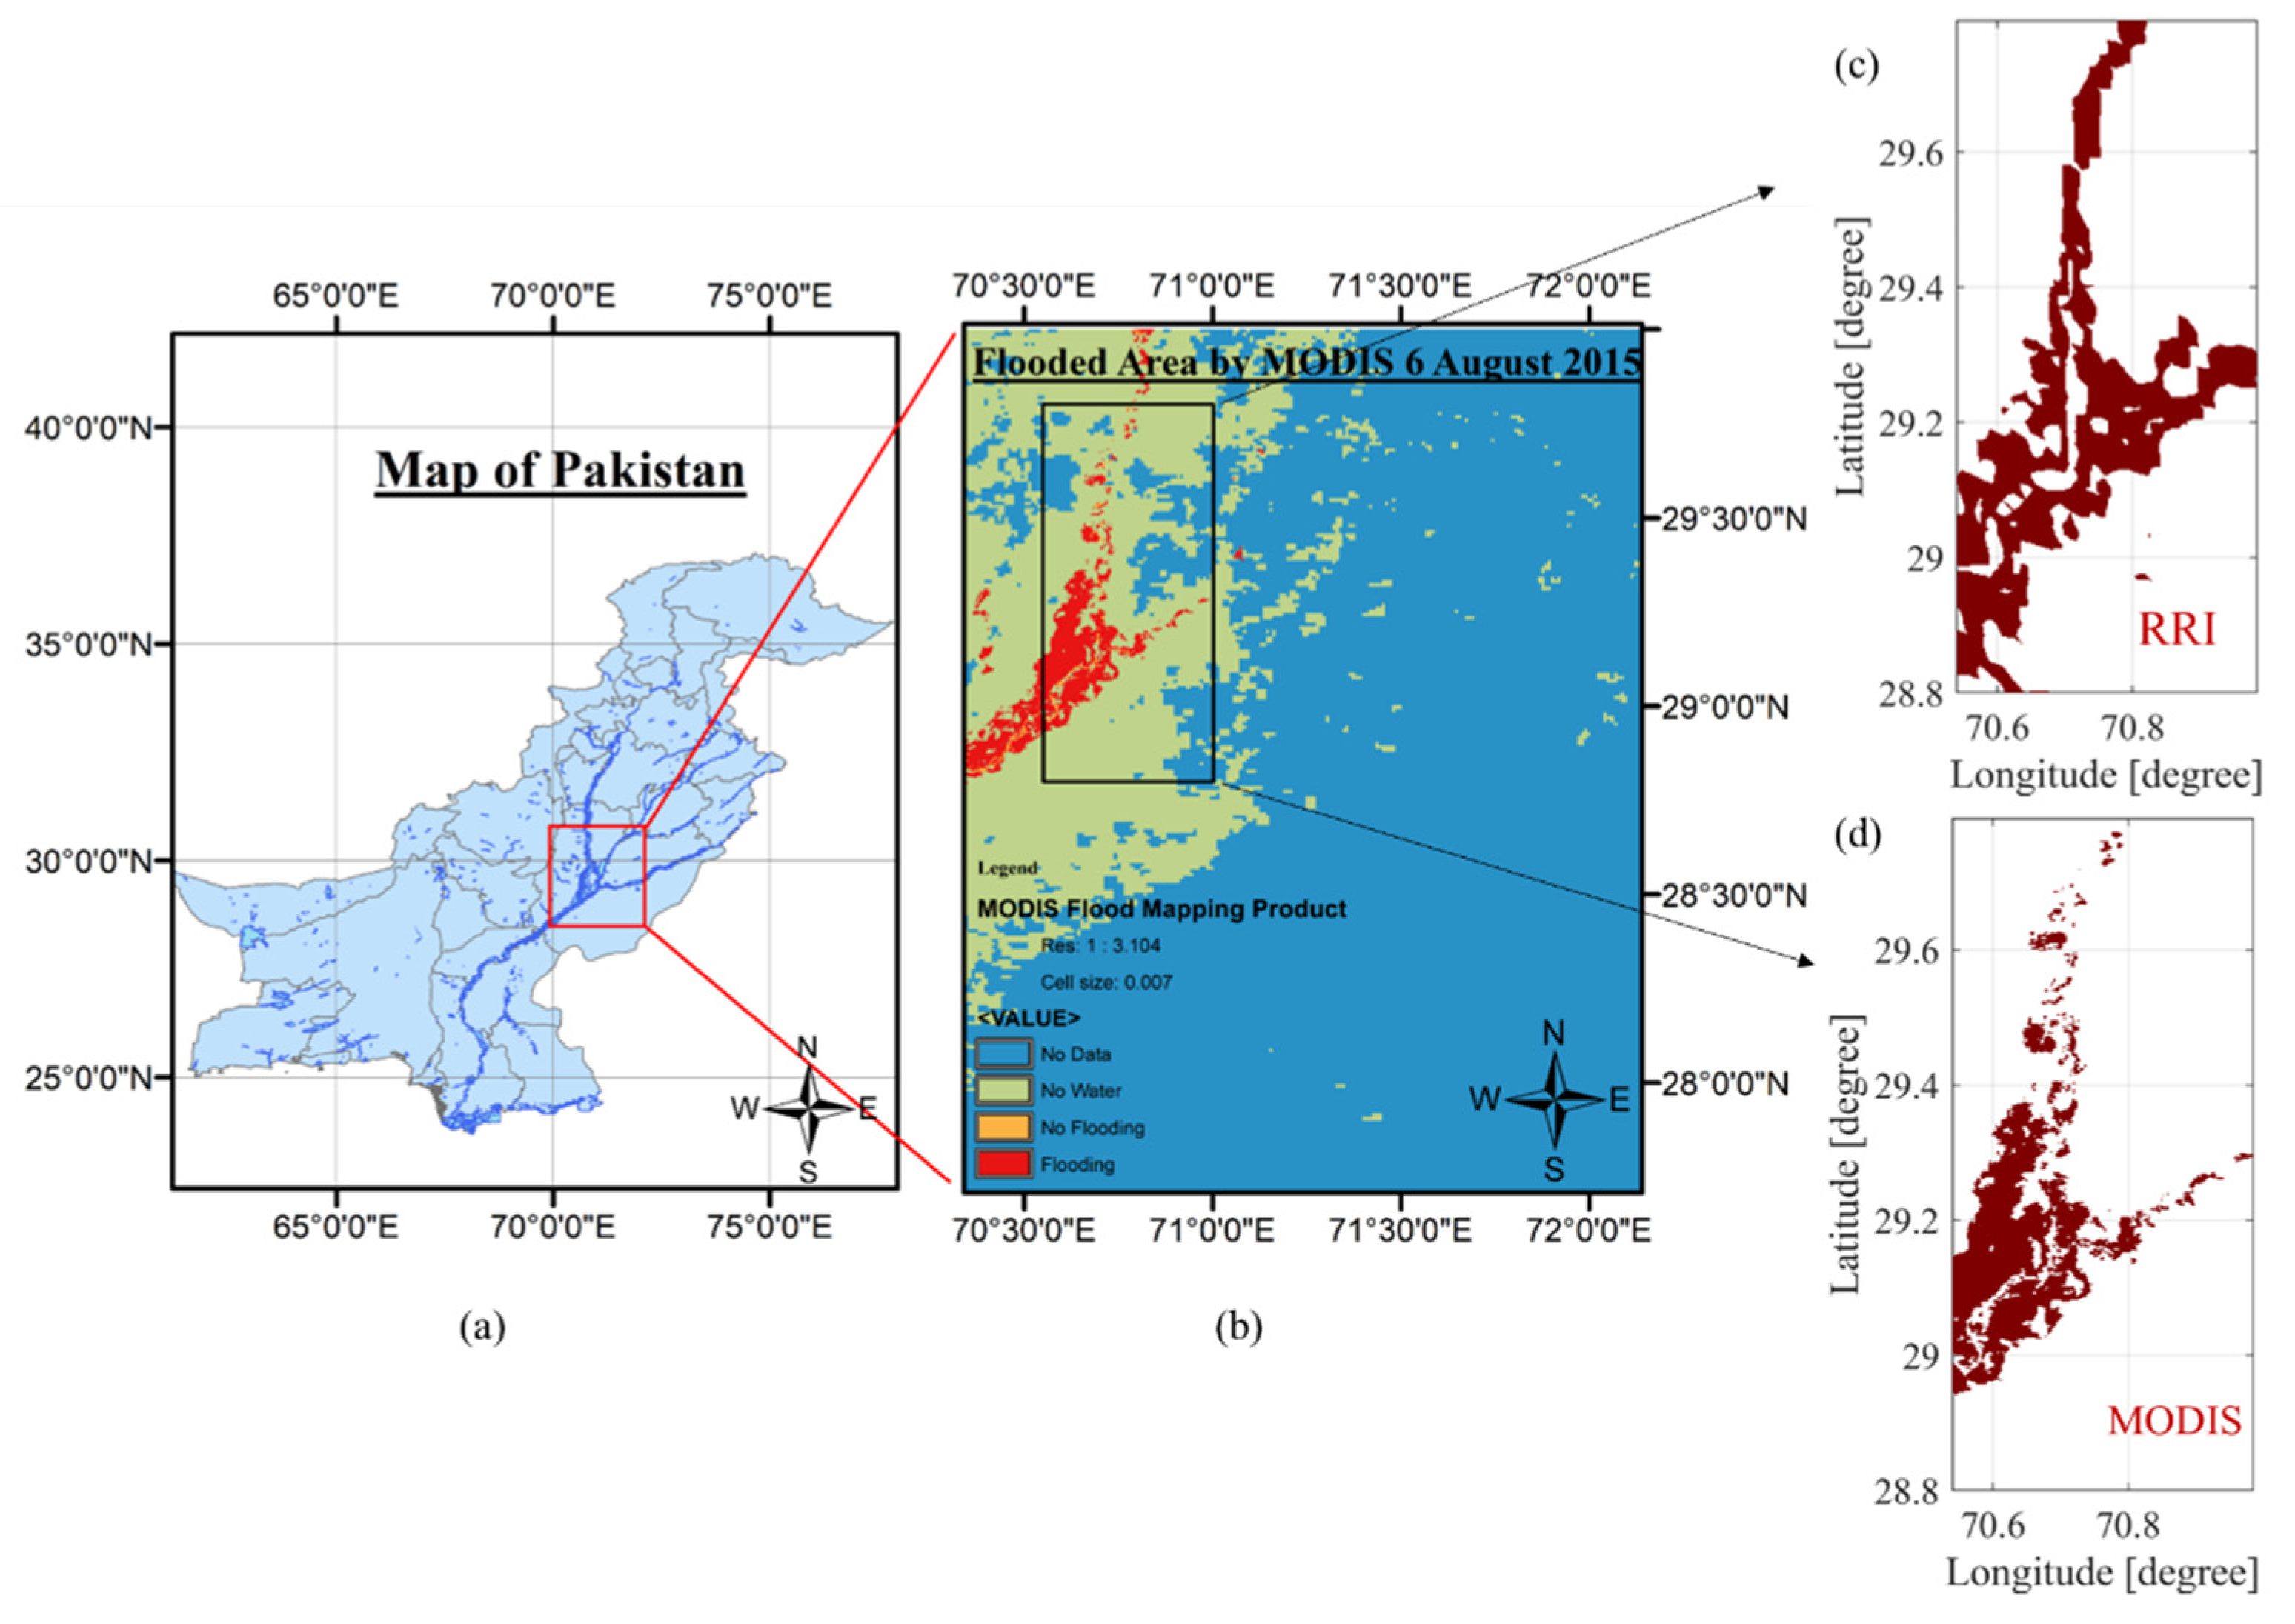
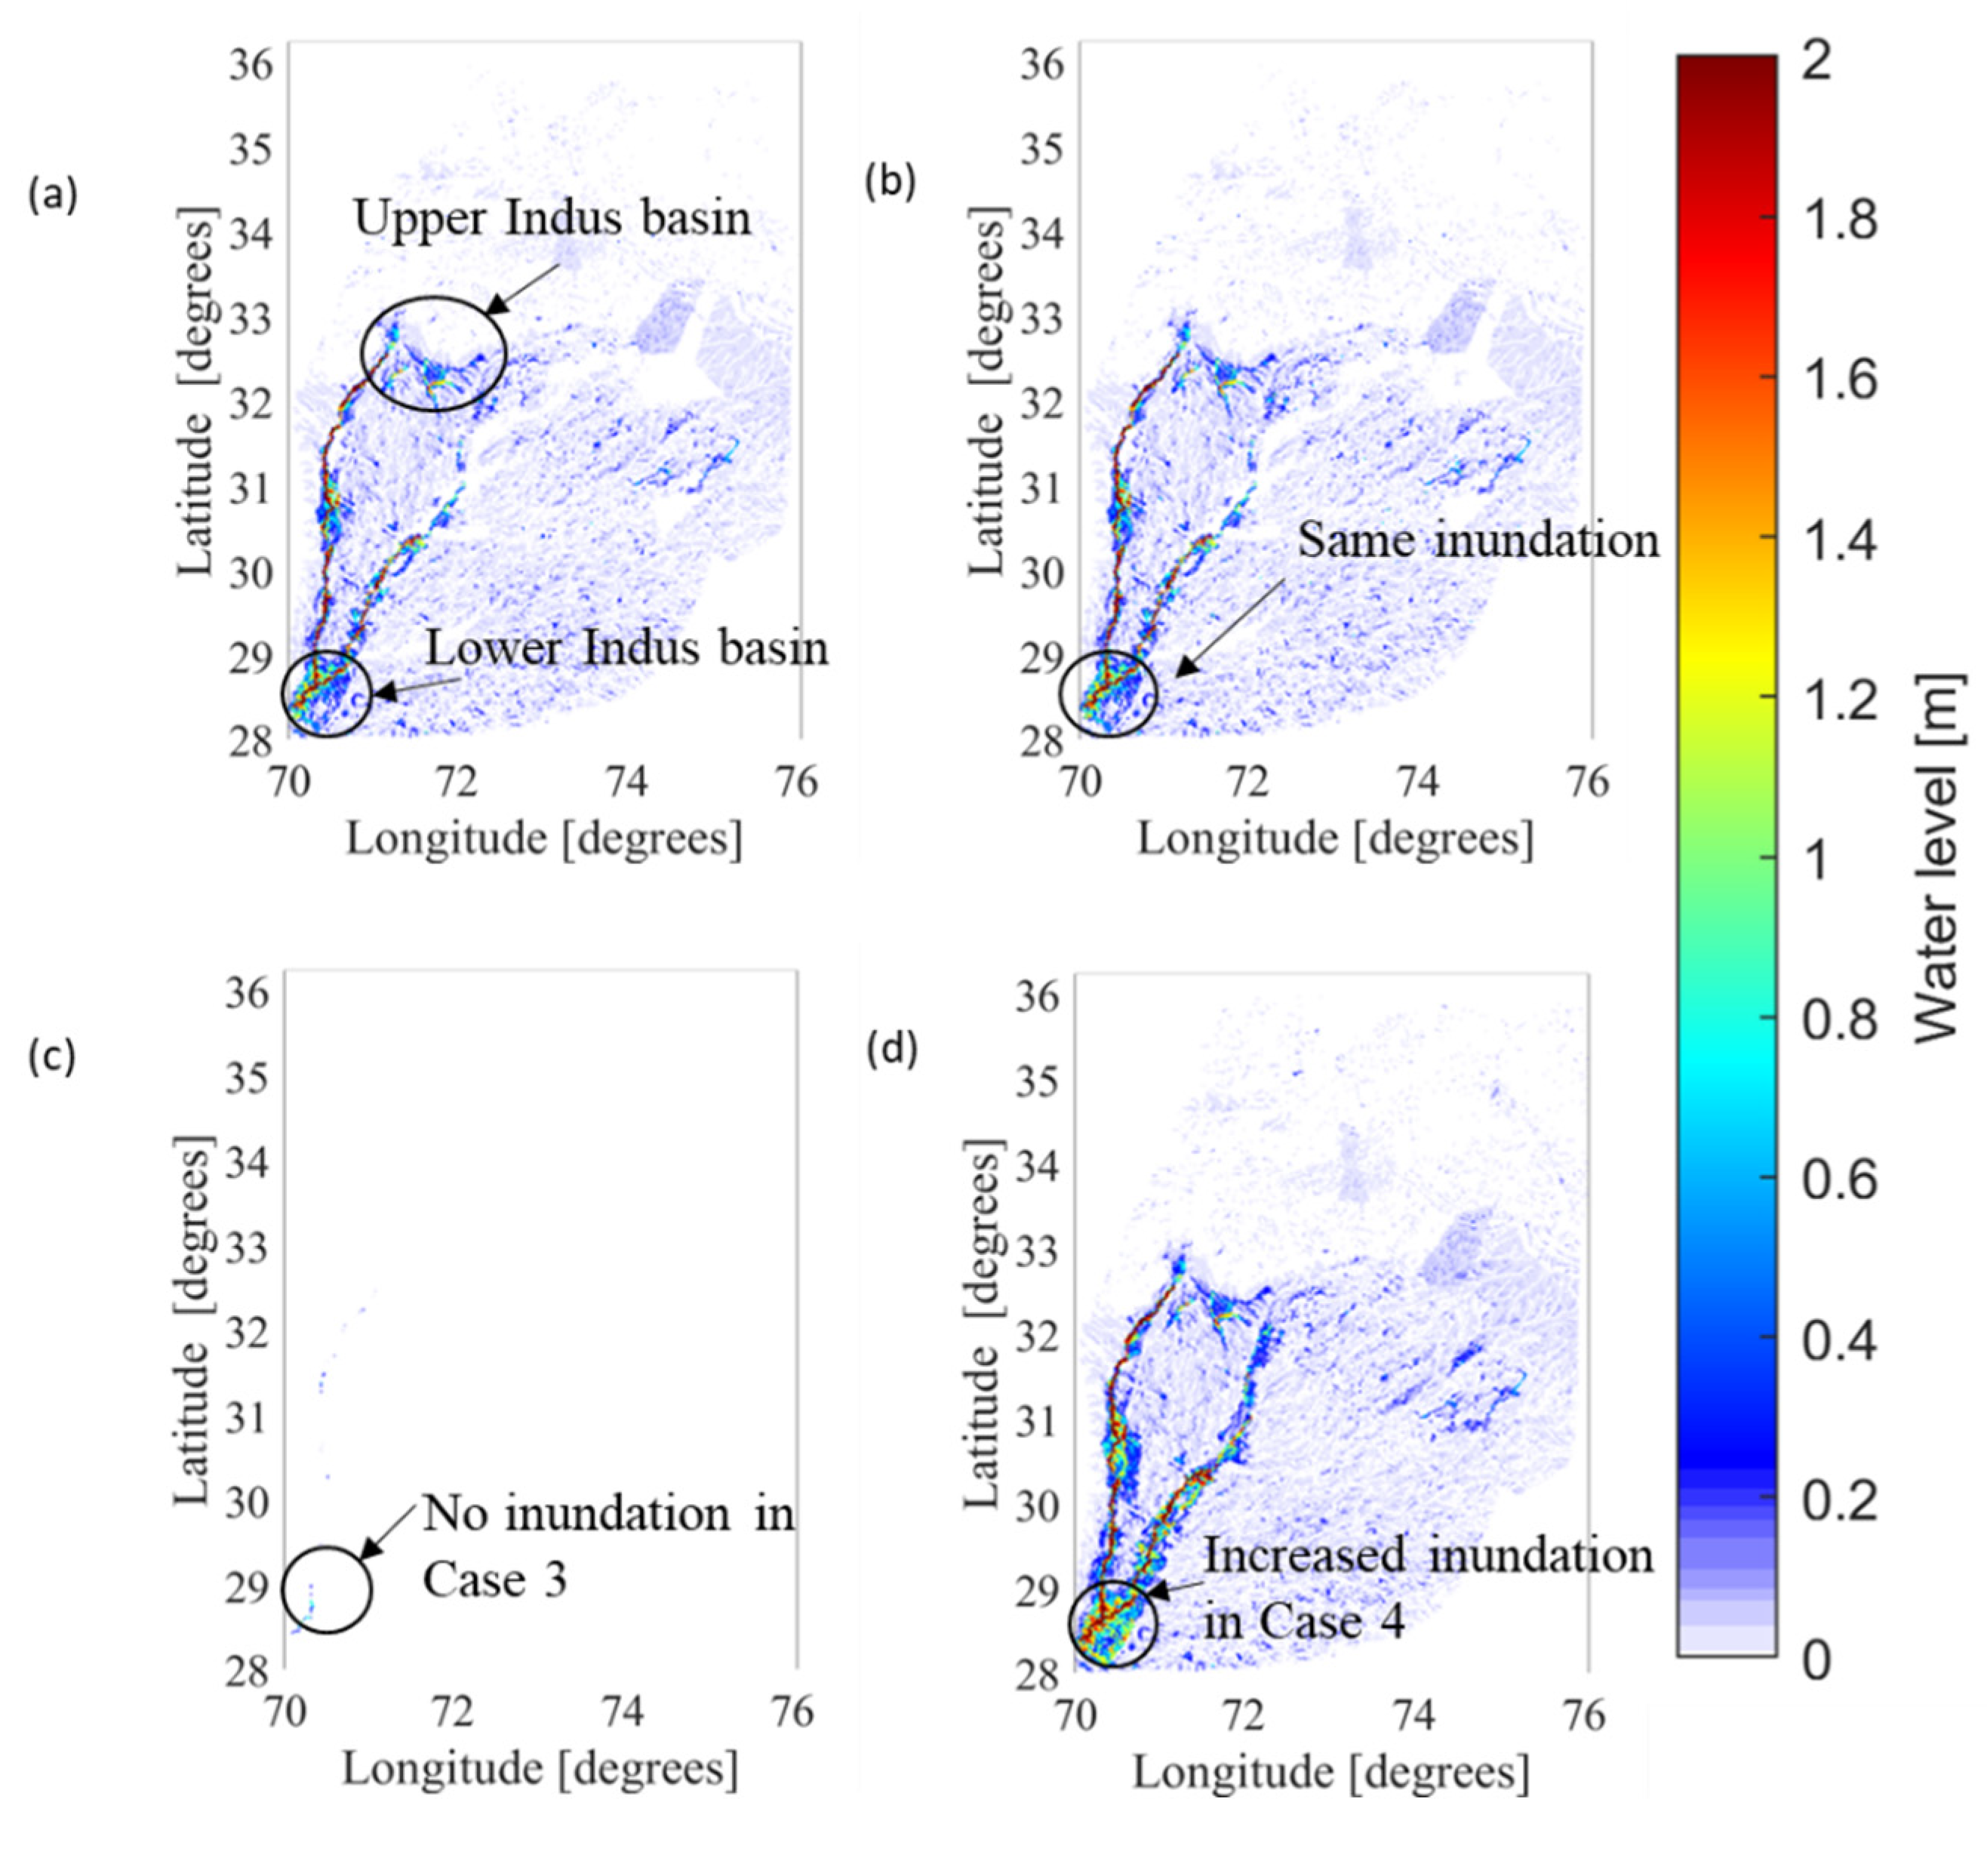
Comparing the RRI model with the original flooding case of 2015 with NSE coefficients of 0.83 and 0.67 at Tounsa Barrage and Trimmu head works, respectively, and a fit value (%) of 0.67 at the confluence point area, the RRI simulation results of the land cover change experiments showed that the inundation pattern was affected by land cover changes. Extreme urbanization increased the risk of inundation and extreme afforestation greatly affected inundation in the Indus basin.
2.
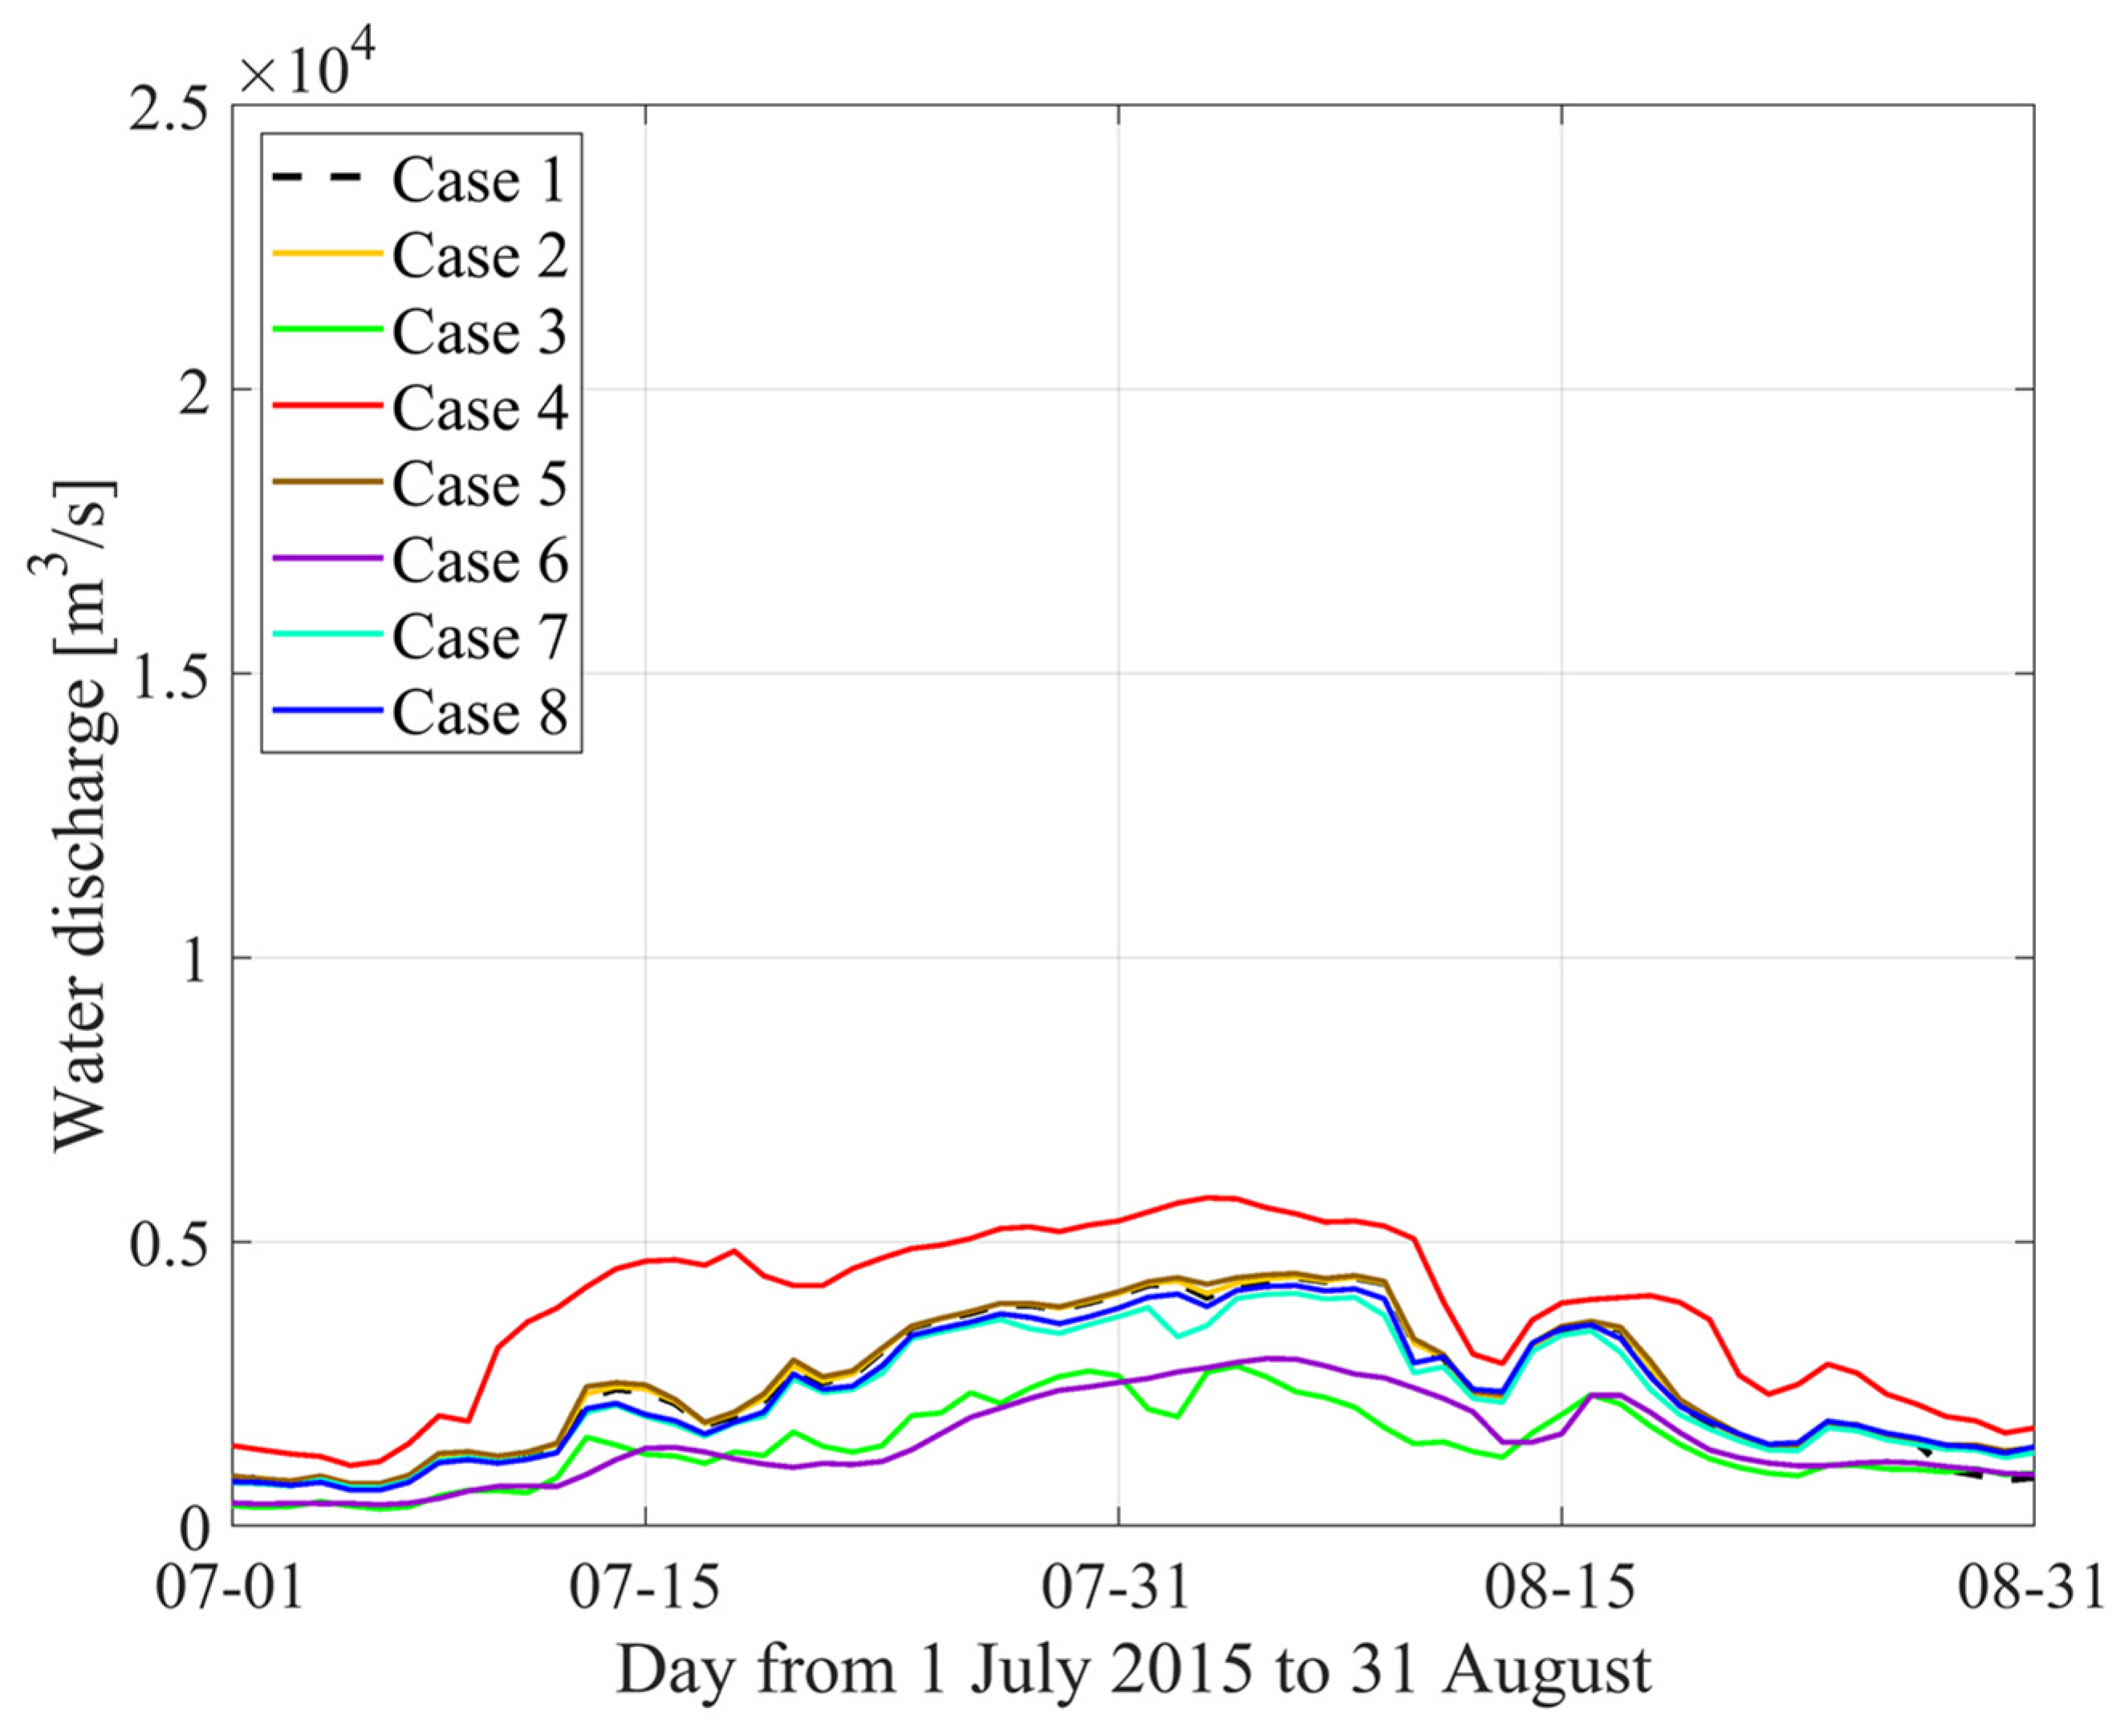
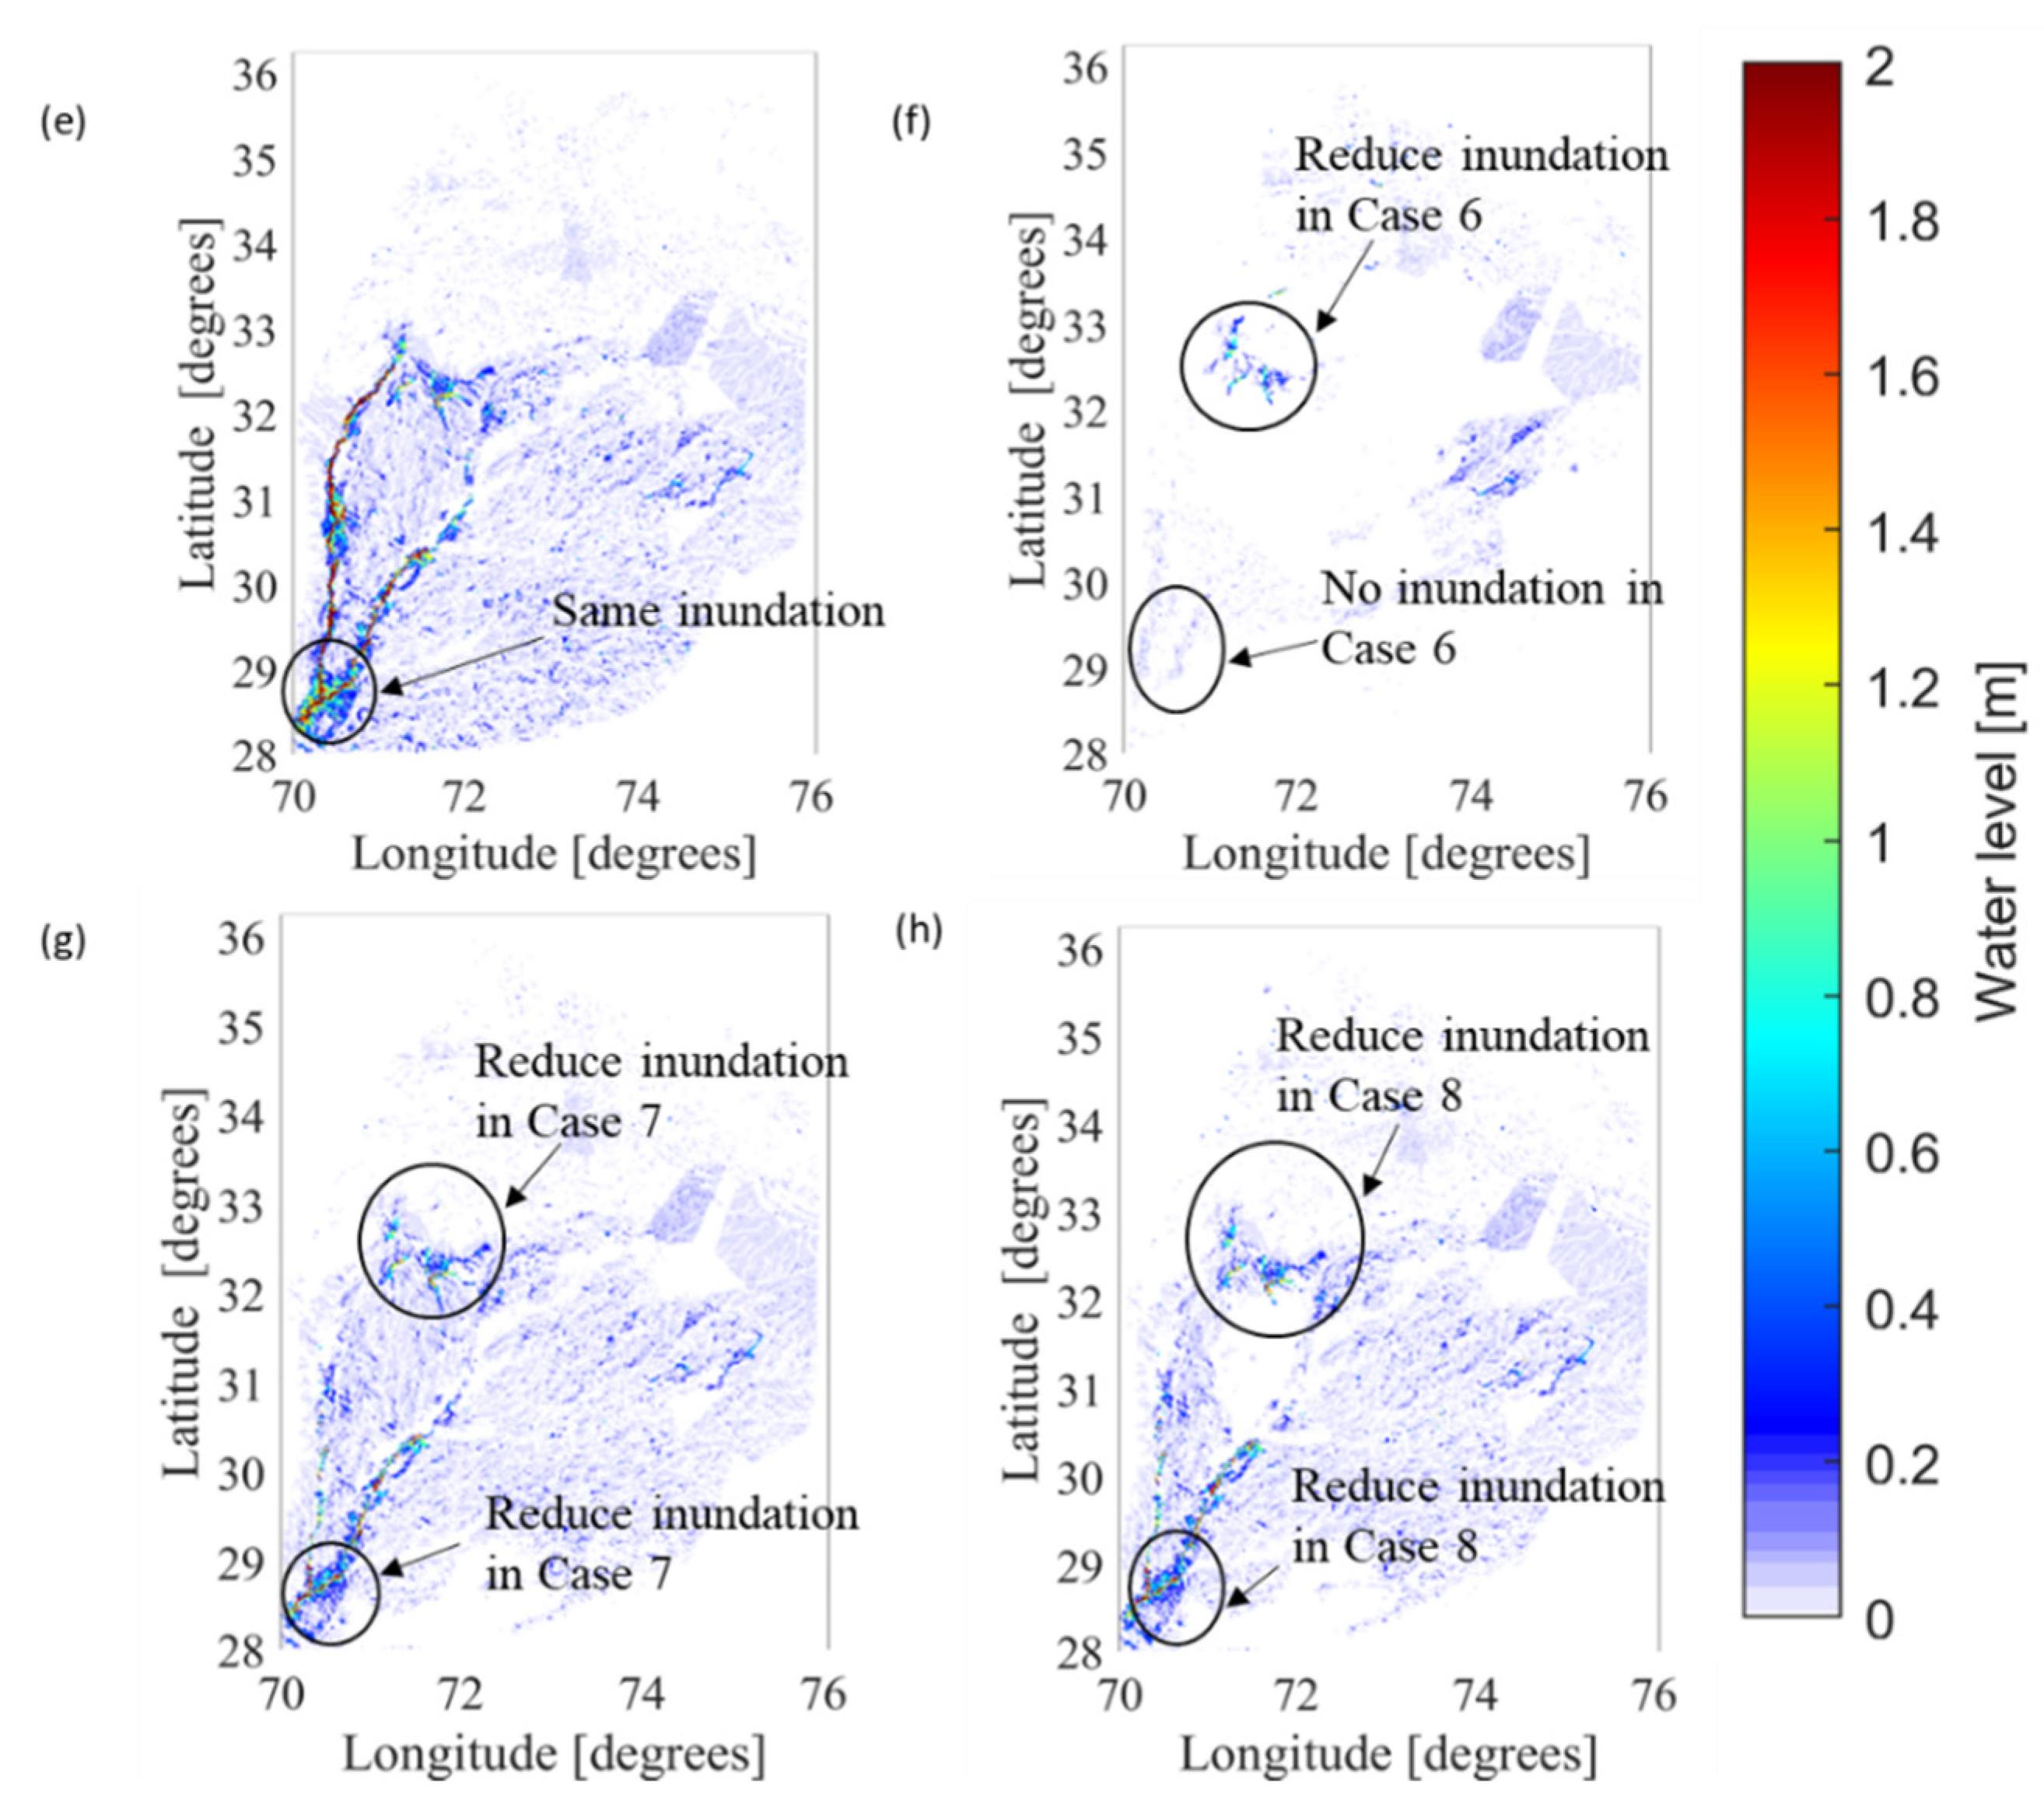
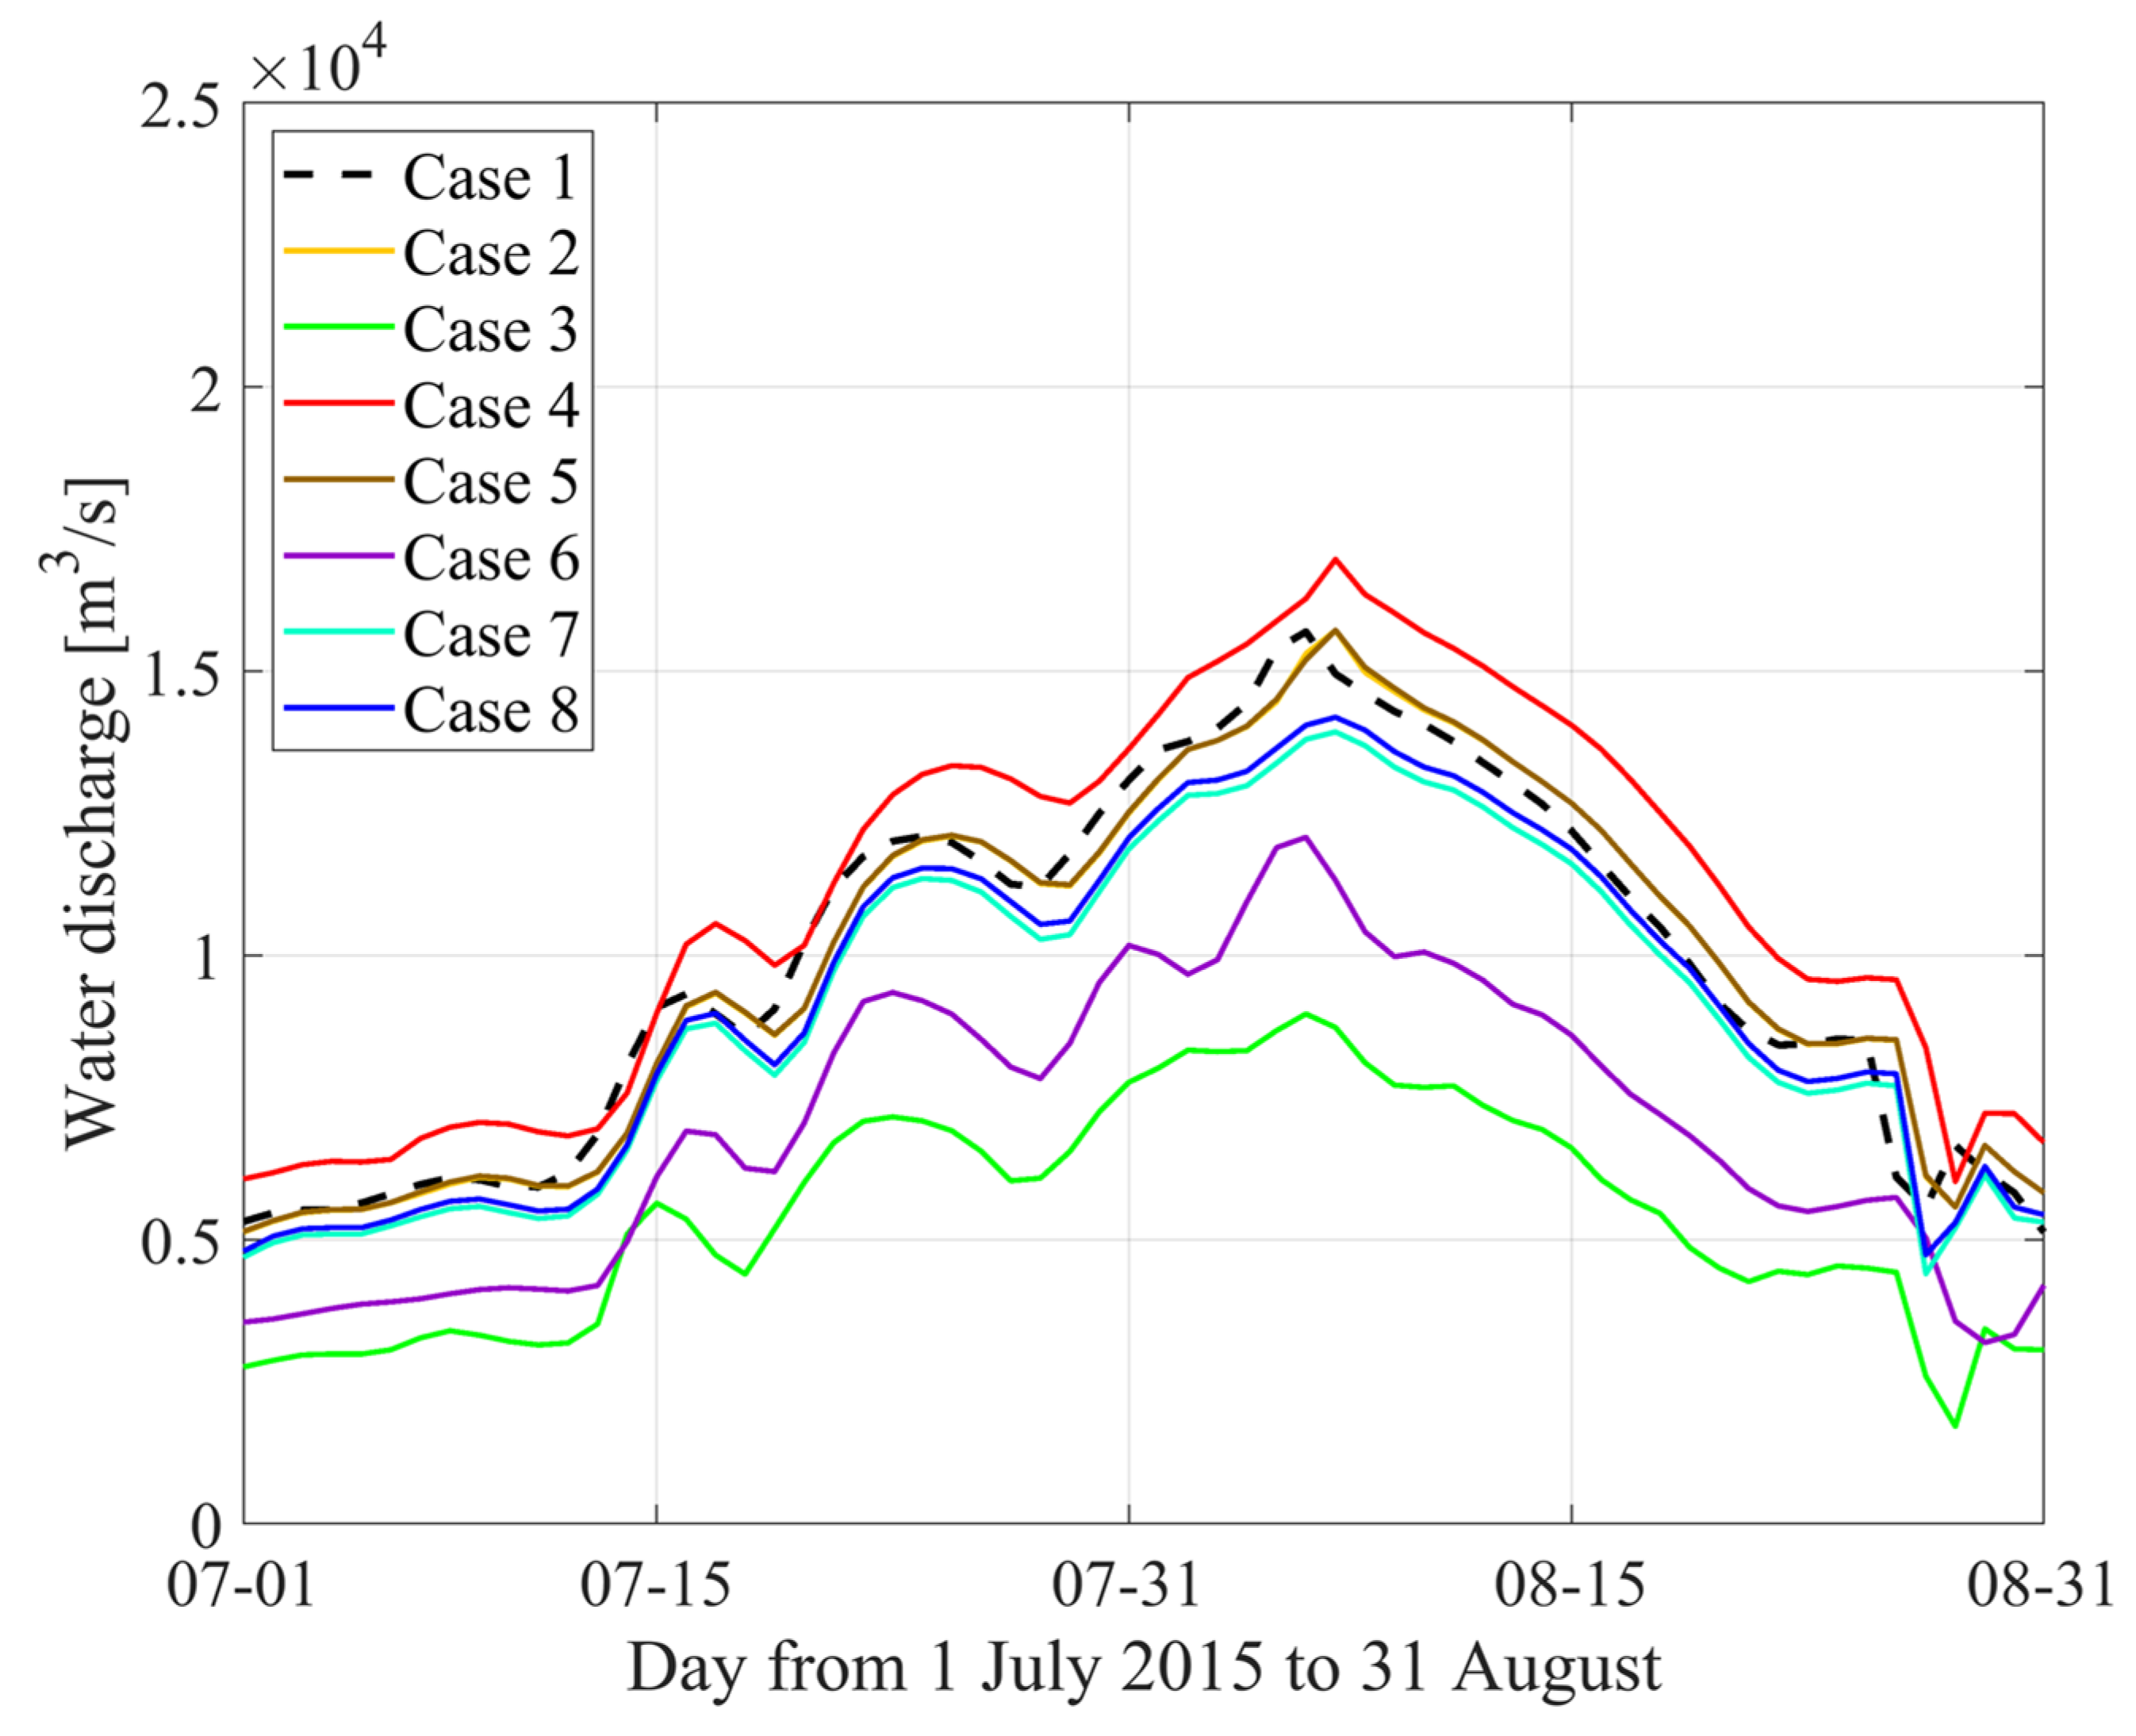
A two-dimensional inundation map of the planting case (Case 6) showed that the inundation area was significantly affected by planting in the Indus basin. Planting in the bare and vegetation area in the upper Indus basin significantly reduced inundation and the flow of the main Indus River and contributed to flood disaster prevention in the high-risk area of the upper Indus basin. Planting between the Indus and Chenab Rivers showed a major effect on inundation after the confluence point of both rivers. At Trimmu head works in the Chenab River, planting (Case 6) showed that the discharge curve almost matched the complete afforestation in Case 3. Planting between rivers was shown to be extremely effective in reducing inundation after the confluence point.
3.
Sensitivity experiments involving only urbanization cases (Case 2 and Case 5) had a small impact on the upper Indus basin and downstream target area. The case of planting with urbanization (Case 7 and Case 8) showed that planting affected the upper Indus basin. However, compared with the planting in Case 6, these urbanization cases greatly affected the discharge curves and inundation after the confluence point. Both cases of urbanization with planting showed that there was an inundation area after the confluence point. Small-scale urbanization did not significantly impact the peak discharge whereas large-scale urbanization caused increased surface flows, leading to more severe flooding; reducing the discharge through planting was a highly effective technique. Therefore, both urbanization and planting were required; this measure can be considered to be a sustainable development method.
Overall, these results provide useful information for river basin management, particularly for land cover adaptation and flood damage mitigation in floodplain areas of the Indus basin. However, for an improvement in the results, original river measurement parameters are required. Disregarding the impact of flood control facilities and dam effectiveness on inundation also leaves uncertainty in the results. Further studies of the evaluation of the Indus basin with hourly rainfall data and measured river parameters would provide reliable future projections.

Author Contributions

Conceptualization, H.S. and M.T.; methodology, H.S. and M.T.; software, H.S. and M.T.; validation, H.S. and M.T.; investigation, H.S. and M.T.; data curation, H.S., M.T. and S.K.; writing—original draft preparation, H.S.; writing—review and editing, H.S., M.T. and S.K.; supervision, M.T. and S.K. All authors have read and agreed to the published version of the manuscript.

Funding

This research is supported by the Scholarship Program of the Japan International Cooperation Agency (JICA) with funding number D2000948.

Institutional Review Board Statement

Not applicable.

Informed Consent Statement

Not applicable.

Data Availability Statement

Data are available from the websites of the Pakistan Meteorological Department (PMD) and the Federal Flood Commission Pakistan (https://ffc.gov.pk/annual-flood-reports/, (accessed on 20 April 2022)).

Acknowledgments

We thank the Pakistan Metrological Department (PMD) for providing rainfall data of the 2015 flood. We thank the Pakistan Federal Flood Commission Department for providing relative information of all past floods.

Conflicts of Interest

The authors declare no conflict of interest.

References

  1. Manzoor, M.; Bibi, S.; Manzoor, M.; Jabeen, R. Historical Analysis of Flood Information and Impacts Assessment and Associated Response in Pakistan (1947–2011). Res. J. Environ. Earth Sci. 2013, 3, 139–146. [Google Scholar] [CrossRef]
  2. Annual Flood Reports 2020. Available online: https://ffc.gov.pk/annual-flood-reports/ (accessed on 20 April 2022).
  3. Rahman, G.; Rahman, A.; Anwar, M.; Ahmed, M. Socio-economic Damages caused by the 2014 Flood in Punjab Province, Pakistan. Pak. Acad. Sci. B. Life Environ. Sci. 2017, 54, 365–374. [Google Scholar]
  4. Malik, S.M.; Awan, H.; Khan, N. Mapping vulnerability to climate change and its repercussions on human health in Pakistan. Glob. Health 2012, 8, 31. [Google Scholar] [CrossRef] [PubMed] [Green Version]
  5. Shah, S.M.H.; Mustaffa, Z.; Teo, F.Y.; Imam, M.A.H.; Yusof, K.W.; Al-Qadami, E.H.H. A review of the flood hazard and risk management in the South Asian Region, particularly Pakistan. Sci. Afr. 2020, 01, e00651. [Google Scholar] [CrossRef]
  6. Salma, S.; Rehman, S.; Shah, M.A. Rainfall Trends in Different Climate Zones of Pakistan. Pak. J. Metrol. 2012, 9, 37–47Khan. [Google Scholar]
  7. Hashmi, M.S. Land distribution, technological changes and productivity in pakistan’s agriculture: Some explanations and policy options. Int. J. Econ. Manag. Sci. 2011, 1, 51–74. [Google Scholar]
  8. Samie, A.; Deng, X.; Jia, S.; Chen, D. Scenario-based simulation on dynamics of land-use-land-cover change in Punjab province, Pakistan. Sustainability 2017, 9, 1285. [Google Scholar] [CrossRef] [Green Version]
  9. Aziz, T. Changes in land use and ecosystem services values in Pakistan, 1950–2050. Environ. Dev. 2021, 37, 100576. [Google Scholar] [CrossRef]
  10. Lutz, A.F.; Immerzeel, W.W.; Kraaijenbrink, P.D.A.; Shrestha, A.B.; Bierkens, M.F.P. Climate change impacts on the upper indus hydrology: Sources, shifts and extremes. PLoS ONE 2016, 11, e0165630. [Google Scholar] [CrossRef] [Green Version]
  11. Qasim, S.; Nawaz, A.; Peasad, R.; Qasim, M. Risk perception of the people in the flood prone Khyber Pukhthunkhwa province of Pakistan. Int. J. Disaster Risk Reduct. 2015, 14, 373–378. [Google Scholar] [CrossRef]
  12. Hussain, M.S. A Classification of Rainfall Regions in Pakistan. J. Korean Geogr. Soc. 2009, 44, 605–623. [Google Scholar]
  13. Provincial Disaster Management Authority (PDMA) Government of The Punjab. Available online: https://pdma.gop.pk/flood_maps (accessed on 20 April 2022).
  14. Ahmad, D.; Afzal, M. Flood hazards and agricultural production risks management practices in flood-prone areas of Punjab, Pakistan. Env. Sci Pollut Res 2022, 29, 20768–20783. [Google Scholar] [CrossRef] [PubMed]
  15. 2D Hydrodynamic Model for Flood Vulnerability Assessment of Lower Indus River Basin, Pakistan. Available online: https://ascelibrary.org/doi/abs/10.1061/9780784481400.044 (accessed on 20 April 2022).
  16. Numerical Study on Flood Routing in Indus River. Available online: https://www.researchgate.net/publication/273775519 (accessed on 20 April 2022).
  17. Shokory, J.A.N.; Tsutsumi, J.I.G.; Sakai, K. Flood Modeling and Simulation using iRIC: A Case Study of Kabul City. E3S Web Conf. 2016, 7, 04003. [Google Scholar] [CrossRef] [Green Version]
  18. Sayama, T.; Ozawa, G.; Kawakami, T.; Nabesaka, S.; Fukami, K. Rainfall-runoff-inundation analysis of the 2010 Pakistan flood in the Kabul River basin. Hydrol. Sci. J. 2012, 57, 298–312. [Google Scholar] [CrossRef]
  19. Scharenberg, W. Hydrological Modeling System HEC-HMS; Publication of US Army Corps of Engineers: Davis, CA, USA, 2016. [Google Scholar]
  20. Beven, K.J.; Lamb, R.; Quinn, P.F.; Romanowicz, R.; Freer, J. Topmodel Computer Models of Watershed hydrology; Water Resource Publications: Colorado, CO, USA, 1995; pp. 627–668. [Google Scholar]
  21. Liang, X.; Lettenmaier, D.P.; Wood, E.F.; Burges, J.S. A simple hydrologically based model of land surface water and energy fluxes for general circulation models. J. Geophys. Res. 1994, 99, 14415–14428. [Google Scholar] [CrossRef]
  22. International Centre for Water Hazard and Risk Management (ICHARM). IFAS ver 2.0 Technical Manual 2014. Available online: https://www.pwri.go.jp/icharm/research/ifas/ifas_2.0_top.html (accessed on 20 April 2022).
  23. Solver Manual. Available online: https://i-ric.org/en/download/nays2dflood-solver-manual/ (accessed on 20 April 2022).
  24. Deltares. User Manual. SOBEK. In Hydrodynamics, Rainfall-Runoff and Real-Time Control, 1D/2D Modelling Suite for Integrated Water Solutions; Deltares: Delft, The Netherlands, 2019; pp. 1–3. [Google Scholar]
  25. Sayama, T.; Rainfall-Runoff-Inundation (RRI) Model Technical Manual. The International Centre for Water Hazard and Risk Management 2014. Available online: https://www.pwri.go.jp/icharm/research/rri/index_j.htmlhttps://www.pwri.go.jp/jpn/results/db/doken_kankoubutu/doken_shiryou/files/doken_shiryou_4277_00.pdf (accessed on 20 April 2022).
  26. Bhagabati, S.S.; Kawasaki, A. Consideration of the rainfall-runoff-inundation (RRI) model for flood mapping in a deltaic area of Myanmar. Hydrol. Res. Lett. 2017, 11, 155–160. [Google Scholar] [CrossRef] [Green Version]
  27. Khan, H.; Hassan, S.A. Stochastic River Flow Modelling and Forecasting of Upper Indus Basin. J. Basic Appl. Sciences. 2015, 11, 630–636. [Google Scholar] [CrossRef] [Green Version]
  28. Landscape of the Indus River. Available online: https://www.researchgate.net/publication/322206489_Landscape_of_the_Indus_River (accessed on 20 April 2022).
  29. Siddique, M.S.; Schwarz, J. Elaboration of multi-hazard zoning and qualitative risk maps of Pakistan. Earthq. Spectra 2015, 31, 1371–1395. [Google Scholar] [CrossRef]
  30. Annual Federal Flood Commision Pakistan Report 2015. Available online: www.ffc.gov.pk/annual-flood-reports/ (accessed on 20 April 2022).
  31. Sayama, T.; Fujioka, S.; Ushiyama, T.; Tatabe, Y.; Fukam, K. Rainfall-runoff-inundation analysis of pakistan flood 2010 for the entire indus river basin. Hydrol. Sci. J. 2012, 68, 1493–1498. [Google Scholar]
  32. Oscillations of a Monsoon System. Part I Observational Aspects. Available online: https://ui.adsabs.harvard.edu/abs/1976JAtS...33.1937K/abstract (accessed on 20 April 2022).
  33. Kumler, M.P. Thiessen’s Remarkable Polygons. Calif. Geogr. Soc. 1999, 39, 71–81. [Google Scholar]
  34. Richard, H.; Knight, Z.; Cutter, A. Evaluation of the Nash–Sutcliffe Efficiency Index. J. Hydrol. Eng. 2006, 11, 597–602. [Google Scholar]
  35. Bates, P.D.; de Roo, A.P.J. A simple raster-based model for flood inundation simulation. J. Hydrol. 2000, 236, 54–77. [Google Scholar] [CrossRef]
Figure 1. Population density of Punjab, Pakistan, in years: (a) 2010; (b) 2015; and (c) 2020. Black circles indicate high-density population areas.
Sustainability 14 07021 g001
Figure 2. Population density of the Rahim Yar Khan district.
Sustainability 14 07021 g002
Figure 3. RRI simulation area and rainfall gauge points.
Sustainability 14 07021 g003
Figure 4. Temporal rainfall data for the major sites used in the simulation.
Sustainability 14 07021 g004
Figure 5. RRI simulation input land cover areas: (a) control case; (b) urbanization of six cities (Lahore, Islamabad, Peshawar, Faisalabad, D.G. Khan, and Multan); (c) all areas converted into a forest; (d) all land cover areas under urbanization; (e) urban grids (No. 18) expanded to eight surrounding grids; (f) shrubs, herbaceous and sparse vegetation, and bare areas (Nos. 6, 7, 8, 9, 10, 16, and 17) all converted into a forest; (g) urbanization between the Chenab and Indus Rivers; (h) case of planting and major urbanization combining (e) and (f), respectively.
Sustainability 14 07021 g005
Figure 6. Comparison between the actual and calculated discharge at Tounsa and Trimmu observation sites.
Sustainability 14 07021 g006
Figure 7. Comparison between the inundation areas of RRI and MODIS: (a) map of Pakistan; (b) inundated area by MODIS; (c) inundated area by RRI; (d) inundated area by MODIS at the confluence point.
Sustainability 14 07021 g007
Figure 8. RRI-simulated inundation areas outside river grids at the peak discharge: (a) control case; (b) urbanization of six cities (Lahore, Islamabad, Peshawar, Faisalabad, D.G. Khan, and Multan); (c) all areas converted into a forest; (d) all land cover areas urbanized; (e) urban grids (No. 18) expanded to eight surrounding grids; (f) shrubs, herbaceous and sparse vegetation, and bare areas (Nos. 6, 7, 8, 9, 10, 16, and 17) all converted into a forest; (g) urbanization between the Chenab and Indus Rivers, in addition to case (f); (h) cases of planting and major urbanization combining (e) and (f), respectively.
Sustainability 14 07021 g008aSustainability 14 07021 g008b
Figure 9. Comparison between the discharge curves of the eight cases: Case 1, Case 2, Case 3, Case 4, Case 5, Case 6, Case 7, and Case 8 at Tounsa Barrage.
Sustainability 14 07021 g009
Figure 10. Comparison between the discharge curves of the eight cases: Case 1, Case 2, Case 3, Case 4, Case 5, Case 6, Case 7, and Case 8 at Trimmu head works.
Sustainability 14 07021 g010
Table 1. Rainfall–Runoff–Inundation (RRI) settings (control case).
River width coefficient (Cw)3.5
River width coefficient (Sw)0.45
River depth coefficient (Cd)0.1
River depth coefficient (Sd)0.4
Number of grids303 × 412
Resolution (degrees)1/60
Rainfall input start time00:00 UTC 21 June 2015
Rainfall input end time00:00 UTC 31 August 2015
Simulation time (h)1728
Manning’s roughness, ns (m−1/3s)0.025
Output interval (s)10
Table 2. Sensitivity experiments for land cover changes.
Case 1Control case (original case)
Case 2The urbanization of six cities (Lahore, Islamabad, Peshawar, Faisalabad, D.G. Khan, and Multan)
Case 3All areas converted into a forest
Case 4All land cover areas changed to urbanization
Case 5Urban grids (No. 18) expanded to eight surrounding grids
Case 6Shrubs, herbaceous and sparse vegetation, and bare areas (Nos. 6, 7, 8, 9, 10, 16, and 17) all converted into a forest
Case 7Urbanization between the Chenab and Indus Rivers combined with Case 6 area
Case 8Cases 5 and 6 combined (simultaneous planting and urbanization)
Publisher’s Note: MDPI stays neutral with regard to jurisdictional claims in published maps and institutional affiliations.

