Article

Compositional Analysis of Street Market Food Waste in Brazil

1
Swedish Centre for Resource Recovery, University of Borås, 501 90 Borås, Sweden
2
Institute of Agricultural Sciences, Federal University of Minas Gerais (UFMG), Avenida Universitária 1000, Montes Claros 39404-547, MG, Brazil
3
Department of Management, Development and Technology, São Paulo State University (UNESP), Rua Domingos da Costa Lopes, 780-Jd. Itaipu-Tupã, Sao Paulo 17602-496, SP, Brazil
*
Author to whom correspondence should be addressed.
Sustainability 2022, 14(12), 7014; https://doi.org/10.3390/su14127014
Submission received: 26 April 2022 / Revised: 1 June 2022 / Accepted: 4 June 2022 / Published: 8 June 2022
(This article belongs to the Special Issue Food Waste Management and Sustainability in the Food System)

Abstract

:
Current understanding of food waste quantities in the Brazilian retail sector is limited. In order to develop efficient measures for food waste prevention and valorisation, reliable data on waste generation and composition are necessary. In this study, a compositional analysis of street market waste was conducted in São Paulo, Brazil. In total, 4.1 tonnes of waste were sorted into 27 waste fractions, categorised using a three-level approach. The average waste generation in the studied street markets was 23.7 kg per stall, of which 12.8 kg was classified as unavoidable food waste, 3.6 kg as packaging waste, and 7.4 kg as avoidable waste. The results show large amounts of unavoidable food waste, comprised of coconut, sugarcane bagasse, and peels. A large share of the avoidable food waste is comprised of single leaves, tomatoes, oranges, and bananas. Large variations were observed among the street markets analysed, both in terms of the food waste generation rate, and composition. The results from scaling up the data at the city level indicated a total wastage of 59,300 tonnes per year, of which 18,400 tonnes are classified as avoidable food waste.

1. Introduction

Food production is an essential activity that demands large amounts of resources, and it causes numerous environmental impacts, such as global warming, loss of biodiversity, changes in land use, and the pollution of terrestrial and marine ecosystems [1]. The problem is intensified by the large amount of waste produced throughout the food supply chain. According to the Food Loss Index [2] and the Food Waste Index [3], 14% of food produced is lost from post-harvest up to (but not including) the retail level, and an additional 17% of food is wasted at the retail and consumer levels. Mbow et al. [4] estimate that 8–10% of total anthropogenic greenhouse gas emissions are related to food loss and waste.
Food loss and waste have gained attention in recent decades in Brazil, mainly due to their environmental and social impacts. The environmental impacts of food waste are amplified in the Brazilian context due to most of the waste being disposed in landfills and uncontrolled dumps [5], increasing the emission of methane and other greenhouse gases, as well as the contamination of surface and groundwater, and loss of vegetation. In social terms, even though Brazil is ranked among the top five producers and exporters of agricultural products, a large part of the population still suffers from food insecurity, with food loss and waste further decreasing the availability of and access to food [6].
The quantification of food waste is an essential component of the design of policies and measures for the prevention and valorisation of food waste. Food waste quantification allows the monitoring of waste generation over time, and provides a reference scenario for the evaluation of different prevention measures [7]. Although prevention efforts can be initiated without having comprehensive information on the amounts of food waste, quantification is necessary to better understand the size and location of the waste in the supply chain [7,8,9]. This information can be used to better define, prioritize, and target prevention and valorisation measures [10]. Nevertheless, data availability from direct measurements is still relatively poor, and, according to Xue et al. [11], only 20% of the studies on food loss and waste quantification are based on primary data.
Direct measurement of food waste (e.g., waste compositional analysis) can provide detailed and precise information about waste composition, and can also investigate the “business-as-usual” scenario without influencing the behaviour of the participants in the study [12,13]. Furthermore, it can mitigate respondents’ desirability bias, particularly in comparison with other self-report methods, e.g., questionnaires and diaries [12]. A food waste quantification study based on diaries in the UK reported high uncertainties between 12–20%, and a high level of waste underreporting, reaching 40% in some cases [14]. Nevertheless, direct food waste quantification is not a simple task, and it demands high expertise, time, and costs. The majority of the studies that have employed waste compositional analysis have used it to quantify municipal solid waste generation, particularly at the household level. For instance, Rousta et al. [15] used compositional analysis to investigate the effects of different measures (e.g., better information, and decreasing the distance to the recycling centre) on the amounts of incorrectly sorted waste in Swedish households. Edjabou et al. [13] investigated seasonal variations in the residual waste generation and composition in Danish households, and found no significant difference in the mass and composition of the waste between seasons. On the other hand, Malamis et al. [16] found significant seasonal variation in the fruits and vegetables category when investigating biowaste from Greek municipalities. At the retail level, the majority of studies are concentrated in supermarkets in Europe, and use scanning as the quantification method, e.g., [9,17,18,19,20,21]. Few studies have tackled this issue in Brazil, particularly for non-supermarket actors [22,23,24,25].
The Intersectoral Strategy for the Reduction of Food Losses and Waste in Brazil [26] posits that the lack of quantitative studies and of a standardized methodology for the quantification of food waste hinders the development and implementation of prevention actions in Brazil. Furthermore, the Food Waste Index [3] reports that there are insufficient data to estimate food waste in the retail sector in Brazil, as there are, generally, data gaps in the retail sector for low, lower-middle, and upper-middle income countries. The report particularly stresses the need for better food waste estimations in Brazil, due to its large impact on the regional coverage of food waste data; it also highlights the importance of food waste quantification at non-supermarket retailers, such as street markets, and the need for reliable data, particularly from direct measurements.
Street markets are traditional retail outlets, commonly occurring weekly in open-air spaces, which mainly sell produce and meat products [27]. Although street markets have lost some of their relevance due to the increase in the number of supermarkets, they still play a relevant role in the supply of fresh fruits and vegetables in Brazil. According to Freitas [28], street markets represent an average of 12% of the supply of produce in Brazilian metropolitan regions, and up to 24% in small cities in the interior of the country. There are few studies on the quantification and characterization of food waste at Brazilian retailers, particularly on non-supermarket actors. Fehr and Romão [29] analysed one street market stall and reported 12% food waste, the equivalent of 0.9 tonnes of food waste in two months. Santos et al. [24] analysed four small supply centres (CEASA) in the city of Salvador, which shared similarities with street markets concerning structure and operation, and investigated food waste generation via questionnaires. The authors reported a loss rate of 14%, due to poor storage of the products, inadequate reception and packaging practices, poor display of products, and the improper condition of the vehicles used to transport the products. de Brito Nogueira et al. [23] investigated fruit and vegetable processing waste (production of juice and fractioned vegetables) in two fruit and vegetables markets in Brazil, and reported a wastage of 48.6%; leafy products were among the products with the highest waste generation.
São Paulo is the fourth most populated city in the world, generating approximately 4.7 million tonnes of municipal solid waste annually [30]. The city of São Paulo currently has more than 800 street markets operating weekly, generating large amounts of food waste that could potentially be prevented or valorised. Furthermore, street markets are practical locations for segregated waste management, because the majority of the waste is organic, in contrast, for example, to household waste, which is comprised of many different types of materials that are often discarded together. This provides the opportunity for organic waste from street markets to be treated via composting or anaerobic digestion, without the need for complex pre-treatment or sorting. Currently, part of the organic waste generated at street markets in São Paulo is treated via composting. Five composting plants are in operation in the city; these plants received 7 100 tonnes of organic waste in 2020 [31].
The objective of this study is to estimate the quantities and the composition of food and packaging waste from street markets in the city of São Paulo. The aim is to support actions on food waste prevention and valorisation, and waste management. The information developed in this study can be used to identify hotspots in the system, i.e., food waste fractions with substantial waste generation, environmental impacts, and/or high loss of nutritional value. This can be used to prioritize the design of studies that seek to understand the reasons behind the high waste levels of such products, and to propose effective prevention and valorisation measures. Regarding waste management, this study can provide valuable information for the planning and operation of municipal waste management system. The São Paulo municipality plans to increase the treatment of organic residues from street markets via composting, and requires more detailed information on the quantities and composition of the waste to be treated [31].

2. Materials and Methods

2.1. Waste Fractions

A classification system for food waste with 3 levels of subcategories was developed, inspired by Edjabou et al. [32] (Table 1). The basic idea is to increase the comparability of the results, and to allow the highest level of data disaggregation, taking into account practical limitations on the number of fractions that it is possible to analyse in a waste compositional analysis, e.g., budget and time constraints. The tiered classification system permits a transparent classification and it is flexible, facilitating comparisons with studies that employ a different classification system [32]. This approach also enables a classification that is useful for the different goals of this compositional analysis, e.g., Level 0 is sufficient to estimate the potential for food waste prevention, while more detailed data (e.g., at level II) is necessary if the goal is to prioritize products for the investigation of risk factors for waste generation.
The nomenclature used in the different levels was inspired by different sources in the literature on food waste [3,33,34]. The classification levels vary in relation to the data aggregation. The first level (Level 0) disaggregated the waste into avoidable food waste, unavoidable food waste (as suggested by UNEP [3]), and packaging waste. Level I further disaggregate the avoidable food waste into food groups and finally, the data are presented at the product level at Level II.
Level 0 comprises packaging waste, and avoidable and unavoidable food waste. Packaging waste refers to wholesale packaging materials, or those used for the transportation of the products. Food waste is defined, accordingly to UNEP [3], as food and the associated inedible parts removed from the human food supply chain and sent to landfill, controlled combustion, sewer, anaerobic digestion, composting, or land application. Avoidable food waste comprises products that were edible at some point in time before being discarded. Unavoidable food waste refers to parts of the products that are typically not consumed by people, such as peels. These definitions of avoidable and unavoidable food waste have been reported in several publications (e.g., [35,36]). Several relevant publications, such as the Food Waste Index [3] and the FUSIONS definitional framework for food waste [33] recommend the disaggregation of food waste into avoidable and unavoidable, as a key factor for the development of policies and the application of the waste hierarchy.
Level I further differentiates the avoidable fraction into six food-group categories: (i) leaves, flowers, and stems, (ii) processed products, (iii) tubers, bulbs, and roots, (iv) vegetables, (v) fruits, and (vi) meat. Definitions of the terms ‘fruits’ and ‘vegetables’ are not universally shared, and their classification varies in the literature depending on the goal of the study. For example, WRAP [34] splits household food waste into 15 groups and differentiates fruits and vegetables into three categories: fruits, salads, and vegetables. In the literature on dietary guidance, Pennington and Fisher [37] proposed a classification of food in ten different categories, which include, for example, dark green leaves, legumes, and citrus-family fruits. Fruits are botanically defined, but there is no botanical definition of vegetables, and their classification is influenced by cultural norms, such as their culinary use [38]. The culinary definition of vegetables includes leaves, flowers, stems, tubers, bulbs, seeds, and fruits (see Table 1 for examples). Vegetables are normally consumed in dishes or as savoury appetizers. Even though fruits are botanically defined as the seeds and surrounding tissues of a plant, fruits are customarily also defined by their culinary use, and are referred to as the pulpy structures of produce that is typically sweet or sour, and is normally consumed as snacks and desserts [37]. In this study, the most common culinary use was applied for food items that could be classified into several food category groups. For instance, avocados are often defined as vegetables in the North American and European literature, due to their common use in savoury recipes and salads [37]. However, in Brazil, avocados are mainly consumed as a fruit and were defined as so. A category was defined for processed products, which includes fruits and vegetables that are washed, peeled, cut, or minced, and sold in packages, typically in plastic trays. The inclusion of this category was justified by large quantities observed being sold during the pre-study, and the increase in sales of such products in Brazilian retail [23].
Level II categorizes the food groups at the product level (Table 1). The unavoidable food waste category was disaggregated into three products, namely peels, sugarcane bagasse, a by-product derived from the production of sugarcane juice (caldo de cana), a typical beverage, and coconut waste, which is produced after the extraction of the water, another beverage commonly sold in Brazilian street markets. When a product was wasted entirely, it was classified entirely as avoidable, e.g., a wasted banana was weighted with the peel and categorized as an avoidable product. Products at level II were selected following three criteria. First, products that were observed with large amounts of waste during the pre-study; secondly, based on the Brazilian consumption profile of fruits and vegetables [39]; and, finally, due to relevance for waste management operators, e.g., packaging, meat, coconut, and sugarcane bagasse.
The ‘external waste’ fraction refers to materials that were not generated by the street market but were collected together (see Section 2.3 for the waste sampling description). Examples of ‘external waste’ were diapers, household waste, and construction material. Although this fraction is not part of the street market, it is included in the compositional analysis, taking into account the fact that it can be relevant to waste management operators, since it can contaminate the organic waste flow to be sent to composting.

2.2. Study Area

There are 871 registered street markets in São Paulo, operating from Tuesday to Sunday [40], and occurring in different locations with diverse socioeconomic characteristics. The street markets have an average operational time of 6 h per day, mostly in the mornings, on public roads that are closed to vehicles during the markets’ operation, creating certain access restrictions and limiting the public to the local surroundings [41]. It is possible to infer, without further prejudice to the analysis, that the public that attends the street markets is predominantly composed of residents and local workers. Street markets in the city of São Paulo sell mostly fresh products, such as fruits, vegetables, meat, and eggs. Spices, fruit preserves, sausages, sweets, cheeses, pickles, and agro-industry products are also sold to a lower extent [41]. Also noteworthy is the sale of non-alcoholic beverages, such as coconut water and sugarcane juice, as well as typical street foods such as fried pastry (pastel).
The stalls have a moderate level of specialization, and street market vendors tend to organize themselves into product categories, such as fruits, vegetables, bananas, fish, meats, tomatoes, spices, potatoes, etc. The number of dedicated stalls for each category may vary by location. This finding may be important, since a large part of the waste from the street market is mixed in the cleaning and collection process, and not in its generation.
Waste collection in São Paulo’s street markets is managed by the Autoridade Municipal de Limpeza Urbana (AMLURB), a public organization linked to the Municipal Urban Cleaning Department. Both the collection and transport of urban solid waste and the sweeping and cleaning of streets are carried out by private companies contracted by AMLURB [42].
The street markets included in the study are described in Table 2. The size of the street markets varied from 4 to 73 stalls. The average HDI of the districts that make up the sample ranges from 0.79 to 0.86; they are therefore considered to be upper-middle class districts [43]. The selection of street markets was based on the agreement with the waste collection companies to transport the waste generated to the sorting site. In addition, it was necessary that the waste was transported in an uncompressed state. Consequently, the selection of street markets was based primarily on the logistics for collection, including transportation to the sorting site and the possibility of transporting uncompressed waste. Secondarily, a selection was made to cover different sizes of street market.

2.3. Waste Sampling and Sorting Procedure

The data for this study were obtained via waste compositional analysis, which consists of physically separating, weighing, and categorizing the waste [44]. The waste compositional analysis study was conducted over the course of one week in December 2021 in São Paulo.
A pre-study was conducted in 2020, and data were collected in relation to the number of street markets, their location, days of operation, and number of stalls. Moreover, relevant waste streams were identified, and data related to the waste collection were gathered, including the collection schedule, disposal mode, truck capacity, number of employees involved in the collection, and presence of informal collection.
The waste collection for the waste compositional analysis occurred at the end of the operation of the street markets and followed the ordinary cleaning routine of the municipality. The waste generated by the stalls was swept and bagged by the municipality, and later collected and transported to the site where the compositional analysis was performed. The only difference from the ordinary process undertaken by the municipality was the vehicle used, as the waste is normally transported in compactor trucks, but, in order to preserve the characteristics of the waste, a regular truck was used during the study. To prevent changes in waste generation that could lead to biased results, the vendors were not aware of the study. All the waste collected by the municipality was transported and further analysed, i.e., no sampling was conducted within the street market. In total, four street markets were analysed and 4.1 tonnes of waste was collected and sorted.
The collected waste arrived at the sorting site around 5 pm each day, and was unloaded using manual forklifts; it was then stored until the next day when the sorting procedure was carried out. The first step in the compositional analysis consisted of weighing the total waste collected on the previous day, using a digital scale with 10 g accuracy. After the initial weighing, the waste was manually sorted in 200 litre drum-type containers, following the 27 waste categories defined at Level II (Table 1). Packaging containing residual food was classified as packaging.
The waste collection schedule for the street markets is different from that of households and businesses and, in principle, only the waste generated at the street market is expected to be collected. Nevertheless, the street market is not a closed system, and residents of the region might dispose their waste incorrectly. Therefore, in order to avoid the inclusion of such external waste in the results, the team was trained to be able to identify such waste streams, and a category was used to classify it (external waste).

2.4. Data Analysis

The data were analysed using the software MINITAB 17 (Minitab Inc., State College, PA, USA). Waste compositional data were reported and discussed based on the mass of waste generated per stall, to enable comparison with the different street markets analysed. The calculation was based on the total waste collected divided by the total number of stalls in the street market (Equation (1)). Descriptive statistics were used to summarize and describe the dataset in relation to measures of central tendency (e.g., mean and median) and variability (e.g., standard deviation and coefficient of variation). Furthermore, the boxplot chart was used to compare the variability and central tendency of the waste generation for the different food waste categories at level I.
Waste i , j [ kg stall ] = T o t a l   w a s t e i , j [ kg ] N u m b e r   o f   s t a l l s j [ stall ] ,
where i corresponds to the waste fraction and j to the street market.
The scaling up of the data to the city level was carried out based on the use of waste factors, as recommended by the Food Loss and Waste Protocol [44]. The waste generation at the city level was estimated by multiplying the average waste generation (kg per stall) by the total number of stalls operating during the course of one year.

3. Results and Discussion

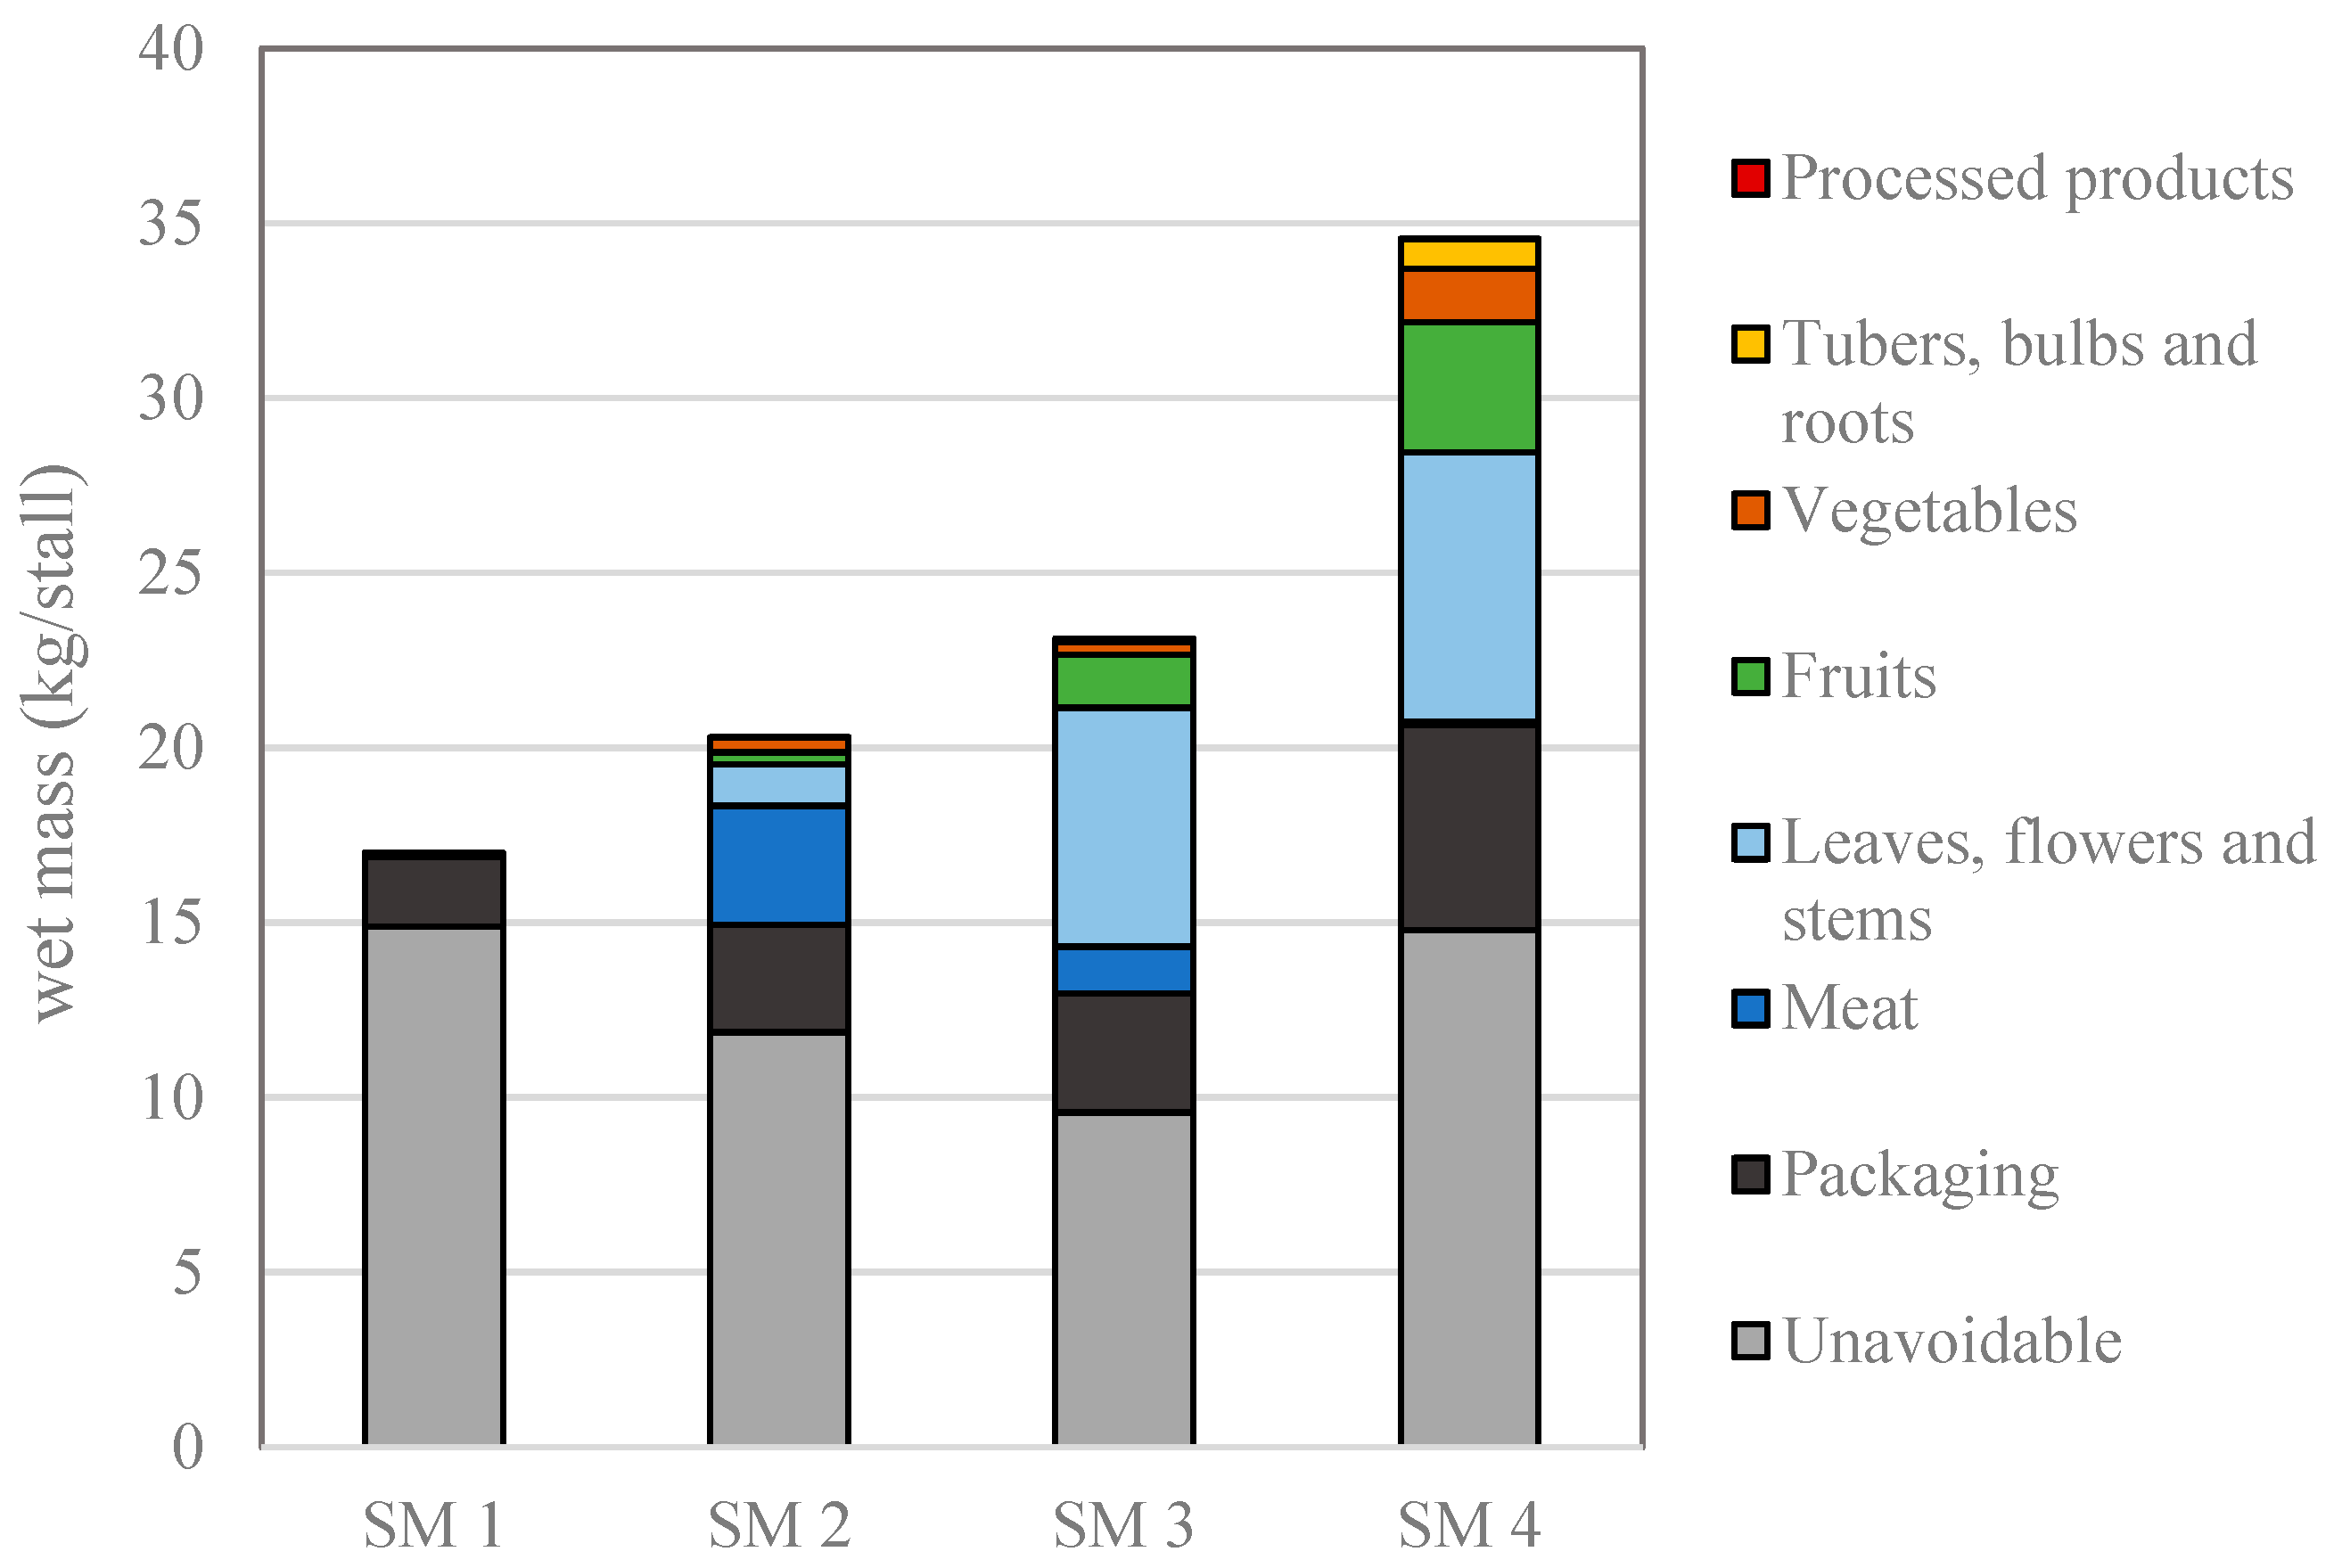
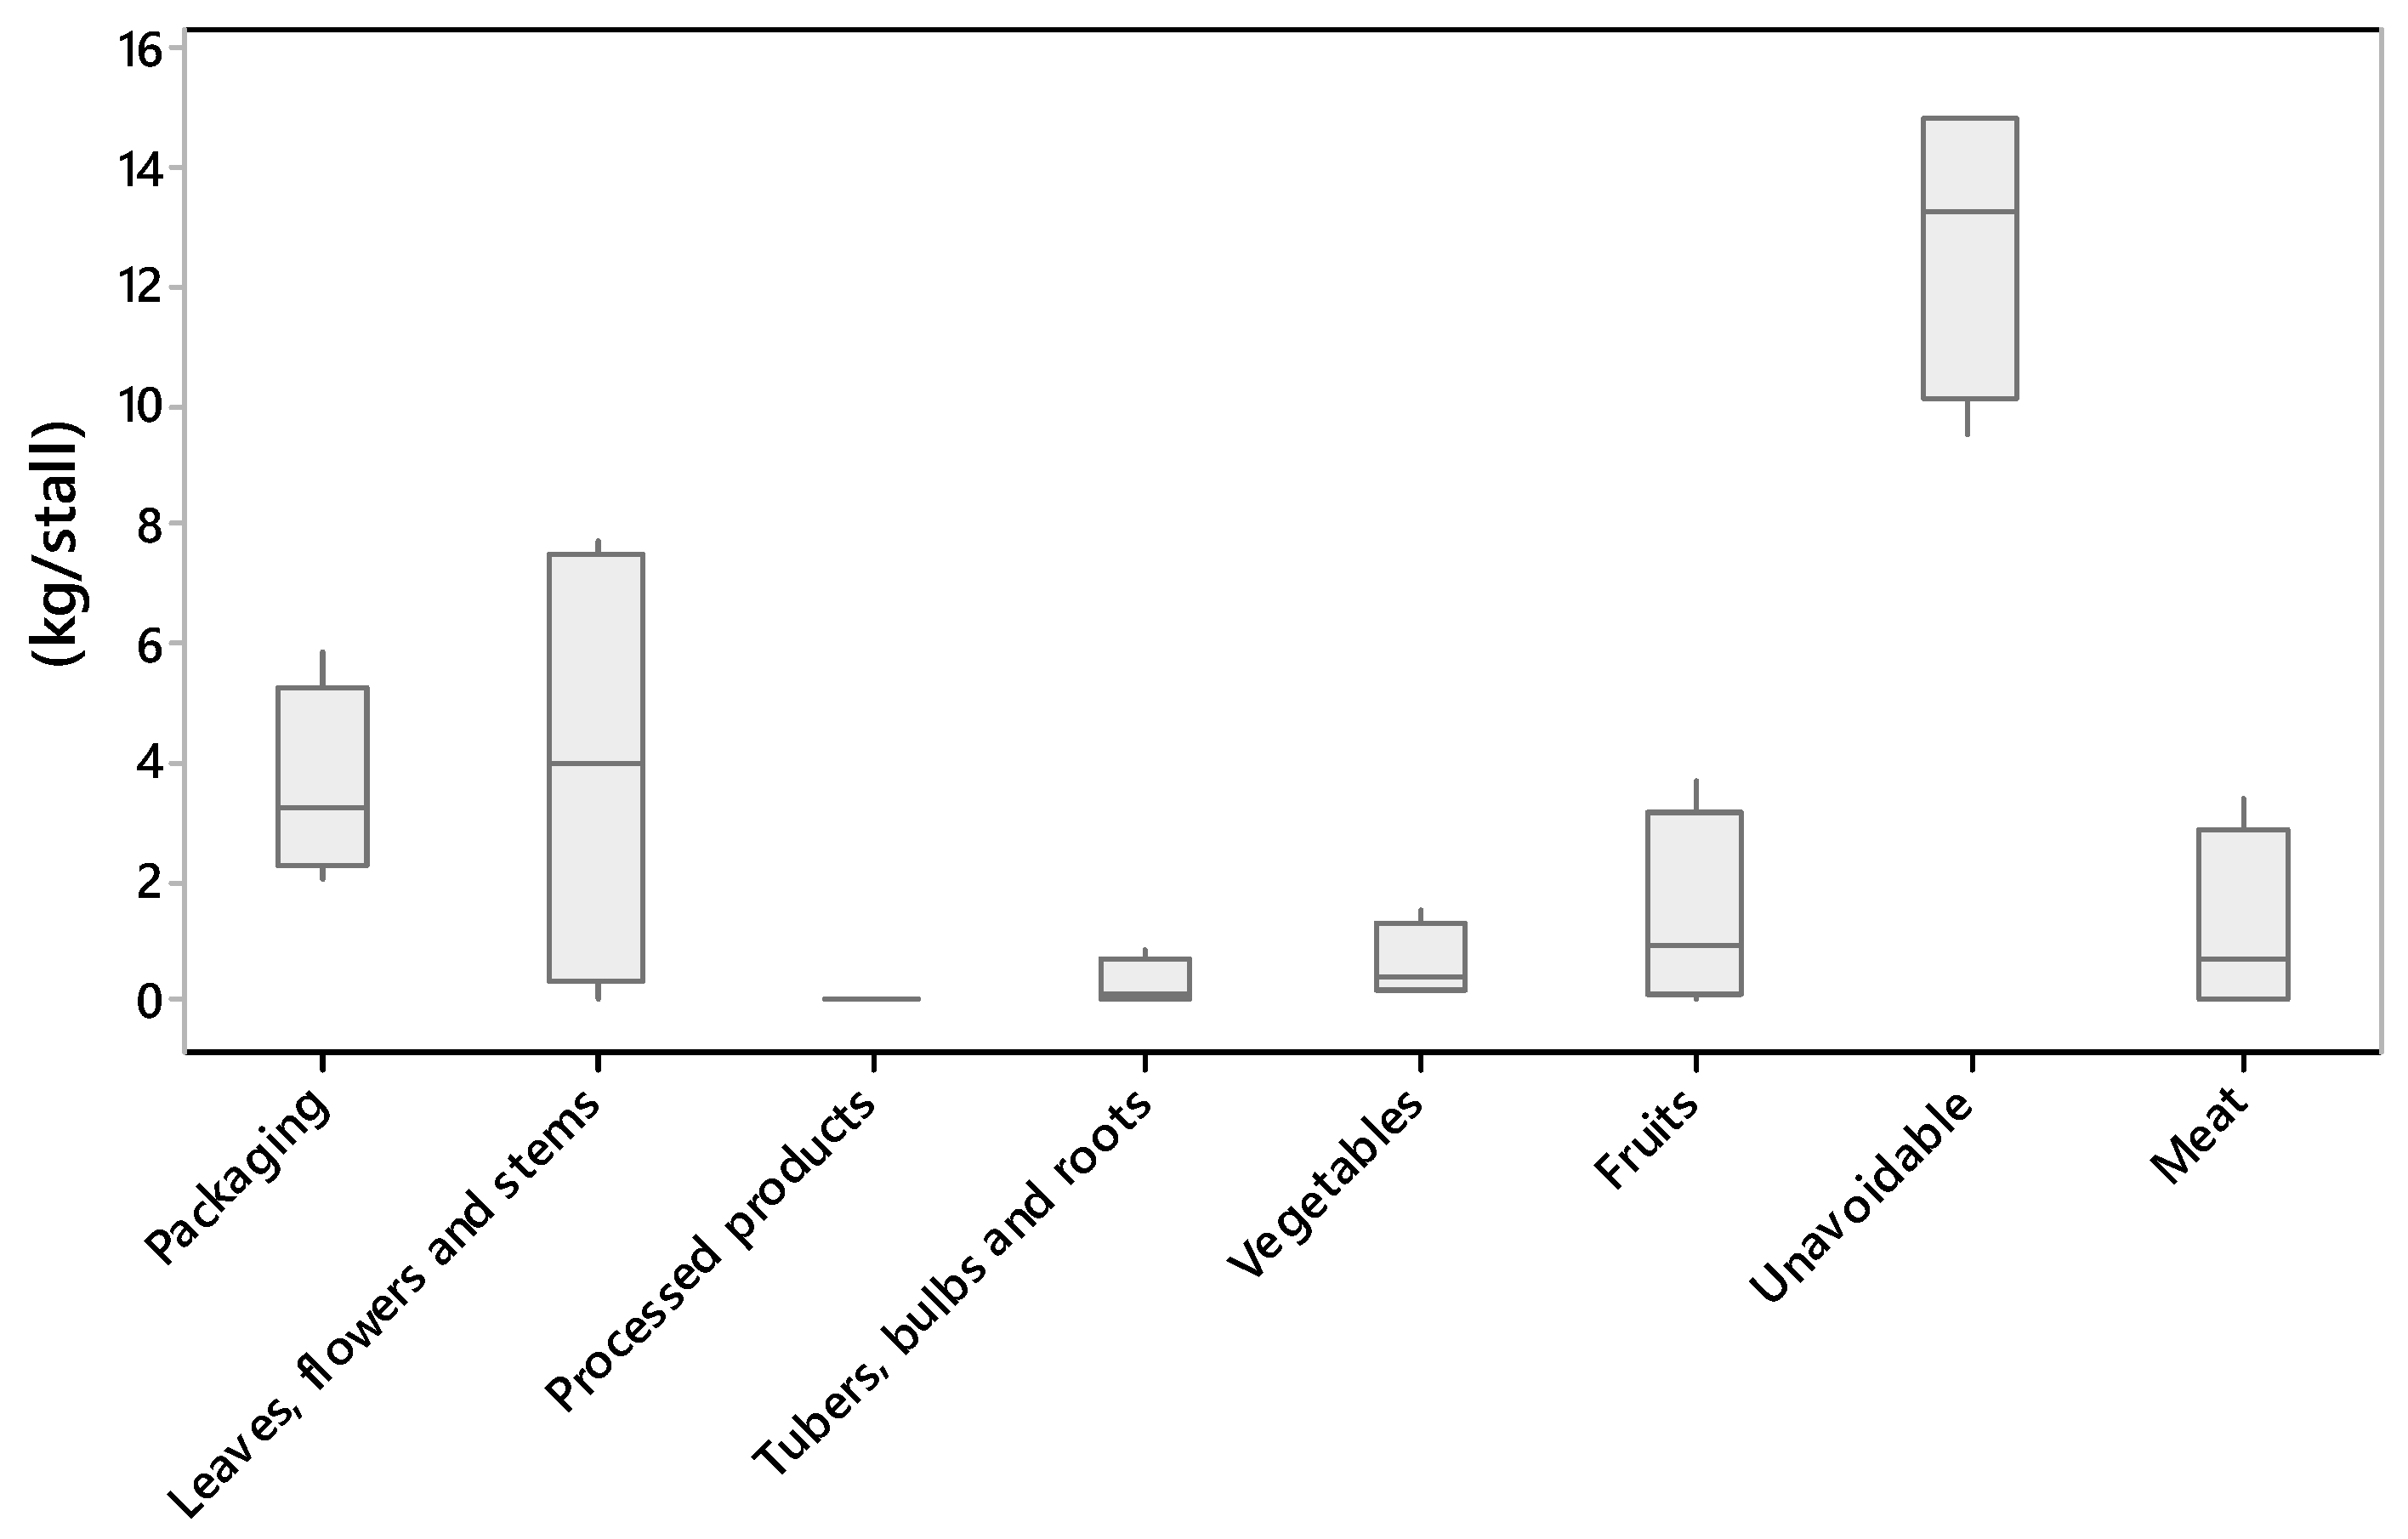
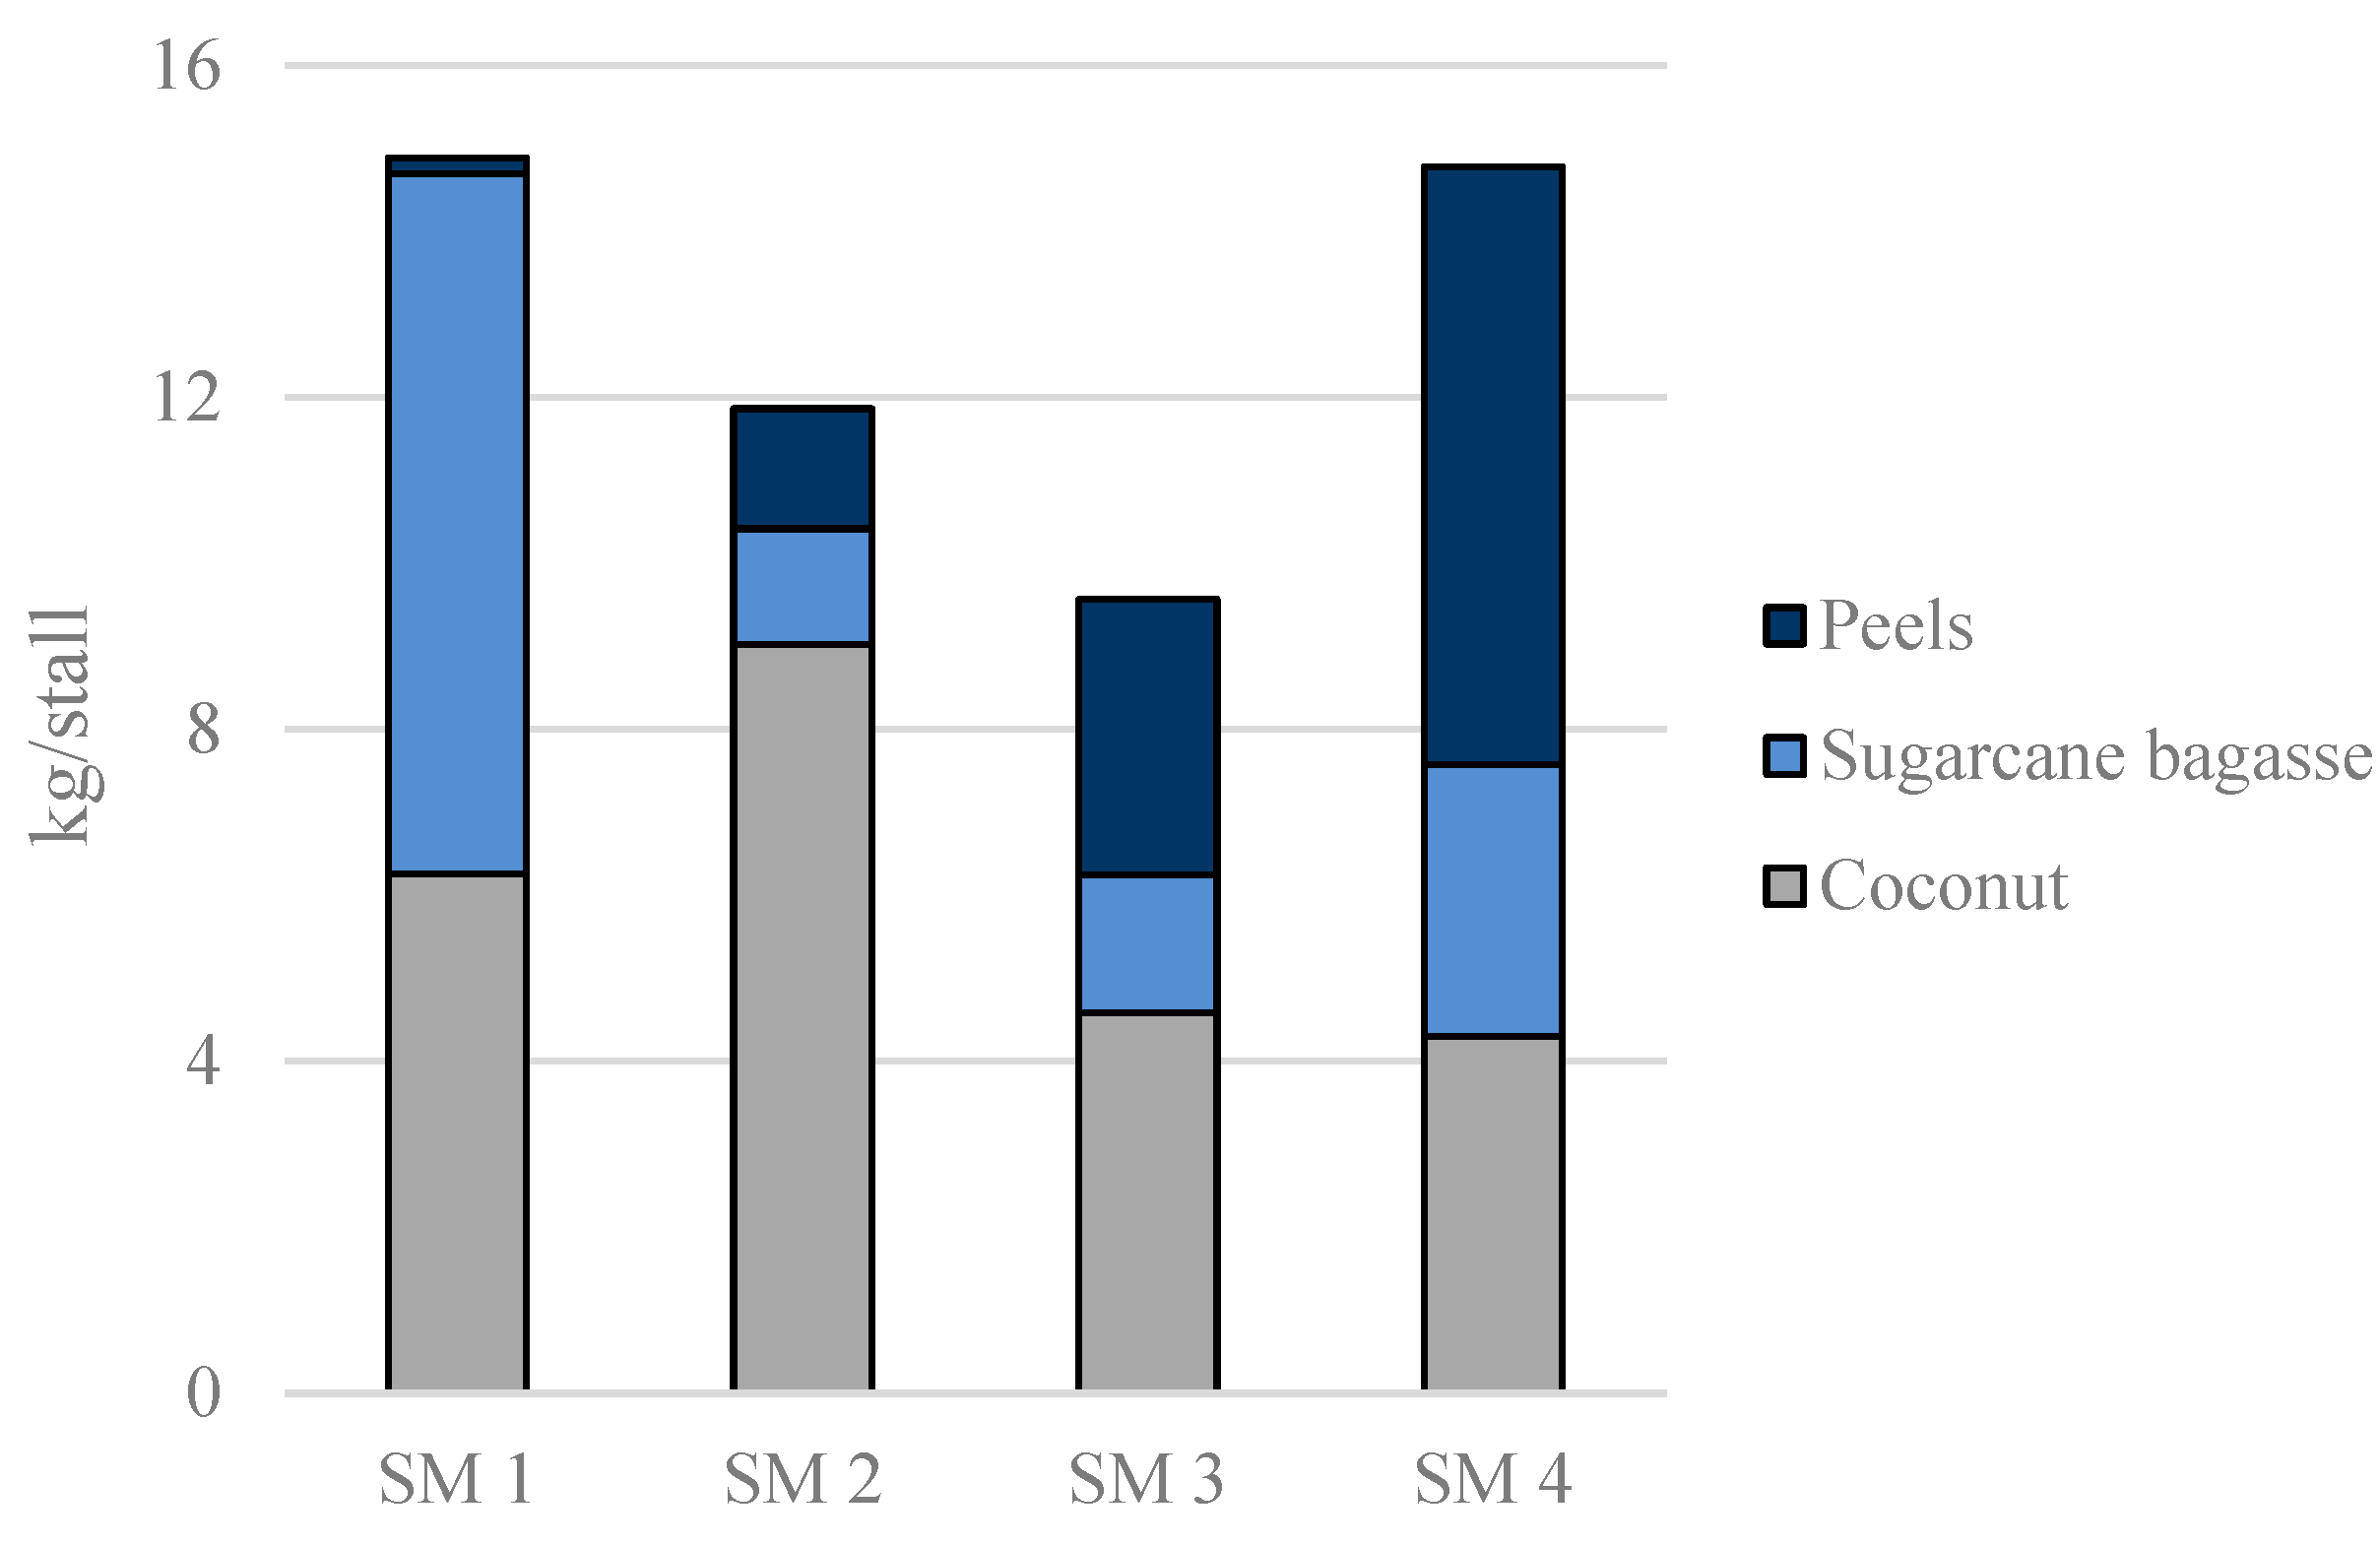
3.1. Food Waste Composition and Generation Rate

The waste generation varied from 17 kg per stall in SM 1, to 34.6 kg per stall in SM 4. Unavoidable food waste was the largest category in all of the street markets analysed. The generation of unavoidable food waste varied from 9.6 to 14.9 kg per stall in SM 3 and SM 1, respectively (Figure 1). The second category with the highest average waste generation was leaves, flowers, and stems, with an average waste generation of 3.9 kg per stall, followed by packaging (3.6 kg per stall), and fruits (1.4 kg per stall). The categories of vegetables, and tubers, bulbs, and roots, had an average generation of 0.6 and 0.2 kg per stall, respectively (Figure 2). Table 3 describes the results from the waste composition for level II for the four street markets analysed.
The generation of avoidable food waste varied from 0.1 to 13.9 kg per stall (Figure 2). The generation of avoidable food waste was predominantly from meat products in SM 2, while SM 3 and SM 4 showed high wastage of leaves, flowers, and stems, and fruits (Figure 1). The lowest generation of avoidable food waste was found in SM 1, with a contribution lower than 1%. SM 1 was a relatively small street market with 80% of the total waste being comprised of coconut shells and sugarcane bagasse, and virtually no generation of avoidable waste. SM 1 was an outlier, in relation to both size and waste composition, when compared with the other street markets.
Leaves, flowers, and steams were the avoidable food waste group with the highest average waste generation (3.9 kg per stall). Nevertheless, a large variation was found among the street markets analysed, and the generation rates ranged from 0 to 7.7 kg per stall in SM 1 and SM 4 respectively (Figure 2). The majority of the waste fell into the ‘other’ category, and was mainly comprised of single leaves and stems. Leaves are particularly prone to damage, such as wilting due to water loss, yellowing due to chlorophyll degradation, damaged tissues, and rot caused by fungi or bacteria [45]. The results from this study are similar to those from de Brito Nogueira et al. [23], who found that the largest amount of processing waste came from leafy products, due to the removal of steams and damage to leaves. It is common practice for vendors to discard the outer layers of leafy products throughout the day to increase the visual quality of the products [23]. Damage is often caused by the consumer’s handling of the products, and low humidity and high temperatures during display. The high waste level for leafy products has also been reported in other retail actors in different geographical locations, for instance in Swedish supermarkets [17,18].
In the vegetables category, the average loss rate was 0.6 kg per stall, varying from 0.1 to 1.5 kg per stall in SM 1 and SM 4, respectively. Tomatoes were the product with the highest waste level. Tomatoes are reported to be a product with large post-harvest loss in Brazil [24] and other countries [46]. As a climacteric fruit, i.e., a fruit that can ripen after being harvested, factors such as improper packaging and high temperatures can accelerate the ripening process and consequently the rooting, wilting, and microbial contamination of the product [24,47]. Furthermore, tomatoes are prone to mechanical damage during handling [48].
For the fruit category, bananas and oranges made the largest contribution to waste generation. Bananas and oranges are among the fruits most consumed by the Brazilian population, with an average consumption of 15 and 9 g per capita per day respectively [39]. Santos et al. [24] report that bananas are among the products with the highest waste generation, with a waste rate of 22%. A large generation of waste from the ‘other fruits’ category was observed, particularly in SM 4, with a substantial share of jabuticaba (P. cauliflora) and peaches at SM 3.
During the pre-study, it was observed that a large number of stalls sold processed products, and it was hypothesized that high waste generation would be observed for this category, considering that, after being processed, the remaining shelf-life for these products is virtually the same day. Nevertheless, for the street markets analysed, only a small amount of waste of processed fruits and vegetables was found. It is not possible to draw a definitive conclusion on the waste generation of this category, considering the sample size and the other limitations of the study, which are discussed in Section 3.3. Large amounts of peel were found, particularly in SM 3 and SM 4, and it can be argued that this is likely derived from the in situ processing of produce. de Brito Nogueira et al. [23] calculate an average of 37% and 44% of waste when processing vegetables and fruits, respectively, and argue that part of that waste is avoidable.
Around 70% of the total waste in the street markets analysed was unavoidable food waste and packaging, the equivalent of 16.4 kg per stall. The share of the three fractions for the unavoidable food waste category, namely peels, sugarcane bagasse, and coconut, varied substantially in the street markets analysed (Figure 3). Unavoidable food waste, packaging, and meat are particularly relevant products for the operation of composting plants. Coconuts shells and sugarcane bagasse are lignocellulosic materials, and consequently resistant to microbial degradation [49]. This may cause operational problems in composting plants, such as the loss of operational volume, the production of odorous gases, and the low quality of the composting product [50]. This necessitates that these products are ground before being sent to composting. In contrast, sugarcane bagasse can, to some extent, be used as a structuring agent, increasing the availability of oxygen during the composting process [51]. The use of sugarcane bagasse has been reported to control the pH and enhance nutrient transformation, to adjust the C:N ratio, and to improve the quality of the compost [52,53,54]. The main issue with the composting of meat is the generation of bad odours and the attraction of vectors; for this reason, the municipality does not treat this food waste fraction in the composting plants.

3.2. Data Extrapolation to City Level

The data were scaled up to the city level based on individual street market waste generation per stall, which was used as the waste factor. The street markets are described in Table 2, and the average waste generation rate was 23.7 ± 7.6 kg per stall (Table 4). The average waste generation rate is in line with the findings from Fehr and Romão [29].
There are 871 street markets registered in São Paulo, typically occurring weekly, with a total of 48,004 stalls [40]. Assuming that all street markets operate during the 52 weeks of the year, there are a total of 45,292 street market occasions per year, amounting to 2,496,208 stalls per year. Therefore, the total yearly waste generation for street markets in the city of São Paulo was calculated at 59,300 ± 19,000 tonnes. Avoidable waste was calculated at 18,400 ± 14,900 tonnes, and 31,900 ± 6400 tonnes of unavoidable food waste was generated. Packaging waste generation was calculated at 9000 ± 4100 tonnes. These results are highly uncertain, due to the relatively low sample size and the other limitations which are discussed in Section 3.3. Nevertheless, the results from the present study give the first estimations of the waste generation rates and composition in São Paulo street markets, and are relevant for the design and implementation of measures aimed at food waste prevention and valorisation.

3.3. Limitations

The main limitations of this study relate to uncertainties due to two sampling errors, namely the long-range heterogeneity fluctuation error, and the periodic heterogeneity fluctuation error, as described in Dahlén and Lagerkvist [55]. The former is related to spatial variation, where a sample from a street market may not be representative of another area. São Paulo is the most populous city in the southern hemisphere, and this quantification included four street markets from areas that have similar sociodemographic characteristics. The latter refers to the periodic variations in waste composition due to seasonal variations. The quantification analyses were all conducted at the same time of the year, in a week-long period, and variations in waste composition, due to the seasonality of the products sold in street markets and the quantities of waste, may occur. Other common uncertainties in waste compositional analyses were reduced by the quantification of all waste generated at the street markets. Since there was no sampling of the waste generated for each street market, i.e., all waste generated was sorted, errors such as the fundamental error, the grouping and segregation error, and the increment extraction and delimitation error, were reduced [55].

4. Conclusions

To investigate the composition and generation rate of waste generated at street markets in São Paulo, Brazil, four street markets were analysed. A classification system with three category levels, totalling 27 categories, was used. The results showed that street markets in São Paulo generated, on average, 23.7 kg of waste per stall, with unavoidable food waste, particularly coconut and sugarcane bagasse, making the largest contribution to the wasted food. Coconut and sugarcane bagasse have important implications for the waste management strategy adopted by the municipality (composting) due to their lignocellulosic composition.
The generation of avoidable food waste was estimated at 7.4 kg per stall. Leaves, flowers, and stems was the avoidable food waste category with the highest wastage, and single leaves were the product with the highest waste generation in the category. The results from the composition analysis showed differences among the street markets analysed in relation to both the waste generation rates and the waste composition. The extrapolation of the data to the city level estimated 59,300 tonnes of food and packaging waste per year in the city of São Paulo.
The food waste generated at the street markets in São Paulo has implications for the environment, due to the resources used and emissions that occur during production and end of life. These externalities can potentially be reduced, since a large proportion of this food has the potential to be donated or used as a raw material for animal feed, chemicals, fuels, or materials.
The results of this study can be further combined with other indicators, such as environmental impacts and nutritional loss, to identify hotspots at the product level to be investigated in relation to the causes of waste. Future studies could focus on the investigation of risk factors for waste generation in distribution, storage, and selling practices, in order to uncover the causes behind the generation of waste of such products. Furthermore, there is a need for more extensive data on the quantities and composition of food waste in retailers in Brazil.

Author Contributions

Conceptualization, P.B.; methodology, P.B. and K.R.; validation, P.B. and K.R.; formal analysis, P.B. and K.R.; investigation, P.B., F.M. and P.G.L.; resources, P.B. and K.R.; data curation, P.B., F.M. and P.G.L.; writing—original draft preparation, P.B.; writing—review and editing, P.B., F.M., P.G.L. and K.R.; visualization, P.B.; supervision, P.B. and K.R.; project administration, P.B. and K.R.; funding acquisition, P.B. and K.R. All authors have read and agreed to the published version of the manuscript.

Funding

This research was funded by Swedish Environmental Protection Agency (Naturvårdsverket).

Data Availability Statement

Not applicable.

Acknowledgments

The authors are grateful for funding from the Swedish Environmental Protection Agency (Naturvårdsverket). The authors also acknowledge the support from the municipality of São Paulo and the São Paulo municipal urban cleaning authority (AMLURB).

Conflicts of Interest

The authors declare no conflict of interest.

References

  1. Springmann, M.; Clark, M.; Mason-D’Croz, D.; Wiebe, K.; Bodirsky, B.L.; Lassaletta, L.; De Vries, W.; Vermeulen, S.J.; Herrero, M.; Carlson, K.M. Options for keeping the food system within environmental limits. Nature 2018, 562, 519–525. [Google Scholar] [CrossRef]
  2. FAO. The State of Food and Agriculture 2019: Moving forward on Food Loss and Waste Reduction; Food and Agriculture Organization of the United Nations: Rome, Italy, 2019. [Google Scholar]
  3. UNEP. Food Waste Index-Report 2021; UNEP: Nairobi, Kenya, 2021. [Google Scholar]
  4. Mbow, C.; Rosenzweig, C.; Barioni, L.G.; Benton, T.G.; Herrero, M.; Krishnapillai, M.; Liwenga, E.; Pradhan, P.; Rivera-Ferre, M.G.; Sapkota, T.; et al. Food Security. In Climate Change and Land: An IPCC Special Report on Climate Change, Desertification, Land Degradation, Sustainable Land Management, Food Security, and Greenhouse Gas Fluxes in Terrestrial Ecosystems; Shukla, P.R., Skeg, J., Buendia, E.C., Masson-Delmotte, V., Pörtner, H.-O., Roberts, D.C., Zhai, P., Slade, R., Conners, S., van Diemen, R.M., et al., Eds.; 2019; Available online: https://philpapers.org/rec/SHUCCA-2 (accessed on 1 June 2022).
  5. ABRELPE. Panorama 2021 dos Resíduos Sólidos no Brasil; ABRELPE: São Paulo, Brazil, 2021. [Google Scholar]
  6. Henz, G.P.; Porpino, G. Food losses and waste: How Brazil is facing this global challenge? Hortic. Bras. 2017, 35, 472–482. [Google Scholar] [CrossRef] [Green Version]
  7. Corrado, S.; Caldeira, C.; Eriksson, M.; Hanssen, O.J.; Hauser, H.-E.; van Holsteijn, F.; Liu, G.; Östergren, K.; Parry, A.; Secondi, L.; et al. Food waste accounting methodologies: Challenges, opportunities, and further advancements. Glob. Food Sec. 2019, 20, 93–100. [Google Scholar] [CrossRef]
  8. Caldeira, C.; De Laurentiis, V.; Corrado, S.; van Holsteijn, F.; Sala, S. Quantification of food waste per product group along the food supply chain in the European Union: A mass flow analysis. Resour. Conserv. Recycl. 2019, 149, 479–488. [Google Scholar] [CrossRef]
  9. Brancoli, P.; Lundin, M.; Bolton, K.; Eriksson, M. Bread loss rates at the supplier-retailer interface–Analysis of risk factors to support waste prevention measures. Resour. Conserv. Recycl. 2019, 147, 128–136. [Google Scholar] [CrossRef]
  10. Brancoli, P.; Bolton, K.; Eriksson, M. Environmental impacts of waste management and valorisation pathways for surplus bread in Sweden. Waste Manag. 2020, 117, 136–145. [Google Scholar] [CrossRef]
  11. Xue, L.; Liu, G.; Parfitt, J.; Liu, X.; Van Herpen, E.; Stenmarck, Å.; O’Connor, C.; Östergren, K.; Cheng, S. Missing Food, Missing Data? A Critical Review of Global Food Losses and Food Waste Data. Environ. Sci. Technol. 2017, 51, 6618–6633. [Google Scholar] [CrossRef] [PubMed]
  12. Withanage, S.V.; Dias, G.M.; Habib, K. Review of household food waste quantification methods: Focus on composition analysis. J. Clean. Prod. 2021, 279, 123722. [Google Scholar] [CrossRef]
  13. Edjabou, M.E.; Boldrin, A.; Astrup, T.F. Compositional analysis of seasonal variation in Danish residual household waste. Resour. Conserv. Recycl. 2018, 130, 70–79. [Google Scholar] [CrossRef] [Green Version]
  14. Parry, A. Measuring Household Food Waste–The UK Experience, Meeting of the EU Platform on Food Losses and Food Waste. Available online: https://ec.europa.eu/food/sites/food/files/safety/docs/fw_eu-platform_20170331_wrap-measuring.pdf (accessed on 22 November 2017).
  15. Rousta, K.; Bolton, K.; Lundin, M.; Dahlén, L. Quantitative assessment of distance to collection point and improved sorting information on source separation of household waste. Waste Manag. 2015, 40, 22–30. [Google Scholar] [CrossRef]
  16. Malamis, D.; Moustakas, K.; Bourka, A.; Valta, K.; Papadaskalopoulou, C.; Panaretou, V.; Skiadi, O.; Sotiropoulos, A. Compositional analysis of biowaste from study sites in Greek municipalities. Waste Biomass Valorization 2015, 6, 637–646. [Google Scholar] [CrossRef]
  17. Brancoli, P.; Rousta, K.; Bolton, K. Life cycle assessment of supermarket food waste. Resour. Conserv. Recycl. 2017, 118, 39–46. [Google Scholar] [CrossRef]
  18. Eriksson, M.; Strid, I.; Hansson, P.-A. Food losses in six Swedish retail stores: Wastage of fruit and vegetables in relation to quantities delivered. Resour. Conserv. Recycl. 2012, 68, 14–20. [Google Scholar] [CrossRef]
  19. Cicatiello, C.; Franco, S.; Pancino, B.; Blasi, E.; Falasconi, L. The dark side of retail food waste: Evidences from in-store data. Resour. Conserv. Recycl. 2017, 125, 273–281. [Google Scholar] [CrossRef]
  20. Scherhaufer, S.; Schneider, F. Prevention, recycling and disposal of waste bread in Austria. In Proceedings of the Thirteenth International Landfill Symposium, Cagliari, Italy, 3 October 2011. [Google Scholar]
  21. Lebersorger, S.; Schneider, F. Food loss rates at the food retail, influencing factors and reasons as a basis for waste prevention measures. Waste Manag. 2014, 34, 1911–1919. [Google Scholar] [CrossRef]
  22. Costa, F.H.d.O.; de Moraes, C.C.; da Silva, A.L.; Delai, I.; Chaudhuri, A.; Pereira, C.R. Does resilience reduce food waste? Analysis of Brazilian supplier-retailer dyad. J. Clean. Prod. 2022, 338, 130488. [Google Scholar] [CrossRef]
  23. de Brito Nogueira, T.B.; da Silva, T.P.M.; de Araújo Luiz, D.; de Andrade, C.J.; de Andrade, L.M.; Ferreira, M.S.L.; Fai, A.E.C. Fruits and vegetable-processing waste: A case study in two markets at Rio de Janeiro, RJ, Brazil. Environ. Sci. Pollut. Res. 2020, 27, 18530–18540. [Google Scholar] [CrossRef]
  24. Dos Santos, S.F.; Cardoso, R.d.C.V.; Borges, Í.M.P.; Almeida, A.C.e.; Andrade, E.S.; Ferreira, I.O.; Ramos, L.d.C. Post-harvest losses of fruits and vegetables in supply centers in Salvador, Brazil: Analysis of determinants, volumes and reduction strategies. Waste Manag. 2020, 101, 161–170. [Google Scholar] [CrossRef]
  25. Lana, M.M.; Moita, A.W. Qualidade visual e desperdício de hortaliças e ervas frescas em um típico mercado varejista no Brasil. Hortic. Bras. 2019, 37, 161–171. [Google Scholar] [CrossRef] [Green Version]
  26. De Segurança Alimentar, C.I. Estratégia Intersetorial Para a Redução de Perdas e Desperdício de Alimentos no Brasil. 2018. Available online: https://nutricao.t4h.com.br/manuais/estrategia-intersetorial-para-a-reducao-de-perdas-e-desperdicio-de-alimentos-no-brasil/ (accessed on 2 August 2021).
  27. Mascarenhas, G.; Dolzani, M.C.S. Feira livre: Territorialidade popular e cultura na metrópole contemporânea. Ateliê Geogr. 2008, 2, 72–87. [Google Scholar] [CrossRef]
  28. Freitas, K.A. Mobilidade Urbana e Hábitos de Compra: Efeitos na Distribuição e na Logística Para o Varejo; Universidade Federal de Minas Gerais: Belo Horizonte, Brazil, 2015. [Google Scholar]
  29. Fehr, M.; Romão, D.C. Measurement of fruit and vegetable losses in Brazil: A case study. Environ. Dev. Sustain. 2001, 3, 253–263. [Google Scholar] [CrossRef]
  30. Liikanen, M.; Havukainen, J.; Viana, E.; Horttanainen, M. Steps towards more environmentally sustainable municipal solid waste management–A life cycle assessment study of São Paulo, Brazil. J. Clean. Prod. 2018, 196, 150–162. [Google Scholar] [CrossRef]
  31. Prefeitura de São Paulo Resíduos Orgânicos-Compostagem em São Paulo. Available online: https://www.prefeitura.sp.gov.br/cidade/secretarias/subprefeituras/amlurb/index.php?p=283430 (accessed on 2 August 2021).
  32. Edjabou, M.E.; Jensen, M.B.; Götze, R.; Pivnenko, K.; Petersen, C.; Scheutz, C.; Astrup, T.F. Municipal solid waste composition: Sampling methodology, statistical analyses, and case study evaluation. Waste Manag. 2015, 36, 12–23. [Google Scholar] [CrossRef] [PubMed] [Green Version]
  33. Östergren, K.; Bos-Brouwers, H.E.J.; Timmermans, A.J.M.; Soethoudt, J.M.; Gustavsson, J.; Hansen, O.J.; Möller, H.; Anderson, G.; O’Connor, C.; Quested, T. FUSIONS Definitional Framework for Food Waste; FUSIONS N FP7-KBBE-2012-6-311972: Gothenburg, Sweden, 2014. [Google Scholar]
  34. WRAP. Household Food and Drink Waste in the UK; WRAP: London, UK, 2009. [Google Scholar]
  35. Quested, T.; Ingle, R.; Parry, A. Household Food and Drink Waste in the United Kingdom 2012; WRAP: London, UK, 2013. [Google Scholar]
  36. Bernstad Saraiva Schott, A.; Andersson, T. Food waste minimization from a life-cycle perspective. J. Environ. Manag. 2015, 147, 219–226. [Google Scholar] [CrossRef]
  37. Pennington, J.A.T.; Fisher, R.A. Classification of fruits and vegetables. J. Food Compos. Anal. 2009, 22, S23–S31. [Google Scholar] [CrossRef]
  38. Thompson, F.E.; Willis, G.B.; Thompson, O.M.; Yaroch, A.L. The meaning of ‘fruits’ and ‘vegetables’. Public Health Nutr. 2011, 14, 1222–1228. [Google Scholar] [CrossRef] [Green Version]
  39. Instituto Brasileiro de Geografia e Estatística–IBGE. Pesquisa de Orçamentos Familiares 2017–2018: Análise do Consumo Alimentar Pessoal no Brasil; Instituto Rio de Janeiro: Rio de Janeiro, Brazil, 2020. [Google Scholar]
  40. Prefeitura de São Paulo Lista Completa de Feiras. Available online: https://www9.prefeitura.sp.gov.br/secretarias/sdte/pesquisa/feiras/lista_completa.htm (accessed on 9 January 2020).
  41. Mainville, D.Y. The Structure of Fresh Produce Markets in São Paulo: Recent Developments, Trends and Implications for Market Structure; Congresso Brasileiro de Economia e Sociologia Rural: Brasília, Brazil, 2002. [Google Scholar]
  42. Prefeitura de São Paulo Varrição de Ruas e Limpeza Pública. Available online: https://www.prefeitura.sp.gov.br/cidade/secretarias/spregula/limpeza_urbana/fiscalizacao/index.php?p=4638 (accessed on 20 February 2022).
  43. URBIT. IDH dos Bairros de São Paulo-SP. Available online: http://urbit.com.br/mapa/idh-sp (accessed on 23 December 2021).
  44. Hanson, C.; Lipinski, B.; Robertson, K.; Dias, D.; Gavilan, I.; Gréverath, P.; Ritter, S.; Fonseca, J.; Van Otterdijk, R.; Timmermans, T. Food Loss and Waste Accounting and Reporting Standard. WRI, Nestlé, CGF, FAO, EU-funded FUSIONS Project, UNEP, WRAP, WBCSD, NRI. URL. 2016. Available online: https://www.wri.org/research/food-loss-and-waste-accounting-and-reporting-standard (accessed on 1 June 2022).
  45. Lana, M.M.; Moita, A.W. Qualidade Visual e Perdas pós-Colheita de Hortaliças Folhosas no Varejo: Dois Estudos de Caso no Distrito Federal, Brasil; Embrapa Hortaliças-Documentos (INFOTECA-E): Brasília, Brazil, 2020. [Google Scholar]
  46. Kasso, M.; Bekele, A. Post-harvest loss and quality deterioration of horticultural crops in Dire Dawa Region, Ethiopia. J. Saudi Soc. Agric. Sci. 2018, 17, 88–96. [Google Scholar] [CrossRef] [Green Version]
  47. Chitarra, M.I.F.; Chitarra, A.B. Pós-Colheita de Frutos e Hortaliças: Fisiologia e Manuseio; Esal/Faepe: Lavras, Brazil, 1990. [Google Scholar]
  48. Li, Z.; Andrews, J.; Wang, Y. Mathematical modelling of mechanical damage to tomato fruits. Postharvest Biol. Technol. 2017, 126, 50–56. [Google Scholar] [CrossRef]
  49. Tuomela, M.; Vikman, M.; Hatakka, A.; Itävaara, M. Biodegradation of lignin in a compost environment: A review. Bioresour. Technol. 2000, 72, 169–183. [Google Scholar] [CrossRef]
  50. Gabhane, J.; William, S.P.M.P.; Bidyadhar, R.; Bhilawe, P.; Anand, D.; Vaidya, A.N.; Wate, S.R. Additives aided composting of green waste: Effects on organic matter degradation, compost maturity, and quality of the finished compost. Bioresour. Technol. 2012, 114, 382–388. [Google Scholar] [CrossRef]
  51. Teixeira, D.L.; de Matos, A.T.; de Castro Melo, E. Resistance to forced airflow through layers of composting organic material. Waste Manag. 2015, 36, 57–62. [Google Scholar] [CrossRef] [PubMed]
  52. Mohee, R.; Boojhawon, A.; Sewhoo, B.; Rungasamy, S.; Somaroo, G.D.; Mudhoo, A. Assessing the potential of coal ash and bagasse ash as inorganic amendments during composting of municipal solid wastes. J. Environ. Manag. 2015, 159, 209–217. [Google Scholar] [CrossRef] [PubMed]
  53. Cole, A.J.; Roberts, D.A.; Garside, A.L.; de Nys, R.; Paul, N.A. Seaweed compost for agricultural crop production. J. Appl. Phycol. 2016, 28, 629–642. [Google Scholar] [CrossRef]
  54. Kumar, R.; Verma, D.; Singh, B.L.; Kumar, U. Composting of sugar-cane waste by-products through treatment with microorganisms and subsequent vermicomposting. Bioresour. Technol. 2010, 101, 6707–6711. [Google Scholar] [CrossRef]
  55. Dahlén, L.; Lagerkvist, A. Methods for household waste composition studies. Waste Manag. 2008, 28, 1100–1112. [Google Scholar] [CrossRef]
Figure 1. Food waste composition (kg wet mass per stall) per street market at level I.
Sustainability 14 07014 g001
Figure 2. Boxplot of the composition of waste from street markets at level I.
Sustainability 14 07014 g002
Figure 3. Composition of the ‘unavoidable food waste’ category for the four street markets analysed.
Sustainability 14 07014 g003
Table 1. Waste category levels.
Fractions Level 0Fractions Level IFractions Level IIDescription
PackagingPackagingPackagingPlastic, wood, straw, paper, and cardboard.
Avoidable food wasteLeaves, flowers, and stemsBroccoli and cauliflower
Cabbage
Othere.g., lettuce, spinach, parsley, coriander, and stems.
Processed productsTubers, bulbs, and rootsProducts that are processed, e.g., peeled and cut, and are often sold in plastic trays.
Fruits and vegetables
Leaves, flowers, and stems
Tubers, bulbs, and rootsPotato
Carrot
Onion
Othere.g., garlic, beet, yam, cassava, turnip, and radish
VegetablesTomatoIt includes botanically classified fruits that are culinarily classified as vegetables, and seeds.
Pumpkin
Bell pepper
Chayote
Othere.g., zucchini, eggplant, cucumber, peppers, okra.
FruitsBanana
Orange
Watermelon
Papaya
Othere.g., avocado, pineapple, peach, kiwi, lemon, mango, melon, strawberry.
MeatMeatBeef, pork, chicken, seafood, etc.
Unavoidable food wasteUnavoidable food wasteCoconut
Sugarcane bagasse
Peels
External wasteExternal wasteExternal wasteFractions that are not produced in the street market, but are collected together.
Table 2. Description of the street markets analysed.
Street MarketNameDay of the WeekDistrictHDINumber of StallsTotal Waste Collected (kg)
SM 1Parque da MoocaTuesdayParque da Mooca0.819474.2
SM 2Sumaré ModernaTuesdayPacaembú0.868731523.7
SM 3BaturitéWednesdayAclimação0.823401033.9
SM 4BelémThursdayBelenzinho0.790391483.5
Table 3. Waste composition of food waste from São Paulo street markets (kg/stall).
Fractions (Level II)SM 1SM 2SM 3SM 4
Packaging
Packaging2.003.073.405.89
Leaves, flowers, and stems
Broccoli and cauliflower0.000.000.030.17
Cabbage0.000.010.000.00
Other0.001.176.807.55
Processed products
Tubers, bulbs, and roots0.000.000.010.00
Fruits and vegetables0.000.000.000.00
Leaves, flowers, and stems0.000.000.000.00
Tubers, bulbs, and roots
Potato0.000.020.020.36
Carrot0.000.000.020.07
Onion0.000.000.040.26
Other0.000.000.000.16
Vegetables
Tomato0.110.050.241.22
Pumpkin0.000.030.000.02
Bell pepper0.000.000.000.00
Chayote0.000.000.000.00
Other0.000.330.100.29
Fruits
Banana0.000.010.400.22
Orange0.000.190.240.53
Watermelon0.000.010.220.00
Papaya0.000.030.090.07
Other0.000.110.582.89
Unavoidable food waste
Coconut6.269.024.594.30
Sugarcane bagasse8.441.401.663.27
Peels0.191.453.327.21
Meat
Meat0.003.411.350.07
External waste
External waste1.560.572.743.49
Table 4. Descriptive statistics of waste generation rates at street markets in São Paulo.
VariableUnitMass Per Stall
Meankg23.7
SE Mean akg3.8
StDev bkg7.6
CoefVar c 32.1
Minimumkg17.0
Q1 dkg17.8
Mediankg21.7
Q3 ekg31.7
a Standard error of the mean. b Standard deviation. c Coefficient of variation. d First quartile. e Third quartile.
Publisher’s Note: MDPI stays neutral with regard to jurisdictional claims in published maps and institutional affiliations.

