
Centrifuge Modeling of Chloride Ions Completely Breakthrough Kaolin Clay Liner


Abstract
:1. Introduction
2. Test Scheme
2.1. Model Materials
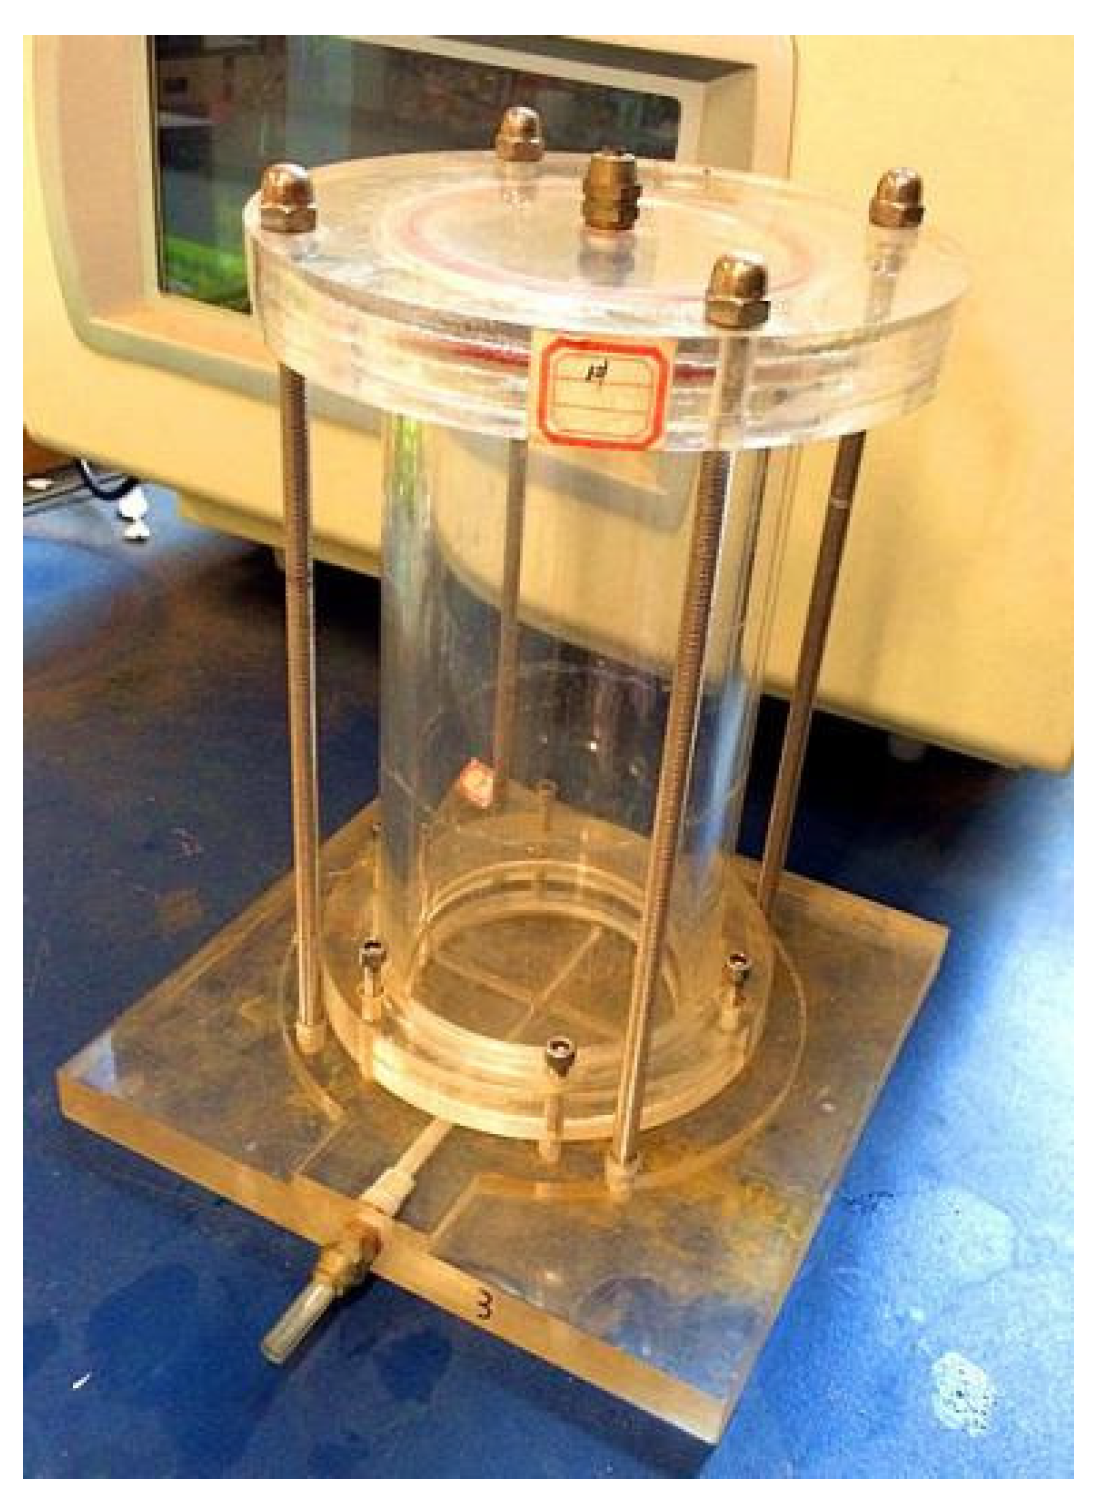
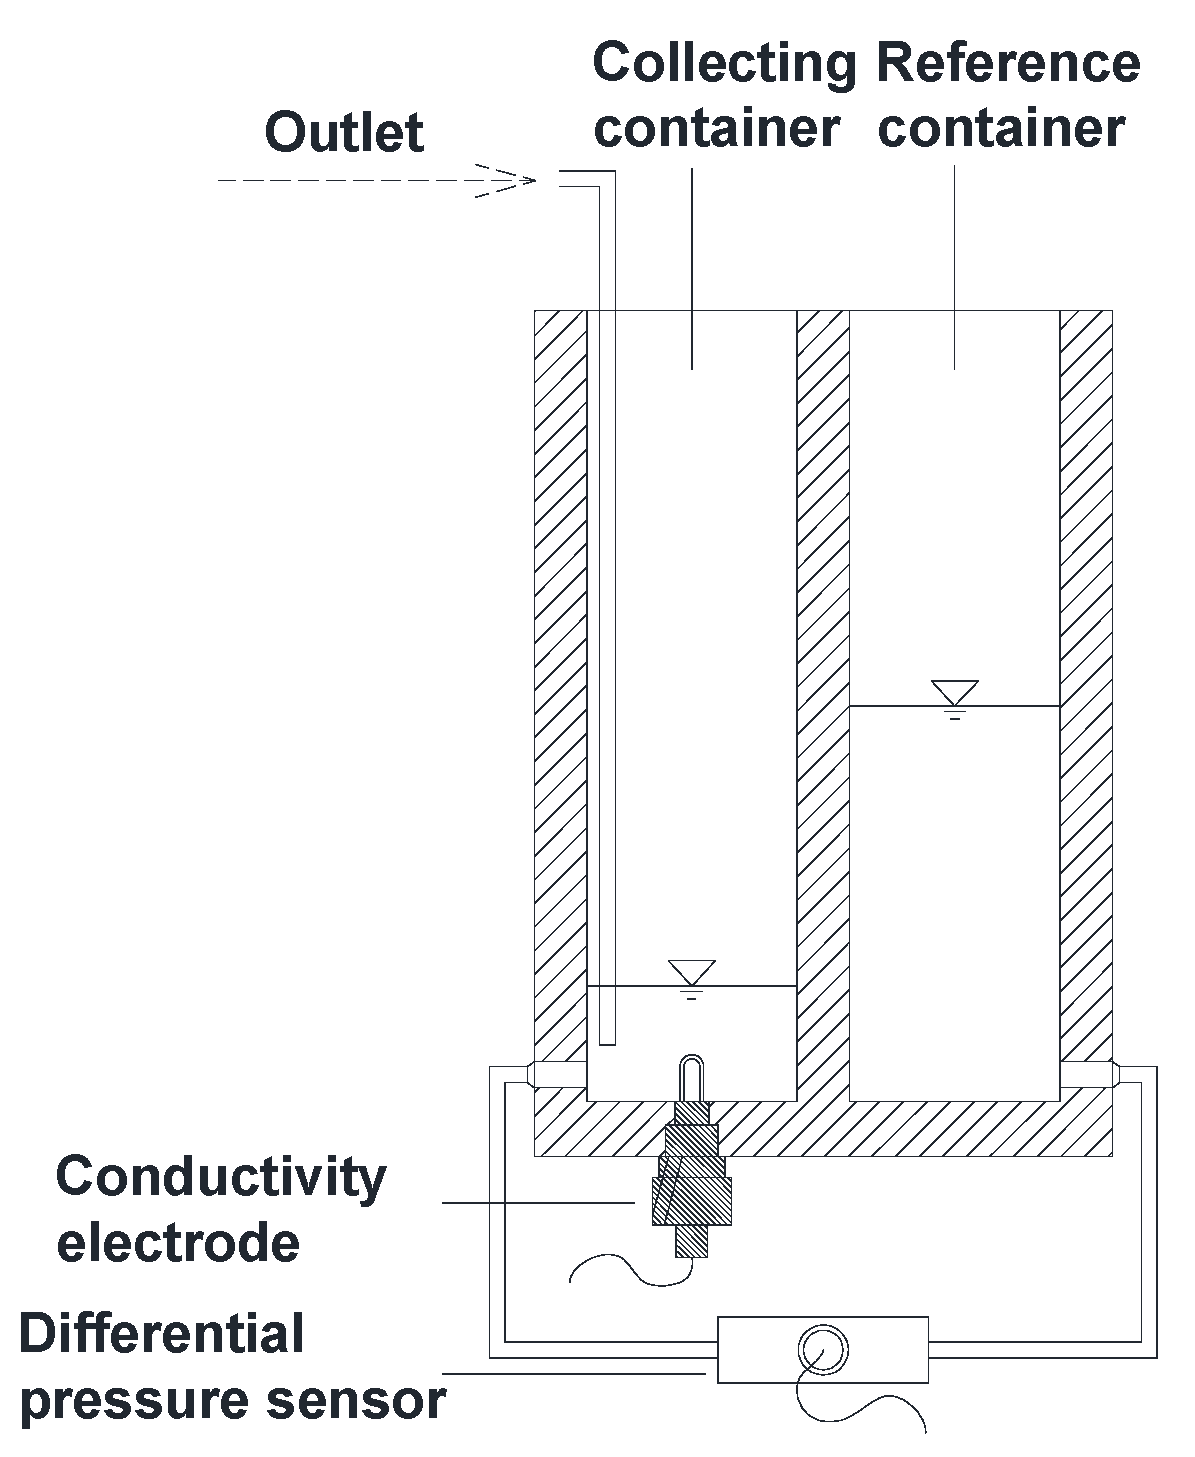
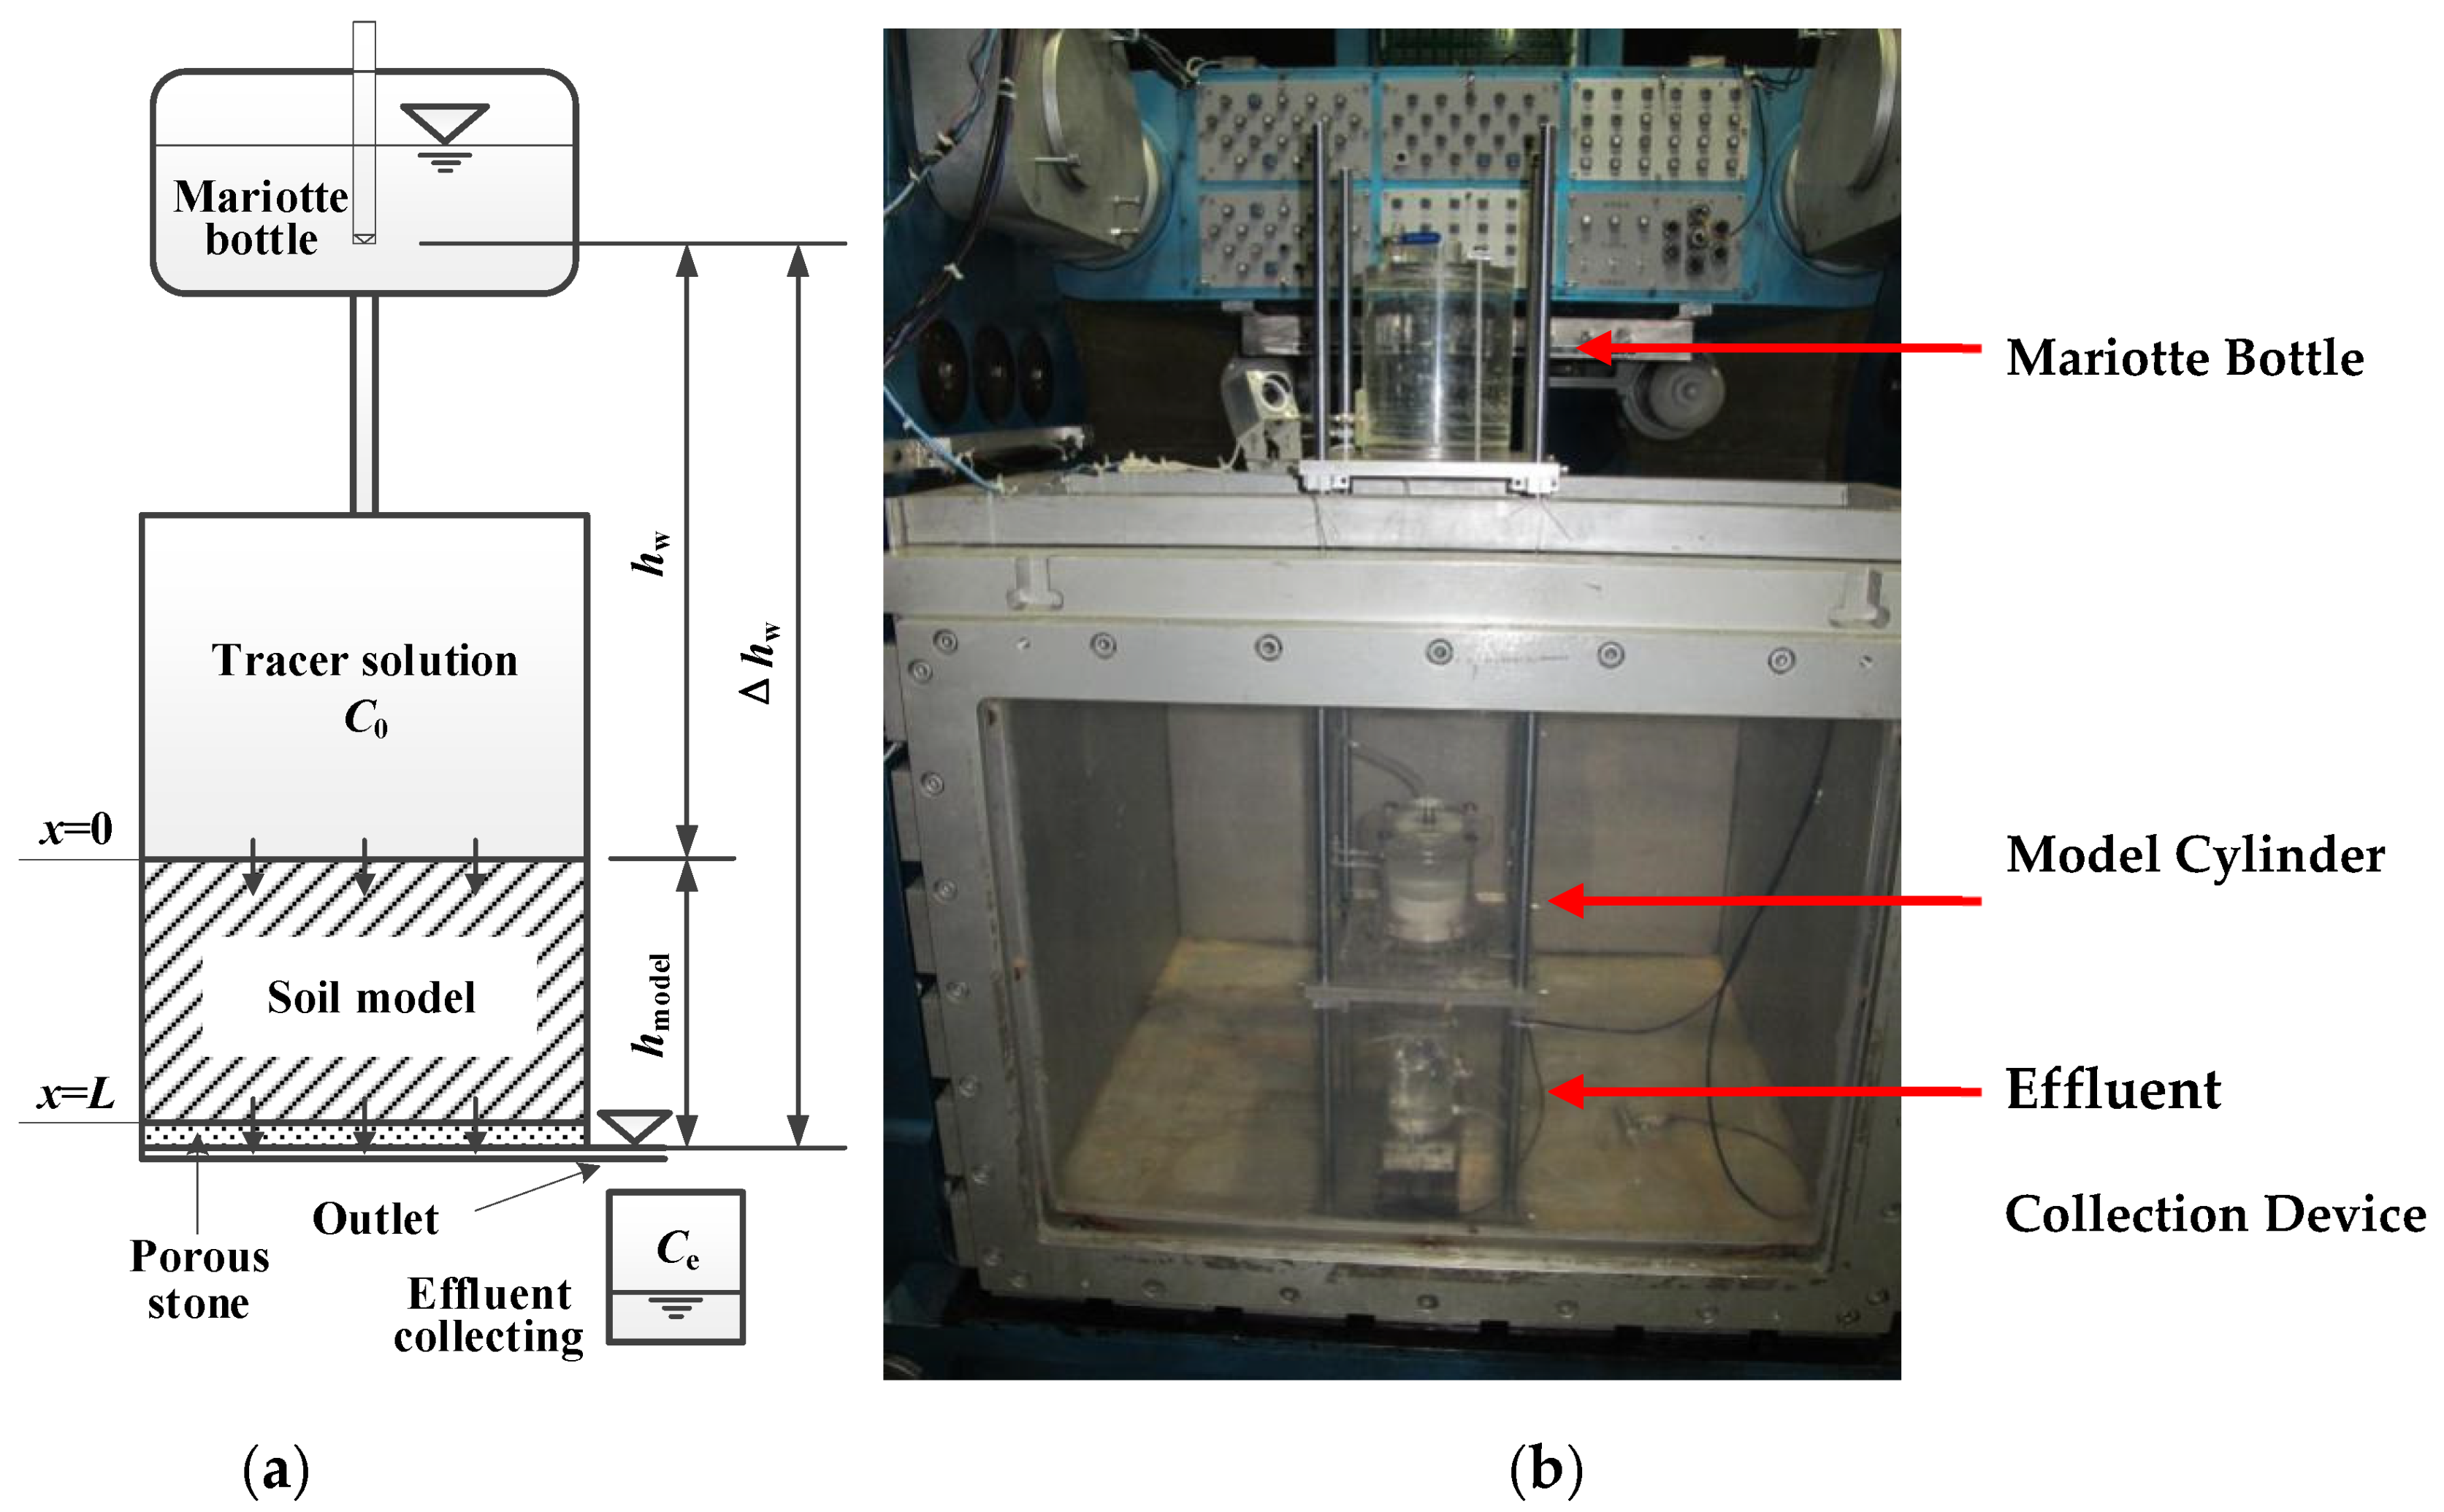
2.2. Test Equipment and Apparatus
2.3. Model Preparation
2.4. Test Process
3. Model Parameters and Result Analyses
3.1. Permeability Coefficient Analysis of Model
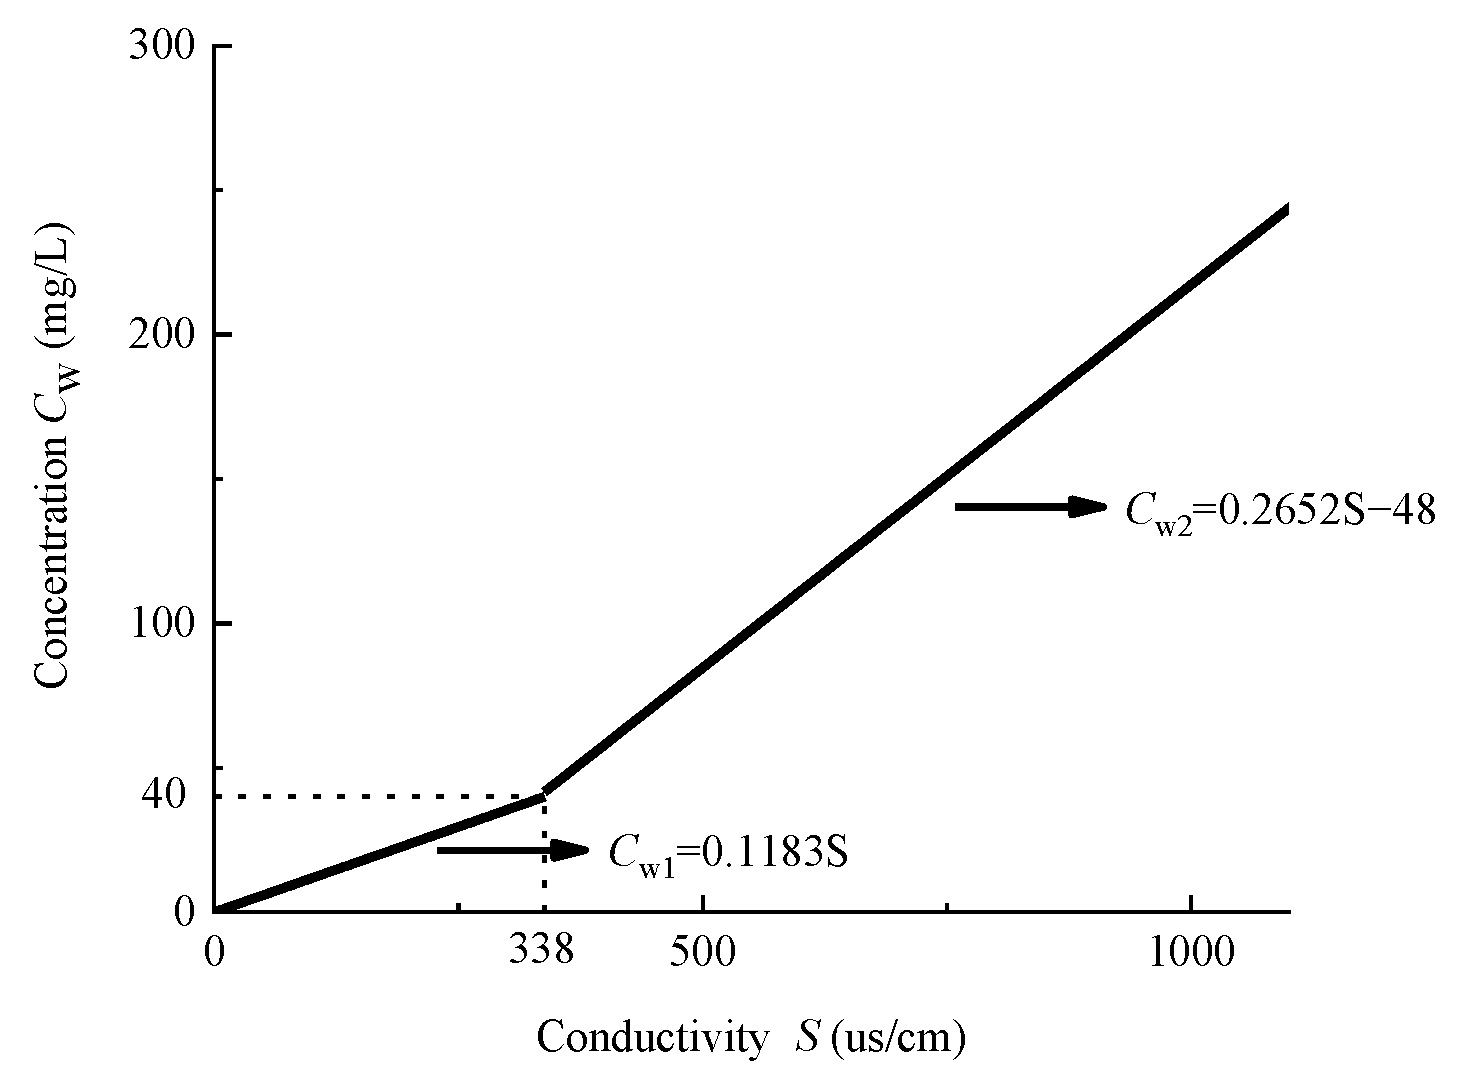
3.2. Analyses of Model Concentration
4. Prediction of Clay Liner Breakthrough Time
5. Conclusions and Prospects
- (1)
- In this paper, a complete set of kaolin model preparation method was provided. The soil sample was homoplasmic and repeatable in this method. Kaolin was mixed with an initial water content of 180% and vacuum pumped during the mixing process for enough time (vacuum level: 0.1 MPa). The saturation of the slurry reached 99% and had uniformity and fluidity after mixed. The slurry was allowed to stand for 1 d to allow self-weight drainage and consolidation to occur naturally. The soil sample could be consolidated step-by-step with a series of pressure levels.
- (2)
- After the centrifugal model test, the permeability coefficient of the model can be obtained according to the reduced water volume of the Mariotte bottle, the effluent volume of the collection cylinder, and the differential pressure sensor. The permeability coefficients are 0.913 × 10⁻⁹ m/s, 0.929 × 10⁻⁹ m/s, and 0.962 × 10⁻⁹ m/s, respectively. The average of three permeability coefficients is 0.935 × 10⁻⁹ m/s, which is slightly smaller than that before the centrifugal test, reduced by 1.6%, and complies with the Chinese technical specifications the 2 m thick compacted clay liner with permeability coefficient of 1.0 × 10⁻⁹ m/s. Therefore, it is feasible to use the real-time monitoring device for seepage flow and effluent concentration to monitor the volume of the effluent and real-time conductivity of the cumulative effluent under hypergravity conditions.
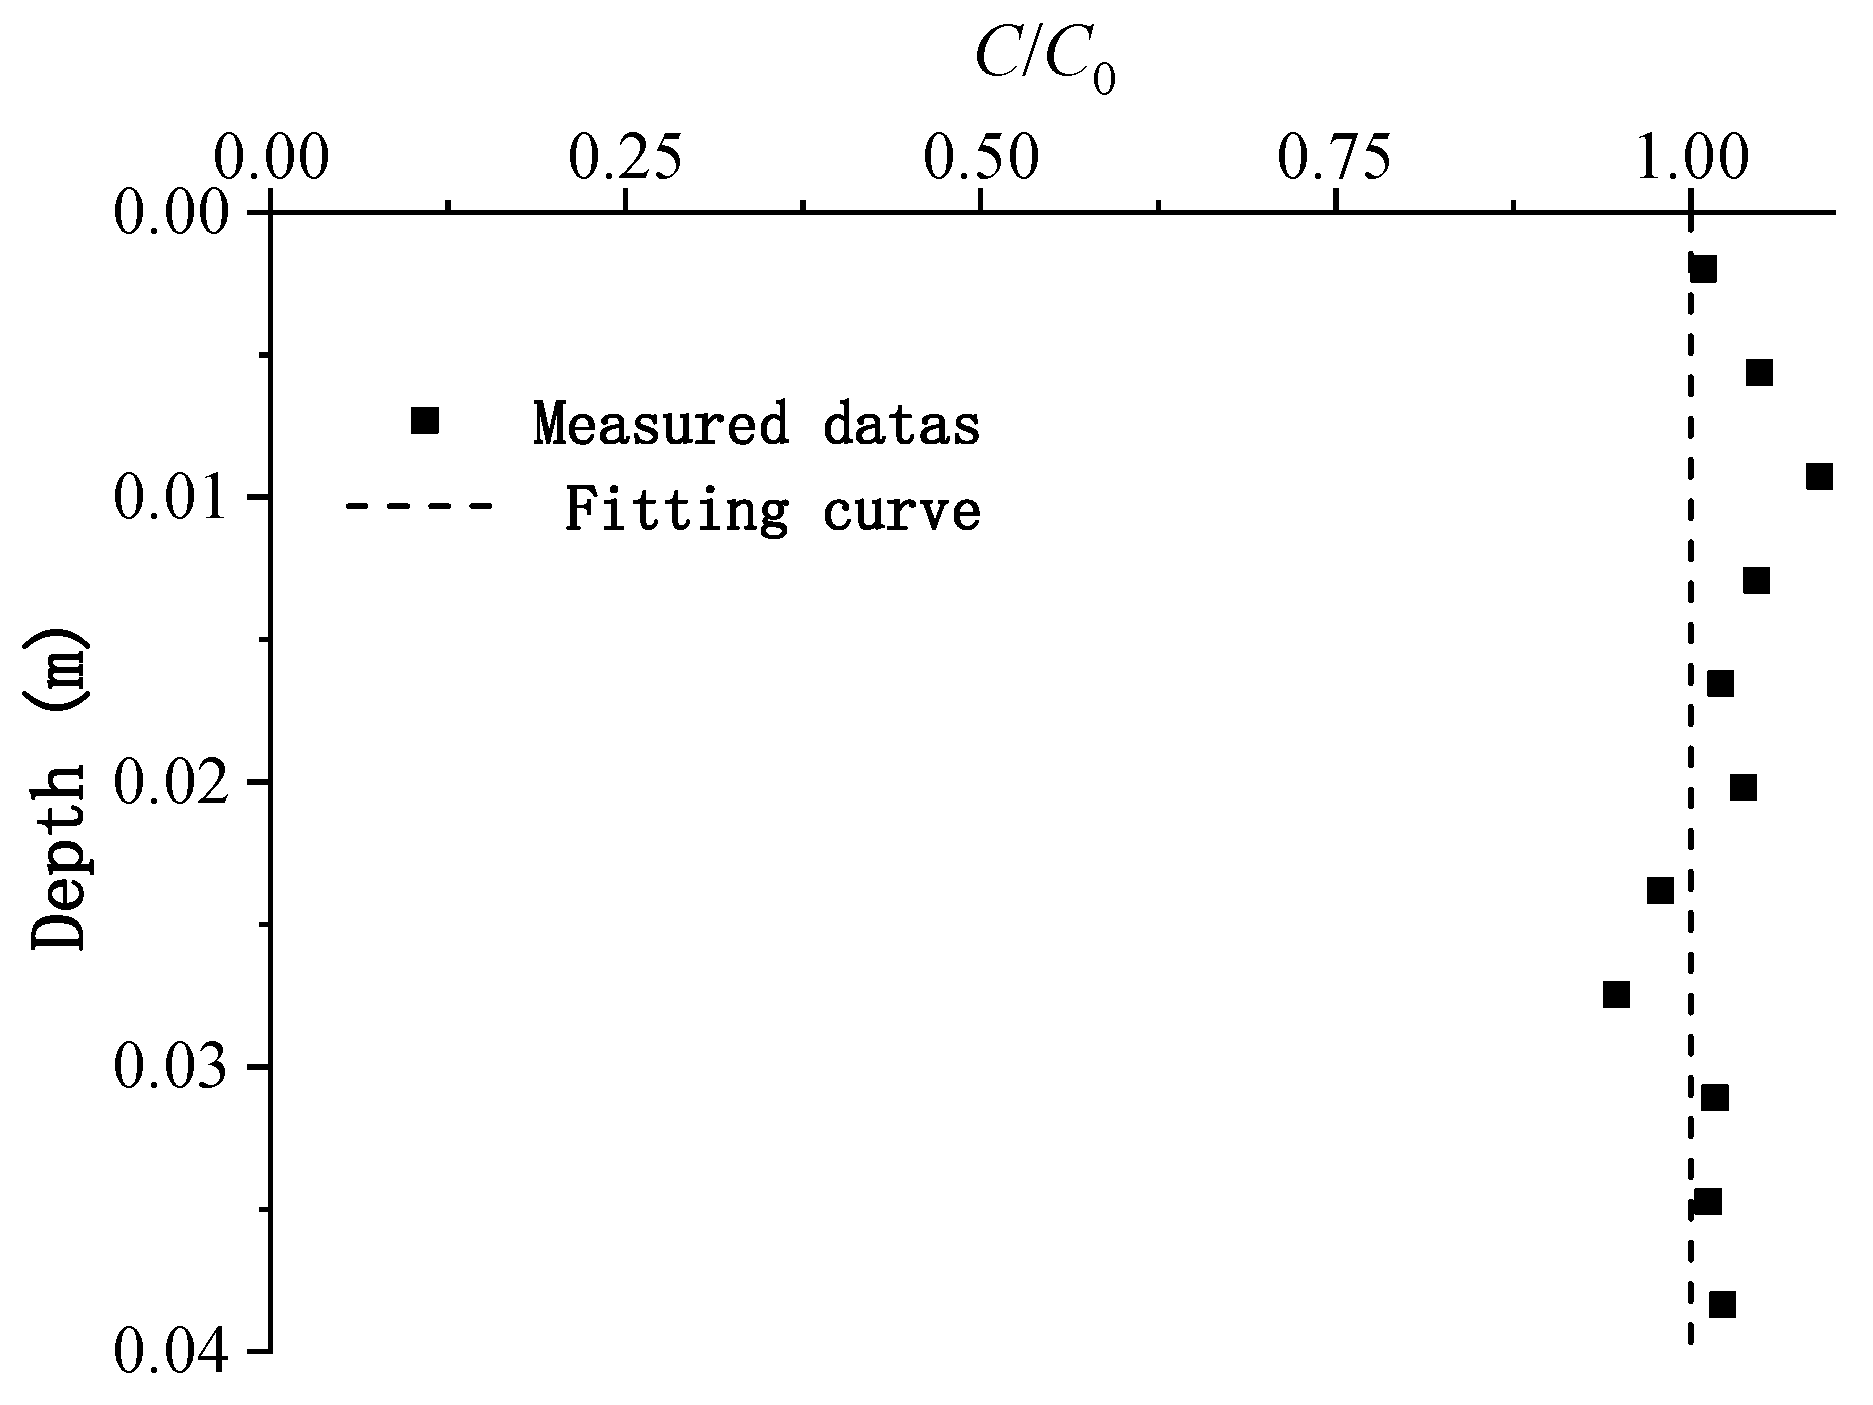
- (3)
- The measured cumulative concentration curve was consistent with the measured profile concentration data, the test data were valid, and the electrode can effectively monitor the cumulative conductivity of the outflow under centrifugal state. According to the values of height, hydraulic head, permeability coefficient, and the velocity of the model, the value of the hydrodynamic dispersion coefficient was fitted, as Dh = 2.065 × 10⁻⁹ m2/s.
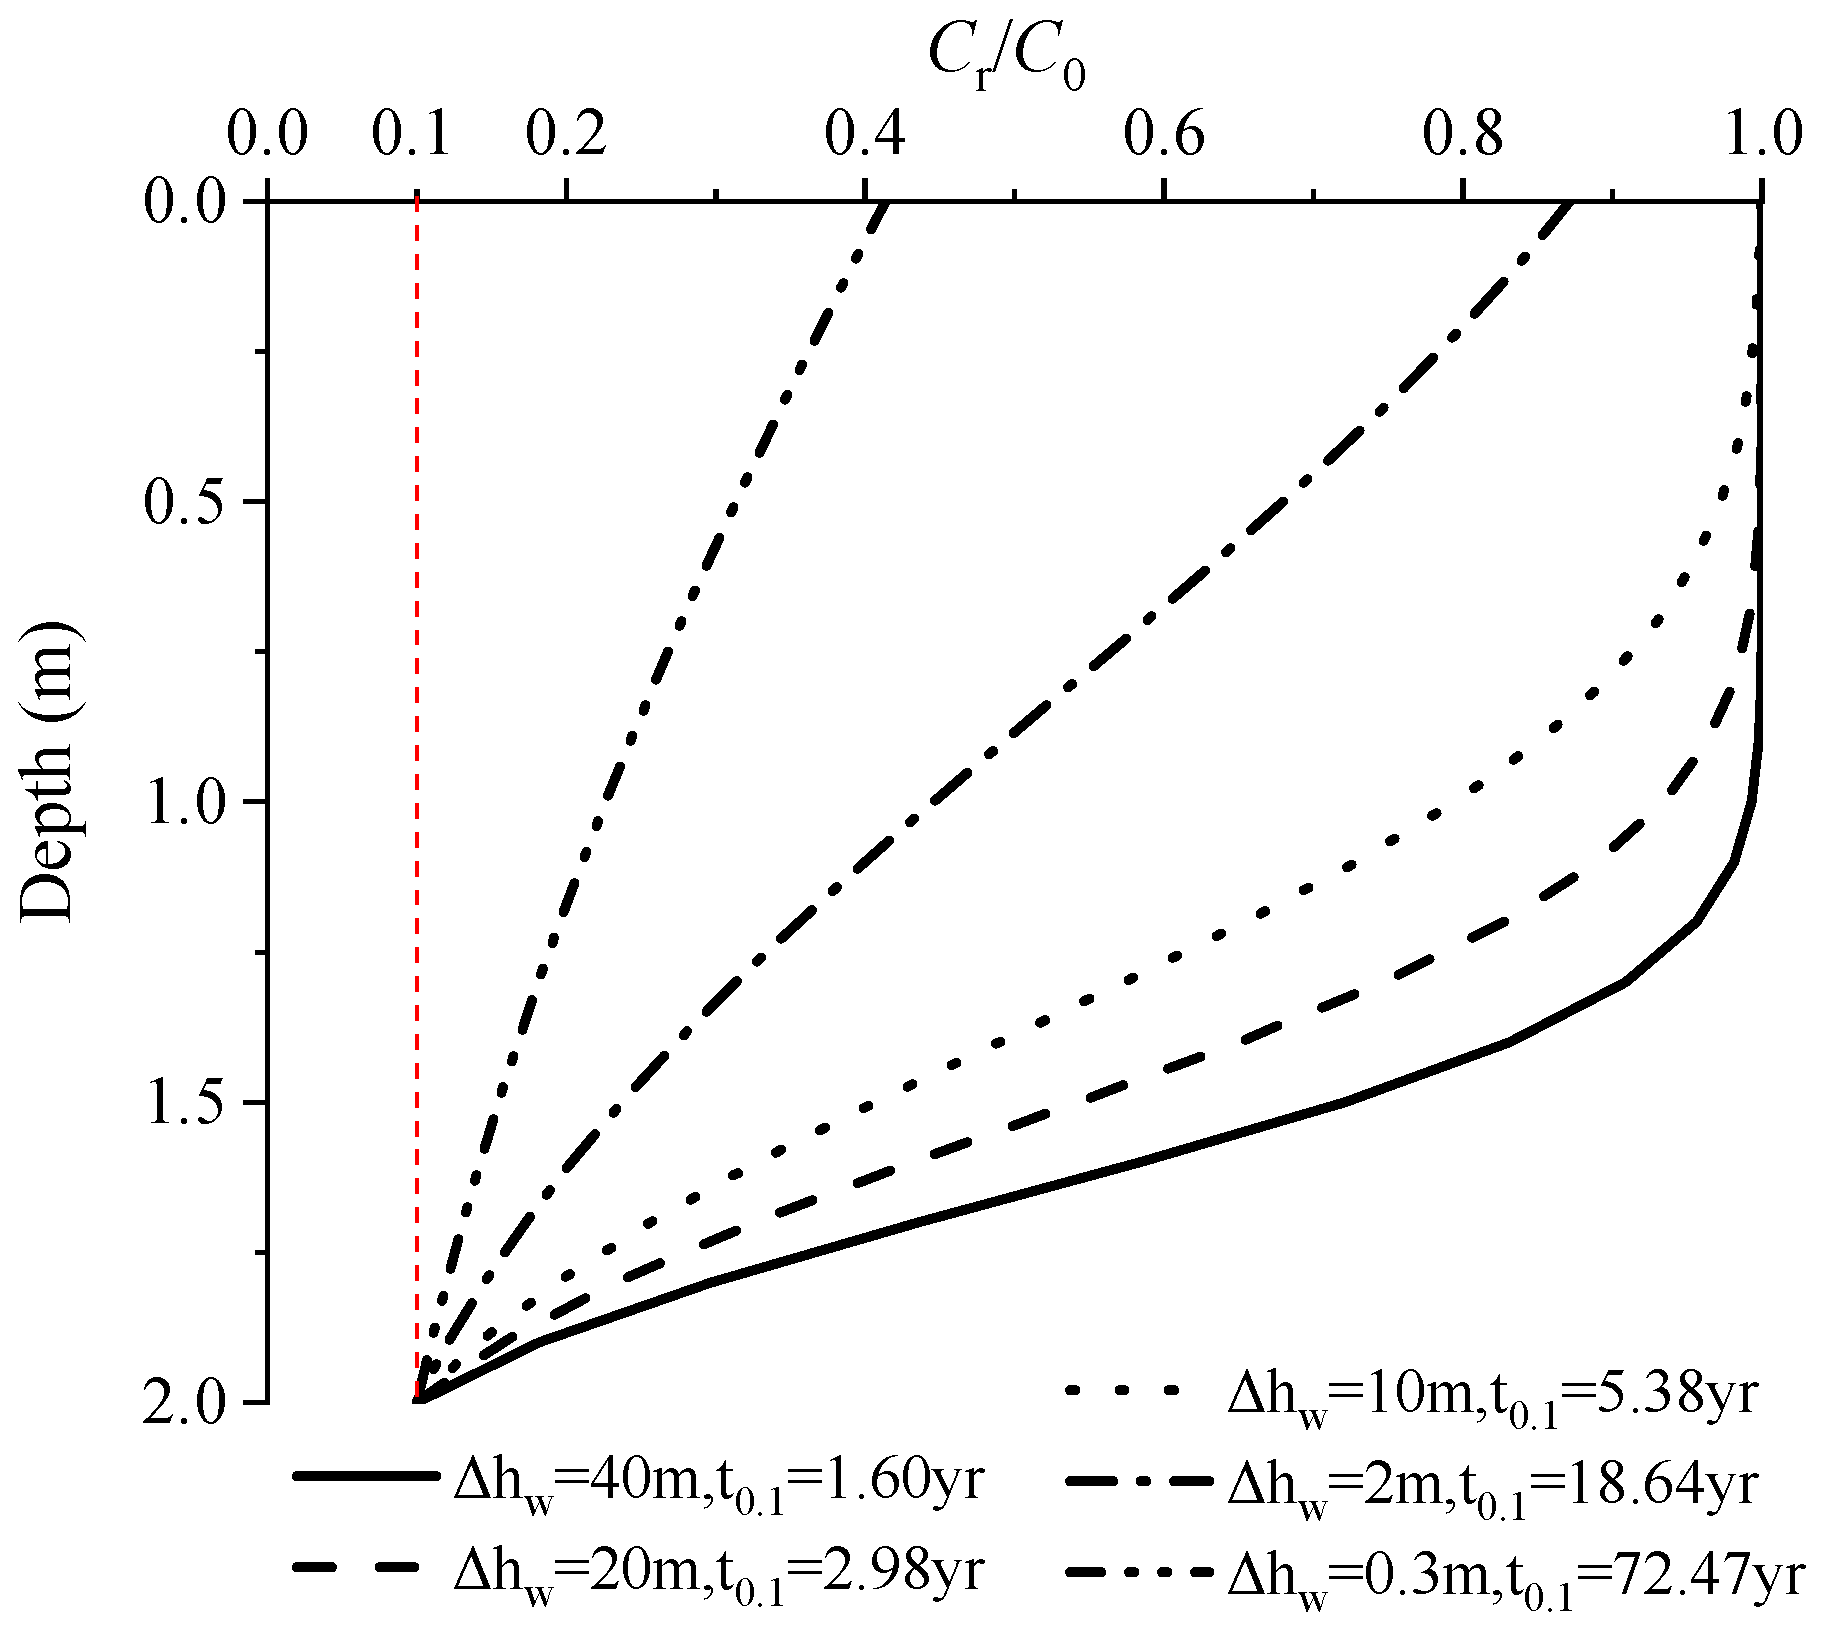
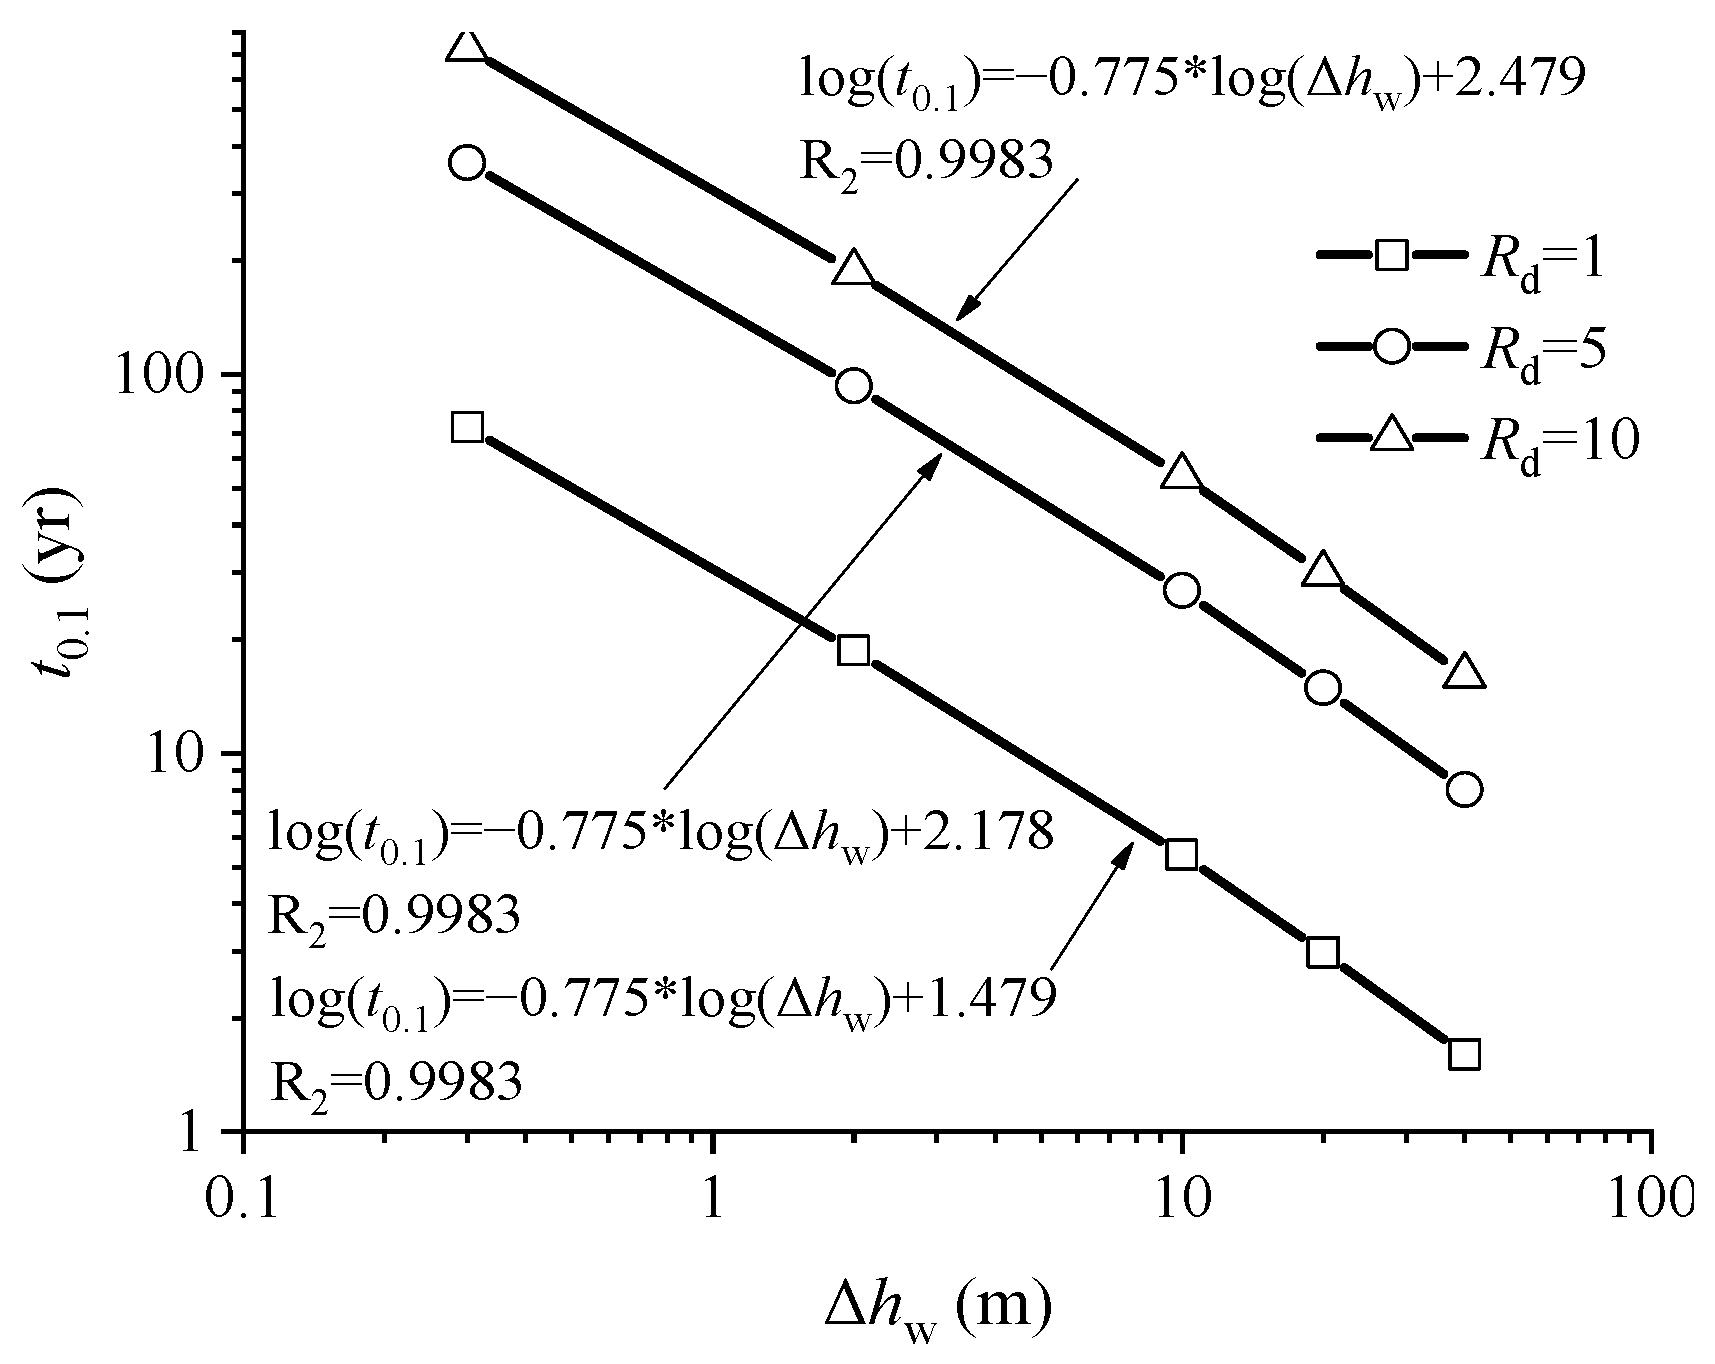
- (4)
- t0.1 decreases as Δhw increases, and an exact linear relationship exists between t0.1 and Rd. The breakthrough time of a conservative pollutant for the 2 m clay liner with a hydraulic conductivity of 1.0 × 10⁻⁹ m/s under Δhw of 40 m was 1.6 years. As for strongly adsorptive pollutants, the breakthrough time t0.1 increase by 9 times when Rd increases from 1 to 10, which indicates that the effect of Rd on the performance of the liner is significant.
- (5)
- This study is applicable to pollutants without absorbability that break through the kaolin clay liner. The adsorption of pollutant by kaolin has not been considered. The accuracy of the experimental results under this condition is unknown.
Author Contributions
Funding
Institutional Review Board Statement
Informed Consent Statement
Data Availability Statement
Conflicts of Interest
References
- Xu, H.; Zhan, L.-T.; Li, H.; Lan, J.-W.; Chen, Y.-M.; Zhou, H.-Y. Time- and stress-dependent model for predicting moisture retention capacity of high-food-waste-content municipal solid waste: Based on experimental evidence. J. Zhejiang Univ. A 2016, 17, 525–540. [Google Scholar] [CrossRef] [Green Version]
- Zhan, L.-T.; Xu, H.; Chen, Y.-M.; Lan, J.-W.; Lin, W.-A.; Xu, X.-B.; He, P.-J. Biochemical, hydrological and mechanical behaviors of high food waste content MSW landfill: Liquid-gas interactions observed from a large-scale experiment. Waste Manag. 2017, 68, 307–318. [Google Scholar] [CrossRef] [PubMed]
- Zhan, L.-T.; Xu, H.; Jiang, X.-M.; Lan, J.-W.; Chen, Y.-M.; Zhang, Z.-Y. Use of electrical resistivity tomography for detecting the distribution of leachate and gas in a large-scale MSW landfill cell. Environ. Sci. Pollut. Res. 2019, 26, 20325–20343. [Google Scholar] [CrossRef]
- Shu, S.; Zhu, W.; Fan, X.; Wu, S.; Li, Y.; Ng, C.W.W. Effect of competitive adsorption on the transport of multiple pollutants through a compacted clay liner. Waste Manag. Res. 2021, 39, 368–373. [Google Scholar] [CrossRef]
- Zheng, C.M.; Bennett, G.D. Applied Contaminant Transport Modeling, 2nd ed.; Higher Education Press: Beijing, China, 2009. [Google Scholar]
- Sharma, H.D.; Reddy, K.R. Geoenvironmental Engineering: Site Remediation, Waste Containment, and Emerging Waste Management Technologies; HarperCollins: New York, NY, USA, 2004; pp. 170–172. [Google Scholar]
- Shackelford, C.D. Critical concepts for column testing. J. Geotech. Eng. 1994, 120, 1804–1828. [Google Scholar] [CrossRef]
- Zeng, X. Similitude for Centrifuge Modelling of Heavy Metal Migration in Clay Barrier and Method for Evaluating Breakthrough Time. Ph.D. Thesis, Zhejiang University, Hangzhou, China, 2015. (In Chinese). [Google Scholar]
- Celorie, J.A.; Vinson, T.S.; Woods, S.L.; Istok, J. Modeling Solute Transport by Centrifugation. J. Environ. Eng. 1989, 115, 513–526. [Google Scholar] [CrossRef]
- Arulanandan, K.; Thompson, P.Y.; Kutter, B.L.; Meegoda, N.J.; Muraleetharan, K.K. Centrifuge Modeling of Transport Processes for Pollutants in Soils. J. Geotech. Eng. 1988, 114, 185–205. [Google Scholar] [CrossRef]
- Hensley, P.J.; Schofield, A.N. Accelerated Physical Modelling of Hazardous-waste Transport. Geotechnique 1991, 41, 447–465. [Google Scholar] [CrossRef]
- Depountis, N.; Harris, C.; Davies, M. An assessment of miniaturised electrical imaging equipment to monitor pollution plume evolution in scaled centrifuge modelling. Eng. Geol. 2001, 60, 83–94. [Google Scholar] [CrossRef]
- Mckinley, J.D.; Price, A.; Lynch, R.J.; Schofield, A.N. Centrifuge modelling of the transport of a pulse of two contaminants. Geotechnique 1998, 48, 421–425. [Google Scholar] [CrossRef]
- Nakajima, H.; Hirooka, A.; Takemura, J.; Marino, M.A. Centrifuge Modeling of One-Dimensional Subsurface Contamination. J. Am. Water Resour. Assoc. 1998, 34, 1415–1425. [Google Scholar] [CrossRef]
- Lo, I.M.C.; Zhang, J.H.; Hu, L.M. Centrifuge Modeling of Cadmium Migration in Saturated and Unsaturated Soils. Soil Sediment Contam. 2005, 14, 417–431. [Google Scholar] [CrossRef]
- Timms, W.A.; Hendry, M.J. Long-Term Reactive Solute Transport in an Aquitard Using a Centrifuge Mode. Groud Water 2008, 46, 616–628. [Google Scholar] [CrossRef] [PubMed]
- Zeng, X.; Wang, H.; Yao, J.; Li, Y. Analysis of Factors for Compacted Clay Liner Performance Considering Isothermal Adsorption. Appl. Sci. 2021, 11, 9735. [Google Scholar] [CrossRef]
- Zhong, X.L.; Zhan, L.T.; Gong, B.; Zeng, X.; Chen, Y.M. Consolidation permeability and adsorption properties of three kinds of typical kaolin clays in china. J. Zhejiang Univ. (Eng. Sci. Ed.) 2014, 48, 1947–1954. [Google Scholar]
- Chen, Y.M.; Han, C.; Ling, D.S.; Kong, L.G.; Zhou, Y.G. Development of geotechnical centrifuge ZJU400 and performance assessment of its shaking table system. Chin. J. Geotech. Eng. 2011, 33, 1887–1894. [Google Scholar]
- Zhan, L.T.; Zeng, X.; Li, Y.C.; Zhong, X.L.; Chen, Y.M. Centrifuge Modeling for Chloridion Breaking Through Kaolin Clay Liner with High Hydraulic Head. J. Yangtze River Sci. Res. 2011, 33, 1887–1894. [Google Scholar]
- Van, G.M.T.; Parker, J.C. Boundary conditions for displacement experiments through short laboratory soil columns. Soil Sci. Soc. Am. J. 1984, 48, 703–708. [Google Scholar]
- Parker, J.C.; Van, G.M.T. Flux-Averaged and Volume-Averaged Concentrations in Continuum Approaches to Solute Transport. Water Resour. Res. 1984, 20, 866–872. [Google Scholar] [CrossRef]
- Zeng, X.; Zhan, L.T.; Chen, Y.M. Applicability of boundary conditions for analytical modelling of advection-dispersion transport in low-permeability clay column tests. Chin. J. Geotech. Eng. 2017, 39, 636–644. [Google Scholar]
- CJJ 113-2007; Technical Code for Liner System of Municipal Soil Waste Landfill. China Building Industry Press: Beijing, China, 2007.
- CJJ176-2012; Technical Code for Geotechnical Engineering of Municipal Soil Waste Sanitary Landfills. China Building Industry Press: Beijing, China, 2012.
- GB 50869-2013; Technical Code for Municipal Soil Waste Sanitary Landfills. China Planning Press: Beijing, China, 2013.
- Zeng, X.; Zhan, L.T.; Zhong, X.L.; Chen, Y.M. Similarity of centrifuge modeling of chloride dispersion in low-permeability clay. J. Zhejiang Univ. A 2016, 50, 241–249. [Google Scholar]
- Zhan, L.T.; Guan, C.; Xie, H.J.; Chen, Y.M. Vertical migration of leachate pollutants in clayey soils beneath an uncontrolled landfill at Huainan, China: A field and theoretical investigation. Sci. Total Environ. 2014, 470, 290–298. [Google Scholar] [CrossRef]
- Xie, Y.; Xie, H.J.; Chen, Y.M.; Lou, Z.H. Comparisons of measurements of contaminant concentration in landfill bottom soils with theoretical solutions. J. Nat. Disasters 2009, 18, 62–69. [Google Scholar]
- Lewis, T.W.; Pivonka, P.; Fityus, S.G.; Smith, D.W. Parametric sensitivity analysis of coupled mechanical consolidation and contaminant transport through clay barriers. Comput. Geotech. 2009, 36, 31–40. [Google Scholar] [CrossRef]
- Shackelford, C.D. Transit-time design of earthen barriers. Eng. Geol. 1990, 29, 79–94. [Google Scholar] [CrossRef]
- Malusis, M.A.; Maneval, J.E.; Barben, E.J.; Shackelford, C.D.; Daniels, E.R. Influence of adsorption on phenol transport through soil–bentonite vertical barriers amended with activated carbon. J. Contam. Hydrol. 2010, 116, 58–72. [Google Scholar] [CrossRef]
- Zeng, X.; Liu, X.; Li, Y.H. The Breakthrough Time Analyses of Lead Ions in CCL considering Different Adsorption Isotherms. Adv. Civ. Eng. 2020, 2020, 8861866. [Google Scholar] [CrossRef]
- Zhang, J.; Loirene, M.C.; Li, H.U. Centrifuge modeling of moisture and contaminant migration in unsaturated soils. Chin. J. Geotech. Eng. 2002, 24, 622–625. [Google Scholar]


| Physical Quantity | Unit | Similarity Scaling (Model: Prototype) |
|---|---|---|
| Acceleration of gravity | m/s2 | N |
| Size | m | 1/N |
| Stress | kPa | 1 |
| Density | kg/m3 | 1 |
| Porosity | 1 | 1 |
| Viscosity coefficient | Pa·s | 1 |
| Permeability coefficient | m/s | N |
| Concentration | mg/L | 1 |
| Time (advection and molecular diffusion) | s | 1/N2 |
| Velocity | m/s | N |
| Molecular diffusion coefficient | m2/s | 1 |
| Soil Type | Specific Gravity Gs | Clay Content (%) | Liquid Limit wL(%) | Plasticity Index Ip(%) | Mean Particle Size d (mm) |
|---|---|---|---|---|---|
| Jiangsu kaolin clay | 2.61 | 67.8 | 67.1 | 34.6 | 0.003 |
| Different Method | Before the Centrifugal Test | During the Centrifugal Test | ||
|---|---|---|---|---|
| Leaching | From Mariotte Bottle | From Collection Cylinder | From Differential Pressure Sensor | |
| k20 (× 10−9 m/s) | 0.950 | 0.913 | 0.929 | 0.962 |
| H (cm) | Void Ratio e | Moisture Content w | Δhw (cm) | k20 (m/s) | vs (m/s) | Dh (m2/s) | |
|---|---|---|---|---|---|---|---|
| M1 | 4.08 | 1.614 | 61.8% | 80 | 9.35 × 10⁻¹⁰ | 1.45 × 10⁻⁶ | 20.65 × 10⁻¹⁰ |
Publisher’s Note: MDPI stays neutral with regard to jurisdictional claims in published maps and institutional affiliations. |
© 2022 by the authors. Licensee MDPI, Basel, Switzerland. This article is an open access article distributed under the terms and conditions of the Creative Commons Attribution (CC BY) license (https://creativecommons.org/licenses/by/4.0/).
Share and Cite
Zeng, X.; Su, J.; Wang, H.; Gao, T. Centrifuge Modeling of Chloride Ions Completely Breakthrough Kaolin Clay Liner. Sustainability 2022, 14, 6976. https://doi.org/10.3390/su14126976
Zeng X, Su J, Wang H, Gao T. Centrifuge Modeling of Chloride Ions Completely Breakthrough Kaolin Clay Liner. Sustainability. 2022; 14(12):6976. https://doi.org/10.3390/su14126976
Chicago/Turabian StyleZeng, Xing, Jia Su, Hengyu Wang, and Tong Gao. 2022. "Centrifuge Modeling of Chloride Ions Completely Breakthrough Kaolin Clay Liner" Sustainability 14, no. 12: 6976. https://doi.org/10.3390/su14126976
APA StyleZeng, X., Su, J., Wang, H., & Gao, T. (2022). Centrifuge Modeling of Chloride Ions Completely Breakthrough Kaolin Clay Liner. Sustainability, 14(12), 6976. https://doi.org/10.3390/su14126976