Article

Spatio-Temporal Dynamic and Structural Characteristics of Land Use/Cover Change Based on a Complex Network: A Case Study of the Middle Reaches of Yangtze River Urban Agglomeration

1
School of Tourism, Hunan Normal University, Changsha 410081, China
2
School of Geographic Science, Nanjing Normal University, Nanjing 210023, China
3
School of Business, Hunan University of Technology, Zhuzhou 412007, China
*
Author to whom correspondence should be addressed.
Sustainability 2022, 14(11), 6941; https://doi.org/10.3390/su14116941
Submission received: 30 March 2022 / Revised: 16 May 2022 / Accepted: 3 June 2022 / Published: 6 June 2022

Abstract

:
Due to the rapid urbanization and industrialization, urban agglomeration has become the area with the most drastic and concentrated land use change. The research on the evolution law and structural characteristics of urban agglomeration land use system is of great significance for the sustainable development. Taking the middle reaches of the Yangtze River urban agglomeration (MRYRUA) of China as the study area, we analyzed the phasic changes from 1980 to 2018 in land use/cover in the MRYRUA as well as the spatial differences between the three core regions. Furthermore, the transfer matrix of land use/cover change (LUCC) was converted to network, with land use types as nodes and conversion relationships between different land types as network connecting lines. Complex network indexes such as centrality, diffusion, and dominant flow were applied to identify the major changes in land use types, key change paths, and transformation patterns. The results show that: (1) in the past 40 years, the building land area in the MRYRUA has increased significantly, while the area of crop land and forest has, and still is, decreasing at an accelerated rate; (2) in terms of the scale, structure, and spatial distribution of land use transfer, there are distinct differences among the three core regions. The Wuhan metropolitan area has the largest intensity of land use transfer and the most drastic structural adjustment; (3) in all four periods, the land use transition network, crop land, and water bodies are the key land use types. Over time, the influence of building land and forest in the land use transition network has increased; and (4) the first transfer direction of each land use type was stable during different periods, such as the transfer of crop land to water bodies and building land, the transfer of water bodies to crop land, and the mutual transformations among crop land and forest, indicating a stable transfer pattern in the MRYRUA.

1. Introduction

With the emergence of global problems, such as global warming, environmental deterioration, and resource shortages, land use/cover change (LUCC) research has gradually become an important topic in global environmental change research. The rational use of land resources, scientific understanding of land use/cover change mechanisms and impacts, and the construction of sustainable urban development strategies and management policies require prioritization [1,2,3]. In past 40 years, China has experienced extensive development and high-speed urbanization, leading to remarkable achievements in economic development. However, rapid urbanization and industrialization have also intensified land use change, leading to the disorderly expansion of urban space, occupation of crop lands, and severe ecological and environmental problems [4,5,6]. To solve this problem, strategy of “high-quality development of urbanization” has been proposed [7,8]. The high-quality development of urbanization refers to the promotion of urbanization with harmony between people and land, energy conservation and efficiency, environmental protection and low carbon, and wisdom and innovation. In the context of high-quality urbanization, the scientific examination of systematic processes and general laws of land use change has become necessary for sustainable land development and has received attention from both the academic and governmental sectors.
After decades of development, a relatively complete research methodology and theoretical system for LUCC research has been formed, and scholars have obtained a large number of research results on the land use change [9], such as driving mechanisms [10], trend predictions and simulations [11], and ecological and environmental effects [12,13]. Studying the land use change provides a foundation for the scientific understanding of the patterns, mechanisms, and effects underlying the process, including quantitative structure, spatial pattern, intensity of change, and process simulation [14,15,16,17]. Scholars usually obtain land use/cover information through means such as remote sensing detection, ground surveys, positioning observation, and literature compilation, using indices such as land use intensity, land use dynamics, and land use degree to reveal the characteristics of land use change in a specific region/area [18,19,20,21]. In addition, spatial analysis and process simulation of land use change at different scales are hot spots in land use process research [22,23,24]. Methods from multiple disciplines have been adopted in relevant studies, such as land use transition models, Dyna-CLUE models, CA-Markov models, and geospatial techniques, which help to capture the spatial and structural characteristics as well as evolutionary trends of land use change at different scales [25,26,27,28]. However, all of these traditional indicators mainly focused on the direct quantitative relationship in land use transition, and there is a lack of research on the dynamic and complex interactive process of land use transition [29,30].
Complex network analysis provides different perspectives and scientific tools for analyzing the structure of land use [31,32,33]. Its characterization of network topology and dynamic behavior provides effective tools that facilitate the analysis of the roles of land use type and the relationship between individual land types’ behaviors [34]. Complex network analysis has been extensively used in many empirical studies in social and economic fields, such as industrial cluster networks, transportation networks, social relationship networks, and regional innovation networks [35,36,37,38]. In LUCC studies, complex network analysis has been employed to study the structural characteristics of land use change in river basins, coastal wetlands, opencast coal mine areas, and mountainous areas [39,40,41,42]. Network metrics such as node degree, node betweenness, and average shortest path have been applied to identify key land use types and evaluate the stability of land use systems from an overall holistic perspective in several case sites, including the Modern Yellow River Delta, Pingshuo opencast coal mine, poverty-stricken mountainous counties in Hubei Province, and coastal wetlands in Jiangsu Province.
Urban agglomeration is the most concentrated and violent area of land use change. The urban agglomeration in the middle reaches of the Yangtze River (MRYRUA) is the most extensive urban agglomerations in China and has experienced rapid development in recent years. A large amount of policy support, capital investment and infrastructure construction has led to drastic changes to land use systems. Due to the key location (middle reaches of the golden waterway of the Yangtze River) of MRYRUA, its urbanization process should not only consider the rapid economic development, but also the ecological protection and restoration. Therefore, the whole land use change process should be systematically studied to understand the evolution and driving force of the urban agglomeration system, which can effectively guide the high-quality development of urbanization and ecological protection in this area. The objectives of this study were: to analyze the dynamic land use change process brought about by rapid urbanization in the MRYRUA; to identify the key nodes, dominant flows, and the underlying patterns of regional land use change using a complex network approach; and to discuss the mechanisms behind the structural characteristics of the land use system and propose policy recommendations for the management and optimization of land use.

2. Materials and Methods
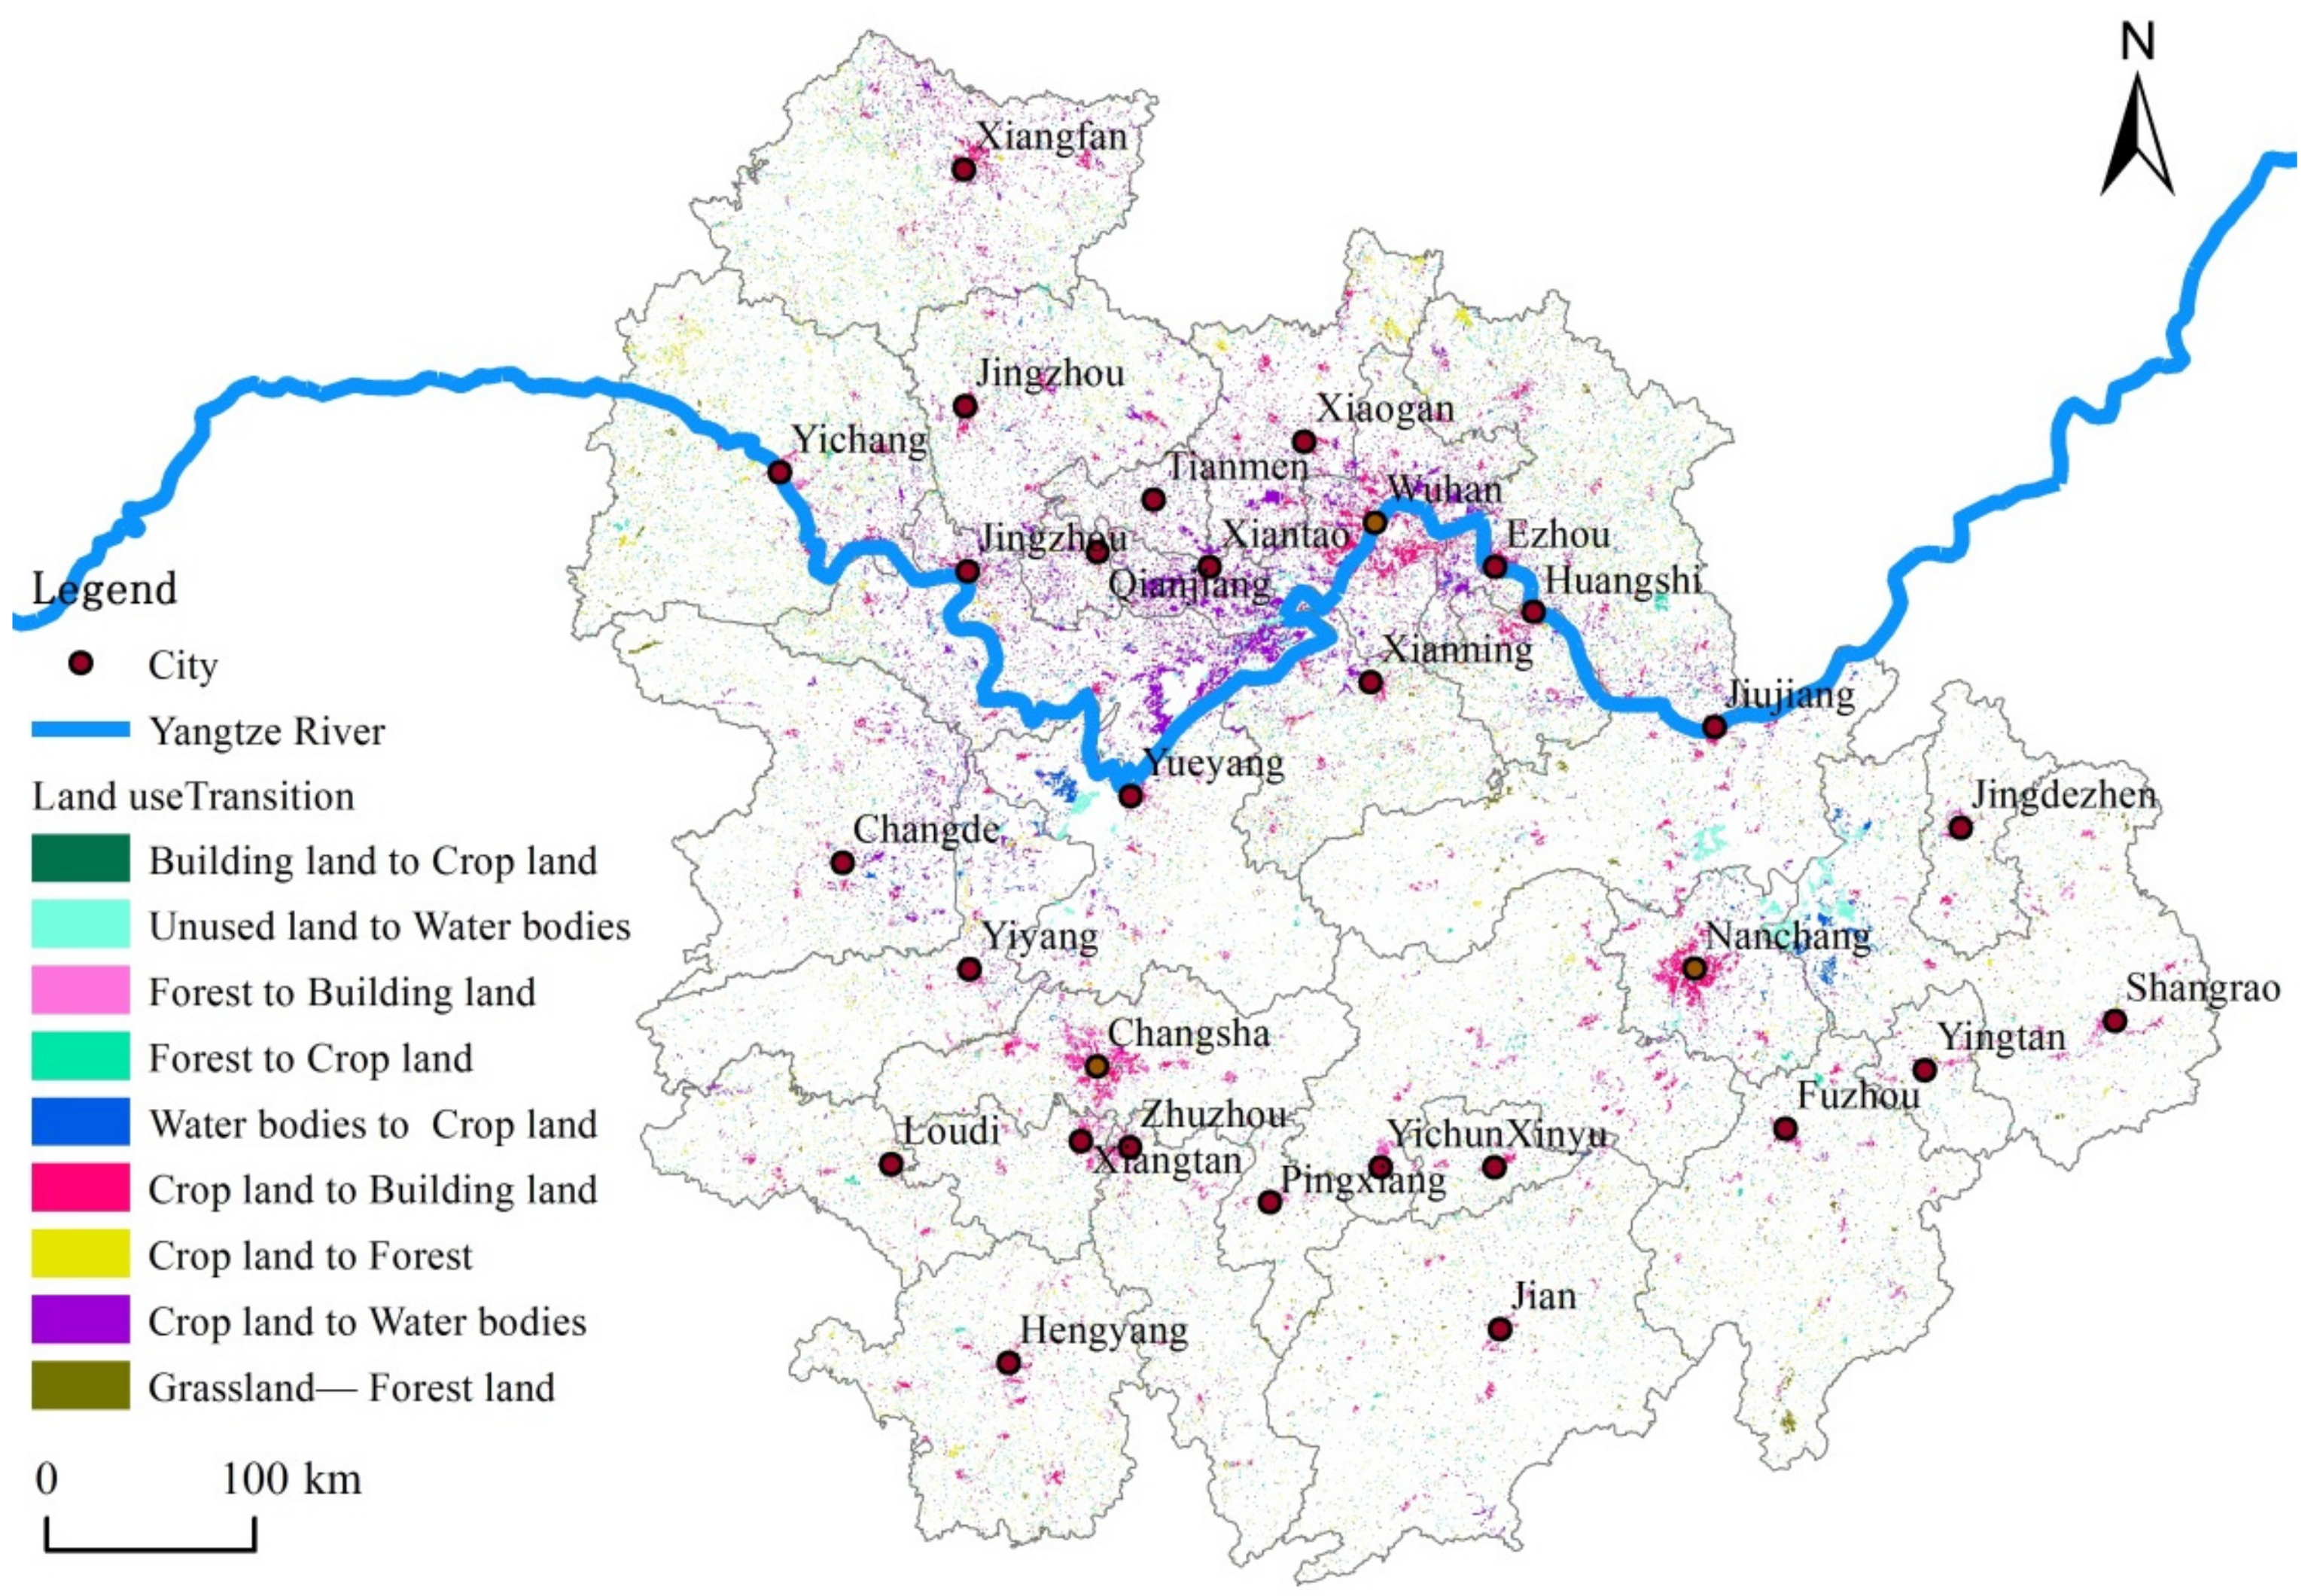
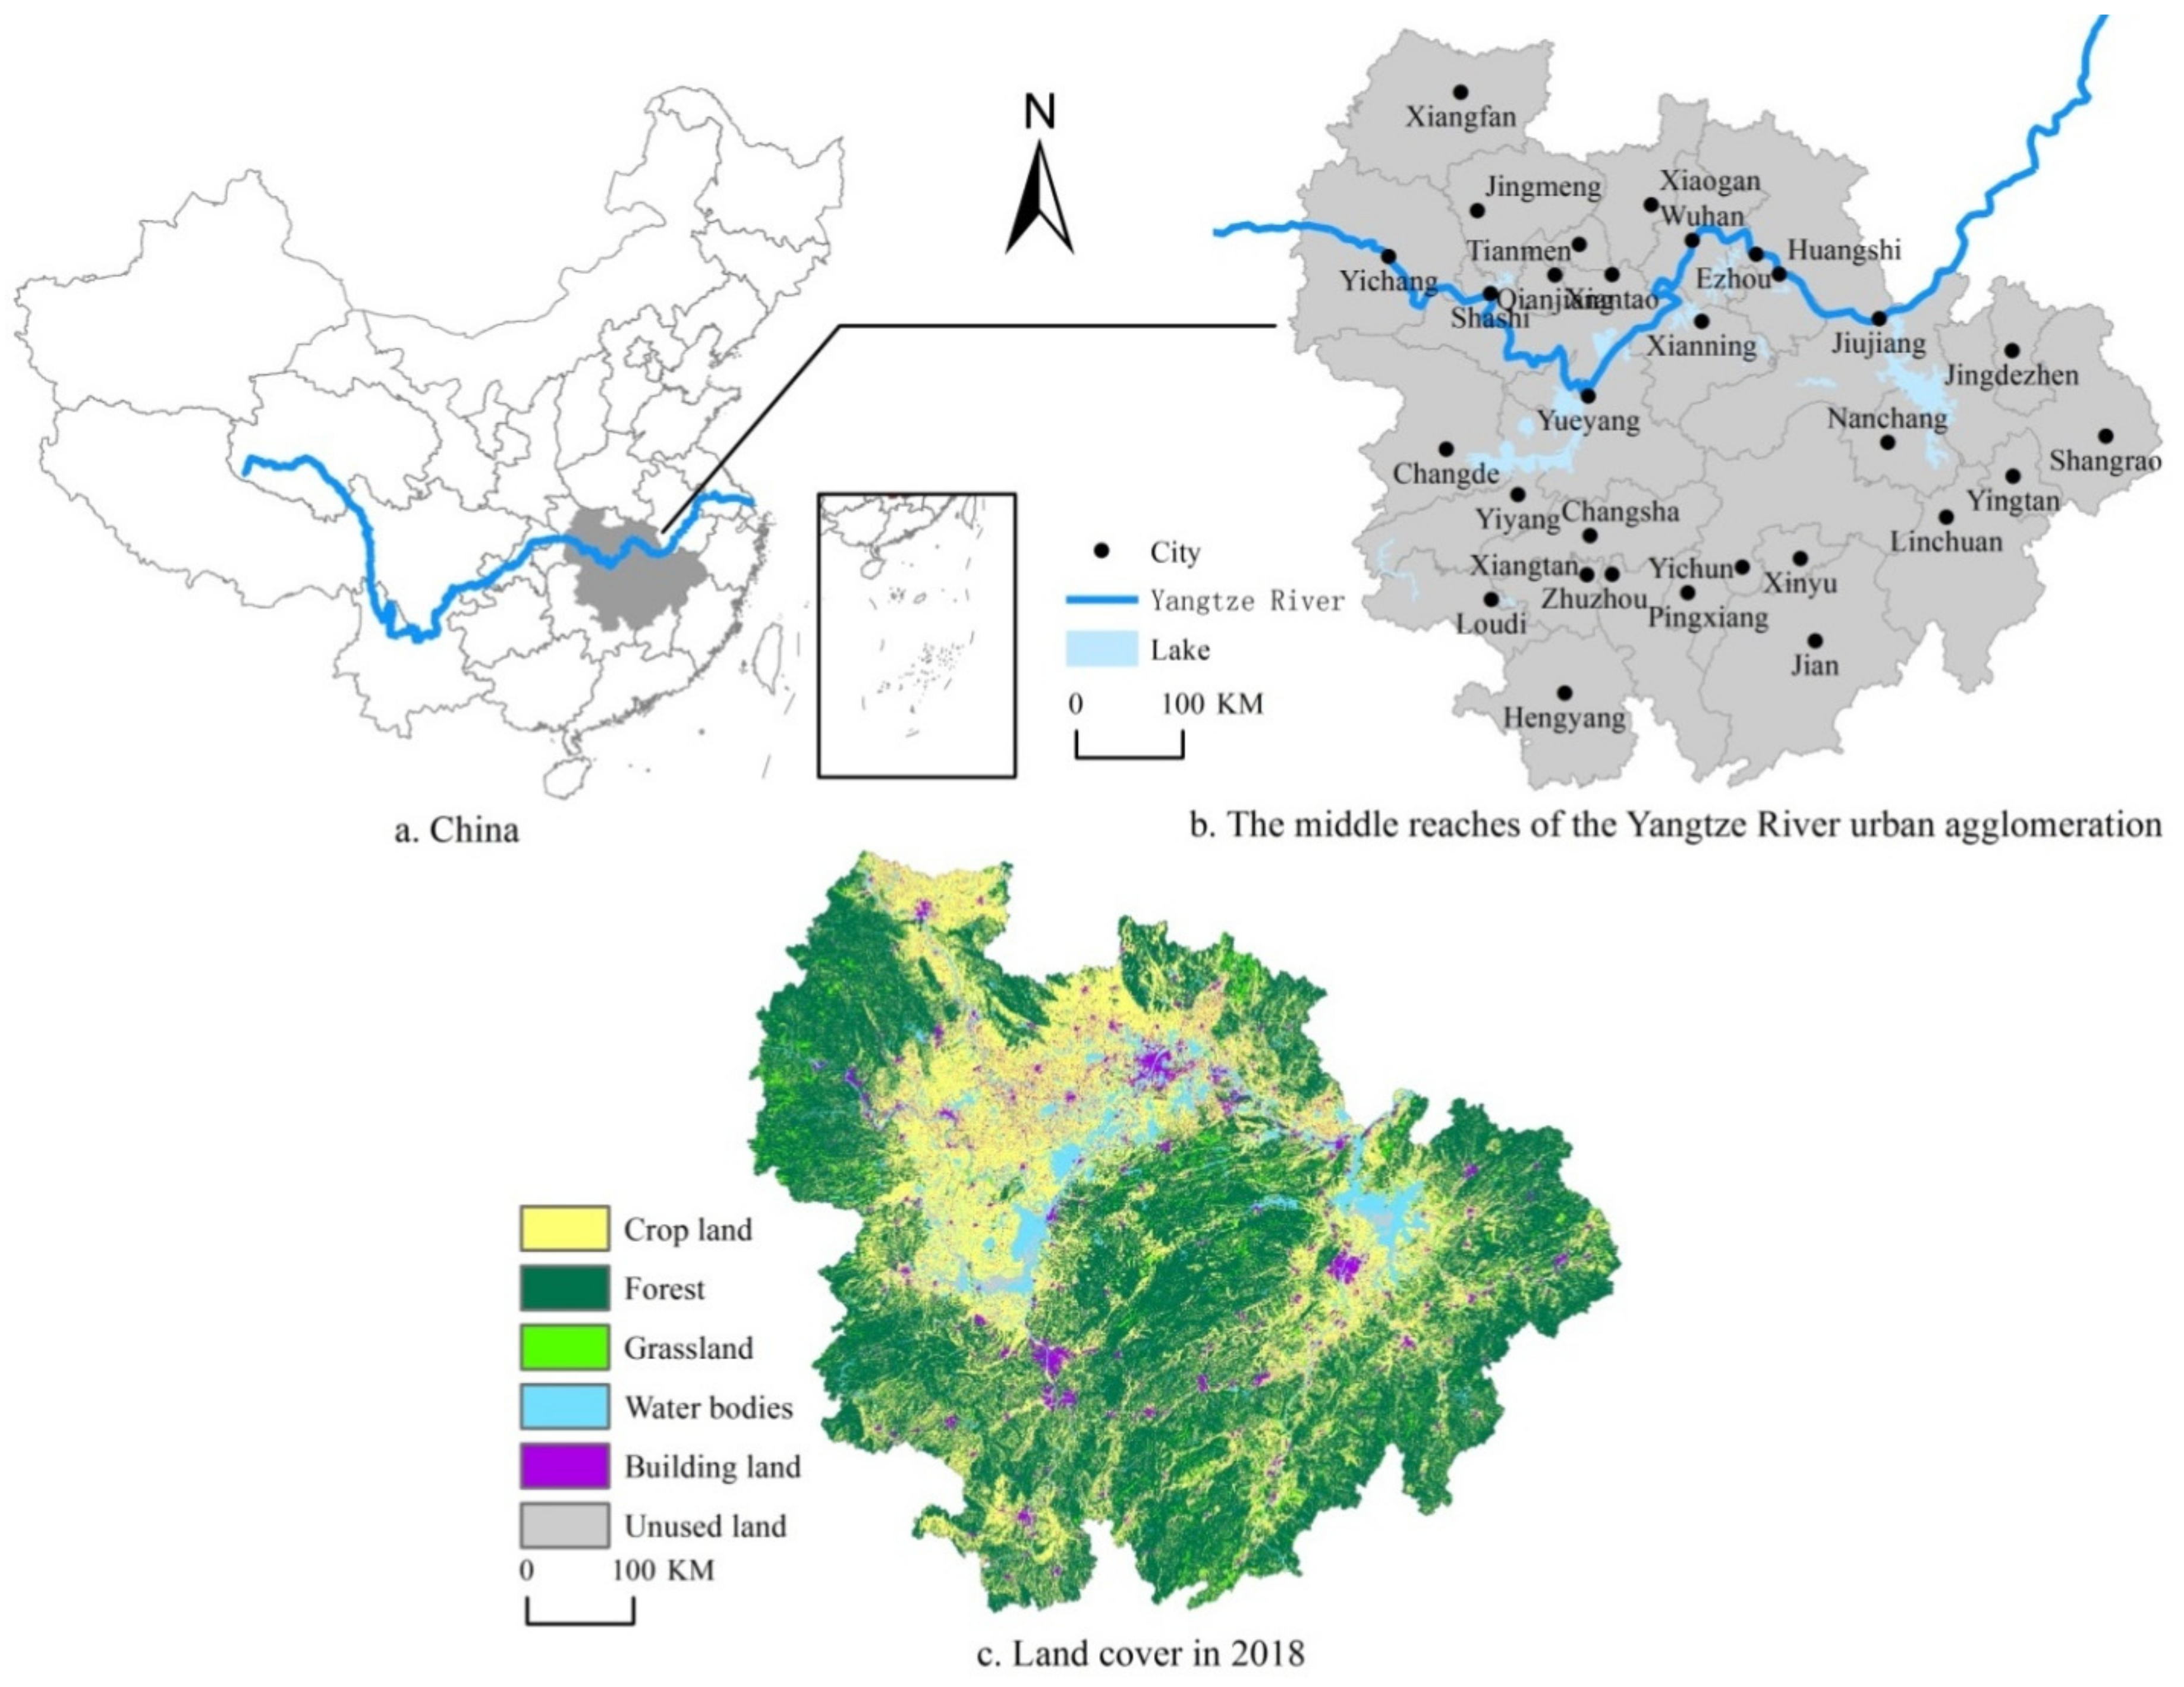
2.1. Study Area

The middle reaches of the Yangtze River urban agglomeration (MRYRUA) are located in the Hubei, Hunan, and Jiangxi provinces in central China. In addition to being an important part of the Yangtze River Economic Belt, this region is also a key area for implementing the “strategy for the Rise of Central China” and promoting “the new urbanization strategy” (Figure 1). The MRYRUA comprises three core regions (Wuhan Metropolitan Area, Ring of Chang-Zhu-Tan urban agglomeration, and urban agglomeration around Poyang Lake), 28 prefecture-level cities, and three county-level cities. The total area of the 31 administrative units is approximately 317,000 km2. In 2020, the MRYRUA had a total population of 125 million and a regional GDP of 7.90 trillion RMB, accounting for 9.6% of the national economic output with 3.4% of the national land area and 9.0% of the population.

2.2. Data Source

Land use/cover data for the MRYRUA from 1980, 1990, 2000, 2010, and 2018 were obtained from the Data Center for Resource and Environment Science of the Chinese Academy of Sciences (RESDC) arranged as 30 m × 30 m grid data (https://www.resdc.cn, accessed on 7 May 2021), which were generated by artificial visual interpretation based on Landsat remote sensing images at a spatial resolution of 30 m. Data production involves technical links, such as screening of remote sensing data, geometric correction, extraction of classification information, extraction of dynamic information, graphic editing, quality checking, data integration, and area aggregation. The overall accuracy of the data was over 85%, and the qualitative accuracy of crop land and building land was over 90%. The original data were clipped and reclassified by using ArcGIS 10.2 software. With reference to the “Classification of Land Use Status (GB/T 21010-2007)”, the land use types were reclassified to six categories: crop land, forest, grassland, water bodies, building land, and unused land.

2.3. Methods

2.3.1. Land Use Transfer Matrix

The land use transfer matrix reflects the conversion between different land use types in separate periods. This matrix can reflect the direction and volume of land use change and can be used for land use structure analysis and assessment of functional change. The land use transfer matrix is shown in Equation (1):
S i j = S 11 S 12 S 1 n S 21 S 22 S 2 n S n 1 S n 2 S n n
where S is the area of land type; i and j are the land types before and after the transfer, respectively; n is the number of land types; and Sij is the transfer area from land type i to land type j. Each row represents the transition information from land type i to other land types, and each column represents the source information from other land types to land type j.

2.3.2. Land Use Dynamic Degree

The land use dynamic degree is a measure of the rate of quantitative changes in land use types at different time periods in the study area, which can reflect the degree of drastic land use type change and predict the trend of land use change. The degree of land use dynamics is shown in Equation (2):
V = S b S a S a × 1 T × 100 %
where V is the dynamic degree of land type, Sa and Sb are the area of land type at the beginning and end of the study period, respectively, and T is the length of the study period. When T is measured in years, V represents the annual rate of land use change.

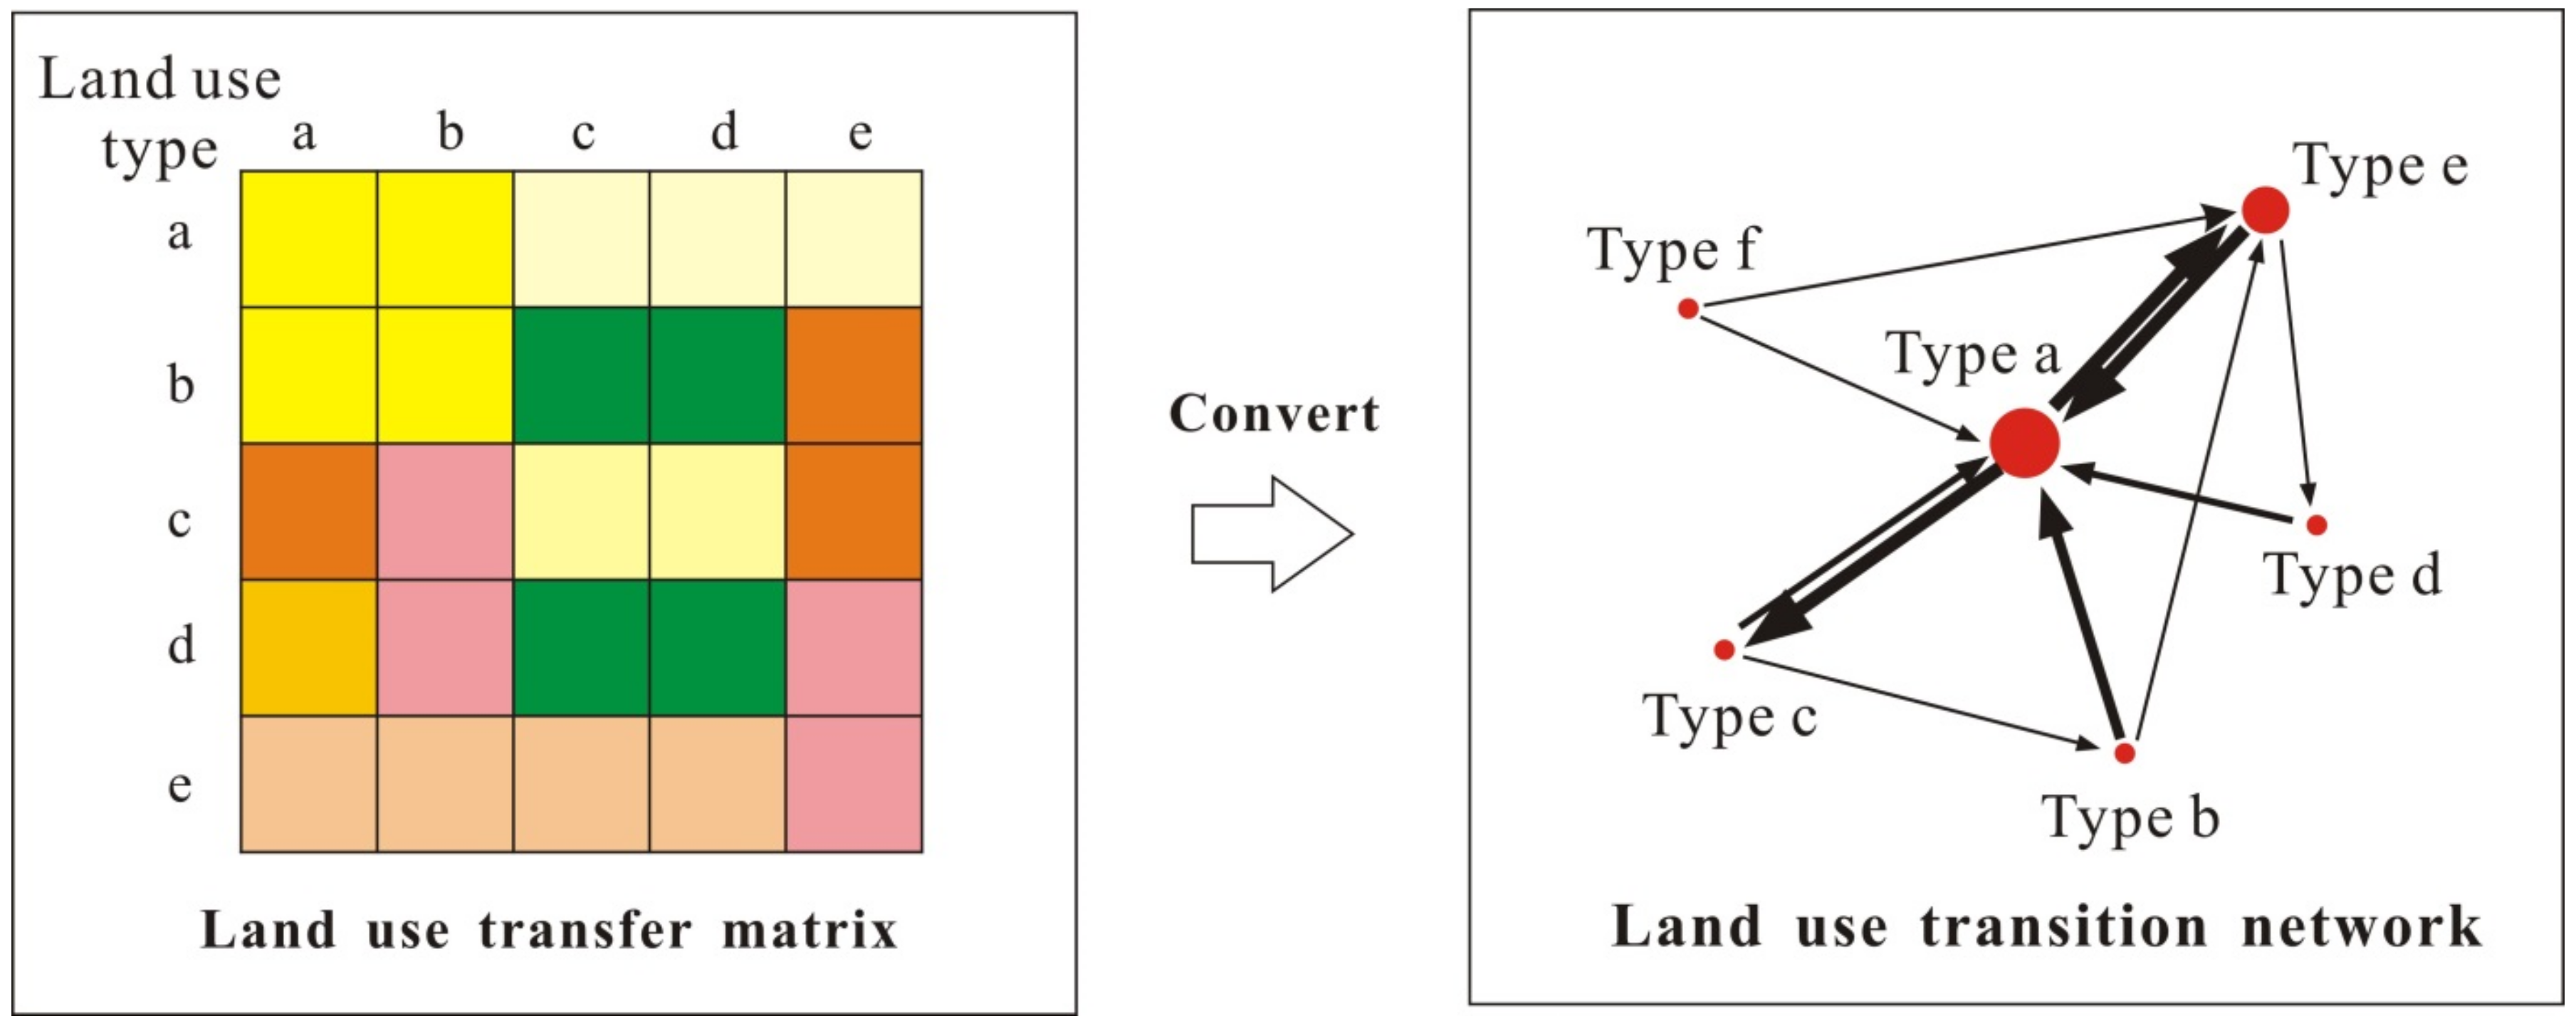
2.3.3. A Complex Network-Based Approach to Land Use Structure Analysis

Complex networks abstract real relationships into nodes and connecting lines to analyze the intricate topological properties of structures and their meanings in specific problems. In general, based on the directionality of the connection and the presence or absence of line properties, complex networks can be classified into four types: directed weighted networks, directed unweight networks, undirected weighted networks, and undirected unweight networks. In this study, the land use transition network was constructed based on the land use transfer matrix. The land use types were convert to nodes and the transition relations among various land use types were convert to the edges in land use transition network (Figure 2). The land use transition network is a directed weighted network, whose direction indicates a change in land use from one type to another, and the weight indicates the amount of area converted from one land use type to another. The process of establishing such a network has been described in detail in previous studies [39,40,41]. By transforming the land use conversion matrix into a network, we obtained four land use transition networks within the study area. For further analysis, the following four indicators were used to analyze the structural characteristics of the matrix. Gephi 0.9.2 was used to implement the visualization of land use transition network and calculate the related measures for complex networks.
1. Node degree
Degree is a basic and important indicator of a network node, and is described as the number of edges linked to a node, and represents the different behaviors between different nodes. In the land use transition network, the greater the degree, the more straightforward the transformation relationships with other land types, indicating a higher centrality in the land use transition network. As the network in this study is a directed weighted network, the node degree is divided into out-degree (Cout,i) and in-degree (Cin,i), and centrality (Ci) is defined as the summation of out-degree and in-degree. The degree of diffusion (Di) was used to measure the magnitude of the output transfer capacity to other land use types. These four indicators together can be used to reflect the role and control power of each node in the land use transition network. The equations used are presented in Table 1.
2. Dominant flow analysis
The dominant flow method is a relatively mature method for the study of urban hierarchies [43]. Through the analysis of maximum transfer direction of land types and the dominance function in node interactions, this method determines the position of a single node in the network system [44]. In this study, we first analyzed the first transfer direction (i.e., the direction of maximum flows) of different land use types to explore the tendency change pattern in the land use network. Subsequently, the top five transfer directions (referred to as the TOP 5 linkage) in the transition network of each period were sorted using the threshold cut-off method, and the temporal stability of these bulk conversion processes was closely examined to identify stable land use change patterns.

3. Results

3.1. Overall Evolution and Regional Differences of Land Use/Cover Change

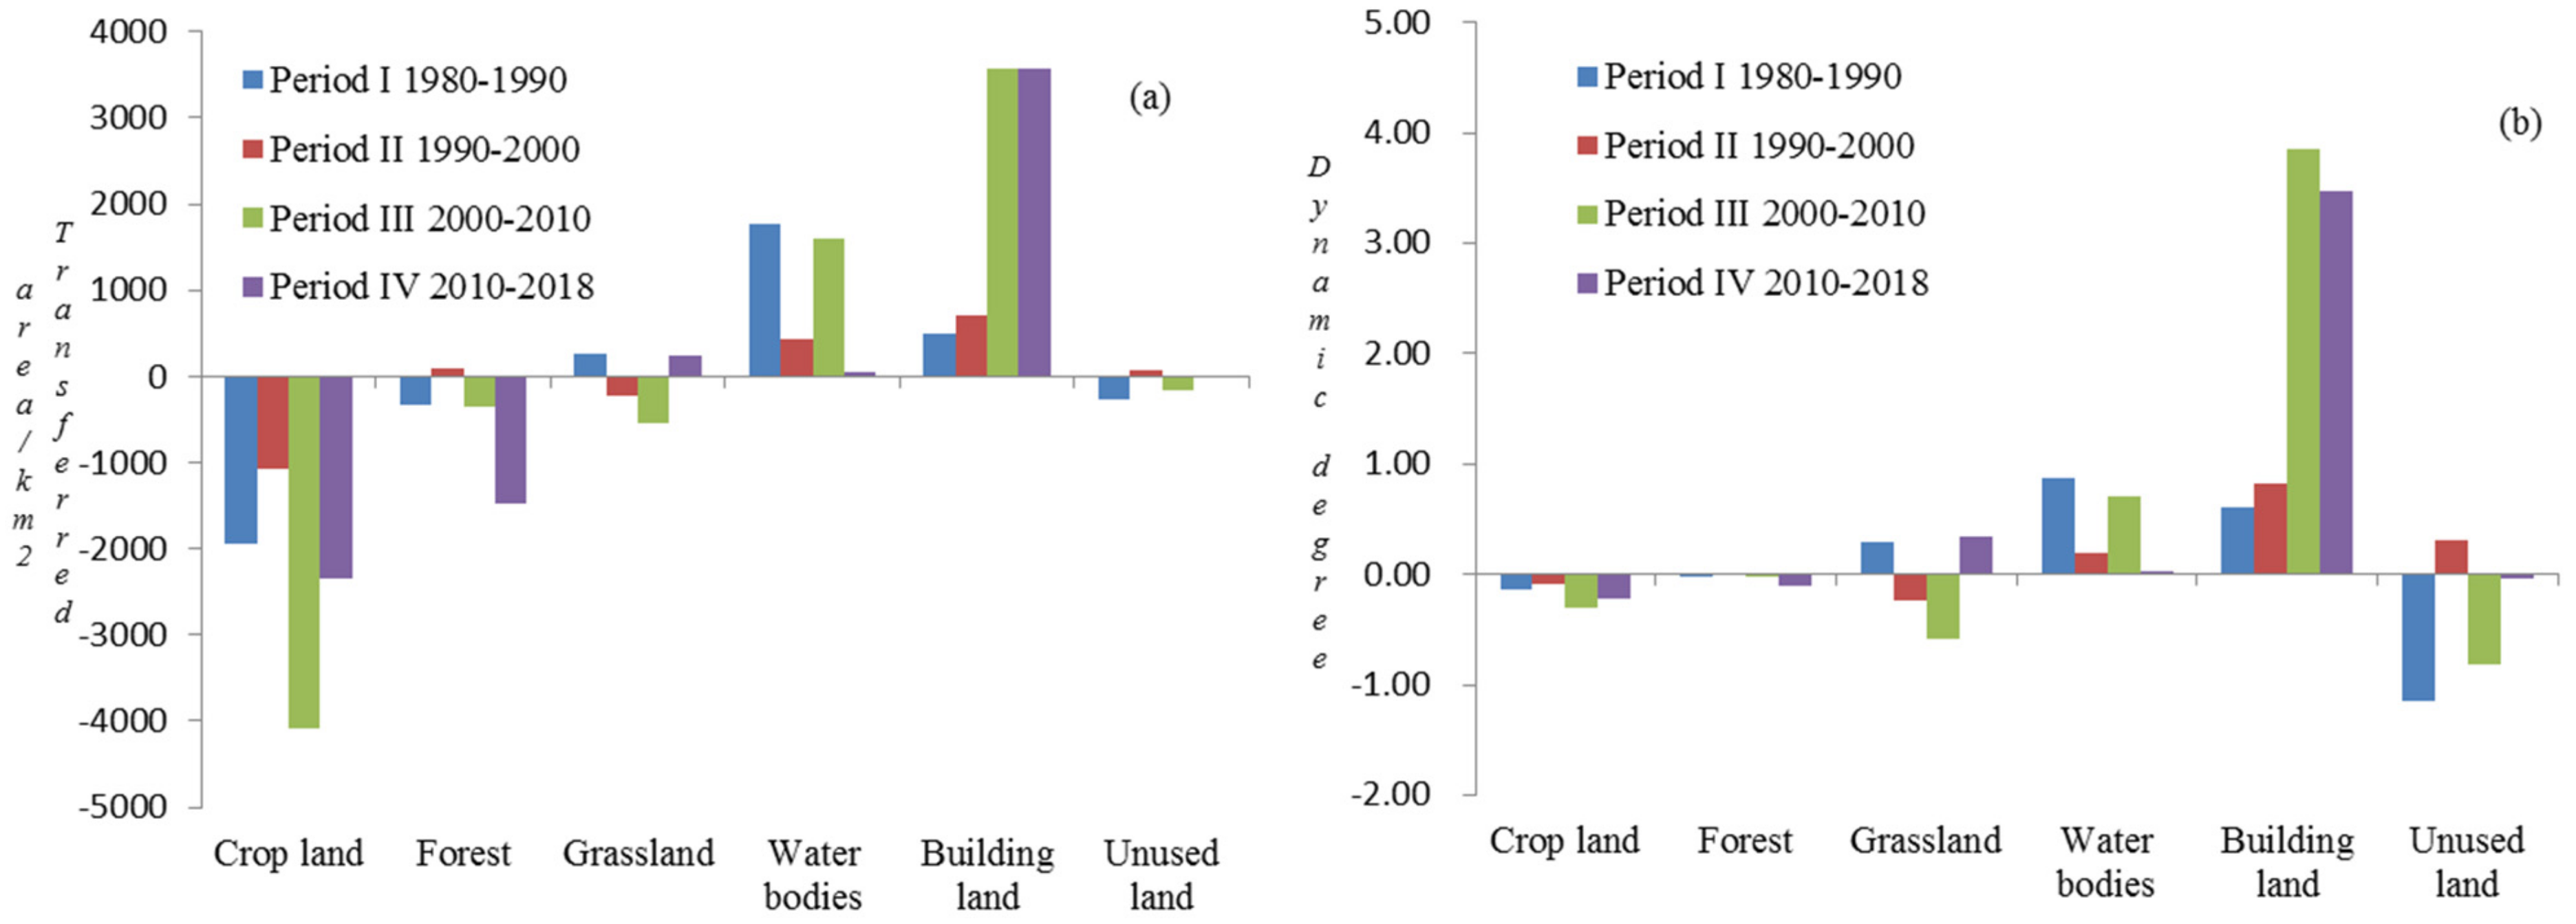
3.1.1. General Evolutionary Characteristics

At the beginning of the study period, the MRYRUA was dominated by forest, which covered approximately half (49.90%) of the total land area of the entire urban agglomeration. Crop lands, the other principal land type of the study area, accounted for 38.72%. In addition, owing to the presence of large freshwater lakes (Dongting Lake and Poyang Lake) and rivers (Yangtze River) flowing through the MRYRUA, water bodies is an important land use type in the area, representing 5.78% of the land at the beginning of the study period. The proportion of building land in the MRYRUA was 2.30%, making it the main agent of urbanization in central China. Although the level of urbanization is not similar to urban clusters in eastern China, the importance of building land is gradually increasing with the rapid development of central China. The proportions of grassland and unused land in the MRYRUA were quite small, accounting for only 2.65% and 0.65%, respectively.
From 1980 to 2018, the areas of all land types within the MRYRUA underwent differential adjustment. The proportion of crop land and forest continually decreased, while the ratio of water bodies to building land increased rapidly, whereas the proportion of other land types did not change significantly (Figure 3a). In terms of the land use dynamic degree, building land and crop land had the largest absolute values, and thus represented the most actively transferred land use types. Building land expanded dramatically and continuously, with the annual dynamic degree rising from 0.61 in Period I to 0.83 in Period II, then 3.84 in Period III, and finally decreasing slightly to 3.47 in Period IV. The dynamic degree of the water bodies fluctuated greatly, from 0.88 in Period I to 0.20 in Period II, then rising to 0.71 in Period III, and ultimately falling to 0.02 in Period IV. In contrast, the most pronounced and accelerated shrinkage was found in crop land and forest, with dynamic degrees altered from −0.14 to −0.23 for crop land and −0.02 to −0.11 for forest (Figure 3b).

3.1.2. Land Use/Cover Change in the Core Areas

The Wuhan Metropolitan Area, Ring of Chang-Zhu-Tan urban agglomeration, and urban agglomeration around Poyang Lake are the three core regions of the MRYRUA, accounting for 16.5%, 27.7%, and 16.5% of the total area, respectively. There were notable differences in the scale, intensity, structure, and spatial distribution of land use transfers in the three core regions during the study period (Table 2, Figure 4). First, regardless of the total area of land use transfer or the proportion of transfer, the Wuhan metropolitan area was the highest scale among the three core regions (8619.8 km2 and 14.9%), followed by the ring of Chang-Zhu-Tan urban agglomeration and the urban agglomeration around Poyang Lake, with transfer proportions of 7.8% and 8.6%, respectively. The intensity of land use transfer in the Wuhan Metropolitan Area was almost twice that of the latter two areas, the scale of its transfer is larger, and the adjustment of land use structure more drastic. Second, according to the transfer direction, the amount of “crop land to building land” transfer in the three core regions was noticeably different, and the ranking was: Wuhan metropolitan area > ring of Chang-Zhu-Tan urban agglomeration > urban agglomeration around Poyang Lake, although the area proportion of this transfer direction did not significantly differ. The transfer direction of “forest to building land”, however, shows a remarkable difference. The ring of the Chang-Zhu-Tan urban agglomeration had the largest transfer area and the highest proportion of transfer in this direction (988.3 km2 and 1.0%), while the Wuhan metropolitan area had the smallest area and proportion (298.9 km2 and 0.5%), indicating that there are large differences in the land transfer structure between regions due to their unique natural environments and the different structures of the main land types. Third, “building land to cultivated land” was mainly distributed randomly across the peripheral areas of core cities. The “unused land to water bodies” transfer was mainly distributed in Poyang Lake, Dongting Lake, and the Yangtze River coastline, with a noticeably concentrated distribution. “Forest to building land” was mainly distributed in the southwest and southeast hilly areas of the study area, with the most drastic conversion occurring around Changsha, Zhuzhou, Xiangtan, Yichun and Nanchang cities. The “water bodies to cultivated land” was mainly distributed in the peripheral point area centered on Poyang Lake, Dongting Lake, and the Yangtze River.

3.2. Structural Characteristics of Land Use/Cover Change

To further analyze the structural characteristics of land use/cover change, a network of land use transition in four time periods was constructed (Figure 5). Using methods and indicators of complex network analysis (key land category identification, main change path identification, and land transfer pattern refinement), we conducted an in-depth examination of the MRYRUA land use transition network.

3.2.1. The Recognition of Key Land Types

The degree values of each node in the land use transition network are listed in Table 3. From 1980 to 2018, the output and input degree of each node showed dynamic changes and noticeable differences. In particular, the centrality of crop land continued to increase, whereas the diffusion degree continued to decrease, indicating that the position of crop land in the network was strengthening and the area transfer to other land types was decreasing. The output and input degrees of forest rapidly increased, which led to a continuous increase in its centrality, and the transition intensity of forest had increased. However, the diffusion degree of forest was maintained at approximately 1, indicating that its output and input degree were balanced. The transition of grasslands was not drastic, with low degrees of output and input; however, its centrality increased between 1990 and 2000, but remained low for the rest of the time. The centrality of the water bodies reached a peak level before 2010 then declined rapidly. The diffusion degree was less than 1 in each time period, indicating that it remained in long-term input status. The centrality of building land increased from 5.7 to 32.2, and the degree of diffusion was between 0 and 0.3, indicating a continuous input process throughout the study period.
The status and role of each land type in the land transition network varied significantly (Table 4). Based on the value of the diffusion degree (D < 1, D > 1, or D ≈ 1), land types can be classified as input, output, or balanced. Crop land was the primary output land type in all four periods, with a total of 17,165.4 km2 output area, mainly transferred to building land, forest, and water bodies (accounting for 38.8%, 29.8%, and 29.0%, respectively). The forest was the output land type in Periods I and IV, but changed to the predominant input land type in the Periods II and III, with a total of 8773.1 km2 outputted area during the study period, mainly transferred to crop land and building land (53.7% and 27.3%, respectively). Grassland belonged to the output land type in Periods II and III, but then to the input land type in the remaining two periods. A total of 1687.7 km2 were transferred out during the study period, largely to forest or cultivated land. Conversely, building land and water bodies belonged to the input land type in most of the periods, with 9593.4 km2 and 6810.4 km2 inputted area during the study period, respectively. Among the land types, the input area of building land mainly came from cultivated land and forest, which accounted for 69.5% and 24.9%, respectively. The input of water bodies was mainly derived from cultivated land (69.5%).
Node centrality (C) and betweenness (B) are key indicators for elevating the status of each node to control the entire network. The core land type (C > 30) and nodal land type (B > 5) can be identified according to the values of node centrality and betweenness. The core land type has a high centrality in the network and a greater influence on the transition networks. The nodal land type acts as a ‘bridge’ in most transition relationships and has stronger control ability. Since 1980, both crop land and water bodies were core and nodal land types, and they had the strongest control over the transition network. After Period II, the centralities of forest and building land continued to increase, and consequently their control ability in the transition network increased; however, building land was not a nodal land class in any period. This indicates that its centrality status increased commensurately with the area of land input, but its ability to connect different land nodes was still low, and the transition of building land to other land types remained difficult.

3.2.2. The Recognition of Main Land Use Change Pattern

There were similarities and differences in land use change patterns in different regions. In the land use transition network: (1) if land type i tended to be output first to land type j, then the transition direction of land type transfer from i to j was regarded as a tendency land change pattern; (2) within a continuous time interval, if the land type had the same large-scale transition process, the process was considered stable on the time scale and thus exhibited a stable land change pattern. The tendency of land use change patterns and stable land use change patterns are often driven by natural factors or human activities, and they are the main processes of land change that require the most attention from researchers and decision makers. In this study, the first transfer direction of each land type in the land use transition network reflects the tendency of the land use change pattern; TOP 5 transfer directions among all edges in the land use transition network are used to explore the stable land use change pattern (Table 5).
The first transfer direction of each land use type was stable during different periods. First, the transition of crop land to water bodies or forest was a tendency land change pattern, which is closely related to the spatial mosaic distribution of forests, water bodies, and fields in the middle reaches of the Yangtze River. Second, forest tended to transfer to crop land in all four periods, indicating that the transfer between forest and crop land was a significant pattern in the study area. Third, grassland tended to transfer to forest, whereas water bodies and building land were most often transferred to crop land. Finally, unused land was generally converted to water.
The results of the TOP 5 transfer directions show that crop land to water (14) and crop land to building land (15) are the predominant processes of stable land use transfer in the middle reaches of the Yangtze River. These two transfer directions were ranked stably in the top two positions in the first three periods, indicating that they are transformed on a larger scale, and stabilized over time. In addition, the transition of the water bodies to crop land (41) was also a stable land use transfer direction. The transition between crop land and forest (12, 21) also represented a process of stable transformation. The transfer of crop land to building land (15) and forest to building land (25) was larger in period IV than in any other period, while the direction of building land transfer back to crop land (51) also entered TOP 5, suggesting that, in the dual context of rapid growth of urban building land and rigid control policies, the phenomenon of land replacement is prominent, and the land use system is under a deep restructuring process.

4. Discussion

4.1. Driving Factors of Land Use Change in MRYRUA

Socio-economic development, urbanization level and geographical conditions are important factors affecting regional land use patterns and change speed. According to the research results, the areas of different land types changed drastically during 1980 to 2018. The MRYRUA was dominated by forest, crop land, and water bodies at the beginning of the study period. The growth of building land is significant and continues to expand, while the area of crop land and forest continues to decrease rapidly. Urbanization is an important driving force for the change of land use. In 2020, the MRYRUA had a total population of 125 million and a regional GDP of 7.90 trillion RMB. Increasing population, economic and social development have raised new demand for build land in the area. Besides, the inefficiency use and scattered distribution of urban and rural construction land were also one of the reasons leading to the increase of settlement areas. Due to the different geographical conditions between three core regions within the urban agglomeration, noticeable differences obtained in the scale, structure, and spatial distribution of land use change. The transfer direction of “crop land to building land” was most intense in the Wuhan metropolitan area, the transfer direction of “forest to building land” has the largest scale in the ring of Chang-Zhu-Tan urban agglomeration, and the transfer direction of “water bodies to crop land” had the highest proportion in the urban agglomeration around Poyang Lake. As the fastest economic development region in the middle reaches of the Yangtze River, the Wuhan metropolitan area showed the most drastic change in land use structural adjustment.

4.2. Structural Characteristics and Driving Factors of Land Use Change in MRYRUA

In this study, six land use types were regarded as nodes in a transition network, the transfer relationships between land use types were regarded as edges, and the area of transition between the land use types was used as the weight of edge. The results show that there are three obvious structural characteristics of land use change in MRYRUA. First, both crop land and water bodies were core and nodal land types, and they had the strongest controllability over the land transition network. MRYRUA is a traditional agricultural planting area with many mountains and waters, forests, crop land and water bodies account for the largest proportion in the land use system in initial stages. Therefore, in the process of land use system transformation, these land types are mostly used as intermediaries to realize the transformation of land use structure. Second, the first transfer direction of each land use type was stable in different periods and shows a relatively fixed transfer characteristic. Such as the tendency of mutual transition between forest and crop land; the tendency transition of water and building land to crop land. These tendency land change patterns was influenced by the strict crop land protection policy and the “requisition-compensation balance system”, in which a large number of lakes, marshes, and inefficiency used settlements promoted the transition of building land/forest/water bodies to crop land. Third, stable land change patterns in the MRYRUA were revealed in this study, the driving forces may include land reclamation, rapid urbanization and new rural countryside construction, policy of “forest rehabilitation”, etc. For example, the direction of crop land to building land (15) was mainly influenced by the expansion of urban and rural settlements, where crop land was usually concentrated closer to settlements and frequently occurred during the rapid urbanization period. In addition, due to the insufficient attention to the ecological function of the water bodies in the early stage, lake reclamation and mudflat reclamation had caused a large number of water bodies transferred to crop land, which had a negative impact on the environmental ecology. Crop land and forest (12, 21) show a mutual transfer pattern rather than a one-way connection between forest and crop land, it was closely related to the policy of “forest rehabilitation” at the beginning of the 21st century and the construction of urban ecological environment that led to a considerable amount of transfer from low-quality farmland to forest.

4.3. Land Use Optimization Measures

The MRYRUA is a region of rapid development in central China, which shows a strong demand for building land and a rapidly evolving land use/cover structure. To cope with the instability of land use systems and environmental degradation caused by rapid urbanization, the following aspects of land use management measures should be strengthened. First, in accordance with the law of spatial and temporal evolution of land use, it is necessary to promote independent innovation in accordance with the requirements of ecological civilization construction, upgrade the level of economic development and concentrated land use, and promote the stocking of potential and organic renewal. Second, with respect to the differences in scale, structure, and spatial distribution of land use transition in different regions, each city should scientifically develop territorial spatial planning strategies and explore the polycentric network structure to promote sustainable growth of urban agglomeration. Third, it is important to strengthen the protection of nodal land types such as crop land and forest, strictly control the scale of nodal land transfer. Fourth, it is necessary to control the area of large-scale input land types such as building land. In particular, owing to the ecological sensitivity and vulnerability of crop land and forest, monitoring the scale of their transfer to building land by adjusting regional land management policies and guiding the regional land transition network to a highly efficient and stable structure is essential.

4.4. Limitations and Future Directions of the Study

This study attempts to introduce more complex network indicators into land use/cover analysis; however, it is not without its limitations. In future studies, we will intensify the application of more network indicators into the land transition network and reveal the meaning of land use changes for different indicators in depth. In addition, because our study only considers the MRYRUA as a case study, the cross-sectional comparison among different urban agglomerations is insufficient. Therefore, it is necessary to strengthen the comparative analysis of land use patterns in different study areas and to explore the economic and social motives beneath the patterns to reveal more profound evolutionary laws of regional land use/cover.

5. Conclusions

Examining systematic processes and the structure of land use/cover change is of great significance for the development of sustainable urban agglomeration management strategies. This study applies the complex network method to construct the land use transition network of the MRYRUA across four periods and studies the structural characteristics of land use systems from node and edge analyses. The following conclusions were drawn.
First, this study reveals the spatial–temporal dynamics of LUCC in the MRYRUA. At the beginning of the study period, the MRYRUA was dominated by forest and crop land, which together accounted for 88.62% of the total land area, followed by the water bodies, which accounted for 5.78%, and finally building land, grassland, and unused land accounted for nearly insignificant proportions. From 1980 to 2018, the areas of different land types changed drastically. The land use dynamic degree shows that the growth of building land is significant and continues to expand, while the area of crop land and forest ha, and continues, to rapidly decrease.
Second, there are noticeable differences in the scale, structure, and spatial distribution of land use change between the three core regions within the urban agglomeration. The intensity and structural adjustment of land use change in the Wuhan metropolitan area was the most drastic. The transfer direction of “crop land to building land” was most intense in the Wuhan metropolitan area, the transfer direction of “forest to building land” has the largest scale in the Ring of Chang-Zhu-Tan urban agglomeration, and the transfer direction of “water bodies to crop land” had the highest proportion in the urban agglomeration around Poyang Lake.
Third, through the identification of key land types, we verified that crop land belonged to the output land type, whereas building land and water bodies belonged to the input land type. Forest and grassland are input land types in periods I and IV, while grassland belonged to the output land type in periods II and III, respectively. Comprehensively, crop land and water bodies were core and nodal land types, and thus had the strongest controllability over the land use system.
Finally, the first transfer direction of each land use type was stable in different periods and shows a fixed transfer characteristic. There was a mutual tendency transfer between forest and crop land; while grassland most often transferred to forest. The first transfer direction of both water and building land was to crop land, and the unused land tended to shift to the water bodies. In addition, the transfer of crop land to the water bodies (14), the transfer of crop land to building land (15), the transfer of water bodies to crop land (41), and the mutual transfer between crop land and forest (12, 21) appeared stable on the time scale, and they were the stable land change patterns in the MRYRUA. Under the influence of land use management policies in different time periods, a new path for the mutual conversion of crop land and building land emerges in the TOP 5 linkage direction (15, 51), indicating that land replacement between crop land and building land is prominent, and the land use structure is undergoing drastic upheaval.

Author Contributions

Conceptualization, Z.W. and S.Y.; methodology, Z.W. and D.Z.; software, D.Z.; validation, Z.W. and D.Z.; formal analysis, Z.W.; investigation, Z.W. and T.L.; resources, Z.W.; data curation, Z.W. and T.L.; writing—original draft preparation, Z.W. and D.Z.; writing—review and editing, Z.W. and T.L.; visualization, Z.W.; supervision, S.Y.; funding acquisition, Z.W. and S.Y. All authors have read and agreed to the published version of the manuscript.

Funding

This research was funded by the National Natural Science Foundation of China, grant number 42101205 and 42171200. The Ministry of education of Humanities and Social Science project, grant number 20YJCZH174. The Outstanding Youth Project of Hunan Education Bureau, grant number 18B042 and grant number 20B173.

Institutional Review Board Statement

Not applicable.

Informed Consent Statement

Not applicable.

Data Availability Statement

Not applicable.

Conflicts of Interest

The authors declare no conflict of interest.

References

  1. Turner, B.L., II; Lambin, E.F.; Reenberg, A. The emergence of land change science for global environmental change and sustainability. Proc. Natl. Acad. Sci. USA 2007, 104, 20666–20671. [Google Scholar] [CrossRef] [PubMed] [Green Version]
  2. Lian, L.; Li, B.; Chen, Y.; Chu, C.; Qin, Y. Quantifying the effects of luccs on local temperatures, precipitation, and wind using the wrf model. Environ. Monit. Assess. 2017, 189, 501.501–501.511. [Google Scholar] [CrossRef] [PubMed]
  3. Ye, C.; Chen, M.; Duan, J.; Yang, D. Uneven development, urbanization and production of space in the middle-scale region based on the case of Jiangsu province, China. Habitat Int. 2017, 66, 106–116. [Google Scholar] [CrossRef]
  4. Li, H.; Peng, J.; Liu, Y.; Hu, Y.n. Urbanization impact on landscape patterns in Beijing city, China: A spatial heterogeneity perspective. Ecol. Indic. 2017, 82, 50–60. [Google Scholar] [CrossRef]
  5. Chen, R.; Ye, C.; Cai, Y.; Xing, X.; Chen, Q. The impact of rural out-migration on land use transition in China: Past, present and trend. Land Use Policy 2014, 40, 101–110. [Google Scholar] [CrossRef]
  6. Yu, A.T.W.; Wu, Y.; Zheng, B.; Zhang, X.; Shen, L. Identifying risk factors of urban-rural conflict in urbanization: A case of China. Habitat Int. 2014, 44, 177–185. [Google Scholar] [CrossRef]
  7. Chen, J. Rapid urbanization in China: A real challenge to soil protection and food security. Catena 2007, 69, 1–15. [Google Scholar] [CrossRef]
  8. Chen, M.; Liu, W.; Lu, D.; Chen, H.; Ye, C. Progress of China’s new-type urbanization construction since 2014: A preliminary assessment. Cities 2018, 78, 180–193. [Google Scholar] [CrossRef]
  9. Liu, D.; Cai, S. A spatial-temporal modeling approach to reconstructing land-cover change trajectories from multi-temporal satellite imagery. Ann. Assoc. Am. Geogr. 2012, 102, 1329–1347. [Google Scholar] [CrossRef]
  10. Liu, C.; Xu, Y.; Sun, P.; Huang, A.; Zheng, W. Land use change and its driving forces toward mutual conversion in Zhangjiakou city, a farming-pastoral ecotone in northern China. Environ. Monit. Assess. 2017, 189, 505. [Google Scholar] [CrossRef]
  11. Varga, O.G.; Pontius, R.G., Jr.; Szabo, Z.; Szabo, S. Effects of category aggregation on land change simulation based on corine land cover data. Remote Sens. 2020, 12, 1314. [Google Scholar] [CrossRef] [Green Version]
  12. He, J.; Huang, J.; Li, C. The evaluation for the impact of land use change on habitat quality: A joint contribution of cellular automata scenario simulation and habitat quality assessment model. Ecol. Model. 2017, 366, 58–67. [Google Scholar] [CrossRef]
  13. Zhang, W.; Chang, W.J.; Zhu, Z.C.; Hui, Z. Landscape ecological risk assessment of chinese coastal cities based on land use change. Appl. Geogr. 2020, 117, 102174. [Google Scholar] [CrossRef]
  14. Mishra, N.B.; Crews, K.A.; Okin, G.S. Relating spatial patterns of fractional land cover to savanna vegetation morphology using multi-scale remote sensing in the central kalahari. Int. J. Remote Sens. 2014, 35, 2082–2104. [Google Scholar] [CrossRef] [Green Version]
  15. Liu, J.; Deng, X. Progress of the research methodologies on the temporal and spatial process of lucc. Chin. Sci. Bull. 2010, 55, 1354–1362. [Google Scholar] [CrossRef]
  16. Chen, M.; Bai, Z.; Wang, Q.; Shi, Z. Habitat quality effect and driving mechanism of land use transitions: A case study of henan water source area of the middle route of the south-to-north water transfer project. Land 2021, 10, 796. [Google Scholar] [CrossRef]
  17. Ge, Y.; Hu, S.; Ren, Z.; Jia, Y.; Wang, J.; Liu, M.; Zhang, D.; Zhao, W.; Luo, Y.; Fu, Y.; et al. Mapping annual land use changes in China’s poverty-stricken areas from 2013 to 2018. Remote Sens. Environ. 2019, 232, 111285. [Google Scholar] [CrossRef]
  18. Aldwaik, S.Z.; Pontius, R.G., Jr. Intensity analysis to unify measurements of size and stationarity of land changes by interval, category, and transition. Landsc. Urban Plan. 2012, 106, 103–114. [Google Scholar] [CrossRef]
  19. Shoyama, K.; Braimoh, A.K. Analyzing about sixty years of land-cover change and associated landscape fragmentation in shiretoko peninsula, northern japan. Landsc. Urban Plan. 2011, 101, 22–29. [Google Scholar] [CrossRef]
  20. Mallinis, G.; Koutsias, N.; Arianoutsou, M. Monitoring land use/land cover transformations from 1945 to 2007 in two peri-urban mountainous areas of athens metropolitan area, greece. Sci. Total Environ. 2014, 490, 262–278. [Google Scholar] [CrossRef]
  21. Huang, J.; Pontius, R.G., Jr.; Li, Q.; Zhang, Y. Use of intensity analysis to link patterns with processes of land change from 1986 to 2007 in a coastal watershed of southeast China. Appl. Geogr. 2012, 34, 371–384. [Google Scholar] [CrossRef]
  22. Mansour, S.; Al-Belushi, M.; Al-Awadhi, T. Monitoring land use and land cover changes in the mountainous cities of oman using gis and ca-markov modelling techniques. Land Use Policy 2020, 91, 104414. [Google Scholar] [CrossRef]
  23. Wang, S.-Y.; Liu, J.-S.; Ma, T.-B. Dynamics and changes in spatial patterns of land use in Yellow River Basin, China. Land Use Policy 2010, 27, 313–323. [Google Scholar] [CrossRef]
  24. Lee, C.-L.; Huang, S.-L.; Chan, S.-L. Synthesis and spatial dynamics of socio-economic metabolism and land use change of taipei metropolitan region. Ecol. Model. 2009, 220, 2940–2959. [Google Scholar] [CrossRef]
  25. Lambin, E.F.; Meyfroidt, P. Land use transitions: Socio-ecological feedback versus socio-economic change. Land Use Policy 2010, 27, 108–118. [Google Scholar] [CrossRef]
  26. Li, T.; Long, H.; Liu, Y.; Tu, S. Multi-scale analysis of rural housing land transition under China’s rapid urbanization: The case of Bohai Rim. Habitat Int. 2015, 48, 227–238. [Google Scholar] [CrossRef]
  27. Mizutani, C. Construction of an analytical framework for polygon-based land use transition analyses. Comput. Environ. Urban Syst. 2012, 36, 270–280. [Google Scholar] [CrossRef]
  28. Long, H.; Zhang, Y.; Ma, L.; Tu, S. Land use transitions: Progress, challenges and prospects. Land 2021, 10, 903. [Google Scholar] [CrossRef]
  29. Liu, Y.; Long, H.; Li, T.; Tu, S. Land use transitions and their effects on water environment in Huang-Huai-Hai Plain, China. Land Use Policy 2015, 47, 293–301. [Google Scholar] [CrossRef]
  30. Long, H.; Qu, Y.; Tu, S.; Zhang, Y.; Jiang, Y. Development of land use transitions research in China. J. Geogr. Sci. 2020, 30, 1195–1214. [Google Scholar] [CrossRef]
  31. Zhou, J.; Hou, Q. Complex network-based research on the resilience of rural settlements in Sanshui watershed. Land 2021, 10, 1068. [Google Scholar] [CrossRef]
  32. Watts, D.J.; Strogatz, S.H. Collective dynamics of ‘small-world’ networks. Nature 1998, 393, 440–442. [Google Scholar] [CrossRef]
  33. Barabási, A.L.; Albert, R. Emergence of scaling in random networks. Science 1999, 286, 509–512. [Google Scholar] [CrossRef] [Green Version]
  34. Boccaletti, S.; Latora, V.; Moreno, Y.; Chavez, M.; Hwang, D.U. Complex networks: Structure and dynamics. Phys. Rep.-Rev. Sect. Phys. Lett. 2006, 424, 175–308. [Google Scholar] [CrossRef]
  35. Lao, X.; Zhang, X.; Shen, T.; Skitmore, M. Comparing China’s city transportation and economic networks. Cities 2016, 53, 43–50. [Google Scholar] [CrossRef] [Green Version]
  36. Fan, W.; Fong, D.K.C.; Li, G.; Law, R. Understanding clusters of tourist behavior associations using network analysis. Int. J. Hosp. Tour. Adm. 2021, 22, 502–523. [Google Scholar] [CrossRef]
  37. Tao, Q.; Li, R.; Wang, Y. Integrative effects among innovation network elements on innovation performance based on qca. Int. J. Serv. Technol. Manag. 2016, 22, 301–312. [Google Scholar] [CrossRef]
  38. Klerkx, L.; Aarts, N.; Leeuwis, C. Adaptive management in agricultural innovation systems: The interactions between innovation networks and their environment. Agric. Syst. 2010, 103, 390–400. [Google Scholar] [CrossRef]
  39. Zhang, M.; Wang, J.; Feng, Y. Temporal and spatial change of land use in a large-scale opencast coal mine area: A complex network approach. Land Use Policy 2019, 86, 375–386. [Google Scholar] [CrossRef]
  40. Zhang, B.; Yin, L.; Zhang, S.; Feng, C. Assessment on characteristics of lucc process based on complex network in Modern Yellow River Delta, Shandong Province of China. Earth Sci. Inform. 2016, 9, 83–93. [Google Scholar] [CrossRef]
  41. Joo, H.; Kim, H.S.; Kim, S.; Sivakumar, B. Complex networks and integrated centrality measure to assess the importance of streamflow stations in a River basin. J. Hydrol. 2021, 598, 126280. [Google Scholar] [CrossRef]
  42. Xiang, J.; Li, X.; Xiao, R.; Wang, Y. Effects of land use transition on ecological vulnerability in poverty-stricken mountainous areas of China: A complex network approach. J. Environ. Manag. 2021, 297, 113206. [Google Scholar] [CrossRef]
  43. Nystuen, J.D.; Dacey, M.F. A graph theory interpretation of nodal regions. Pap. Reg. Sci. Assoc. 1961, 7, 29–42. [Google Scholar] [CrossRef] [Green Version]
  44. Chao, D.; Chunliang, X.; Ye, W. Network structure of ‘space of flows’ in Jilin province based on telecommunication flows. Acta Geogr. Sin. 2014, 69, 510–519. [Google Scholar]
Figure 1. Location and land cover of the middle reaches of the Yangtze River urban agglomeration.
Sustainability 14 06941 g001
Figure 2. Establishment of land use transition network based on the land use transfer matrix. Note: the arrow represents the direction of land use change, and the thickness of the line represents the transition area (relative amount) between two land use types.
Sustainability 14 06941 g002
Figure 3. Area changes for land use types in the MRYRUA: (a) Change in area and (b) change in dynamic degree.
Sustainability 14 06941 g003
Figure 4. Spatial distribution of land use transfer direction.
Sustainability 14 06941 g004
Figure 5. Land use transition networks in different periods: (a) 1980–1990; (b) 1990–2000; (c) 2000–2010; and (d) 2010–2018. Note: the arrow represents the direction of land use change, and the thickness of the line represents the transition area (relative amount) between two land use types.
Sustainability 14 06941 g005
Table 1. Index of node degrees.
IndicatorsFormulasImplicationVariable Interpretation
Out-degree C o u t , i = j = 1 n S i j The larger the out-degree of land type i, the more area is transferred to other land types, the in-degree has the opposite meaning. The stronger the centrality index of a land type, the higher the status in the network.i, j = 1, …, n: land use type;
Sij: the area transferred from land type i to land type j;
Sji: the area transferred from land type j to land type i;
n: the number of nodes;
bjk: the shortest path between node j and node k;
bijk is the shortest path between node j and node k,
which must pass through node i.
In-degree C i n , i = j = 1 n S j i
Centrality C i = C o u t , i + C i n , i
Diffusion degree D i = C o u t , i C i n , i / C i × 100 % If D > 1, the land belongs to the output land type; if D < 1, it belongs to the input land type; and if D = 1, the land type is balanced.
Betweenness centrality B i = 1 ( n 1 ) ( n 2 ) j k b i j k b j k The larger the node betweenness is, the greater the controlling power of the corresponding node.
Table 2. Comparison of land use transfer between the three core regions.
Core RegionsAll Land TransferredCrop Land to Building LandForest to Building Land
km2%km2%km2%
Urban agglomeration around Poyang Lake4878.98.6980.01.7392.40.7
Wuhan Metropolitan Area8619.814.92274.93.9298.90.5
Ring of Chang-Zhu-Tan urban agglomeration7535.27.81398.61.4988.31.0
Note: “km2” is the amount of transferred area, “%” is the percentage of transferred area to total regional area. The Wuhan Metropolitan Area includes eight cities: Wuhan, Huangshi, Ezhou, Huanggang, Xiaogan, Xianning, Xiantao, Tianmen, Qianjiang; the ring of Chang-Zhu-Tan urban agglomeration includes eight cities Changsha, Zhuzhou, Xiangtan, Yueyang, Hengyang, Yiyang, Changde, Loudi; and the urban agglomeration around Poyang Lake includes five cities, including Nanchang, Jingdezhen, Jiujiang, Yingtan, and Shangrao.
Table 3. Node degree values in the land use transition network in different periods.
Land Use TypeCrop LandForestGrasslandWater BodiesBuilding LandUnused Land
Period I 1980–1990Cout27.326.191.195.520.125.57
Cin5.482.514.2025.465.622.65
D4.992.470.280.220.022.10
C32.808.705.3930.985.738.21
B9.815.182.797.590.331.00
Period II 1990–2000Cout41.0713.919.6011.390.121.04
Cin13.8916.383.9222.3417.992.60
D2.960.852.450.510.010.40
C54.9530.2813.5333.7318.113.64
B8.937.280.588.380.190.08
Period III 2000–2010Cout51.6420.996.4314.453.355.50
Cin20.9518.372.3026.4330.094.23
D2.471.142.800.550.111.30
C72.5939.368.7340.8733.449.74
B9.205.500.608.301.200.30
Period IV 2010–2018Cout42.7431.443.368.787.421.79
Cin31.3324.214.548.9724.731.76
D1.361.300.740.980.301.02
C74.0755.657.9017.7432.153.55
B7.275.910.277.791.240.16
Note: Cout is node out-degree, Cin is node in-degree, D is node diffusion degree, C is node centrality, and B is node betweenness.
Table 4. Identification of key land types in different periods.
Output Land Type
(D > 1)
Input Land Type
(D < 1)
Balanced Land Type
(D ≈ 1)
Core Land Type
(C > 30)
Nodal Land Type
(B > 5)
Period I
1980–1990
Crop land, Forest, Unused landGrassland, Water bodies, Building landNoneCrop land, Water bodiesCrop land, Water bodies
Period II
1990–2000
Crop land, GrasslandWater bodies, Building land, unused landForestCrop land, Water bodies, Forest, Building landCrop land, Water bodies, Forest
Period III
2000–2010
Crop land, GrasslandWater bodies, Building landUnused landCrop land, Water bodies, Forest, Building landCrop land, Water bodies, Forest
Period IV
2010–2018
Crop land, ForestGrassland, Building landWater bodiesCrop land, Water bodies, Forest, Building landCrop land, Water bodies, Forest
Note: D is node diffusion degree, C is node centrality, B is node betweenness.
Table 5. The first transfer direction and TOP 5 transfer directions in the land use transition networks.
Transfer Directions
First transfer directionsPeriod I 1980–1990142132415164
Period II 1990–2000142132415164
Period III 2000–2010122132415164
Period IV 2010–2018122132415164
Tendency land change pattern14/12, 21, 32, 41, 51, 64
TOP5 transfer directionsPeriod I 1980–19901415642341-
Period II 1990–20001415321241-
Period III 2000–20101514122141-
Period IV 2010–20182112152551-
Stable land use change pattern14, 15, 41, 12, 21
Note: The numeric codes in this table indicate the land transfer direction codes: 14, crop land to water bodies; 15, crop land to building land; 12, crop land to forest; 23, forest to grassland; 21, forest to crop land; 32, grassland to forest; 41, water bodies to crop land; 51, building land to crop land; 64, unused land to water bodies; and 25, forest to building land.
Publisher’s Note: MDPI stays neutral with regard to jurisdictional claims in published maps and institutional affiliations.

