Article

Design and Parametric Optimization of the High-Speed Pico Waterwheel for Rural Electrification of Pakistan

1
Faculty of Mechanical Engineering, University of Engineering and Technology, Lahore 54890, Pakistan
2
Institute of Manufacturing, University of Engineering & Applied Sciences, Swat 19060, Pakistan
3
Faculty of Engineering and IT, University of Technology Sydney, Sydney 2007, Australia
4
Electrical Engineering, Faculty of Engineering and Technology, Future University in Egypt, New Cairo 11845, Egypt
5
Department of Mechanical Engineering, University Centre for Research & Development, Chandigarh University, Mohali 140413, Punjab, India
*
Author to whom correspondence should be addressed.
Sustainability 2022, 14(11), 6930; https://doi.org/10.3390/su14116930
Submission received: 26 April 2022 / Revised: 27 May 2022 / Accepted: 28 May 2022 / Published: 6 June 2022

Abstract

:
This research study presents an approach for analysis of pico hydro waterwheels by both experimental and numerical methods. The purpose of this research is to harness the energy efficiently from flowing water of irrigation channels and other shallow water sources in rural areas because the electrification of rural areas through connection to grid electricity is very costly. The novelty of this research work lies in testing of the waterwheel as a high-speed device, which is not usually explored. The review of existing literature reveals that pico waterwheels have been extensively studied but without changing the blade profile immersed in the water stream ot the inclination angle of the water stream. In this study, a pico scale waterwheel was tested with three different types of blade profiles, namely a C-shape blade, V-shape blade and straight blade, through computational fluid dynamics (CFD) simulations for different tip speed ratios (TSR), varying the immersed depth of the blade in the stream and changing the angle of the water conduit while keeping the number of blades and the diameter of the wheel constant. The numerical and experimental results were validated for the C-shape blade profile. A substantial improvement in performance is observed with a C-shape blade profile at a TSR of 0.88. The results show that by varying the angle of the water conduit, the maximum performance is achieved at inclination φ = 45°, with an overall improvement of 4.87% in the efficiency.

1. Introduction

The energy demand is significantly increasing day by day around the globe in present day scenarios as reported by the International Energy Agency [1]. Due to the high emission rates from burning fossil fuels to meet the energy demand, alternative renewable energy resources are necessary, especially wind, solar and hydropower [2,3,4]. Hydropower has an advantage over wind and solar energy because it requires less capital cost and does not require additional storage capacity due to the variability of supply with time. Hydropower is not only sustainable but also ecofriendly [5]. It is one of the oldest sources of clean energy production and the overall worldwide installed electrical power capacity from all hydro sources, including small and large rivers and ocean power, rose from 820 GW in 2005 to approximately 1292 GW in 2018, which accounted for almost 16.4% of the renewable energies [6]. A recent survey shows the trend towards the hydropower in terms of newly installed capacity of hydropower projects across the globe. The results of this survey are shown in Figure 1.
A high density of population exists in urban areas which are connected to grid electricity while in rural and remote areas the population density is low, and connecting them to grid electricity is very costly [7]. Around 850 million people worldwide have no access to electricity, with 92% of this population living in rural areas. In Pakistan almost 29.21% of the population has no access to electricity, 95% of this population in rural areas. Pakistan receives a large volume of inflows from the Indus River basin, Jhelum River, Chenab River and Kabul River, but due to a lack of proper hydro management, a maximum quantity of the water flows to the Arabian Sea. Moreover, the irrigation system of Pakistan is approximately 58,000 km long, which provides potential sites for small and pico hydro power projects. The total approximate hydro potential of Pakistan is 60 gigawatt (GW), in which provinces of Khyber Pakhtunkhwa, Gilgit Baltistan, Punjab, Azad Jammu Kashmir and Sindh contribute 25 GW, 21 GW, 7.3 GW, 6.5 GW and 0.193 GW, respectively, and the overall small hydro power capability is almost 2000 megawatt (MW) [8]. Large power projects create conflict due to the environmental considerations, large capital costs and the lack of availability of locations due to domestic issues. Therefore, small and pico hydropower projects are currently considered an alternative source of energy production, especially in rural and remote areas. In addition, a report published by the World Bank reported that efficient small and pico scale hydro power systems exhibit the economical solutions for the off-grid electrification [9]. Yah et al. [10] reported that small and pico scale energy production is an option with zero emission of air pollutants for off-grid energy production in rural areas. Powell et al. [11] also reported that rural electrification system may be developed on different scales in order to fulfill the energy requirements in remote areas. The pico, micro, mini and small hydropower systems produce less than 5 kW, 5 to 100 kW, 101 to 1000 kW and 1001 to 1500 kW, respectively [12].
A waterwheel is a wooden or metal device that coverts flowing water energy into mechanical energy. These machines were initially used for various purposes such as lifting of water to high altitudes, powering a flour mill or other mixing and grinding purposes [13]. The demand for mechanical energy increased in the age of the industrial revolution, which led to the development of improved designs with greater performance and efficiency. The contribution of researchers at that time played a great role in the improvement, and three different types of waterwheels were introduced to harvest energy from flowing water in streams and convert it to useful mechanical energy. The designs were named as undershot, breastshot and overshot water wheels [13,14]. The highest efficiency was reported for the overshot waterwheels (85%) compared with the other two designs, and the undershot design efficiency was recorded from 72 to 77%. The waterwheels lost their significant attraction for research due to introduction of the hydraulic turbines. The demand for the micro and pico hydro power systems is increasing again, especially for rural electrification. Therefore, engineers and researchers are again focusing attention on improvements in waterwheel design.
Several studies have been reported on the design characteristics and physics of waterwheels [15]. Zoe Jones [15] carried out research at Heriot Watt University and reported some technical background concerning the designing of waterwheels and their mathematical and CAD models. The research reported by Denny [16] highlighted some important parameters in waterwheel design and helped to construct small models for overshot and undershot designs. Muller and Wolter also worked on the design of undershot waterwheels and presented various performance characteristics for their design [14]. In later stages, joint research was carried out by two world leading universities (University of Southampton and University of Berlin TU) in which work was conducted on a 500 mm diameter undershot waterwheel to describe its design characteristics and improve the model further [17]. In addition, a joint experimental study of undershot waterwheels was also carried out by the Energy Ministry of Iran and an Iranian research organization. This study described some performance characteristics and technical background for the designing of waterwheel [18]. Moreover, Paudel [19,20] investigated the effect of channel width and channel geometry on the performance of waterwheels and concluded that the performance is greater for reduced channel widths.
This signifies the need to design and test a small-scale hydropower system to provide a better solution for electrification of rural areas. The objective of this study is to design and experimentally test an efficient pico scale hydropower system to fulfill the energy requirements of rural Pakistan. The optimal hydropower system design for the rural areas falls in the range of waterwheels; therefore, an undershot waterwheel was designed and optimized in this study. The study began with the preliminary identification of a high-speed stream and based on the parameters of that specific stream (velocity, flow rate and dimensions of the stream) an analytical model was designed. The analytical model was transformed to CAD model using design software (SolidWorks) and then subjected to the computational fluid dynamics simulations using a computational tool (ANSYS) to optimize the model. Based on the optimized model a prototype was fabricated to validate the experimental results against simulation results.

2. Design Characteristics of the Waterwheel

The efficiency of the water wheel is given by Quaranta et al. [21] as Equation (1):
η = P o u t P i n = P i n P l o s s e s P i n = 1 P l o s s e s P i n
where losses include power losses during impact, power losses due to blades at the tail race, losses due to friction at the shaft support, losses during rotation such as side leakages and hydraulic losses (friction bed and turbulence losses). This study shows that impact and hydraulic losses are the major losses that affect the efficiency of waterwheels. The impact losses depend upon may factors such as the geometry of blade, the interaction of the stream with the blade, the immersion depth of the blade in the water stream and the angle of attack of the water stream on the blade. In the present research study, all these parameters of impact losses were considered to optimize the design. The number of blades on the rim and the diameter of the wheel were kept constant.
One of the traditional approaches to improvement in turbine performance is the continuous experimentation by manufacturers to meet satisfaction of the customers; however, this approach is very time consuming, costly and requires great attention. It is very difficult to identify the performance characteristics of the turbines using conventional practices in the modern competitive market [22]. The introduction of computational fluid dynamics (CFD) and modern simulation techniques makes the optimization of turbine performance faster, easier and more cost-effective than traditional approaches. The impact losses can be minimized to a great extent through CFD simulations and modeling [23,24]. Pujol et al. [25] also reported that the blade geometry, variation in the immersed depth of the blade and the angle of attack of water stream on the blade have a greater impact on the efficiency of the waterwheel. M. Ahmad et al. [26] also investigated the effect of vegetation in the floodplains in the compound channel; their results show that the flood velocities are reduced significantly due to the resistance offered by the floodplains. After an extensive literature review, these three most important parameters were taken into consideration in this research to carefully analyze the waterwheel both by numerical simulations and experimental methods. The results from both these methods were validated by comparison with each other. This works contributes to the knowledge of waterwheel design through its analysis of a high-speed turbine at different tip speed ratios (TSR) with a smaller fixed diameter of 546 mm. Three basic blade profiles were considered for analysis to identify a blade geometry that has greater performance characteristics and were tested for various immersed depths in the stream and different angles of attack of the stream.

3. Methodology

3.1. Experimental Method

The experimental design greatly depends upon the available data of the stream such as flow velocity, flowrate, available head and the total hydropower potential available at the site of interest. A non-contacting velocity sensor was used to identify the actual velocity of the stream due to the complex nature of flow in the irrigation channels. The dimensions of the channel were measured and the details of the irrigation channel are given in Table 1.

3.1.1. Design Parameters

The technical background for the analytical design of the waterwheel was provided by the researchers. The analytical model was designed according to the flow conditions in the chosen irrigation channel whose design characteristics were discussed accordingly. The power output of the water wheel is defined by Cornelis et al. [27], as Equation (2):
P o u t = T     ω  
where T is the torque produced by the waterwheel and ω is the angular velocity. The torque produced is described by Shanon et.al., [28], as in Equation (3).
T = F D 2
Combining Equations (2) and (3) it can be concluded that:
P o u t = F     ω     D 2
Equation (4) indicates that by decreasing the wheel diameter, the angular velocity increases because the wheel diameter is inversely proportional to the angular velocity. Traditionally, waterwheels are considered to have large diameters, low angular velocity and high torques to maintain the power generating capacity of the wheel. This is because waterwheels are designed for shallow water flows where the velocity of the flow is very low; however, handling of the larger waterwheels is very difficult at the site. In this research study, the waterwheel is tested for a smaller fixed diameter. To maintain the power generating capacity of the wheel at high angular velocity, the blade force must be increased to compensate and maintain the power generating capacity of the wheel. The blade force can be increased by using the best geometrical shape of the blade on the wheel rim that has a high impact of the flowing water. Three types of blades profiles were investigated through numerical simulations, namely C-shape, V-shape and straight blade. The best design with the greatest impact force was the C-shape blade. The C-shape blade was installed on the rim to obtain experimental results. Theoretically, the force on the blade is calculated by the relation, defined by Yelguntwar et al. [5] as given in Equation (5):
F = 0.5     C d     ρ     A w     V r 2
where F is the force on the blade, Cd is the drag coefficient for the blade geometry, ρ is the density of water, Aw is the swept area of the blade (the area that is immersed in the water) and Vr is the relative velocity of the blade to the flowing water. This equation is valid when the Reynolds number is greater than 3000 for the flow i.e., (Re > 3000). The drag coefficients for the three chosen blade shapes, which were calculated from the numerical results and validated with the available literature of immersed bodies as described by Pritchard et al. [29], are given in Table 2.
The power output for the wheel is also equal to the product of the moment of inertia, the angular velocity and the angular acceleration, as defined by Yassi et al. [18] and given in Equation (6).
P o u t = m   · r 2 2 · α   ·   ω
There is an inverse relation between the mass of the waterwheel and its angular velocity as indicated by Equation (6). The mass of the waterwheel has an effect on its performance. Another research gap to be filled is to find the critical mass for the waterwheel that makes it more efficient.
The aspect ratio is the ratio of the depth of the blade immersed in water to the radius of the waterwheel as defined by Hamed et al. [30], and given in Equation (7). Aspect ratios in the range of 0.25 to 0.5 produce optimal results for undershot waterwheels, as reported by Yan et al. [31].
A s p e c t   R a t i o = d e p t h   o f   t h e   b l a d e   i n   w a t e r   r a d i u s   o f   t h e   w h e e l  
The width of the blade is determined by using the formula for the width of the waterwheel. It is defined by Zaman et al. [32] as given in Equation (8).
B   = Q V ɛ d
When designing the shaft, it is necessary to determine the minimum diameter required for the rotor under operation without failure. Two forces act on the shaft (one by the weight and second by the hydraulic system). The shaft is designed according to energy distortion theory (von Mises Theory) as defined by Shigley et al. [33] and given in Equation (9), where M is the bending moment, T is the torque on the shaft, d is the shaft diameter, Sy is the yield strength and n is the factor of safety.
S y   n = ( 32 M π d 3 ) 2 + 3 16   T π d 3 2  
To evaluate the performance and characteristics of a turbine by varying its angular velocity, a non-dimensional parameter known as the tip speed ratio (TSR) is used, which is denoted by λ in Equation (10). It is the ratio of the peripheral velocity of the turbine to the speed of the flowing water as defined by Nasir Mehmood et al. [34], where R is the radius of the waterwheel, ω is the angular velocity of the wheel and V is the velocity of the flowing water.
λ = R ω V  
There is a close relation between the turbine efficiency and TSR. Therefore, in this research study, the turbine was tested for different TSR values by fixing the number of blades, outer diameter and velocity of the flowing water while varying the angular velocity of the turbine. The power coefficient is the ratio of the power output of the turbine to the power available in stream as defined by Nguyen et al. [35] and given in Equation (11), where T is the shaft torque obtained, ω is the angular velocity of the turbine, ρ is the density of water, Aw is the swept area of the blade (projected area of the blade immersed in water sheet) and V is the velocity of the flowing water.
Cp = T ω 1 2 ρ A w V 3

3.1.2. Analytical Model

A Computer Aided Design (CAD) was designed based on the analytical model, as shown in Figure 2, and was composed of the waterwheel, supporting frame and adjusting rod which helps to submerge the rotor in the irrigation channel. A preliminary static analysis of the turbine using AISI-1020 material with a yield strength of 3.51 × 10⁸ N/m2 was conducted before fabrication of the turbine. The data for the static analysis was obtained from the analytical model. The waterwheel was fabricated with mild-steel material and the design parameters are presented in Table 2. The data is dependent on the irrigation channel dimensions and the available flow in that channel, which is considered in this research to utilize the maximum inflow of hydropower. The blade width is considered equal to the width of the water channel by maintaining a side clearance that allows for smooth rotation of the waterwheel. An analytical model was created using the equations provided in Section 4.2 including these parameters. The other parameters were obtained by instruments including a tachometer, a non-contacting velocity sensor and the dimensions of the irrigation channel. The fabricated model of waterwheel installed at the site is shown in Figure 3a.

3.1.3. Test Facility

The experiment was performed on an open channel in the Sawabi district located in the KP Province of Pakistan. The channel details are described in Table 2. Microflow is a non-contacting velocity sensor which was installed on the channel to measure the velocity of the flowing water. The microflow was installed at 45° to the water surface in the channel at a height of 1 m as shown in Figure 3b. A dBMACH3 transducer with an accuracy of ±1 mm was installed on the channel and both the transducer and Microflow were connected to a FlowCERT. The FlowCERT is a tool which converts the signal from the transducer and velocity sensor to digital data. The velocity and flowrate data were recorded every one minute. A total 20 readings were taken and their average value was calculated. The average velocity and flowrate were recorded as 4.1 m/s and 0.77 m3/s, respectively. The flowrate through the turbine swept area was recorded as 0.26 m3/s. The waterwheel was installed in such a way that the blades were fully submerged in water (submerged by 4 inches). An ONOSOKKI MP-981 sensor was used to measure the angular velocity of the rotor. The digital indicator used to record the RPM value was a SENSTECH DI-130 indicator. An eddy current dynamometer with precision range of less than ±0.001% was used to measure the torque of the waterwheel when it reached full speed condition. The schematic diagram of the system is given in Figure 4.

3.1.4. Test Procedure

The waterwheel was tested as an undershot wheel, and it was provided with the natural flow and head of the selected irrigation channel. The flowrate and head at the channel were kept purely natural. Initially, the waterwheel was immersed in the flowing water to a depth of four inches (fully immersed blades) with the help of the lifting rod, and the turbine was run for 10 min. The turbine was tested for various immersed depths of the blades ranging from 0 to 4 inches while keeping the head, flowrate and velocity constant. The turbine was initially run at an immersed depth of 4 inches and then a brake was applied until the turbine speed reached zero. Readings of torque were recorded for each step, and the same procedure was adopted for other immersed depths. The output parameters such as the force on the blade, angular velocity, power output of the turbine and its efficiency were calculated. After completion of the experiments for all the varying immersed depths, the blades were once again immersed to 4 inches and the turbine was tested as an undershot water wheel. However, this time the turbine was connected to a 3 kilowatt (kW) electrical generator, and the voltage and current were measured at full load conditions. Lastly, the power output and overall efficiency of the system were calculated. The electrical load consisted of three bulbs of 100 W each, two stand fans of 120 W each, and 1 kW cutting machine.

3.2. Computational Fluid Dynamics (CFD) Method

Three-dimensional CAD models of the turbine were imported into the Ansys Space Claim tool to obtain 2D sections of the turbine for computational fluid dynamics (CFD) or numerical analysis. The rotating domain and the stationary fluid domains were constructed. The turbine performance characteristics were analyzed using Ansys software; however, due to complex nature of the turbine and the outer domain, meshing was performed using the ICEM CFD tool. A tetrahedral patch independent mesh was applied to the turbine with a prism layer on the blades for the boundary layer. To study mesh independence, a turbine with a C-shape blade with a TSR of 0.95 was selected. The outer fluid domain (calculating domain) was constructed using Ansys Space Claim with an upstream field five times the turbine dimeter (5D), while the downstream field was eleven times the turbine diameter (11D) from the center of the turbine. In the upward direction the fluid domain was sketched to four times the turbine diameter (4D). The turbine performance characteristics were analyzed using Ansys Package 19.1. Though flow 3D is used for aeration, cavitation and sediment tracking but for the analysis of a hydraulic machine, visualizing its performance volume of fraction (VOF) model in Ansys provides satisfactory results; thus, Ansys VOF modeling was carried out in this study [36].

3.2.1. Numerical Design Model

The turbine size used for the simulation was the actual turbine size and the center of the turbine was set to the origin (0,0,0). The design was divided into two domains (rotating and stationary domain). The rotating domain consisted of the turbine geometry and inner interface, and the stationary domain consisted of the inlet, outlet, bottom wall, outer interface and atmospheric outlet. Both the stationary and rotating domains were connected through the inner and outer interfaces. The rotating domain was rotated with a given angular velocity value with respect to the stationary domain. Separate outer domains were constructed with inclination angles of 15°, 30°, 45°, 60°, 75° and 90° to evaluate the performance characteristics of the turbine at different inclination angles of water conduit. The water stream strikes the blades at different angles when the water conduit is subjected to a certain angle of inclination. The inclined outer domain was similar to the spillway design of dams.

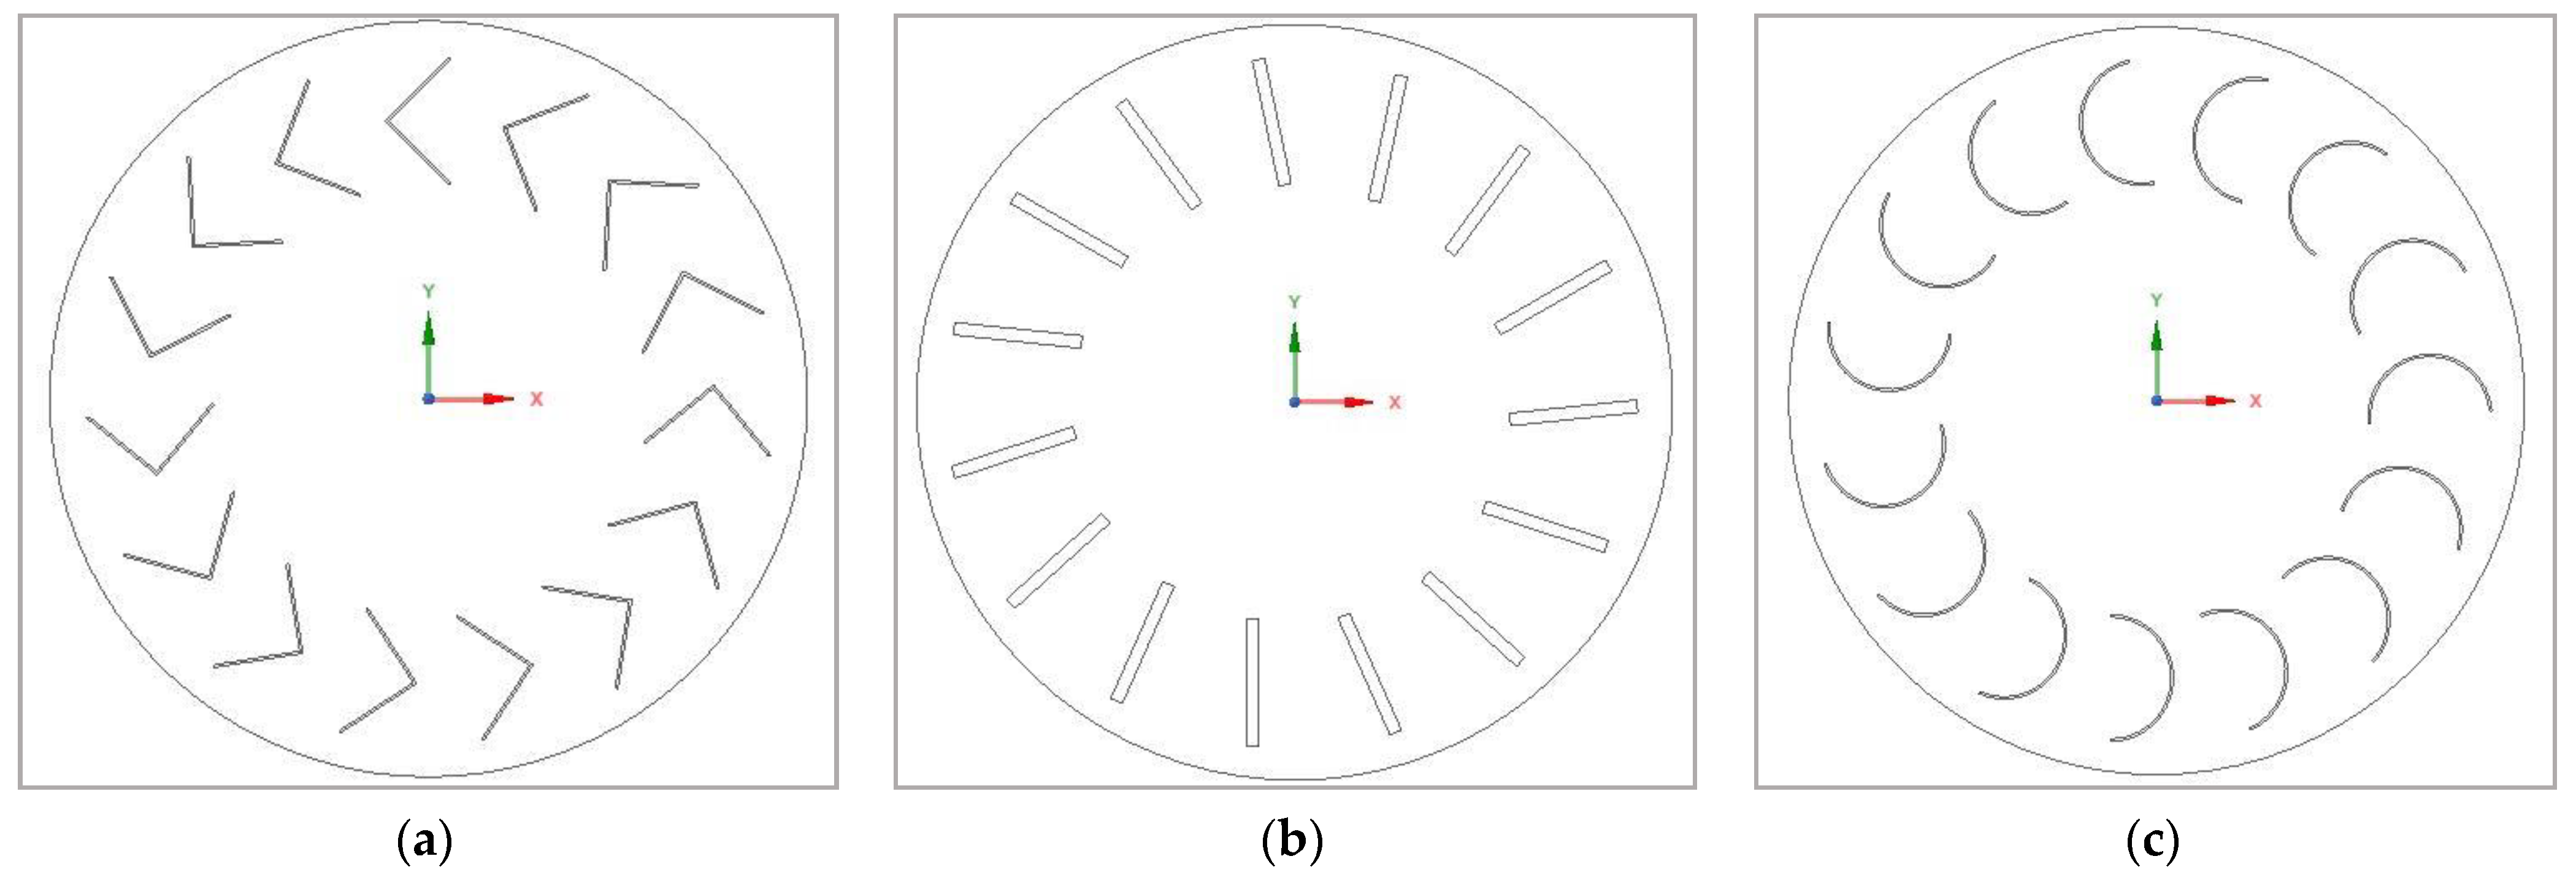
3.2.2. Blade Profiles

Three different blades profiles, including C-shape, V-shape (triangular profile) and straight blade profiles, were investigated by CFD simulations to study the characteristics and features of each geometry to identify the best geometry profile for the design. All the three profiles were simple shapes which can be easily fabricated by local fabricators in remote areas at a very low cost. The shape of each profile as a two-dimensional geometry is shown for the V-shape, straight blade and C-shape in Figure 5a–c, respectively.

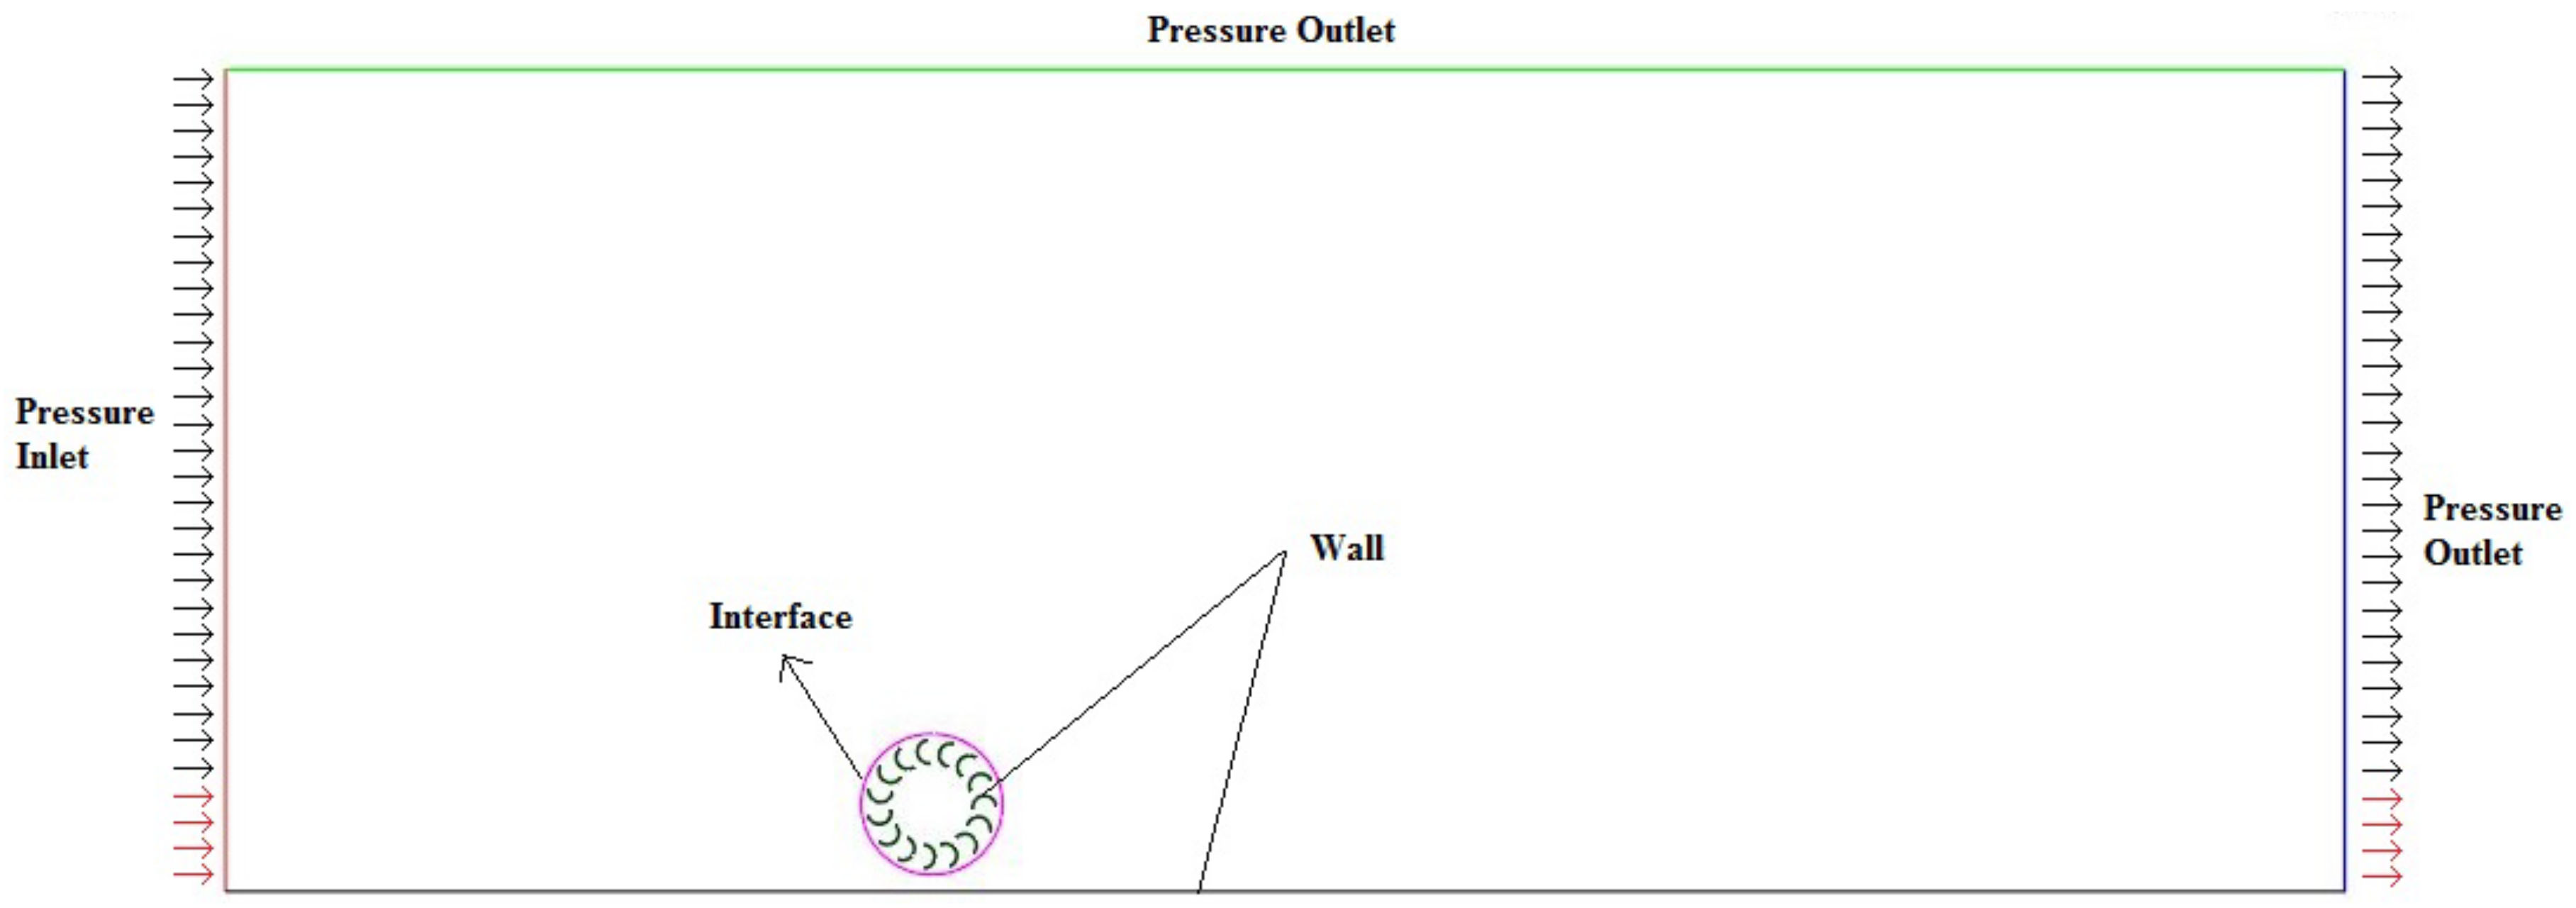
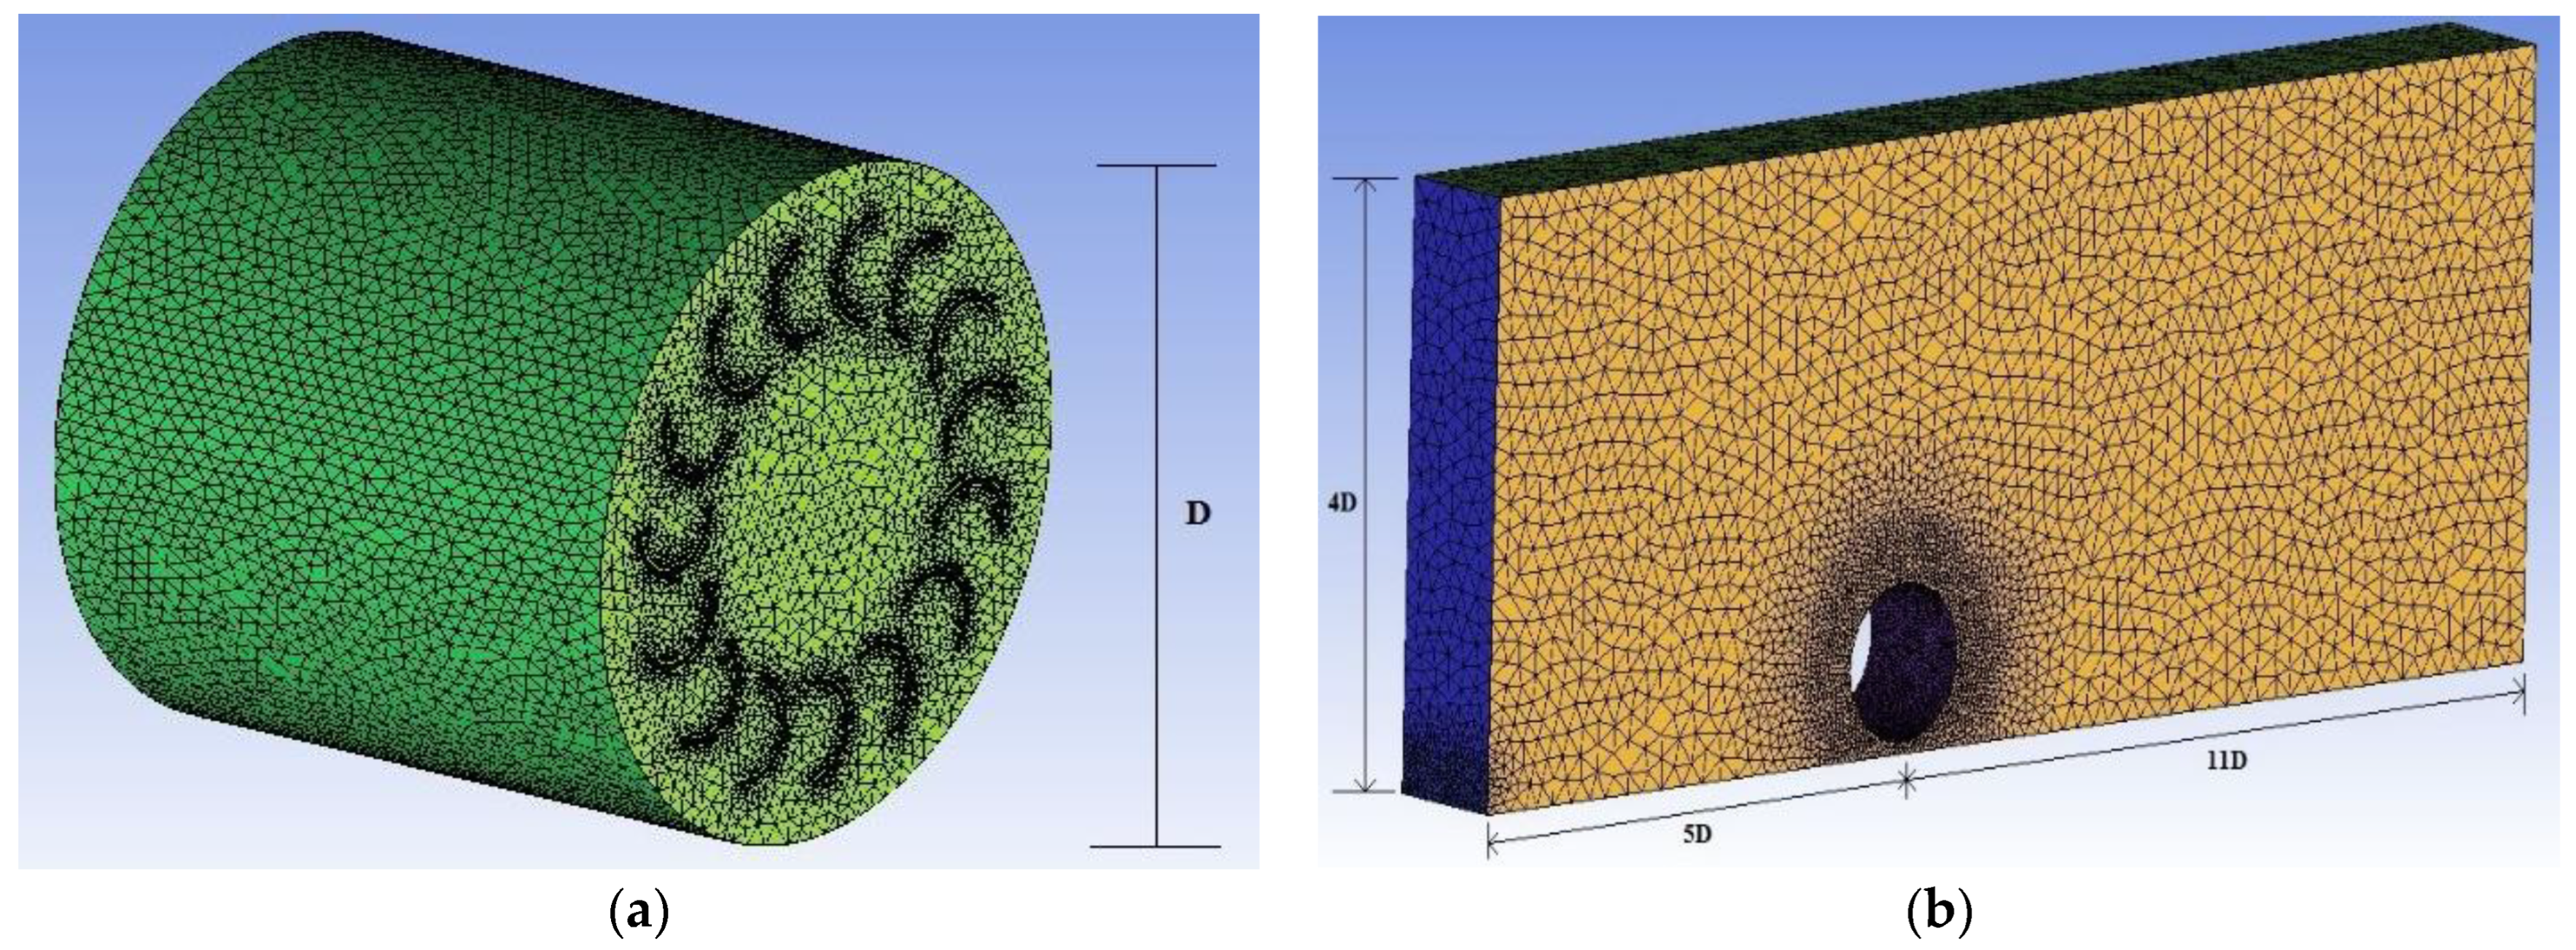
3.2.3. Mesh Setup and Boundary Conditions

The mesh was set for each case study using the ICEM CFD tool. A tetrahedral patch independent mesh was applied to both the domains (stationary and rotating domain). The inner-interface element size was taken as 0.015 m, whereas the element size near the blade was taken as 0.001m with a prism layer for the boundary layer near the blades. The element size was taken as 0.1 m at the inlet, outlet, ground bed and atmospheric outlet for the outer domain, and at the outer-interface, a density box was created with element size 0.015 m, ratio 1.2 and growth value of 3. Furthermore, two more density boxes in the stationary domains were created at an upstream field and downstream field with an element size of 0.06 m, ratio of 1.2 and growth value of 2. For both the stationary and rotating domains, fluid bodies were created in the mesh and assigned the names fluid-outer and fluid-inner, respectively. The boundary conditions were assigned to the respective regions in the ICEM CFD tool before exporting the meshes. For the straight channel cases, only one inlet was constructed for both the air and water entering domains, whereas in the case of the inclined channel, two separate inlets were constructed (one for air and the second for water). The air inlet was provided with a boundary condition known as velocity-inlet, and the water inlet is provided with boundary condition known as pressure-inlet. The inlet velocity was set to 4.1 m/s, and the water level in the domain was set to 8 inches. The boundary conditions for the straight and inclined channels are illustrated in Figure 6.

3.2.4. Simulation Setup

The flow field was modeled by using 3D Reynolds average Navier–Stokes (RANS) equations with one continuity and three momentum equations subjected to a transient simulation. To solve these equations, turbulent viscosity was introduced due to Reynold stresses. The turbulent viscosity was modeled using a shear stress transport (SST) k-ω model which precisely predicted the turbulence and the formation of vortices on the surface of the blade. Therefore, two more equations were solved: one for k and the second for the angular velocity (ω) to determine the turbulent viscosity. The only driving force is the force of gravity in an open channel flow problem; therefore, gravity was applied in the z-direction by setting its value to −9.81 m/s2. The volume of fluid model (VOF) is applied with an open channel flow as an explicit formulation for the straight channel case studies. The courant number adopted by default was 0.25, whereas for the inclined channel case studies, the volume of fluid model was applied with an open channel flow as an implicit formulation and implicit body force. The number of Eulerian phases were selected as two for both the straight channel and inclined channel cases. Two materials were selected for the two phases (the first phase was taken as the primary phase with air as the fluid, while the second phase was taken as a secondary phase with liquid-water at 25 °C as the fluid). The rotating domain was given an angular velocity according to the desired case under cell zone conditions. The solution method adopted was the Pressure-Velocity Coupling PISO scheme with a spatial discretization PRESTO scheme. Two different types of schemes were used for the discretization of the convective term in the equation for transport of the volume fraction. For the straight channel case studies, Compressive Interface Capturing Scheme for Arbitrary Meshes (CICSAM) was applied, whereas for the inclined channel case studies, the Modified High-Resolution Interface Capturing Scheme (Modified-HRIC) was applied. The turbulent intensity was taken as 5%, and the turbulent viscosity ratio was set to 10. The time step was chosen as 2 × 10⁻⁵ s for the straight channel explicit scheme, whereas time step was set to 2 × 10⁻³ s for the inclined channel implicit schemes. The maximum iterations per time step was set at 20, and a step function was used to identify volume fractions of water and air in the computational domain. The step function was defined as VFs = Step (dwy), where dw is the water depth and y is the height parameter for the computational domain. According to this expression, when ydw, the volume fraction is water but when y > dw, the volume fraction is air in the domain. The results obtained for the numerical method were compared with the results of experimental method.

4. Results and Discussions

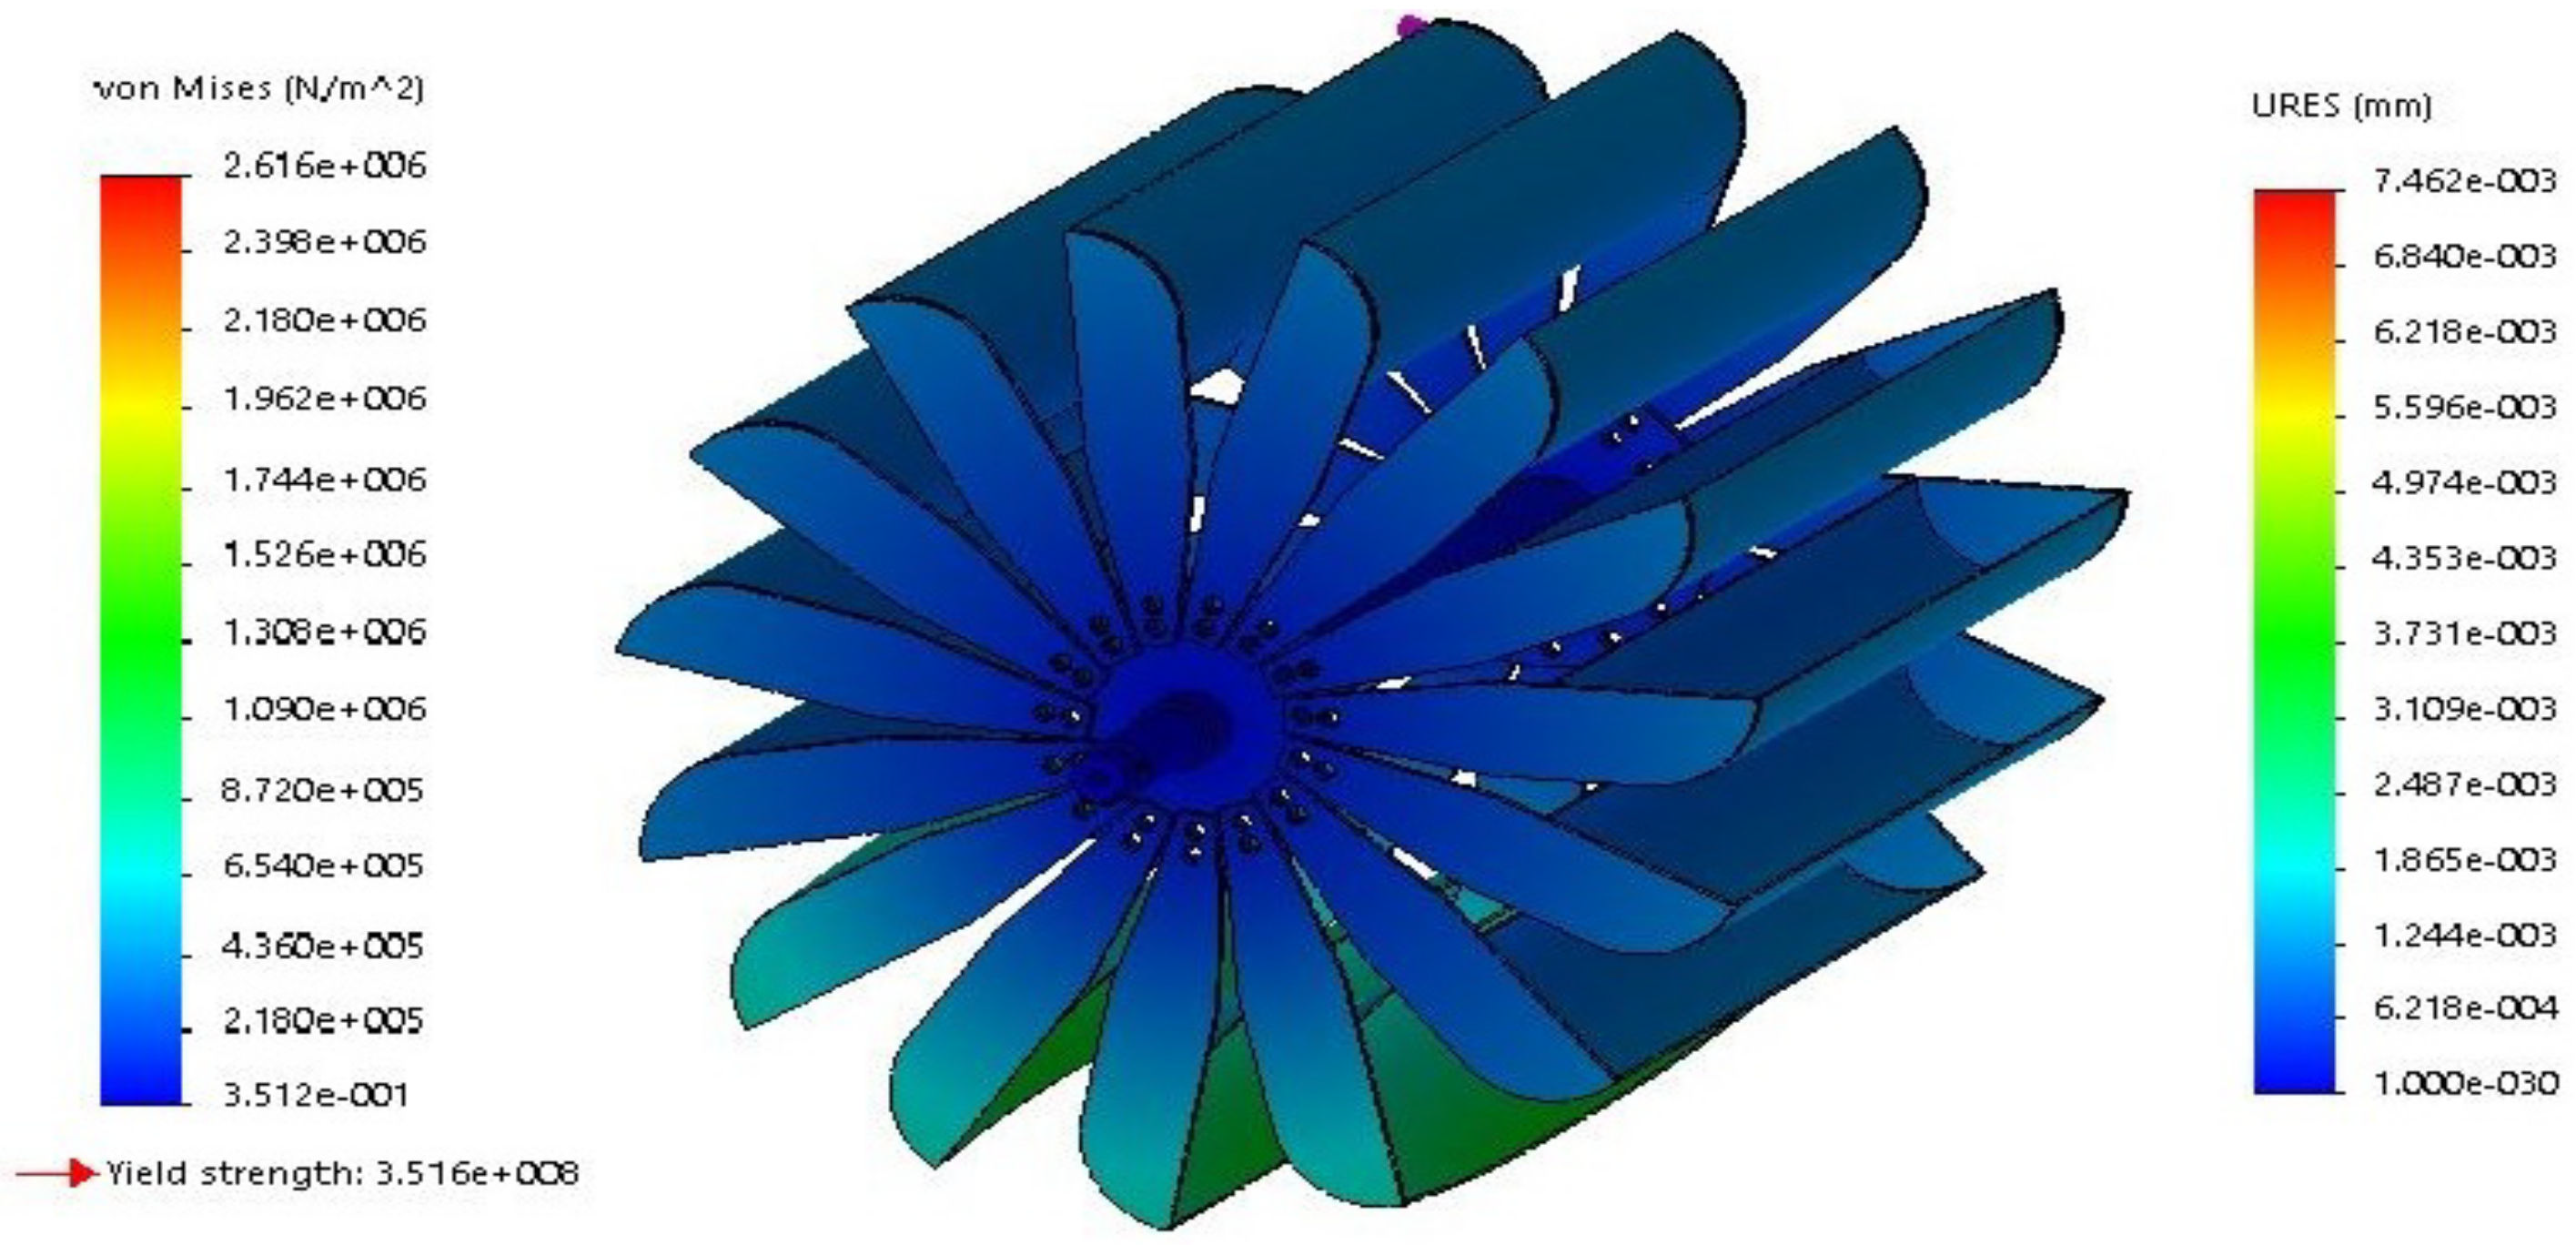
4.1. Preliminary Static Analysis
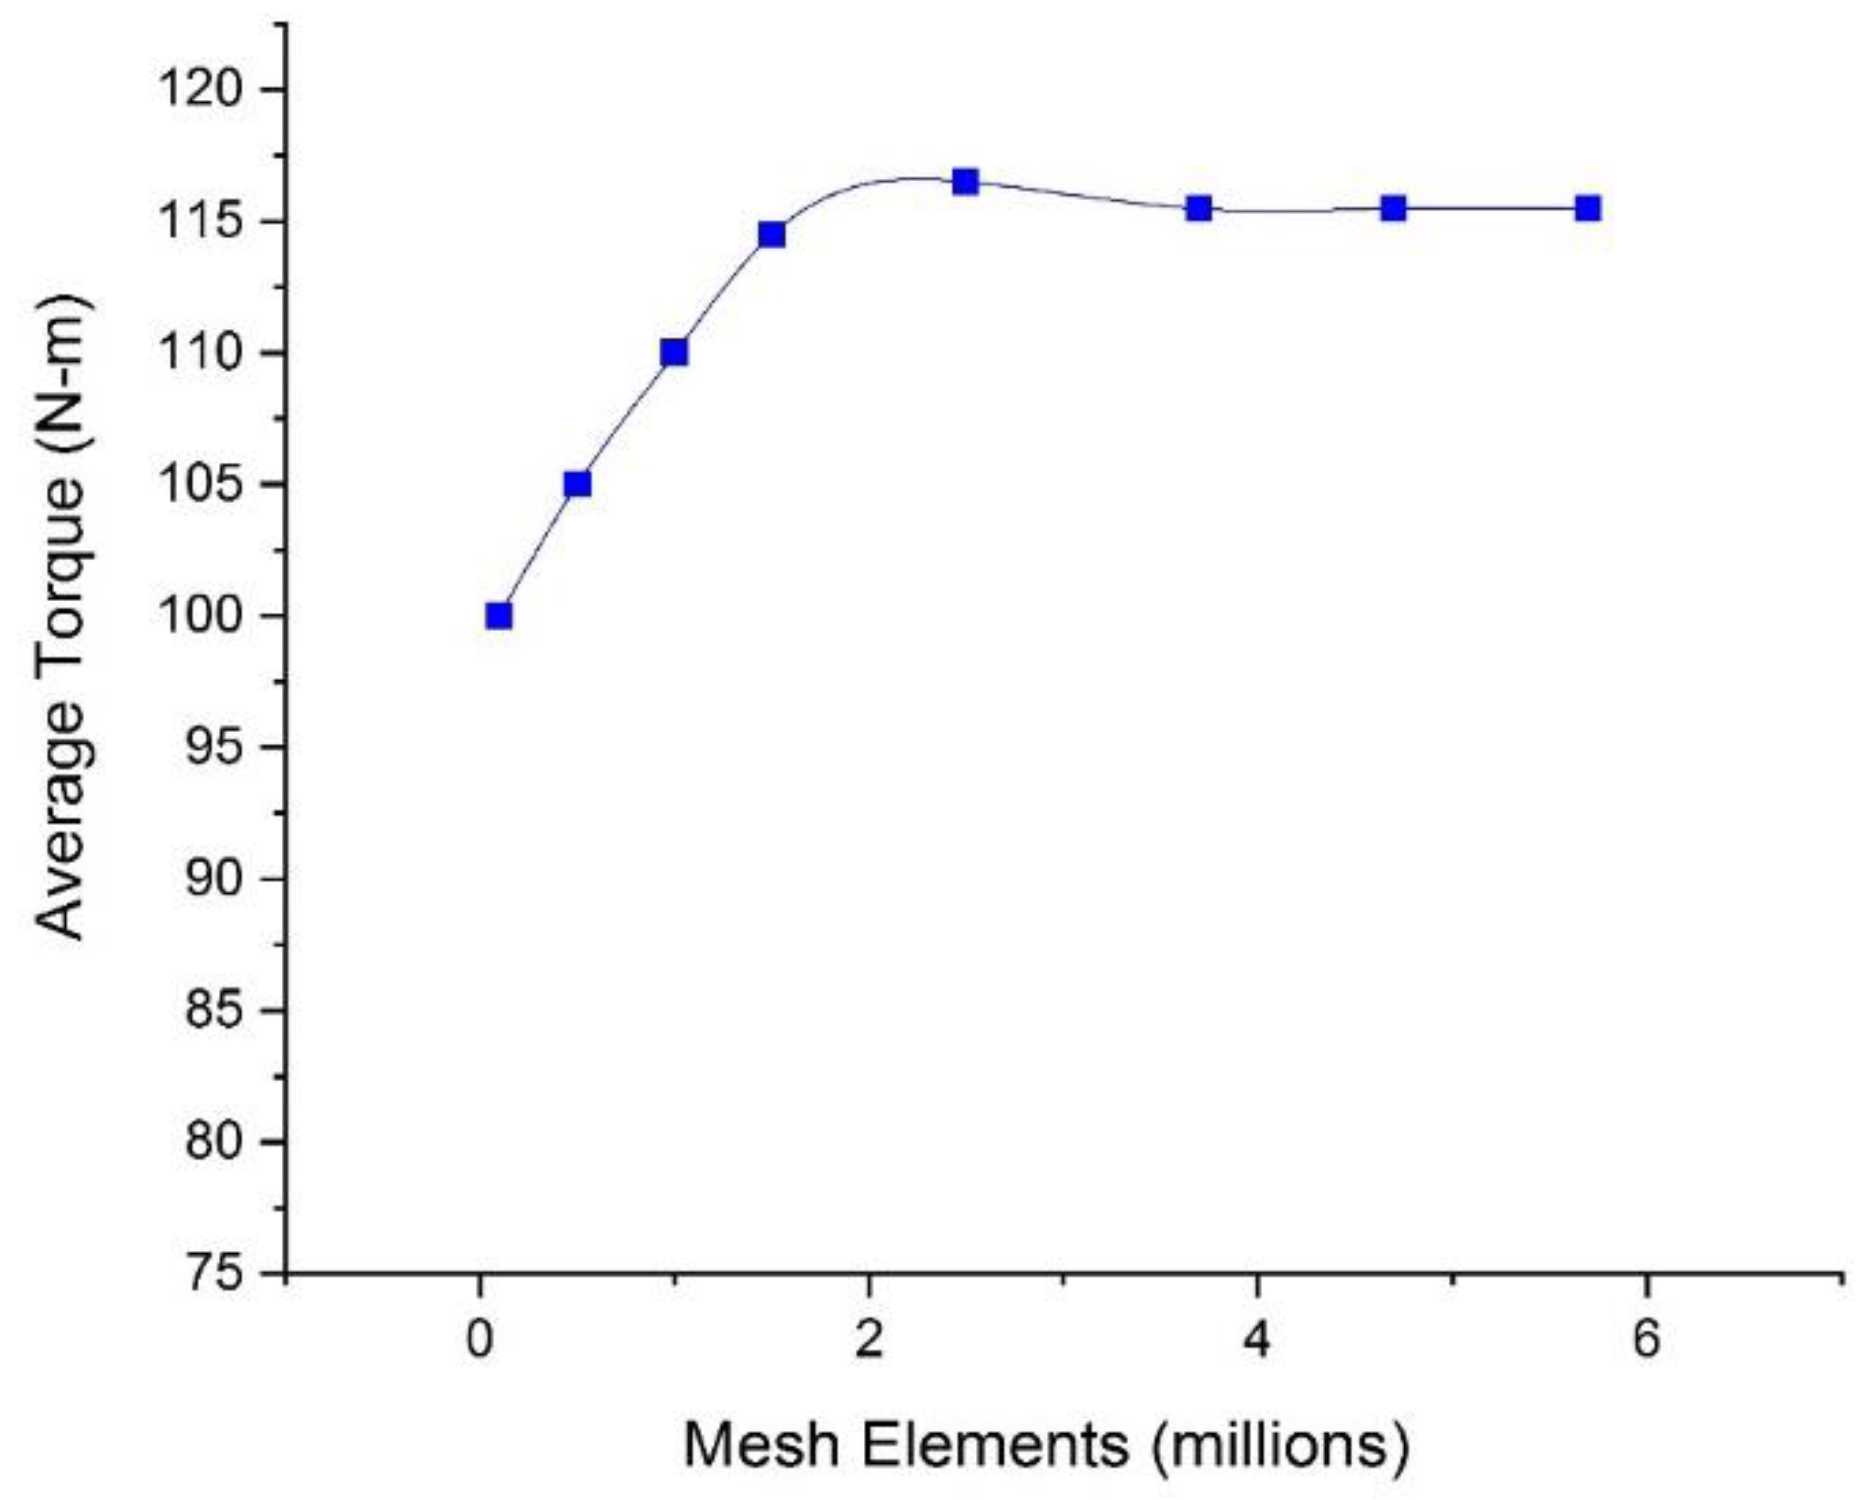
The static analysis was carried out based on the analytical model data. The results of the static analysis for the turbine in terms of deformation and von Mises stresses are presented in Figure 7. Blue indicates the minimum stresses and deformations, and red indicates maximum stresses and deformations. The maximum stresses occurred on the tip side of the blades where the water jet strikes, whereas the minimum stresses occurred at the shaft axis. The deformation recorded is 4 mm on the blades if the force on the blades exceeds the allowable limit. The yield strength of the selected material is 3.516 × 10⁸ N/m2, which is substantially higher than the highest von Mises stresses. Therefore, it is concluded that the material of the turbine is safe and can be used for further experimental and numerical analysis.

4.2. Mesh Criterion

The meshing of the turbine with the C-blade was designed using the ICEM CFD tool. A tetrahedral patch independent mesh was created for the turbine with a prism layer on the blades for the boundary layer. The turbine performance in terms of average torque against mesh elements, a mesh independent test, is shown in Figure 8. The average torque of the turbine increases initially by increasing the mesh number of elements. The grid number above 3.7 × 10⁶ elements shows that the average torque of the turbine remains constant above this number of mesh elements. Therefore, 3.7 × 10⁶ elements was chosen for all the turbines to perform testing in this research study. Moreover, the results show that the turbine attains a stable state at 4.6 s when it completes 11 revolutions. The flow and all monitoring parameters become stable when the waterwheel completes 11 revolutions; hence, all the parameters were exported above the stable state. The outer domain and 3-D refined meshing of the rotating domain are shown in Figure 9a,b, respectively. The mesh is refined by increasing the number of nodes near the target locations in the body to achieve high accuracy output results. However, this process increases the required computational power; therefore, to perform a mesh independent case study is a feasible solution to save time and computational power. The mesh is refined near the geometry of the blades in the outer domain meshing of the turbine, and similarly, the same is the case for the area near the turbine in the 3-D rotating fluid domain; the purpose of this is to achieve high accuracy in results at the target locations.

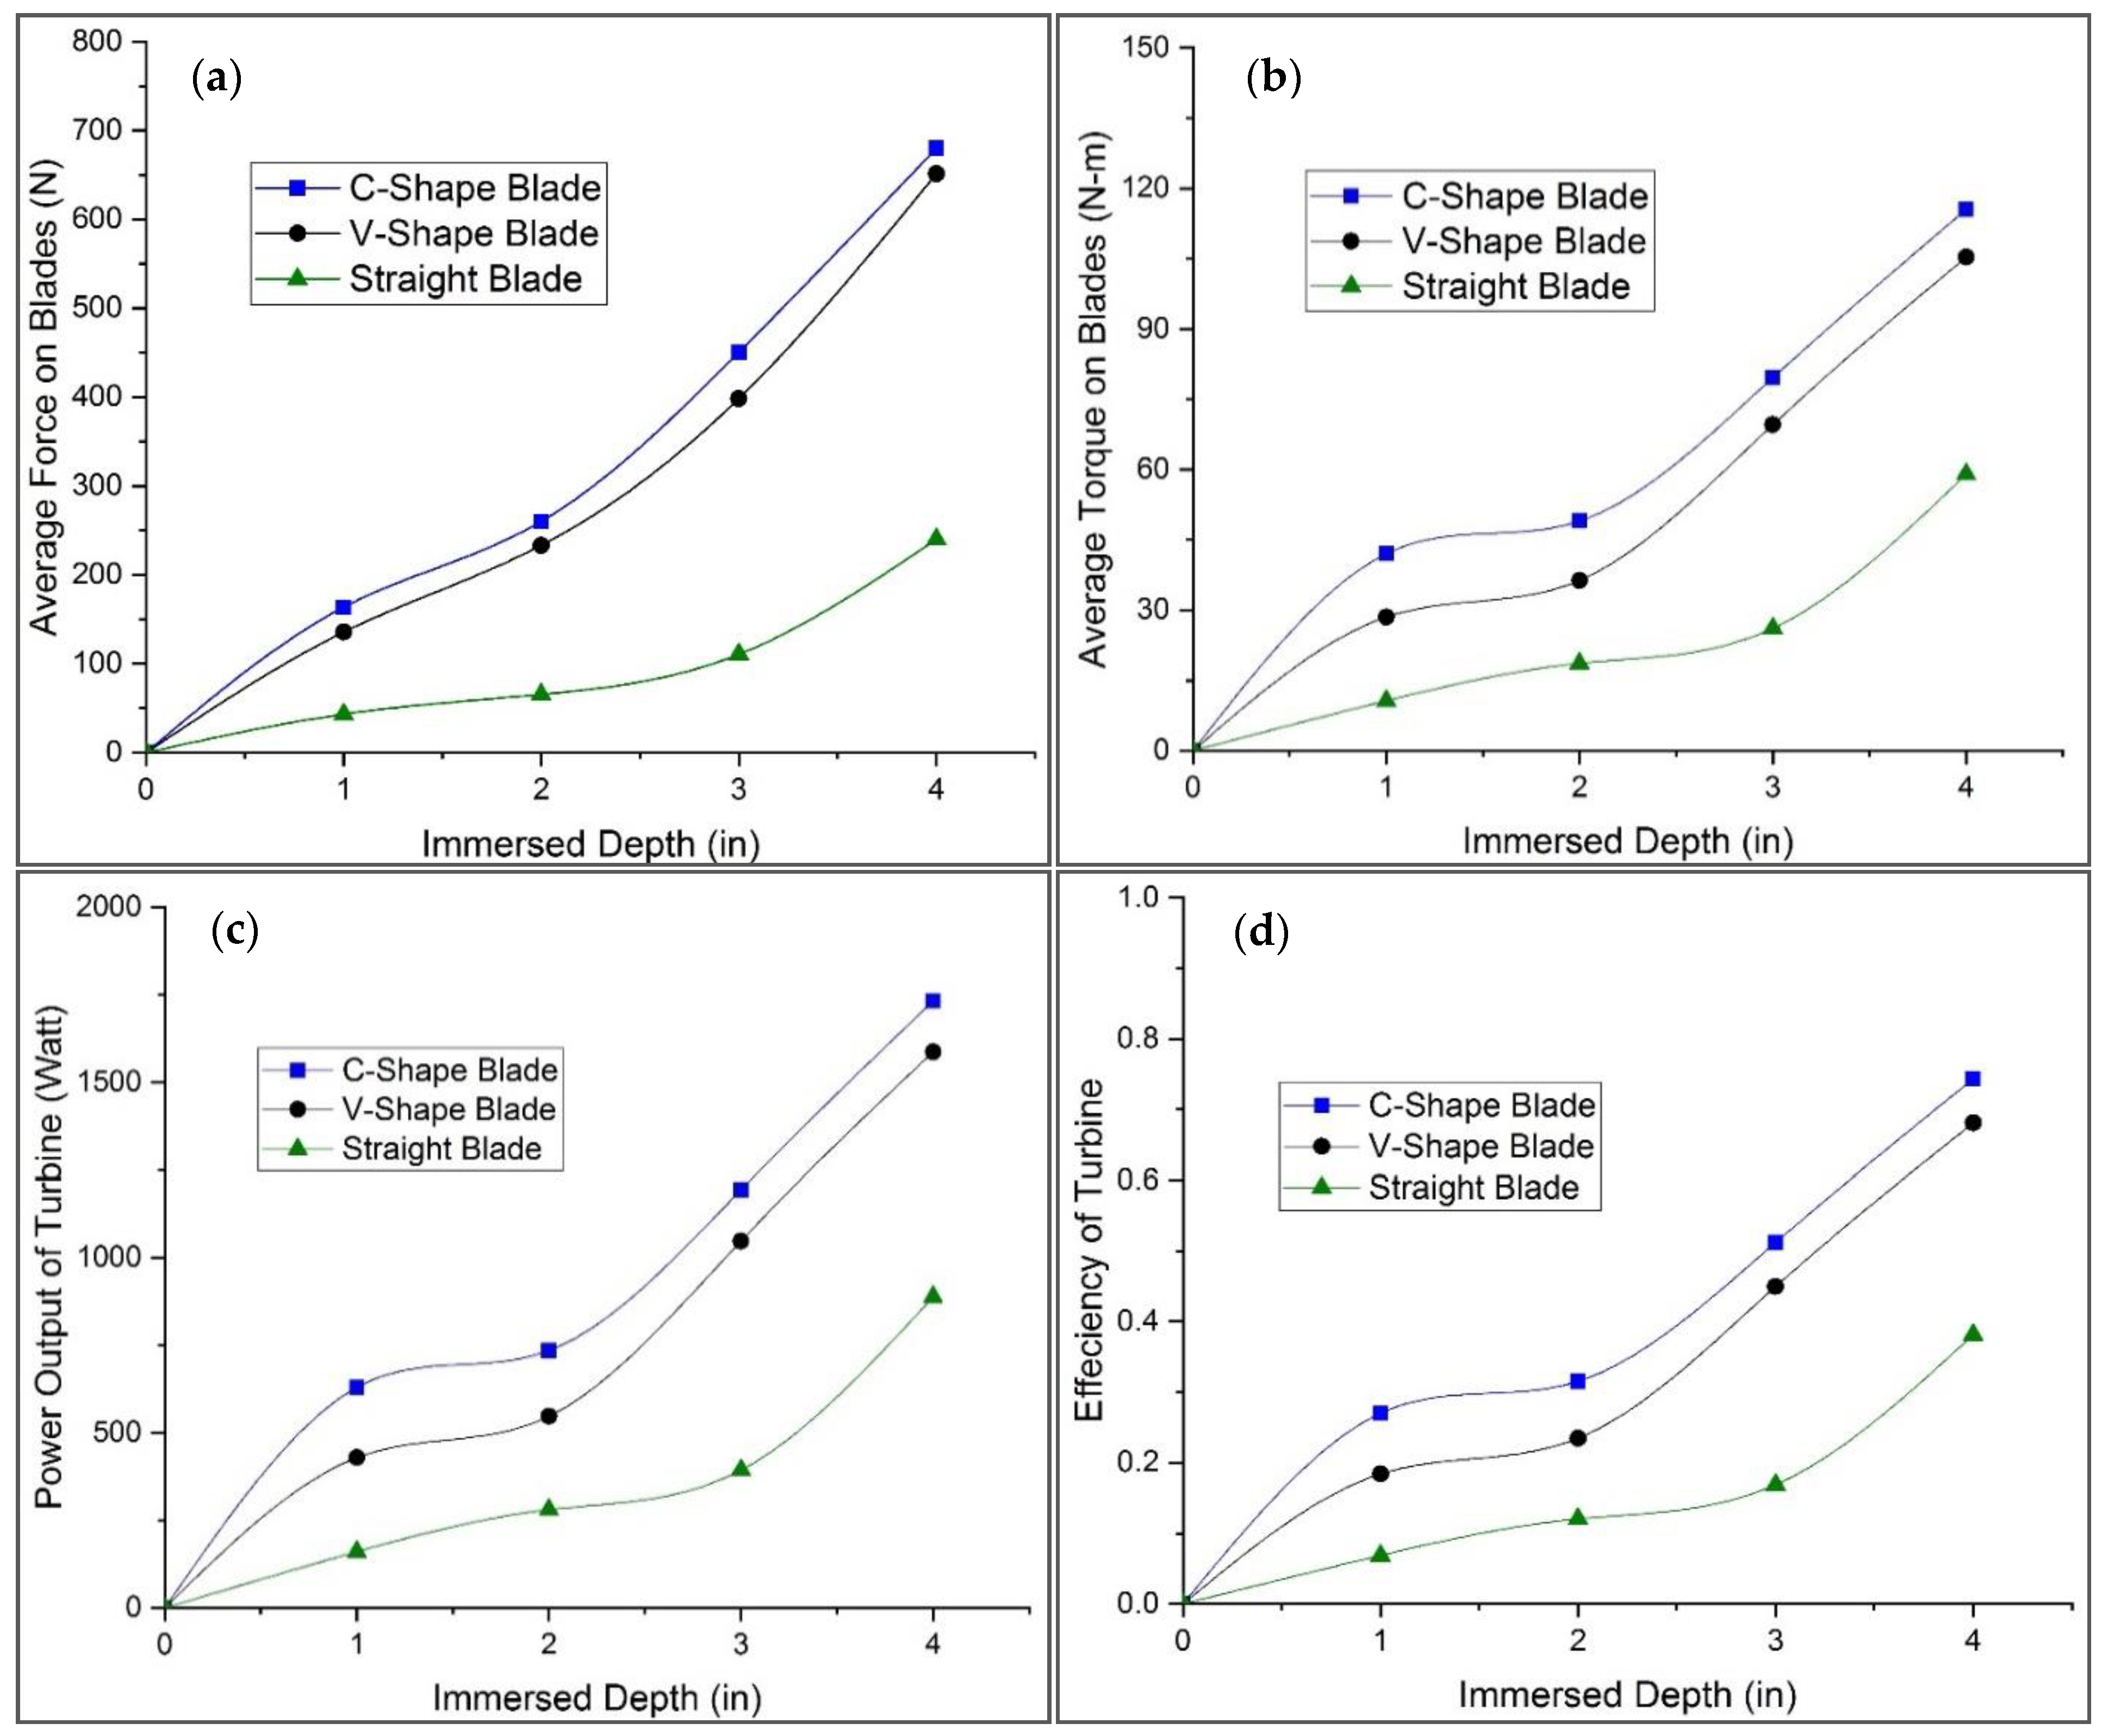
4.3. Immersed Depth Variations

The performance comparison of the same turbine with three different blade profiles was conducted to find the most suitable shape of the blade for waterwheel design. The four parameters (average force, average torque, power output and efficiency of the turbine) were selected for performance evaluation of these three blade shapes for the turbine. The average force acting on the three blade profiles, average torque produced by the blade profile, power output and the efficiency of the turbine against variations of immersed depth are shown in Figure 10a–d, respectively. The values for each parameter are increased by increasing the immersed depth. The results of the simulation reaching to the stable state show that the torque on the runner increases to the highest value when the blade of the turbine interacts with the flowing water stream and then decreases as the blade approaches leaving the stream surface. The monitoring parameters set for the analysis were force on the blades and torque on the shaft. Both the parameters start to oscillate around the average values of the monitoring parameters. The average force acting on the three-blade profile at different immersed depths, the corresponding average torque, power output and the efficiency of the turbine show that the C-shape blade experiences larger hydrostatic forces and has excellent performance characteristics compared with the V-shape and straight blade profiles. The highest efficiency (74.35%) was achieved by the C-shape profile of the blade, whereas for the V-shape and straight blade, efficiencies were recorded as 68.12% and 38.15%, respectively. The straight blade profile has high impact losses compared with the C-shape and V-shape profile blade. Overall, based on these results, it is concluded that the C-shape blade profile is the most suitable shape for the waterwheel design, followed by the V-shape blade profile.

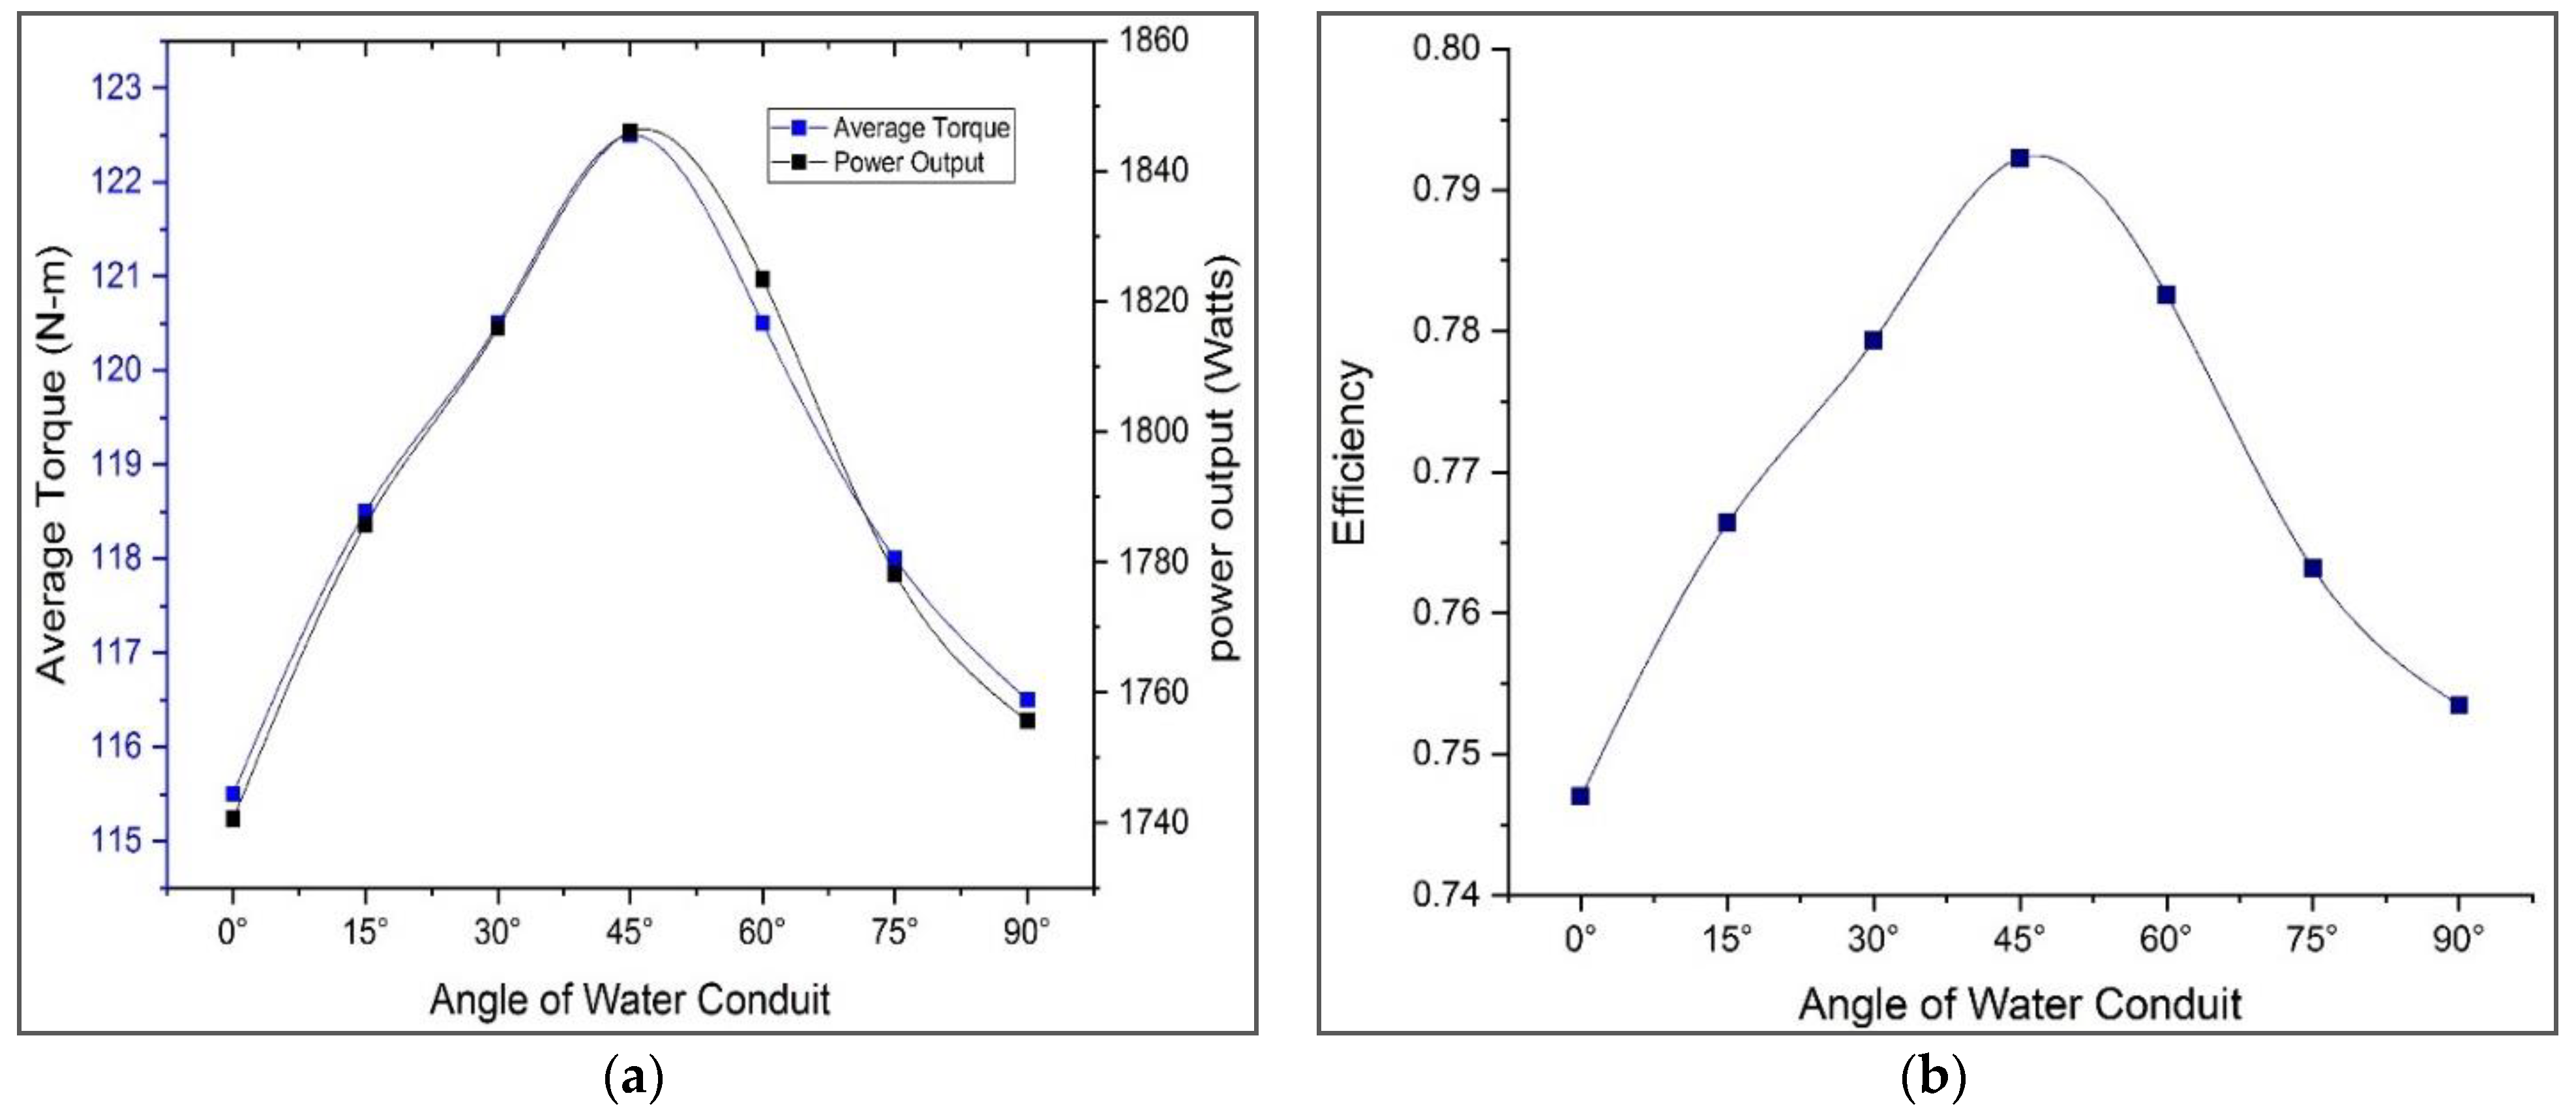
4.4. Variations in Water Conduit Angle (Changing Angle of Attack)

The turbine with a C-shape blade profile was selected for testing on the inclined channels by varying the inclination angle by 15 degrees. Only the C-shape blade was chosen for further analysis because it was determined as the most suitable shape for the turbine to achieve maximum power output. Three parameters (average torque, power output and efficiency of the turbine) were selected to evaluate the performance of the turbine against variation in angle of attack. The results for the output torque (power output) and the related efficiency at different inclinations are shown in Figure 11a,b, respectively. The performance of the turbine increases as the inclination of water conduit increases, reaching a maximum at θ = 45°, and then again decreases. The maximum average torque, power output and possible efficiency are noted as 122.5 N-m, 1845 W and 79.2%, respectively, at a 45° angle of conduit. The efficiency increases by 4.87% when the water conduit inclination achieves θ = 45° compared with the straight channel, for which the efficiency was recorded as 74.35%. The results further indicate that the undershot waterwheels have greater performance characteristics on the inclined channels compared with the straight channels. The waterwheel has poor performance with straight blades because it experiences a backward force on the blade due to the downstream field of the water adjacent to it when it is placed in a straight channel. Changing the angle of the water conduit helps to reduce the backward force because, due to the inclination of the water conduit, the downstream water falls behind the blade with the force of gravity.

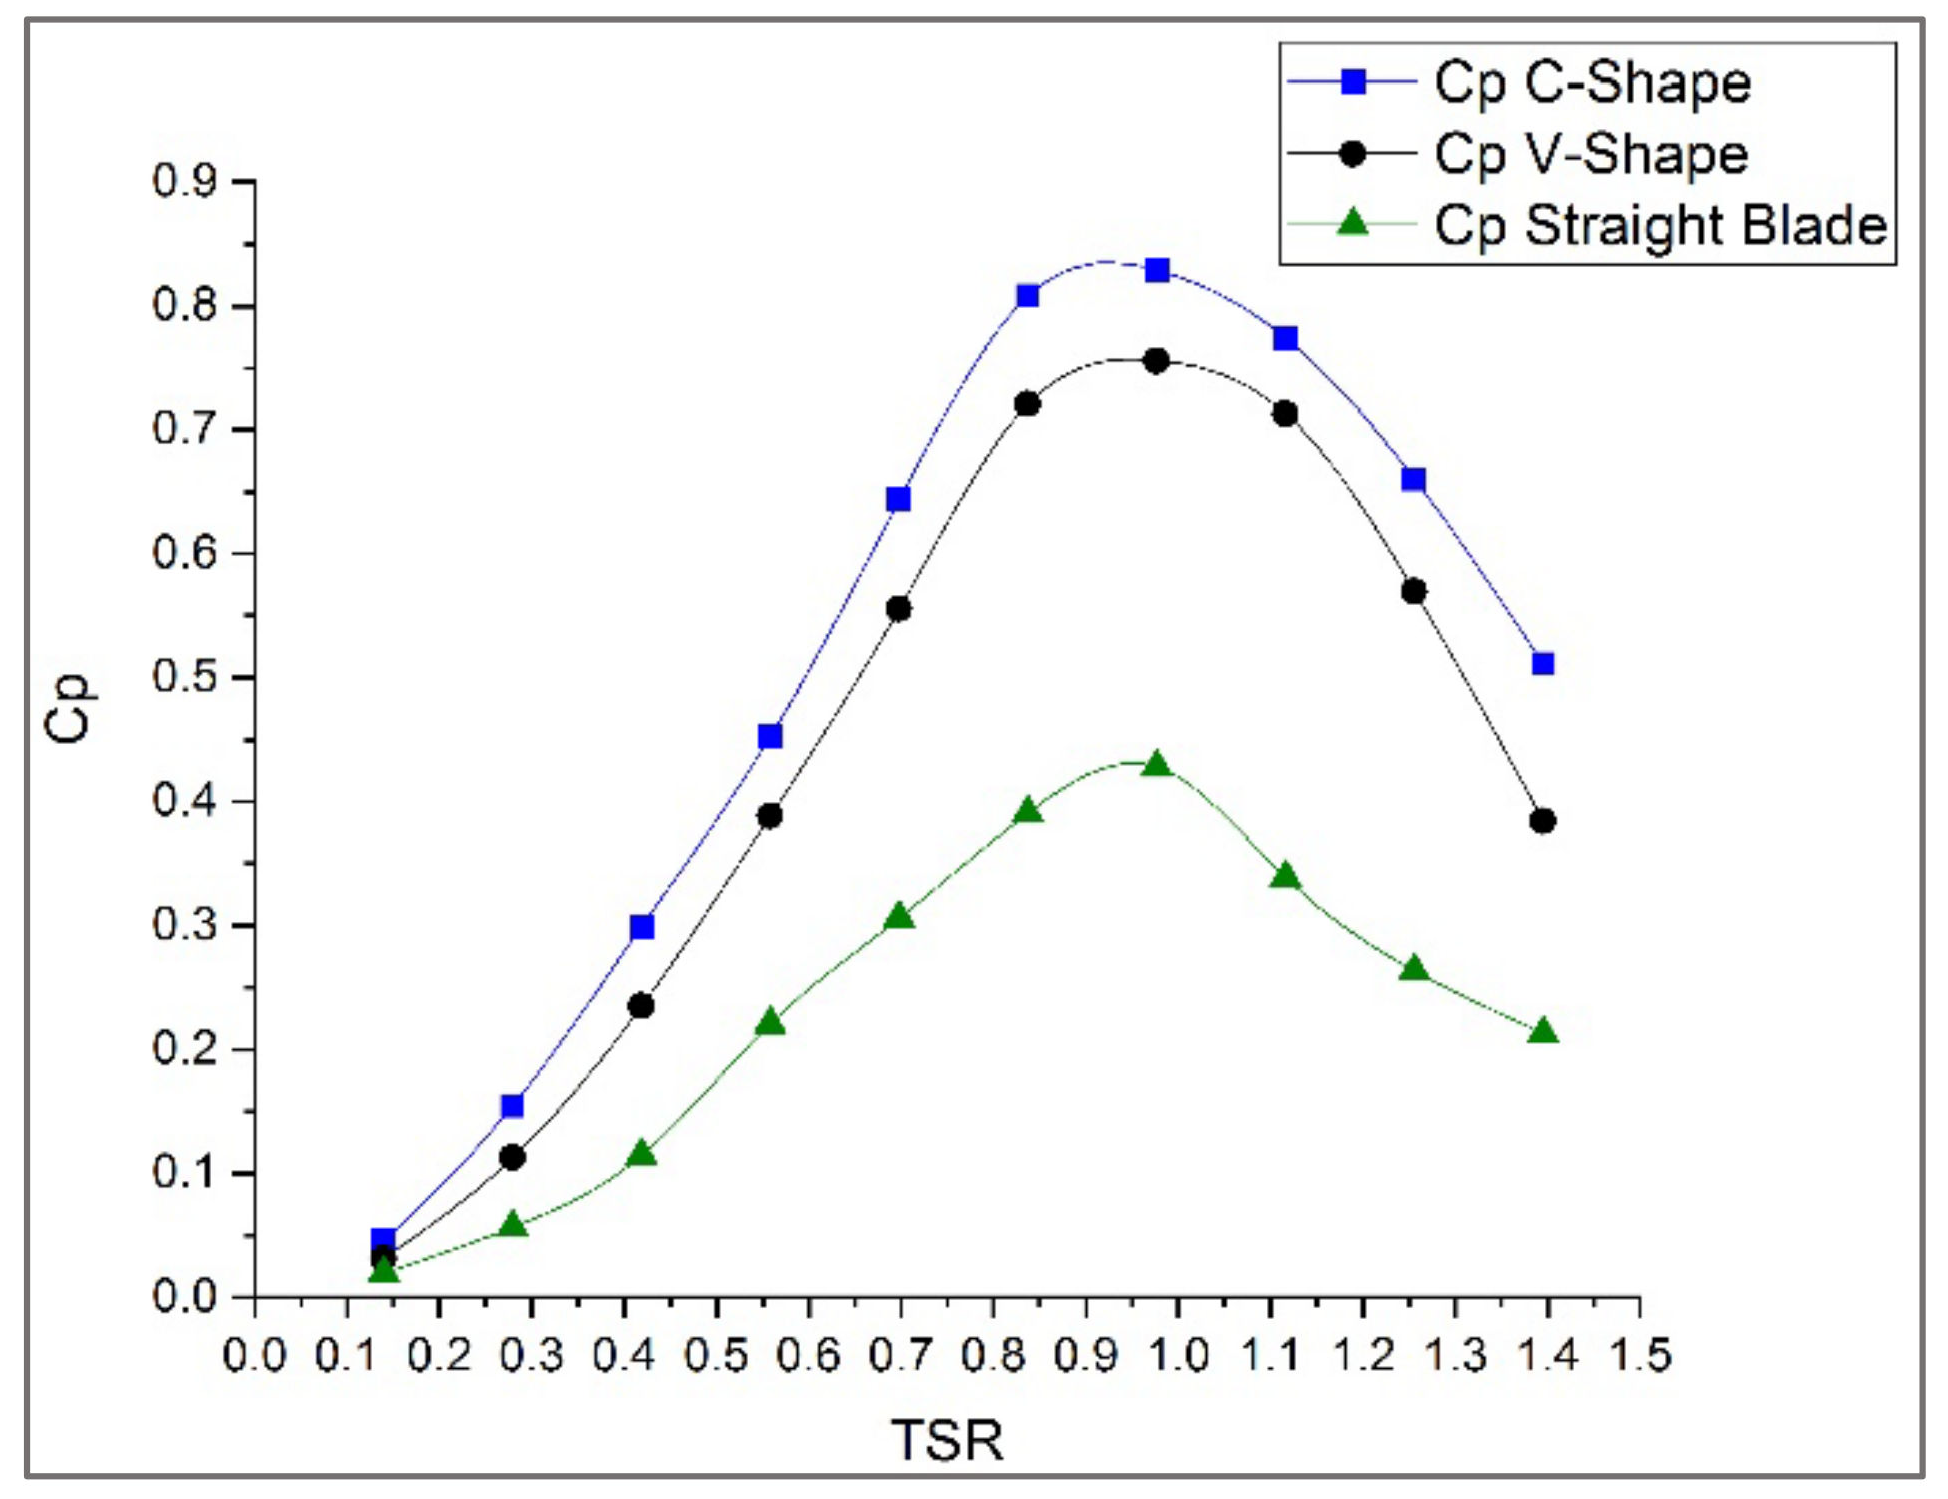
4.5. Test at Different Tip Speed Ratios (TSR)

Tip Speed Ratio (TSR) is an important parameter to be calculated to analyze the characteristics of a blade profile. The TSR versus power coefficient provides a better understanding of the performance characteristics of the three different blade profile turbines. In the present study, the turbine with three blade profile was tested on the straight channels for various TSR values by varying angular velocity of the rotating domain. The power coefficient (Cp) was calculated by varying the angular velocity; the variations of Cp against TSR are shown in Figure 12. The results show that Cp increases with increasing TSR values reaching its highest value at the optimum point and then starts decreasing again. The same trend was observed for all the three blade profiles. The highest values of Cp are 0.88, 0.76 and 0.39 for the C-shape, V-shape and straight blade profiles, respectively. The results obtained from the simulations show that torque increases as angular velocity decreases, but the product of both, i.e., power output, is the highest for the C-shape profile compared with the V-shape and straight blade profiles. Once again, on the basis of the TSR analysis against performance parameters, it is concluded that the C-shape blade profile is the most suitable blade profile for the design of waterwheels.

4.6. Results Verification and Validation

The CFD or numerical results values of the C-shape blade profile at various immersed depth were compared (verification and validation) with experimental results. Verification is generally conducted by observing the expected trends of the results and color contours. The validation check is performed by comparing the output results from both numerical and experimental results. Four performance parameters (average force, average torque, power output and efficiency of the turbine) of the CFD results were validated against the experimental results on the straight channels. The variations of average force acting on the blade, the corresponding torque produced, output power and efficiency of the turbine against immersed depth for both numerical and experimental results are shown in Figure 13a–d, respectively. The results show that both the CFD and experimental methods are in good agreement with each other; errors are noted with ±5%. Moreover, a comparison of this research work with other similar turbines in terms of head, flow rate, cost, efficiency and pay-back period is presented in Table 3. It is concluded that the water wheel with a C-shape blade installed on the inclined channel at an angle of θ = 45° is the most efficient and economical design compared with other turbines of the same type.

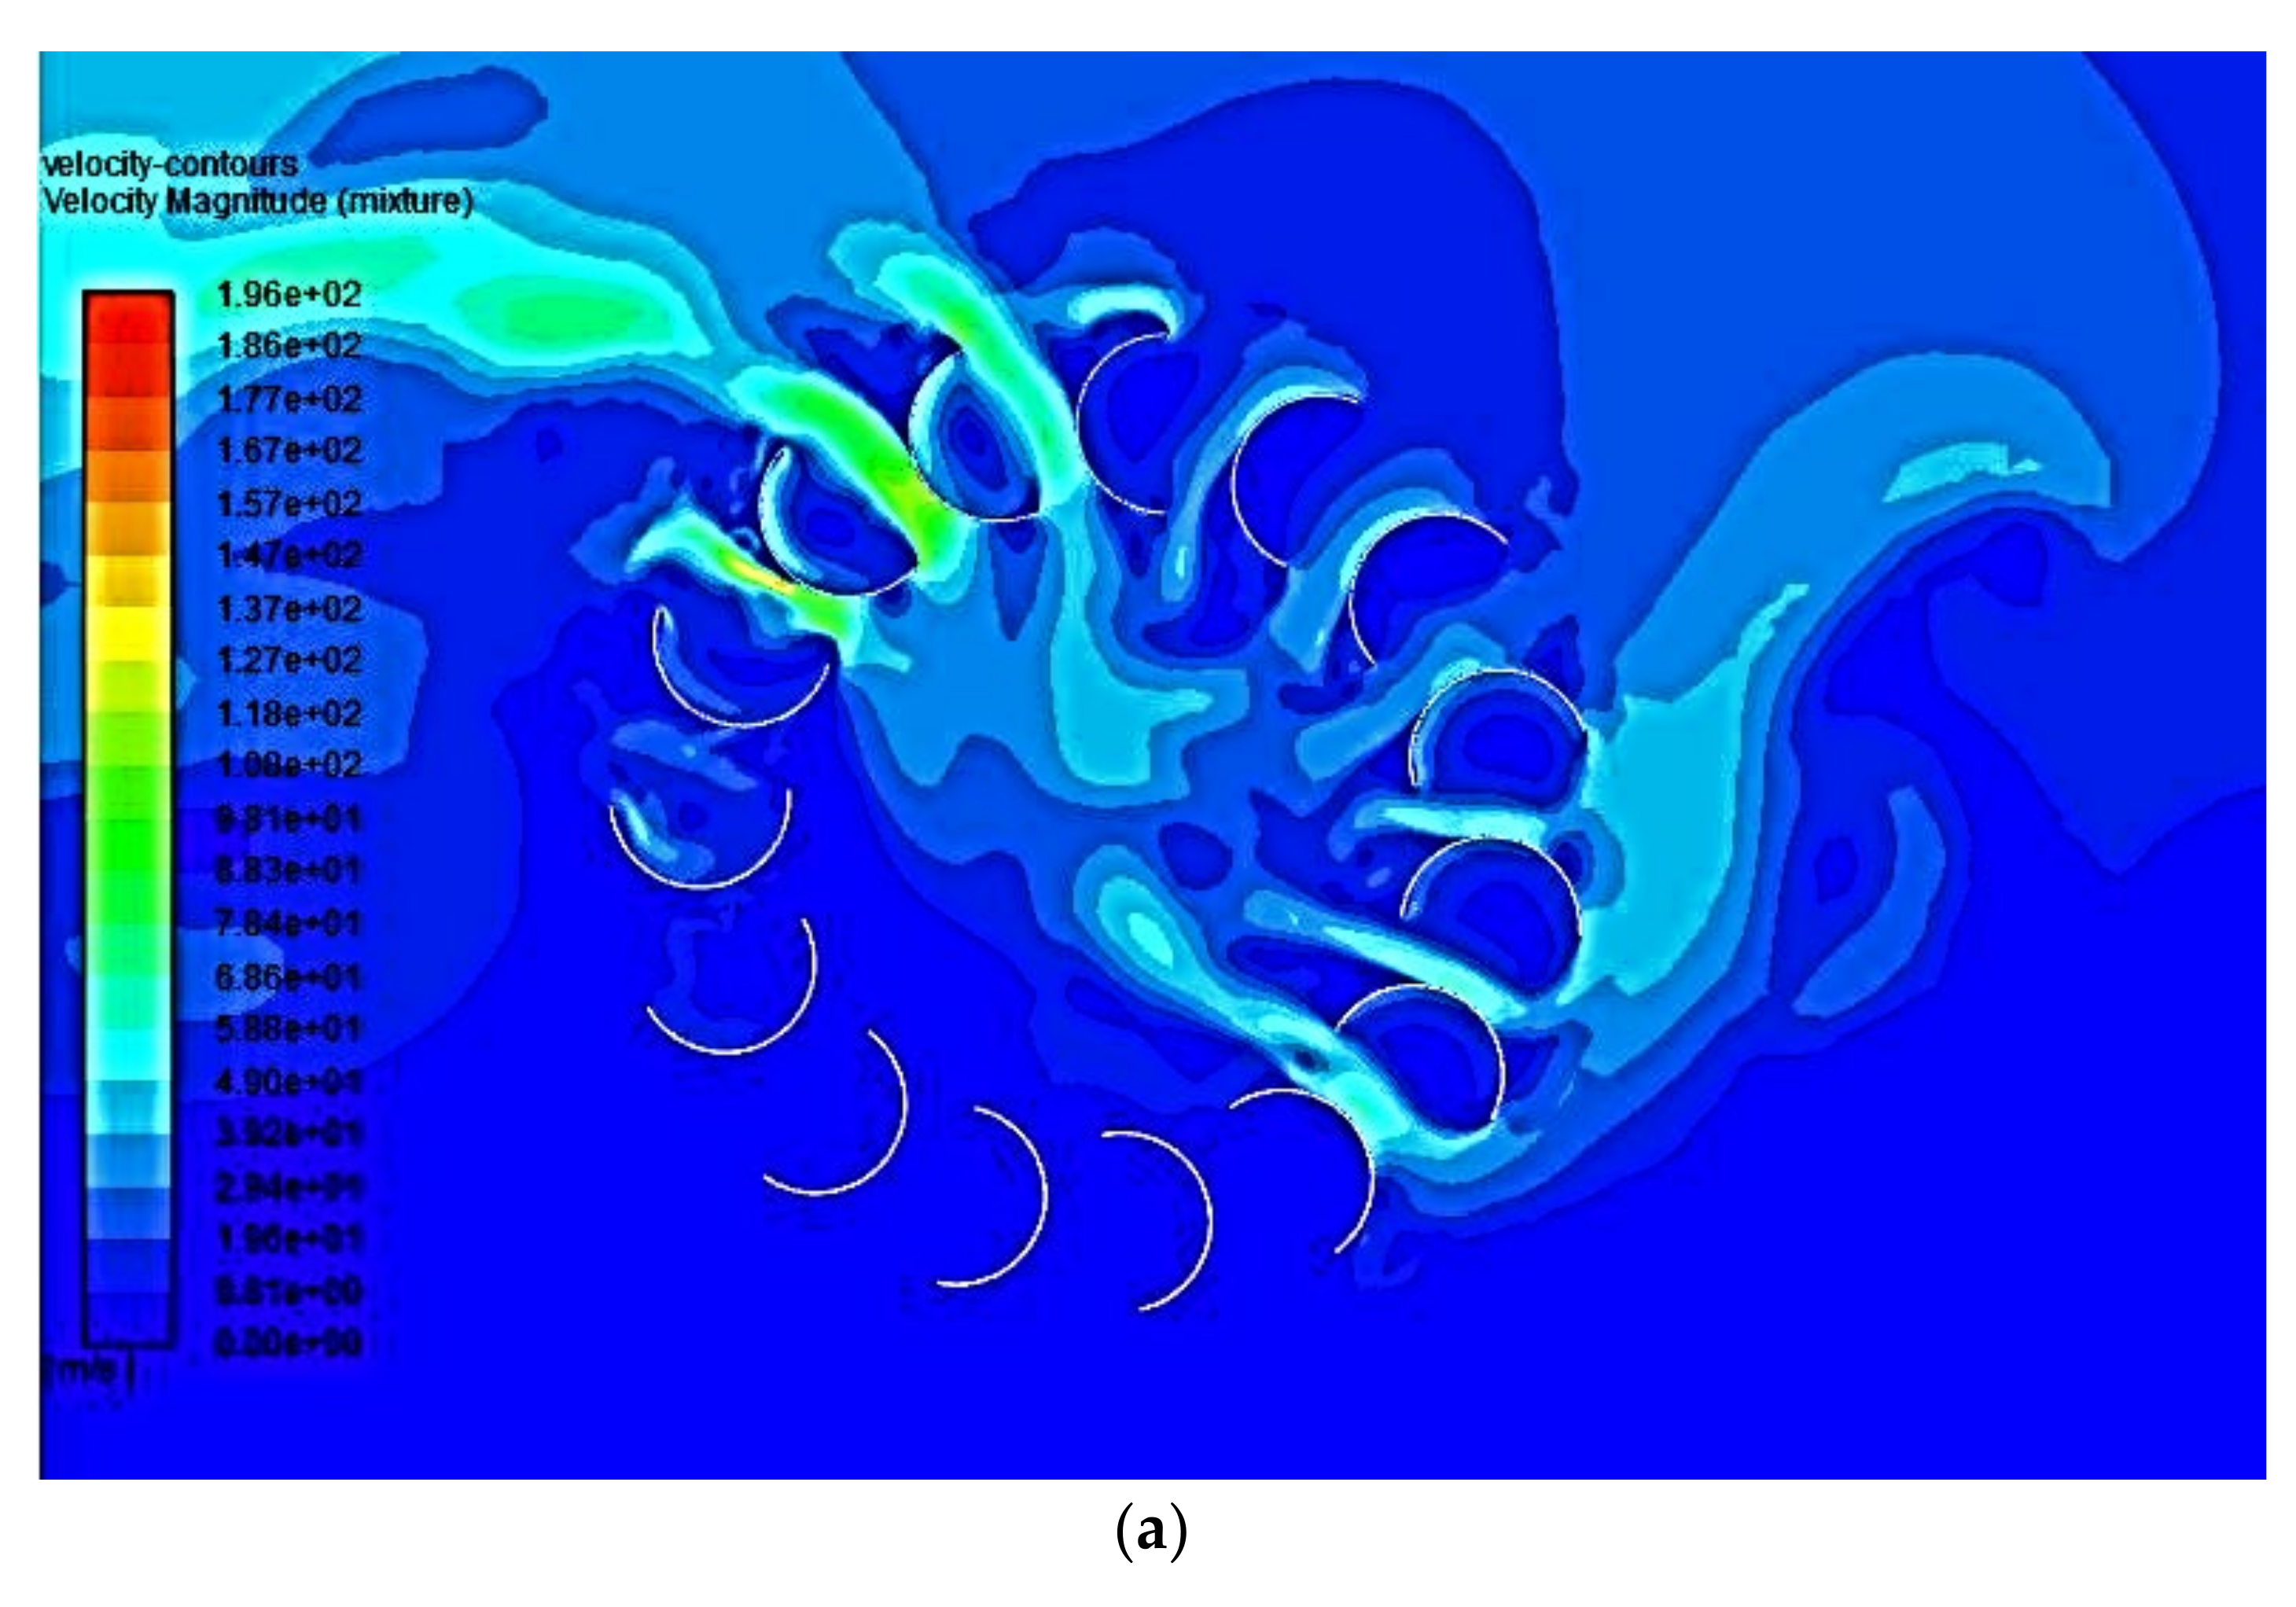
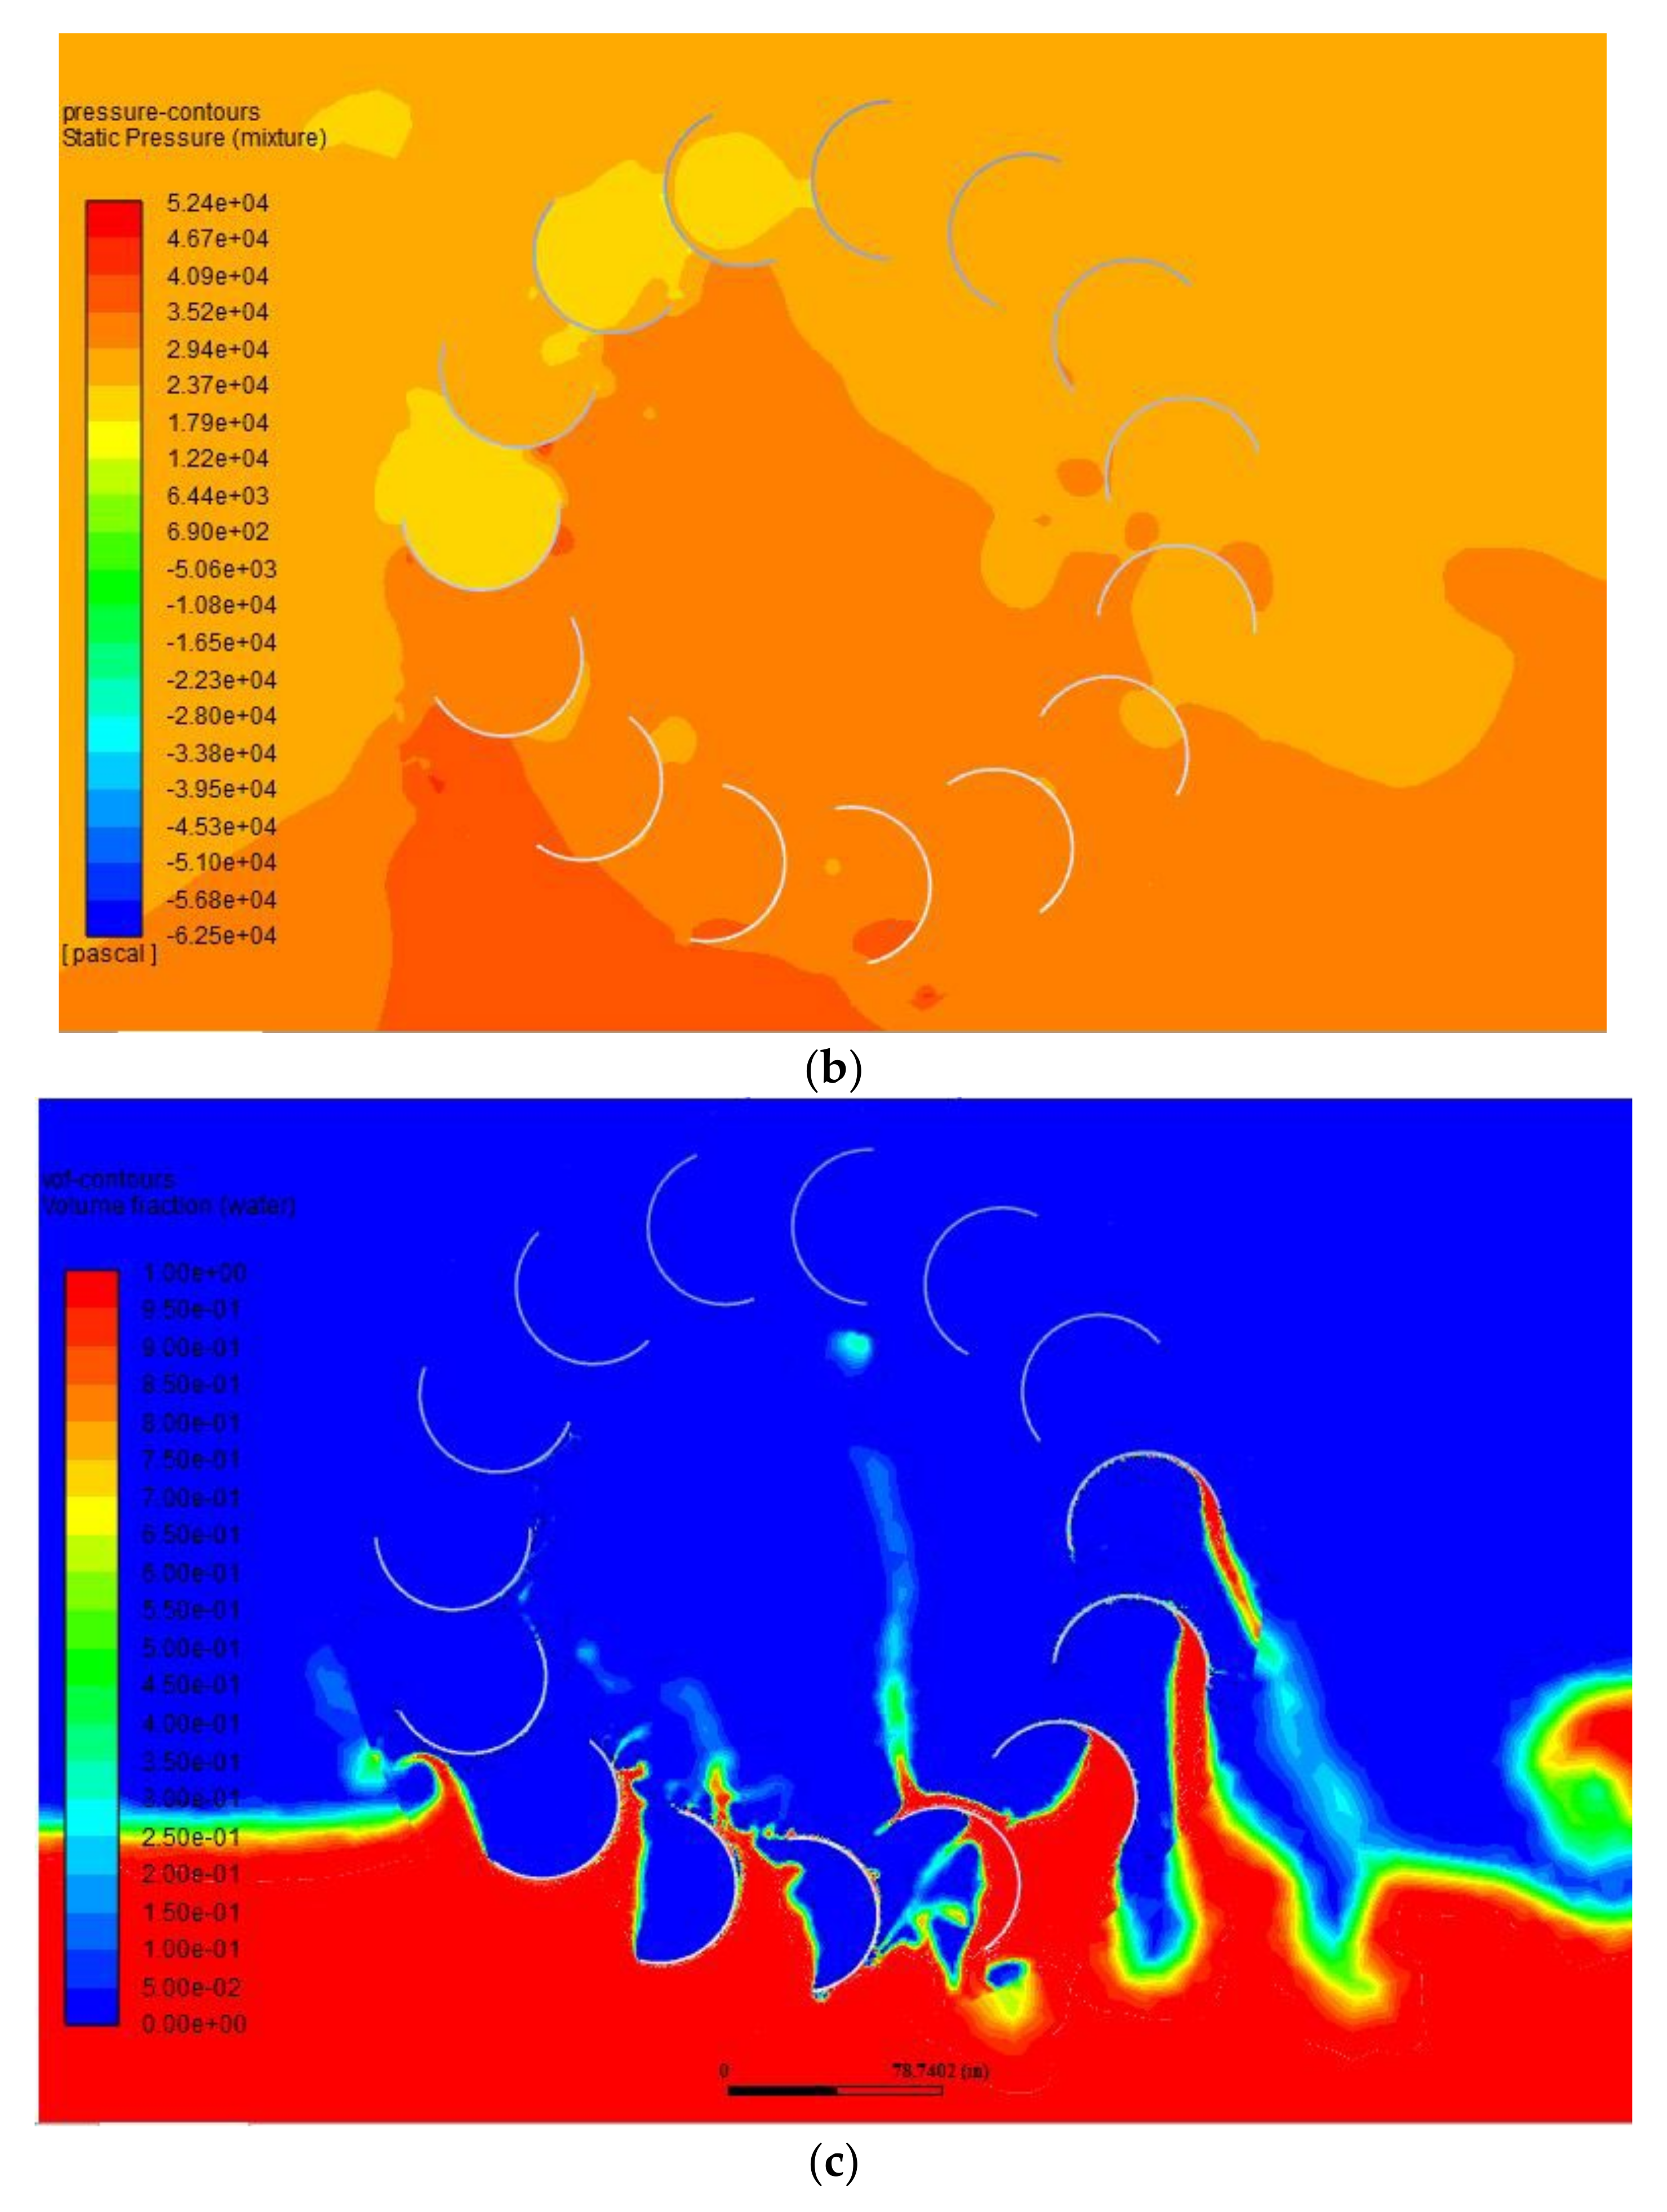
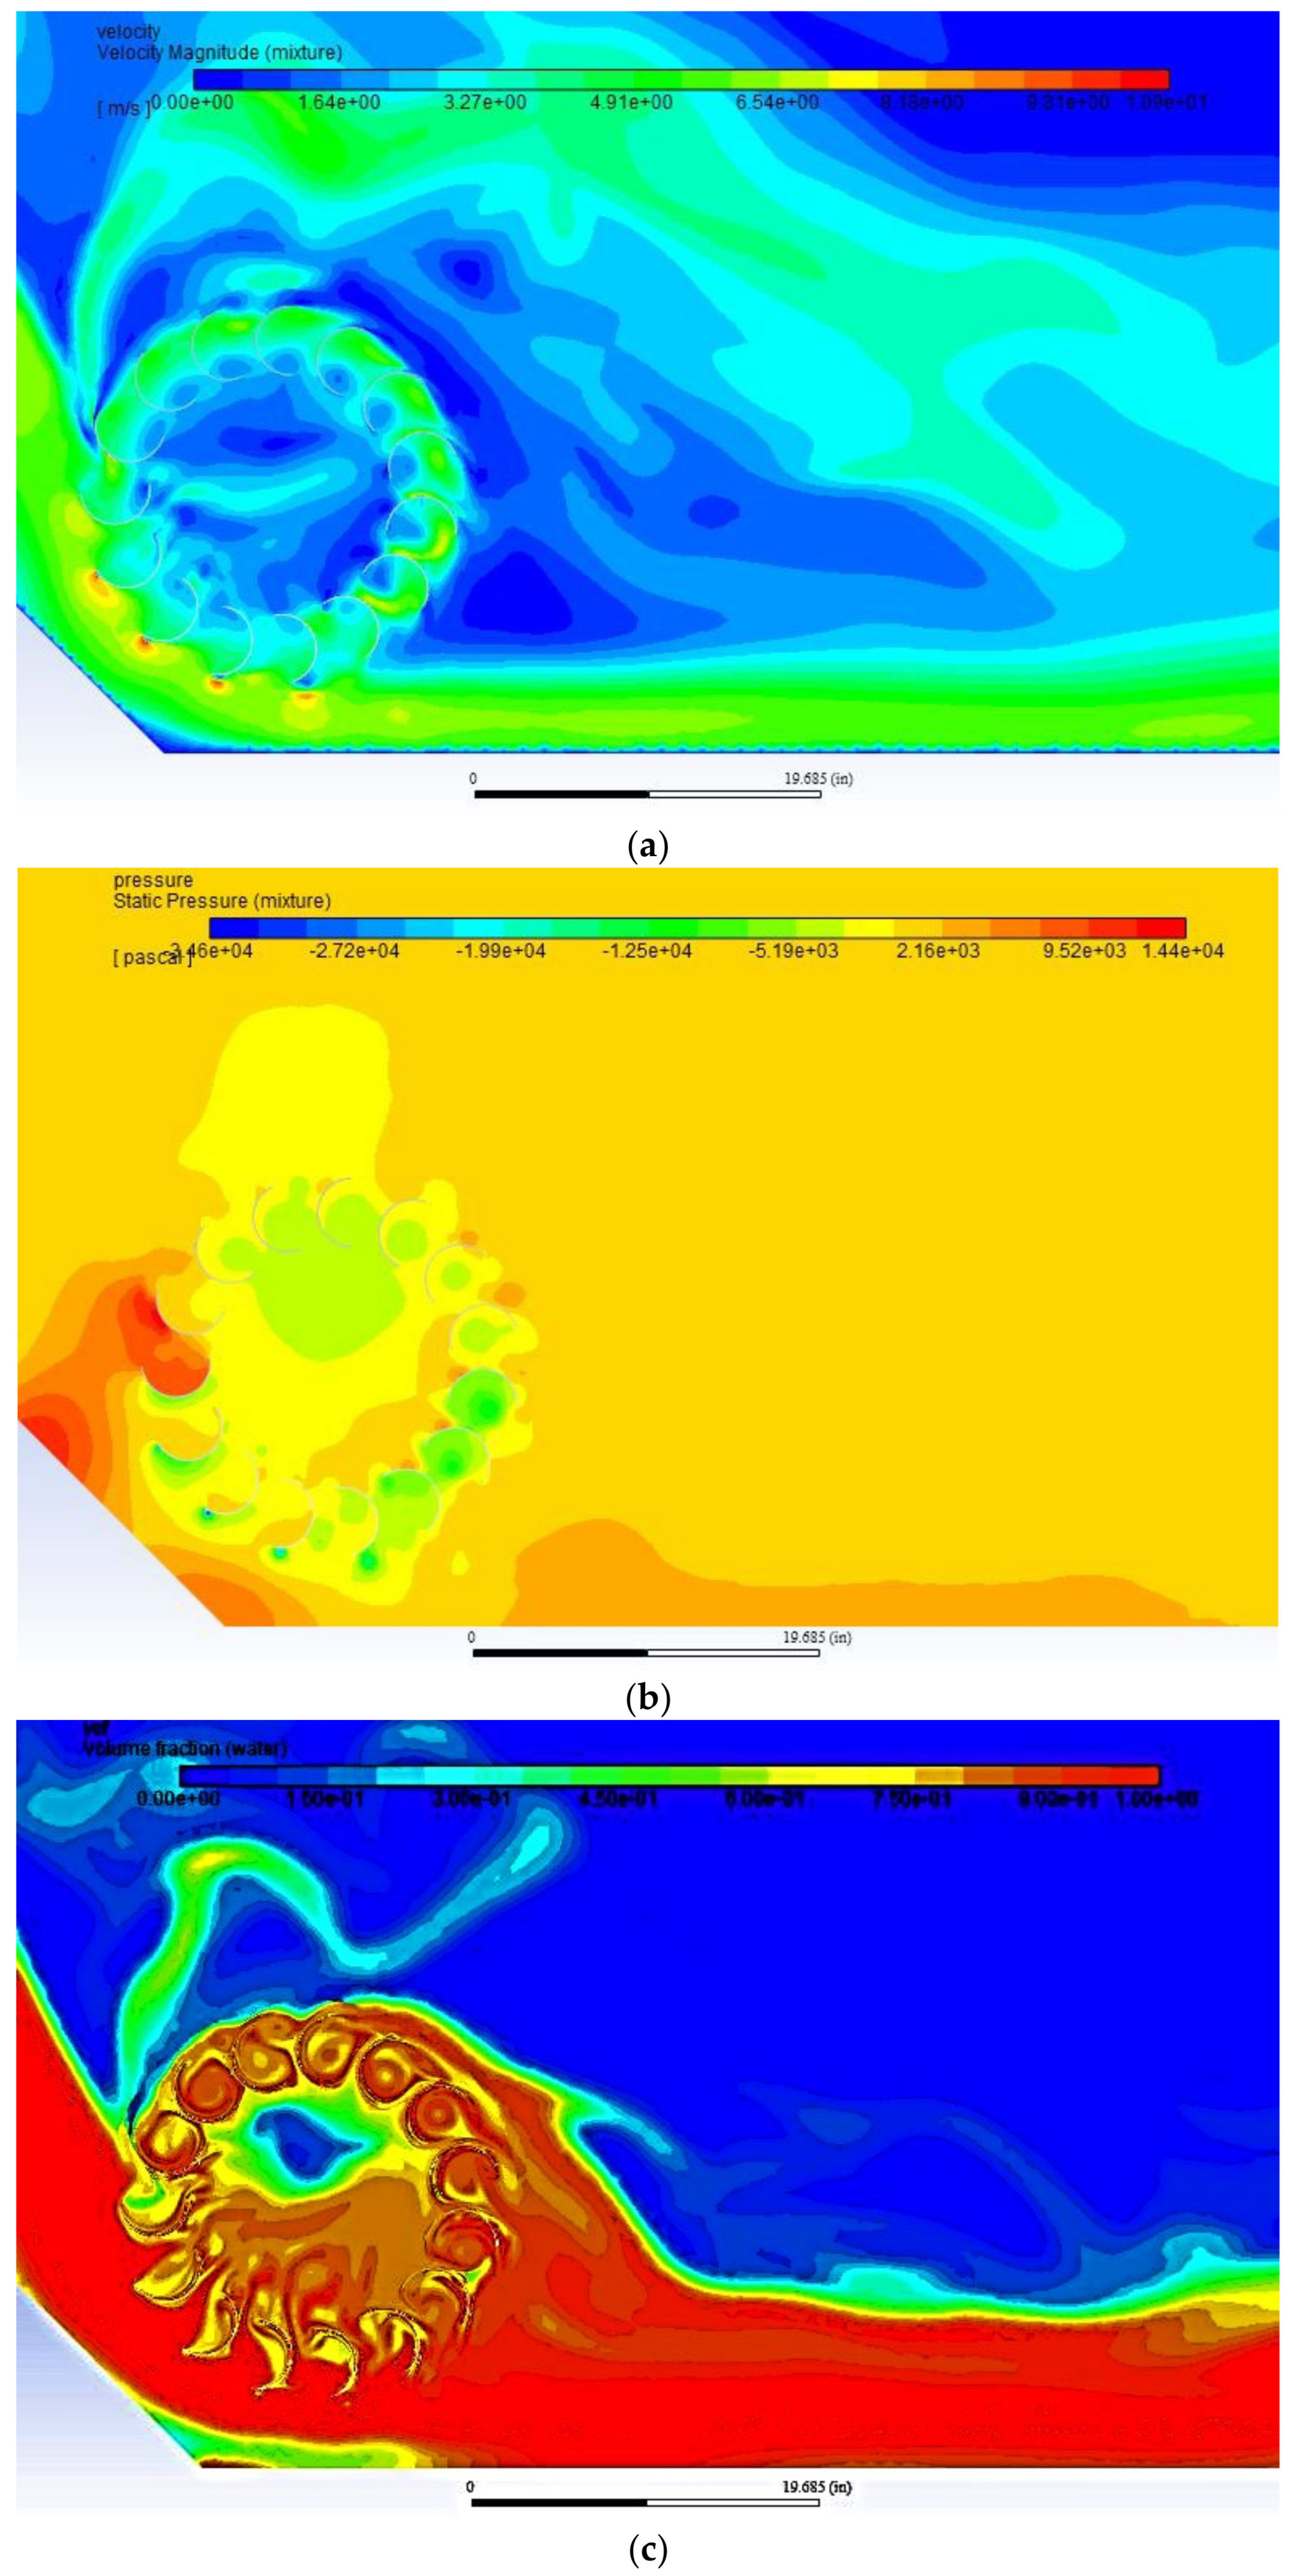
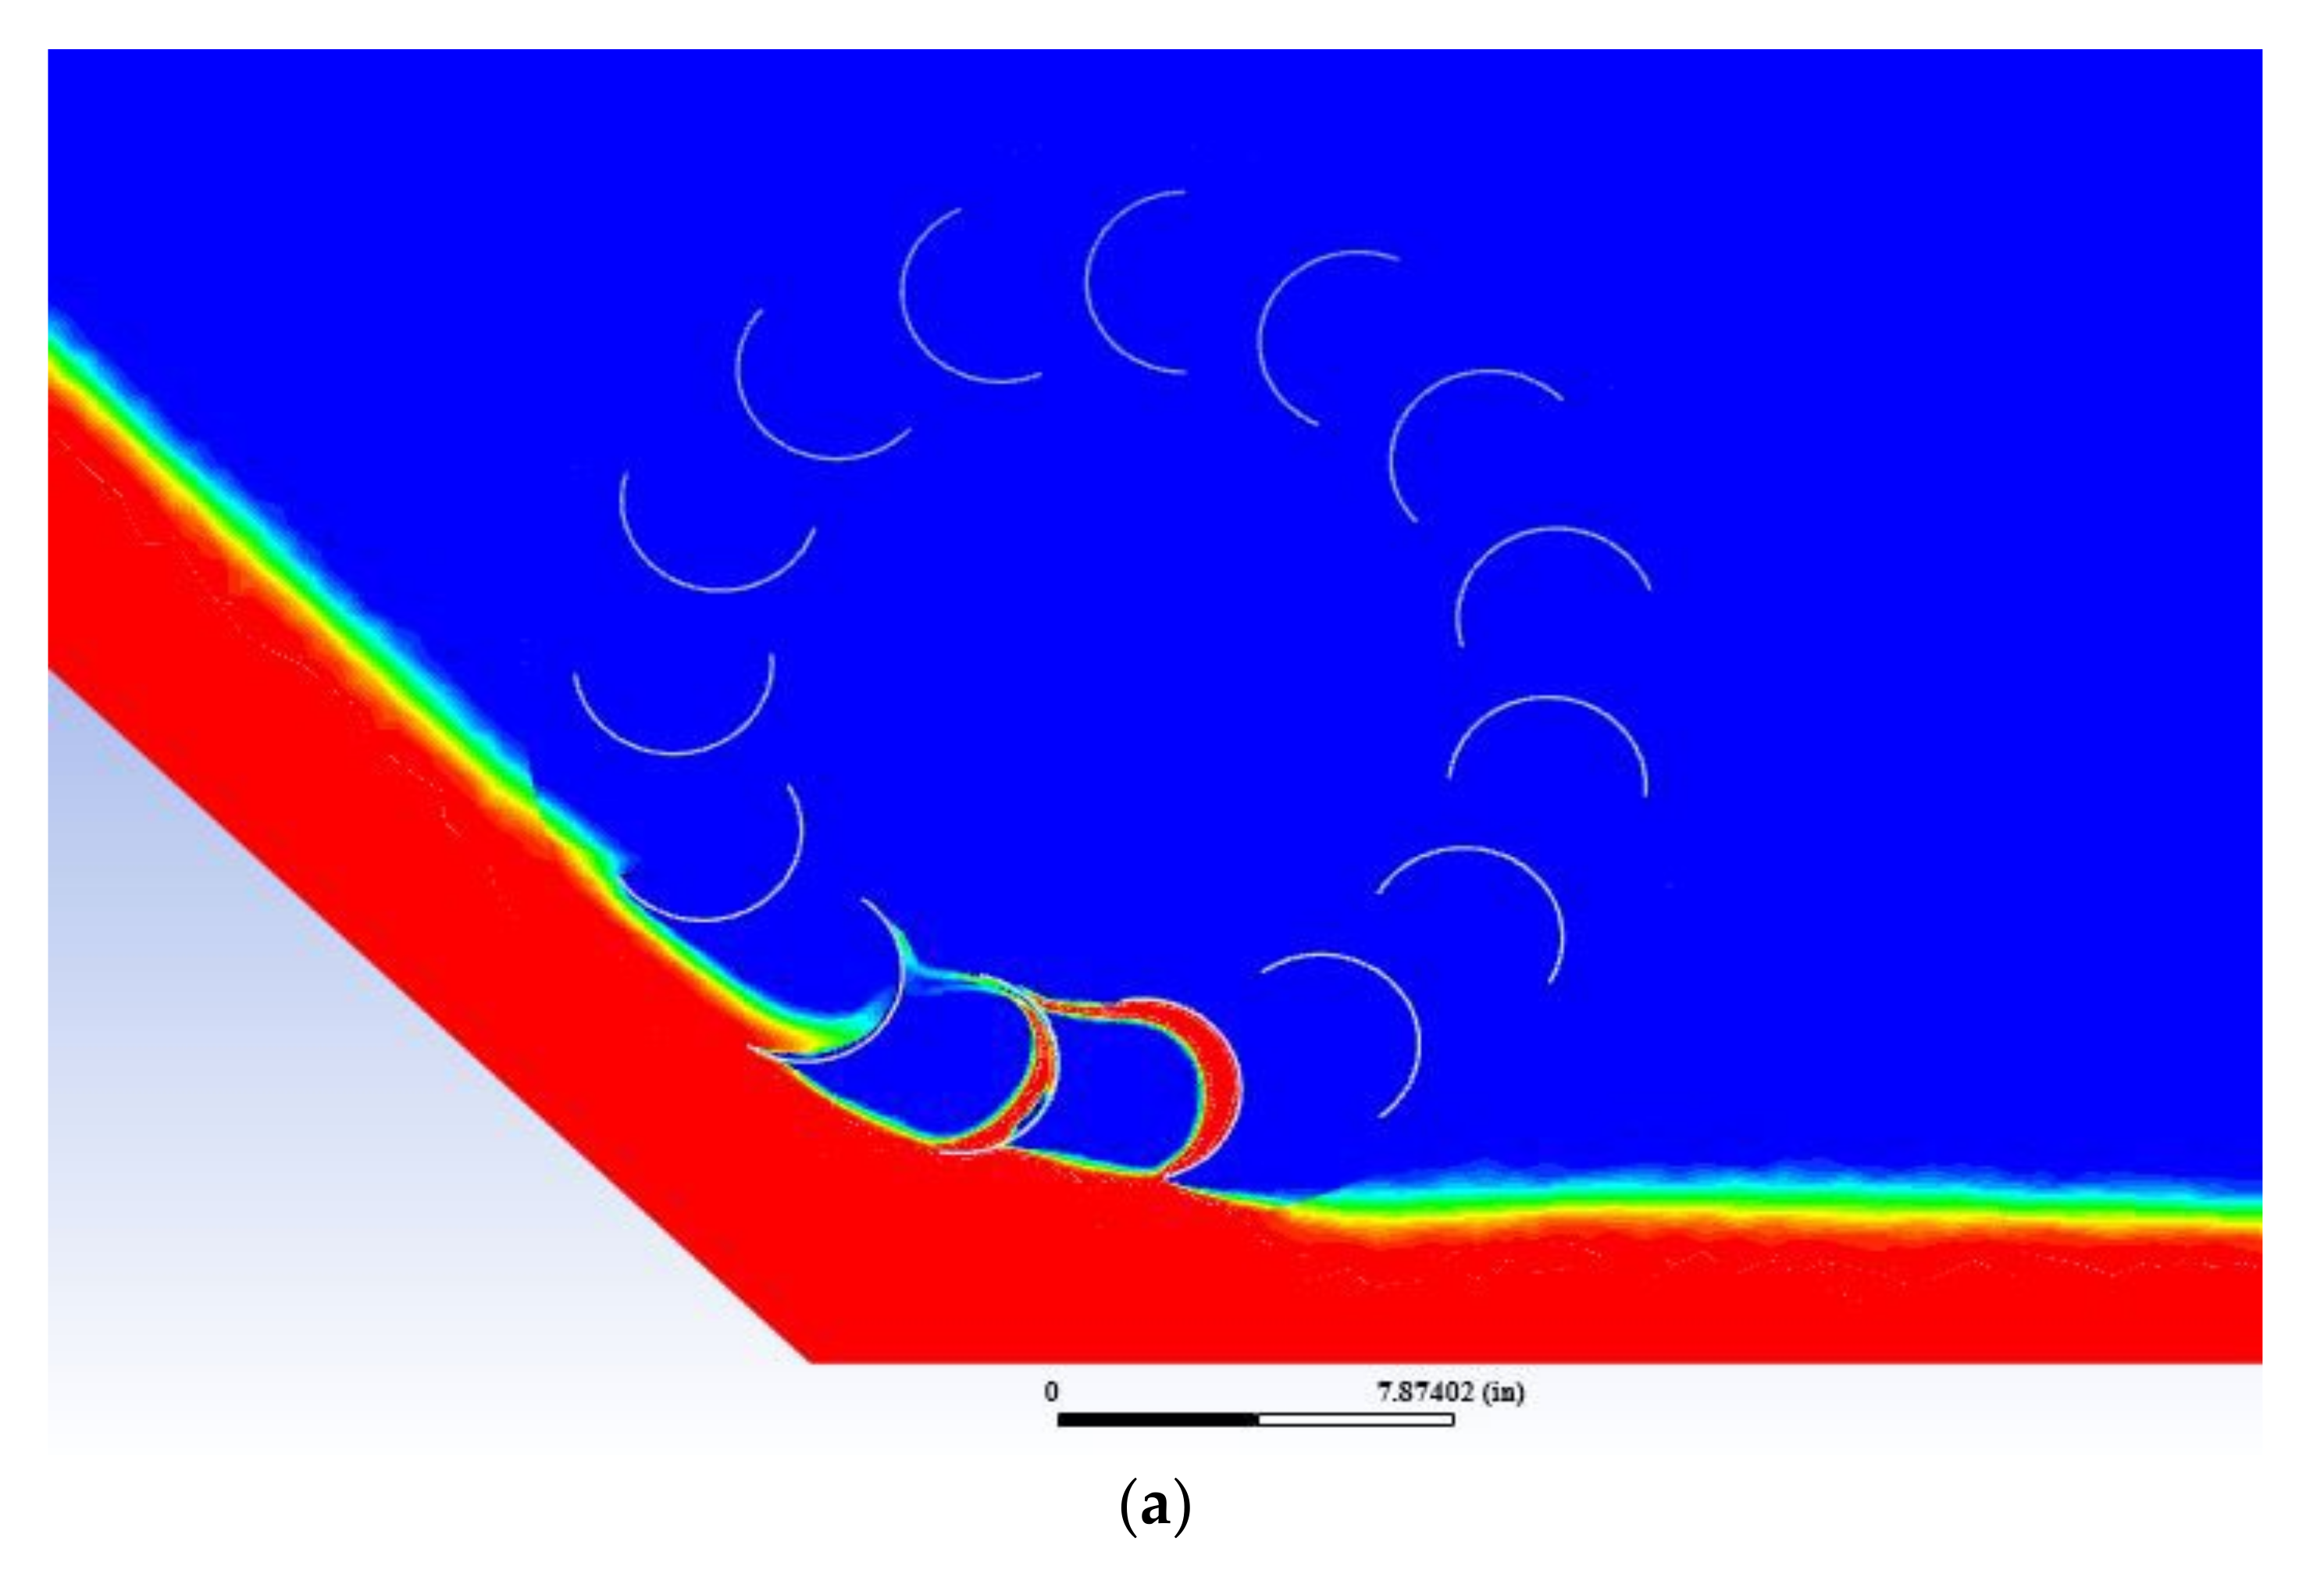
4.7. Visualization of Contours

The visualization of velocity, pressure and volume fraction is important for analysis and better understanding of the results, especially the flow pattern (laminar, turbulent) can better be understood. In this study, the fluid domain is visualized for the straight channel for the C-shape blade profile at 144 RPM in terms of velocity, pressure and volume fraction contours as shown in Figure 14a–c, respectively. The fluid domain visualization for the inclined channel with a water conduit inclination angle 45° at the same RPM is shown in Figure 15a–c, respectively. The contours are shown for the mid-section plant of the waterwheel. The velocity and pressure values are higher for the inclined channel case compared to straight channel case.

4.8. Maximum Power Output on an Inclined Channel

The power output on the inclined channel is maximum at θ = 45° because the blades immersed in the water very smoothly at this angle. The tip of the water blade becomes parallel to the flowing water and impact losses are reduced because less turbulence occurs at the tip of the blade as shown in Figure 16a. For other inclinations of water conduits, the blades of the turbine make an angle φ with the flowing water when the blade is just in a position to enter the flowing stream, as shown in Figure 16b, and the impact losses depend on this angle. The greater the φ angle the greater the impact losses. Furthermore, the blades experience a greater force on its back side which cause turbulence in cases of higher φ-angles while entering into the stream water. The efficiency of the turbine is maximum at θ = 45° because the force on the back side of the blade is a minimum. Moreover, material fatigue is lowest at this angle due to lower vibration impact (lower back side force).

4.9. Overall Efficiency of the System

The overall efficiency of the system indicates the overall performance of the tested model. The experimental turbine with the C-Shape blade profile was tested with a fully immersed depth of 4 inches. The waterwheel was connected to an electric generator of 3 kW. The test was carried out at full load conditions, and the voltage and current of the circuit were measured. The overall efficiency of the turbine was calculated by using Equation (12), where Pout is the power output of the generator and can be calculated by using Equation (13), vg is the output voltage generator, and ig is the output current of the generator under full load condition.
η o v e r a l l = P out P i n
P   out = v g   i g
The turbine achieved an overall efficiency of 66.42%, which demonstrates the great potential for such turbines with a C-shape blade profile to be used as an economical power generation source for rural electrification. The turbine with the suggested blade shape profile can be used in any region of the world to resolve electricity issues in remote or rural areas.

5. Conclusions

This parametric study in this research work was carried out by changing the immersed depth of the blade, inclination of the water conduit, studying three different blade profile geometries and testing the turbines for different tip speed ratios. This study aimed to devise an ecofriendly, low-cost, efficient hydraulic turbine for the rural electrification of Pakistan. Installation of the device is limited to open channels where the velocity is greater than 3 m/s and locations where a natural gradient (head) of almost 1.5 m is available. The turbine was tested as a high-speed device with a constant number of blades on a horizontal as well as on an inclined channel through computational fluid dynamic simulations. Compared with other proposed models, the proposed method provides an economical solution with greater efficiency for rural electrification of Pakistan with a maximum payback period of 2.5 years. The experimental results were compared with the numerical results. The conclusions obtained from the research are presented as follows:
  • The experimental and numerical analysis results are closely related with each other, with small errors where the maximum error is recorded as 5%. In some simulations the result shows small deviations up to 2% from the experimental values, whereas in other, cases it shows deviation up to 5%.
  • The waterwheel can be used as a high-speed wheel without losing the power generation capacity if it is efficiently design with a good blade profile geometry.
  • The mass of the waterwheel plays an important role in its design; the critical mass for the wheel can be identified.
  • The C-shape blade profile is the best geometry profile compared with the V-shape blade and straight blade. Turbines with the straight blade had the lowest performance in all the case studies.
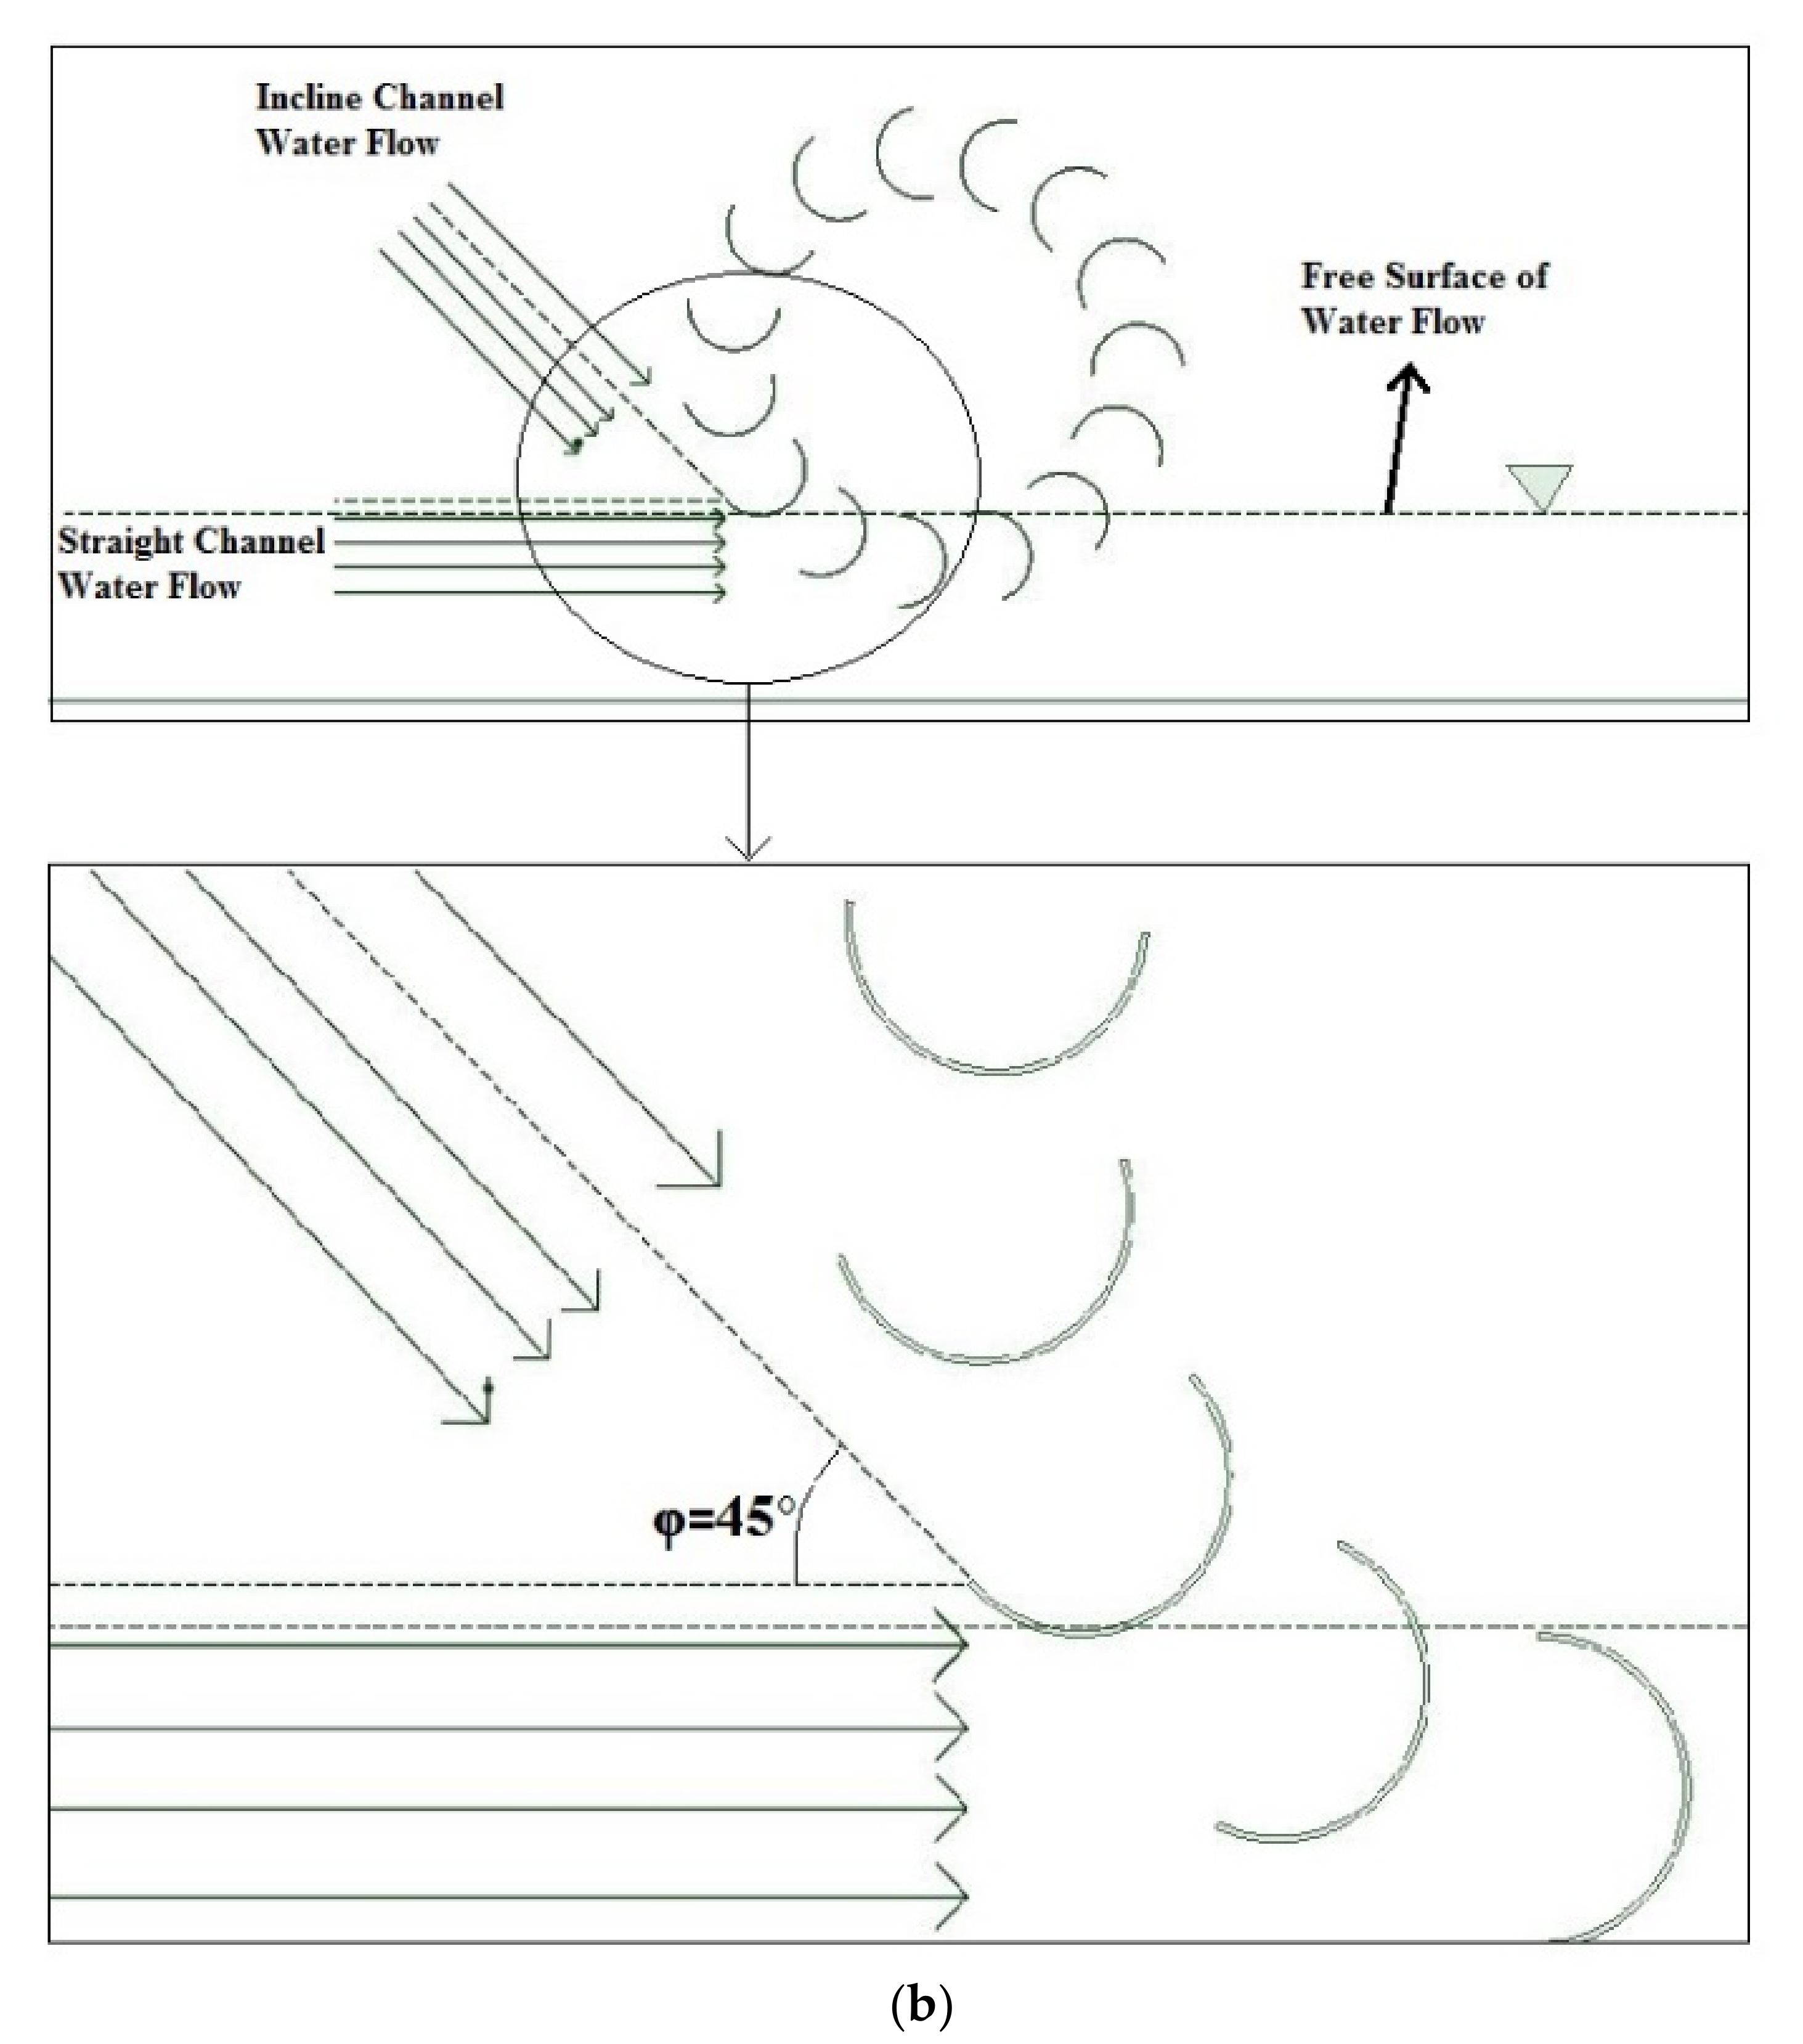
  • The downstream fluid exerts a backward force on the blades that affects the overall performance of the wheel. When the water wheel is installed on inclined channels, the performance characteristics of the waterwheel increase because the fluid on the downstream side falls down with the force of gravity and it has no effect on the blade. Therefore, the net force on the blade increases.
  • The critical angle for the C-Shape blade turbine on the inclined channel is identified as θ = 45°. At an inclination angle of θ = 45°, when the C-shape blade becomes immersed in the water, it becomes parallel to the flowing water and thus produces less turbulence and smaller impact losses.
  • Pico-scale high-speed waterwheels are the best solution for rural electrification because they have low fabrication, maintenance and per unit energy production costs. The payback period of such systems is also small.
  • In the experimental setup the velocity of the stream was maintained at 4.1 m/s. When the velocity of the water was variated to the turbine, poor performance was noted below 3 m/s, and performance was increased by increasing velocity above 3 m/s. It is concluded that high-speed waterwheels operate most efficiently on streams that have a high flow velocity (greater than 3 m/s).
  • The performance of the waterwheel increases when the water stream is directed as a jet towards the wheel.
  • Increasing head improves the performance of the waterwheel, and it operates more efficiently on inclined channels compared with straight channels due to the datum head which increases on inclined channels.
  • The waterwheel shows excellent performance characteristics when the blades are fully submerged in the stream, with a design aspect ratio of the wheel of 0.372.
  • The overall efficiency of the turbine with the C-shape blade profile was calculated as 66.42%, which is reasonable for the generation of electricity in remote and rural areas.
The methods and findings of this research work will assist researchers in this field. Furthermore, the proposed waterwheel turbine with the C-shape blade profile can be used in remote or rural areas of any country where electricity transmission is impossible. This study focuses on rural electrification using hydro-electricity, which is a clean and renewable energy source, by designing an optimal blade shape and immersion angle for the waterwheel. The mass of the waterwheel is another critical parameter which should be investigated in future research.

Author Contributions

Data curation, M.A. (Muhammad Asim), S.M. and M.A. (Muhammad Abdullah); Formal analysis, M.A. (Muhammad Asim), S.M. and M.A.M.; Funding acquisition, M.M.; Writing—original draft, M.A. (Muhammad Asim) and M.A. (Muhammad Abdullah); Writing—review & editing, M.A. (Muhammad Amjad), M.A.M., M.A.K., M.M. and M.E.M.S. All authors have read and agreed to the published version of the manuscript.

Funding

This research received no external funding.

Conflicts of Interest

The authors declare no conflict of interest.

References

  1. Quaranta, E.; Revelli, R. Output power and power losses estimation for an overshot water wheel. Renew. Energy 2015, 83, 979–987. [Google Scholar] [CrossRef]
  2. Ahmad, S.; Abdullah, M.; Kanwal, A.; Tahir, Z.U.R.; Bin Saeed, U.; Manzoor, F.; Atif, M.; Abbas, S. Offshore wind resource assessment using reanalysis data. Wind Eng. 2022. [Google Scholar] [CrossRef]
  3. Kanwal, A.; Tahir, Z.U.R.; Asim, M.; Hayat, N.; Farooq, M.; Abdullah, M.; Azhar, M. Evaluation of Reanalysis and Analysis Datasets against Measured Wind Data for Wind Resource Assessment. Energy Environ. 2022. [Google Scholar] [CrossRef]
  4. Tahir, Z.U.R.; Asim, M.; Azhar, M.; Moeenuddin, G.; Farooq, M. Correcting solar radiation from reanalysis and analysis datasets with systematic and seasonal variations. Case Stud. Therm. Eng. 2021, 25, 100933. [Google Scholar] [CrossRef]
  5. Yelguntwar, P.; Bhange, P.; Lilhare, Y.; Bahadure, A. Design fabrication & testing of a waterwheel for power generation in an open channel flow. Int. J. Res. Eng. Adv. Technol. 2014, 1, 47–51. [Google Scholar]
  6. Reynolds, T.S. Stronger Than a Hundred Men: A History of the Vertical Water Wheel; JHU Press: Baltimore, MD, USA, 1983. [Google Scholar]
  7. Williamson, S.; Stark, B.; Booker, J. Low head pico hydro turbine selection using a multi-criteria analysis. Renew. Energy 2014, 61, 43–50. [Google Scholar] [CrossRef]
  8. Ahmed, S.; Mahmood, A.; Hasan, A.; Sidhu, G.A.S.; Butt, M.F.U. A comparative review of China, India and Pakistan renewable energy sectors and sharing opportunities. enew. Sustain. Energy Rev. 2016, 57, 216–225. [Google Scholar] [CrossRef]
  9. Cook, P. Infrastructure, rural electrification and development. Energy Sustain. Dev. 2011, 15, 304–313. [Google Scholar] [CrossRef]
  10. Yah, N.F.; Oumer, A.N.; Idris, M.S. Small scale hydro-power as a source of renewable energy in Malaysia: A review. Renew. Sustain. Energy Rev. 2017, 72, 228–239. [Google Scholar] [CrossRef] [Green Version]
  11. Powell, D.; Ebrahimi, A.; Nourbakhsh, S.; Meshkahaldini, M.; Bilton, A. Design of pico-hydro turbine generator systems for self-powered electrochemical water disinfection devices. Renew. Energy 2018, 123, 590–602. [Google Scholar] [CrossRef]
  12. Khan, F.U.; Ahmed, A.; Jadoon, U.K.; Haider, F. Modeling, simulation and fabrication of an undershot floating waterwheel. J. Eng. Appl. Sci. 2015, 34, 55–69. [Google Scholar]
  13. Hwang, I.S.; Lee, Y.H.; Kim, S.J. Optimization of cycloidal water turbine and the performance improvement by individual blade control. Appl. Energy 2009, 86, 1532–1540. [Google Scholar] [CrossRef]
  14. Muller, G.; Wolter, C. The breastshot waterwheel: Design and model tests. ICE Proc.-Eng. Sustain. 2004, 157, 203–211. [Google Scholar] [CrossRef]
  15. Jones, Z. Domestic Electricity Generation Using Waterwheels on Moored Barge. Mater’s Thesis, School of the Built Ennvironment, Heriot-Watt University, Edinburgh, Scotland, 2005. [Google Scholar]
  16. Denny, M. The efficiency of overshot and undershot waterwheels. Eur. J. Phys. 2003, 25, 193. [Google Scholar] [CrossRef] [Green Version]
  17. Muller, G.; Denchfield, S.; Marth, R.; Shelmerdine, B. Stream wheels for applications in shallow and deep water. Proc. Congr.-Int. Assoc. Hydraul. Res. 2007, 32, 707. [Google Scholar]
  18. Yassi, Y. Experimental study of a high speed micro waterwheel. Iran. J. Mech. Eng. 2013, 14, 34. [Google Scholar]
  19. Paudel, S.; Linton, N.; Zanke, U.C.; Saenger, N. Experimental investigation on the effect of channel width on flexible rubber blade water wheel performance. Renew. Energy 2013, 52, 1–7. [Google Scholar] [CrossRef]
  20. Paudel, S.; Saenger, N. Effect of channel geometry on the performance of the Dethridge water wheel. Renew. Energy 2018, 115, 175–182. [Google Scholar] [CrossRef]
  21. Quaranta, E.; Revelli, R. Performance characteristics, power losses and mechanical power estimation for a breastshot water wheel. Energy 2015, 87, 315–325. [Google Scholar] [CrossRef]
  22. Nigussie, T.; Engeda, A.; Dribssa, E. Design, Modeling, and CFD Analysis of a Micro Hydro Pelton Turbine Runner: For the Case of Selected Site in Ethiopia. Int. J. Rotating Mach. 2017, 2017, 3030217. [Google Scholar] [CrossRef] [Green Version]
  23. Akinyemi, O.S.; Liu, Y. CFD modeling and simulation of a hydropower system in generating clean electricity from water flow. Int. J. Energy Environ. Eng. 2015, 6, 357–366. [Google Scholar] [CrossRef] [Green Version]
  24. Quaranta, E.; Revelli, R. Gravity water wheels as a micro hydropower energy source: A review based on historic data, design methods, efficiencies and modern optimizations. Renew. Sustain. Energy Rev. 2018, 97, 414–427. [Google Scholar] [CrossRef]
  25. Pujol, T.; Vashisht, A.; Ricart, J.; Culubret, D.; Velayos, J. Hydraulic efficiency of horizontal waterwheels: Laboratory data and CFD study for upgrading a western Himalayan watermill. Renew. Energy 2015, 83, 576–586. [Google Scholar] [CrossRef]
  26. Ahmad, M.; Ghani, U.; Anjum, N.; Pasha, G.A.; Ullah, M.K.; Ahmed, A. Investigating the flow hydrodynamics in a compound channel with layered vegetated floodplains. Civ. Eng. J. 2020, 6, 860–876. [Google Scholar] [CrossRef]
  27. Cornelis, S. Parametric Study of the Performance of an Impulse-Type Turbine with CFD. 2016. Available online: http://hdl.handle.net/10256/13242 (accessed on 25 April 2022).
  28. Shannon, R. Water Wheel Engineering. In Proceedings of the Sixth International Permaculture Conference, Perth, Australia, 28 September–1 October 1996. [Google Scholar]
  29. Pritchard, P.J.; Mitchell, J.W. Fox and McDonald’s Introduction to Fluid Mechanics; Wiley: Hoboken, NJ, USA, 2016. [Google Scholar]
  30. Hamed, H.F.A.; Kassem, A.M.; Ali, M.E.M. Design and modeling of hydro matrix power wheels contain nine wheels by using Matlab simulink. In Proceedings of the 2017 Nineteenth International Middle East Power Systems Conference (MEPCON), Cairo, Egypt, 19–21 December 2017; IEEE: Piscataway, NJ, USA, 2017. [Google Scholar]
  31. Yah, N.F.; Idris, M.S.; Oumer, A.N. Numerical investigation on effect of immersed blade depth on the performance of undershot water turbines. MATEC Web Conf. EDP Sci. 2016, 74, 00035. [Google Scholar] [CrossRef] [Green Version]
  32. Zaman, A.; Khan, T. Design of a water wheel for a low head micro hydropower system. J. Basic Sci. Technol. 2012, 1, 1–6. [Google Scholar]
  33. Budynas, R.G.; Shigley, J.E. Shigley’s Mechanical Engineering Design; McGraw-Hill: New York, NY, USA, 2011. [Google Scholar]
  34. Nasir Mehmood, Z.L.; Khan, J. Diffuser augmented horizontal axis tidal current turbines. Res. J. Appl. Sci. Eng. Technol. 2021, 4, 3522–3532. [Google Scholar]
  35. Nguyen, M.H.; Jeong, H.; Yang, C. A study on flow fields and performance of water wheel turbine using experimental and numerical analyses. Sci. China Technol. Sci. 2018, 61, 464–474. [Google Scholar] [CrossRef]
  36. Yamini, O.A.; Mousavi, S.H.; Kavianpour, M.R.; Ghaleh, R.S. Hydrodynamic performance and cavitation analysis in bottom outlets of dam using CFD modelling. Adv. Civ. Eng. 2021, 2021, 5529792. [Google Scholar] [CrossRef]
Figure 1. Newly installed hydel capacity in 2019.
Sustainability 14 06930 g001
Figure 2. Complete CAD model based on analytical design.
Sustainability 14 06930 g002
Figure 3. (a) Fabricated Model installed on the site. (b) Non-Contacting Velocity Sensor.
Sustainability 14 06930 g003
Figure 4. Schematic diagram of experimental setup.
Sustainability 14 06930 g004
Figure 5. Three different shapes of blades: (a) V-Shape profile, (b) Straight blade profile, and (c) C-Shape profile.
Sustainability 14 06930 g005
Figure 6. Boundary conditions for CFD analysis of the hydro turbine.
Sustainability 14 06930 g006
Figure 7. Von Mises criterion static analysis of the rotor.
Sustainability 14 06930 g007
Figure 8. Mesh independence test for the turbine.
Sustainability 14 06930 g008
Figure 9. Meshing of (a) the outer domain the turbine, and (b) 3-D Fluid rotating domain.
Sustainability 14 06930 g009
Figure 10. Variations with three blade profiles of immersed depth against (a) average force acting on three blade profiles, (b) average torque, (c) power output, and (d) efficiency of the turbine.
Sustainability 14 06930 g010
Figure 11. Variations of angle of water conduit against (a) average torque and power output for C-shape blade, and (b) efficiency of the C-Shape blade turbine on inclined channels.
Sustainability 14 06930 g011
Figure 12. Variations of power coefficient against Tip Speed Ratios (TSR) for three blade profiles.
Sustainability 14 06930 g012
Figure 13. Verification and validation results of CFD and experimental methods for (a) average force acting on the C-shape blade profile, (b) average torque, (c) power output, and (d) efficiency of the turbine.
Sustainability 14 06930 g013
Figure 14. (a) Velocity contours of the C-shape blade profile on a straight channel. (b) Pressure contours of the C-shape blade profile on a straight channel. (c) Volume fraction contours of the C-shape blade profile on a straight channel.
Sustainability 14 06930 g014aSustainability 14 06930 g014b
Figure 15. (a) Velocity contours of the C-shape blade profile on a θ = 45° inclined channel. (b) Pressure contours of the C-shape blade profile on a θ = 45° inclined channel. (c) Volume fraction contours of the C-shape blade profile on a θ = 45° inclined channel.
Sustainability 14 06930 g015
Figure 16. (a) Blade entering the water on an inclined channel of θ = 45°. (b) Demonstration of the blade tip making an angle φ with the flowing water.
Sustainability 14 06930 g016aSustainability 14 06930 g016b
Table 1. The parameters of the irrigation channel.
ParameterValue
Irrigation channel width (mm)915
Side clearance of irrigation channel (mm)152.5
Bottom clearance with the channel bed (mm)101.6
Thickness of the water sheet in the channel (mm)203.2
Volume flow rate of the channel (m3/s)
Volume flow rate through the waterwheel (m3/s)
0.77
0.26
Dynamic viscosity of water µ (N s/m2)
Reynolds number for flow Re
1.79 × 10⁻⁵
470 × 105
Table 2. Design Parameters of the fabricated waterwheel.
ParametersValue
Rotor diameter (mm)546
Rotor width (mm)611.5
Blade dimensions (mm)
(length × width × thickness)
600 × 101.6 × 10
Number of blades immersed in water4
Number of blades installed on the rim15
Upstream velocity of water V1 (m/s)
Downstream velocity of water V2 (m/s)
4.1
3.5
Shaft diameter (mm)
RPM of the Rotor
Yield strength Sy (N/m2)
Bending moment along Y-Axis My (N-m)
Bending moment along Z-Axis Mz (N-m)
Factor of safety (n)
Drive gear number of teeth
Driven gear number of teeth
25
144
3.51 × 10⁸
116.32
66.386
3
55
13
Blade shape used for CFD simulationsC-shape, V Shape, Straight Blade
Blade shapes used for experimental analysisC-shape
Drag coefficients, C-shape blade 2.3
V-shape blade2.2
Straight blade
C-shape blade exposed on
1.2
1.3
Back side of the flow
Table 3. Parameters comparison of other similar turbines with proposed model.
TypeHead (m)Max. Flow Rate (m3/s)Max. Efficiency (%)Cost (€/kW)Payback Time (Years)
Overshot wheels3−60.280−853900–43007.5–8.5
Breastshot wheels1−40.6−170−854000–70008–12
Undershot wheels≤1.5170−856900–870012–17
Archimedes screw1−6880−857400–780014.4–15.4
Proposed Model1–1.50.7–1.579.2271000–11002.5–3
Publisher’s Note: MDPI stays neutral with regard to jurisdictional claims in published maps and institutional affiliations.

