Abstract
Oil depots in the coastal areas of China are prone to disasters caused by heavy rain due to the monsoon climate. Studies focusing on heavy rainfall vulnerability in coastal oil depots are limited. Therefore, we evaluated the safety of oil depots based on four factors in this study: personnel, equipment and facility, environment, and resilience. Complex networks, analytic hierarchy processes, and information entropy theory were used to establish an evaluation index system including four first-level indicators, nine second-level indicators, and 40 third-level indicators. Scores of 40 evaluation indicators were taken as the input, a vulnerability level of oil depots affected by heavy rain was gained as the output, and results were presented visually (different warning levels distinguished by color) to help oil depot enterprises improve their safety performance under extreme weather conditions.
1. Introduction
Coastal oil depots are built with reliance on ports and distributed in many parts of the world [1]. Currently, China has nine large-scale crude oil depots with total reserves of more than 60 million tons. Owing to the frequent extreme climatic conditions in coastal areas, including extremely heavy rainfall and typhoons, oil depots are prone to considerable damage [2]. Heavy rainfall can further lead to disasters, such as atmospheric storage tank depression, road waterlogging, workplace waterlogging, atmospheric pressure tank deflation, and chemical park flooding, which influence normal production and cause casualties and economic losses [3]. For the disaster management of coastal oil depots, it is important to research their vulnerability to intense storms and heavy rainfall while considering coastal oil depot exposure.
Most previous studies have focused on common accidents such as fires and explosions [4] and hope to reduce their effects. Shi et al. [5] proposed a fuzzy fault tree assessment based on analytic hierarchy processes (AHP) for steel oil storage tanks, but the evaluation method, which is easily affected by experts’ experiences, is unable to include as many accident causes as possible. Similarly, Chen et al. [6] developed an interpretive structural model and system dynamics for large crude oil depots, which depends on the subjective judgment of experts and has four indexes, including human, equipment, environment, and management. However, resilience should be regarded as an important part of the evaluation system and should be considered. Ding et al. [7] proposed a model considering fire and explosion in a synergistic effect, which serves as a quantitative risk assessment tool to evaluate equipment vulnerability under a spatial-temporal synergy of heat and pressure. Liu et al. [8] studied the aftermath of a tank leakage accident by computational fluid dynamic simulation, which plays a huge role in accident prediction. Except for equipment vulnerability, other factors should be taken into account in simulations, such as management, human vulnerability, environment vulnerability, and so on.
Research on other aspects of oil tanks has been published in recent years, such as studies considering the combined loadings of the fragmenting impact and pool-fire caused by domino accidents, analyzing the prevention of fire-induced domino effects based on a fuzzy Petri et (FPN) [9], constructing the automation of emergency response for petroleum oil storage terminals [10], identifying the most vulnerable installations of process plants subject to domino effects [11], and using a comprehensive risk assessment to analyze the vulnerability of the oil and gas sector to climate change and extreme weather events.
Vulnerability studies in other industries also provide a great and valuable reference, such as studies on pipelines and LNG. Wang et al. [12] studied the vulnerability of gas transmission capabilities of natural gas pipeline networks; by multiplying the component importance and risk values, the vulnerability of the component was obtained. Rossi et al. [13] implemented a quantitative risk assessment (QRA) for evaluation of the failure probability and frequency of piping involved in flooding. Hu et al. [14] analyzed marine LNG offloading systems’ dynamic resilience, considering weather-related hazards based on IRML, weather factors affecting human performance, maintenance measures, and system resilience.
With the development of technology, some advanced technologies are used in the evaluation system, such as cloud model theory and algorithms. Karthik et al. [15] developed a comprehensive procedure for risk assessment of the industry’s sites, using geospatial tools to evaluate and map personnel vulnerability in Kerala, India. Additionally, social media is more and more commonly used as a data source to track disaster events and assess the consequences caused by natural hazards, such as heavy rain and floods [16,17]. The methods have higher requirements for historical data and are more sensitive to the quality of data processing, but are applied with difficulty to those fields with little data.
Rainy weather and flooding with particles will damage oil tanks and cause oil spill accidents due to the potential energy of the water or long-term immersion. Previous studies provided various methods for analyzing the vulnerability of natural hazards, such as the quantitative risk assessment method, a weighted comprehensive evaluation, analytic hierarchy processes, etc. However, the scenarios are different as petrochemical companies gradually migrate to islands, many oil depots are placed in coastal areas and islands, and the heavy rainfall brought by the subtropical monsoon climate should be regarded as a significant natural hazard. Thus, it is important to establish an evaluation system to reduce the impact of heavy rain on coastal oil depots. The present study intended to take advantage of previous studies and carry out a quantitative risk assessment, supporting the oil depot industry to strengthen its emergency management system capability.
This paper is structured as follows. Section 2 presents the vulnerability of heavy rainfall to coastal oil depots with the damage caused and the factors affecting it. In Section 3, the evaluation index system for assessing heavy rainfall vulnerability in coastal oil depots in detail is introduced, which includes four first-level indicators, nine second-level indicators, and 40 third-level indicators. The indicators were selected using a complex network combined with expert opinions, and indicator weight was generated using multiple methods such as analytic hierarchy process (AHP), and information entropy theory. Through the evaluation index system, a heavy rainfall disaster assessment was constructed for a coastal oil depot.
2. Heavy Rainfall Vulnerability
2.1. Damage Caused by Heavy Rainfall to Coastal Oil Depots
The vulnerability analyses of coastal oil depots should be based on specific heavy rainfall disasters, which are often accompanied by sudden cooling. The disasters caused in oil depots following heavy rainfall as shown in Figure 1 include (1) short-circuiting of instruments due to water, (2) clogging of tank’s breathing valve, (3) overflowing of the cesspool, (4) road waterlogging, (5) pump room flooding, (6) fire dike flooding, (7) storage tank material expanding and contracting with temperature variation, (8) flange expansion and contraction due to temperature, (9) pipe-line crystal precipitation, and (10) temperature abnormality of high-temperature devices.
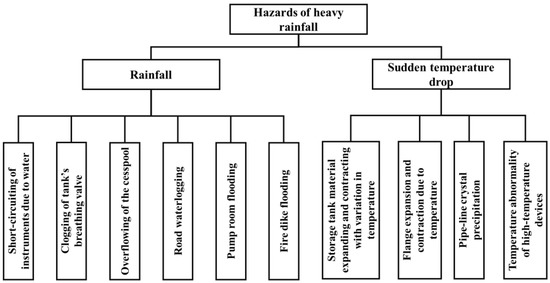
Figure 1.
Harmful effects of heavy rainfall.
2.2. Factors Affecting Heavy Rainfall Vulnerability in Coastal Oil Depots
This study considers personnel, equipment and facilities, and environmental vulnerabilities as the different subsystems of heavy rainfall exposure vulnerability in coastal oil depots based on analyses of the damage caused [18]. This system also presents the ability to repair damaged equipment and resume production, which is represented by resilience, as shown in Figure 2.
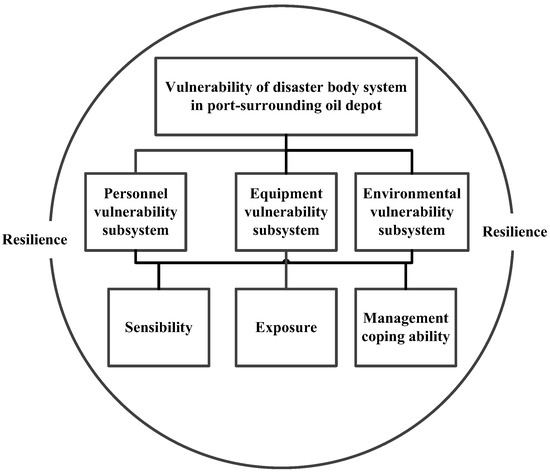
Figure 2.
Structure diagram representing factors influencing heavy rainfall vulnerability in coastal depots.
- (1)
- Personnel vulnerability
Personnel, who also constitute a part of the disaster victims, play an important role in the disaster response capacity of oil storage enterprises. The physical health, operational proficiency, and safety awareness of the staff in the oil depot affect their safety in daily work, as well as the disaster resistance and mitigation capability of the oil depot. The factors affecting personnel vulnerability include age structure, working years, health status, education, psychological factors, operational proficiency, and exposure [19,20].
- (2)
- Equipment and facility vulnerabilities
Equipment and facilities in coastal oil depots are the main victims of heavy rainfall, and vulnerability is affected by exposure, sensitivity, and management coping abilities. The factors affecting equipment and facility vulnerabilities include equipment and facility exposure, function importance, asset ability, disaster resistance, degree of material danger, material quantity, and energy.
- (3)
- Environmental vulnerability
The oil depot environment includes the natural and the surrounding environments. In addition, the oil depot environment also regulates a company’s reputation and sociocultural environment. On the one hand, the environment has a role to play in deciding whether heavy rainfall will cause disasters. On the other hand, it is vulnerable to accidental pollution from the oil storage facility. The factors affecting the natural environment include slope, water environment, and soil environment [21].
- (4)
- Resilience
Resilience is the ability to quickly restore a damaged body to its original state after a disaster, which enables the facility to resume production and reduce economic losses. The factors affecting resilience include the disaster recovery plan, loss assessment, bearing capacity, and social assistance [22].
3. Evaluation Index System
The factors affecting heavy rainfall vulnerability in coastal oil depots analyzed in Section 2 cannot be directly considered as an evaluation index. Some of the pre-indicators of influencing factors are relatively imprecise and need to be refined into multiple indicators. Through research on complex network theory, an evaluation index is selected and obtained by applying AHP and entropy theory.
3.1. Index Identified
The pre-evaluation is refined, and the following operations are performed based on the analyses of vulnerability factors.
- (1)
- Establishing an adjacency matrix of vulnerability factors
An adjacency matrix as shown in Figure 3 was established using Microsoft Spreadsheet, with different nodes indicating different evaluation indexes determined by applying AHP and entropy theory. The adjacency matrix is the data that characterizes the relationship between a set of vertices. In the adjacency matrix, two connected nodes imply that they are related and affect each other. The relationship between nodes is represented by 1 and 0. One indicates that the nodes affect each other and a line is formed between them. In addition, zero means that the two nodes do not influence each other and do not form a line between them [23]. For example, Node2#, the physical examination pass rate, influences Node4#, operational proficiency (a high physical examination pass rate has a positive influence on an employee’s operational proficiency); thus, they are connected with a line in the network and given the number 1.
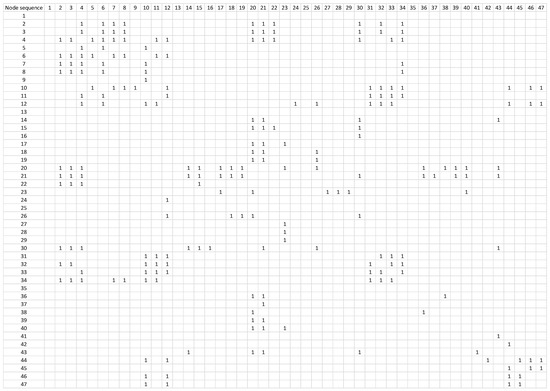
Figure 3.
The adjacency matrix of vulnerability factors.
The node order and corresponding evaluation index are shown in Table 1.

Table 1.
Node order and corresponding evaluation index.
- (2)
- Establishing a complex network
According to the node relation data provided by the adjacency matrix, we established a complex network using MATLAB R2018a (Figure 4) and obtained the distribution diagram of the node degree (Figure 5).
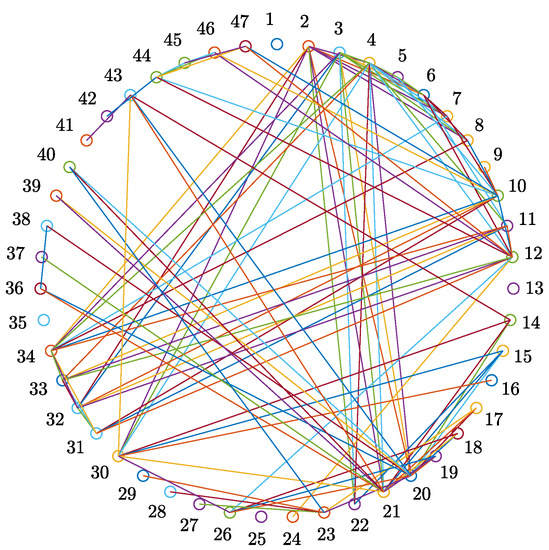
Figure 4.
A complex network diagram (There is no specific meaning with the different colors, two connected nodes imply that they are related and affect each other).
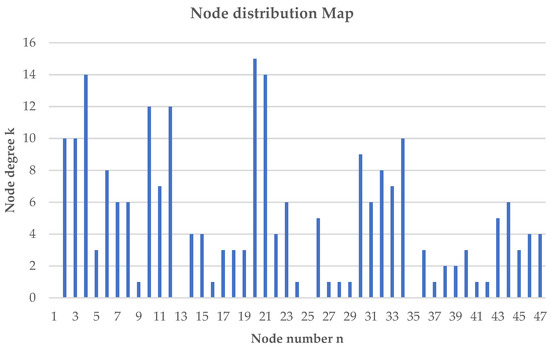
Figure 5.
Degree distribution of nodes in the complex network.
- (3)
- Final approval
It can be observed from the complex network and node distribution graph that there are many connections between surrounding nodes in part of the network, such as the node group around Node 4 and the node groups around Nodes 10 and 20. Calculating the node’s degree centrality can confirm whether a node is important and, furthermore, expert opinions can be combined to obtain an appropriate evaluation index for heavy rainfall vulnerability assessment in coastal oil depots. Degree centrality states that the more nodes near a node, the greater the influence of the node, and the more important it is [24]. A degree-centered method was used for the comparison of different nodes.
where represents degree centrality, represents the degree of node i, N is the number of nodes in the complex network, and N − 1 is the maximum possible degree value of the node [25,26]. The degree centrality of nodes is shown in Table 2.
Table 2.
Degree centrality of nodes.
It can be seen from the above Table 2 that the degree centrality of some nodes is low or even close to zero. Nodes with a degree centrality lower than 0.022 considered with very low influence. Simultaneously, key nodes such as nodes 4, 10, 20, and 21 are reserved. However, due to the defects of the complex network itself, the test results sometimes conform to the complex network theory but are not quite realistic. Therefore, it is necessary to ask experts for final approval. By combining expert opinions and the selection of the complex network, the necessary nodes were maintained and the final evaluation index of exposure vulnerability was obtained, as shown in Table 3.
Table 3.
Evaluation index and weight of heavy rainfall vulnerability in coastal oil depots.
“Personnel vulnerability-A” is one of the four first-level indicators; it is composed of three second-level indicators, which are “Personnel exposure-A1”, “Personnel sensitivity-A2”, and “Personnel management response-A3”. “Personnel exposure-A1” has only one third-level indicator, “Personnel exposure density-A11” while A2 has seven third-level indicators. The number in brackets is the weight of that indicator under the upper-level indicator.
3.2. Weight Definition
The AHP method was used to obtain the judgment matrix from the experts’ scores. The standard score is from Satty’s proportional scale. From multiple weight value schemes, we calculated and compared the information entropy of several weight value schemes and found the best scheme with the least amount of unknown information E [27].
- (1)
- Establish the judgment matrix of the evaluation index
Establishing a judgment matrix to evaluate the index of the personnel, equipment and facilities, environmental vulnerabilities, and resilience according to the structure of the index system is as follows:
where A is the judgment matrix, is the index i’s importance degree compared to index j, n represents the order of the matrix and the importance degree is as per Satty’s scale method. The index’s significance ratio is 1.
- (2)
- Perform consistency check
The judgment matrix can be used only after passing the consistency check and when the comparison test coefficient CR is less than 0.1, the matrix passes the consistency check. Otherwise, a new matrix must be established [28]. The consistency index of the matrix CI can be calculated as follows:
After obtaining the RI value through the table query, the comparison test coefficient can be calculated as follows:
- (3)
- Generate weight scheme
The total information of the index measure was obtained through the composition of vulnerability assessment indicators. Similarly, through a series of control measures and the implementation of engineering measures, the uncertainty was reduced before the implementation of measures was obtained, and the amount reduced was represented as [29]. Risk is the potential before the implementation of regulatory measures or risk management and is subject to the inevitable constraint information amount E under certain constraints. The essence of risk is to display and map an intrinsic measure of risk. When is certain, the larger the value of E, the smaller the value of the fewer are the functions of risk control and management measures to the risk itself, and the higher is the risk [30,31].
where n represents the number of evaluation indexes and represents the node’s weight.
The maximum Eigen, weight, CR, and E values were obtained using MATLAB R2018a. For example, the first-level indicator weight scheme (Table 4, Table 5 and Table 6) chooses the scheme with the smallest E.
Table 4.
First-level indicator weight scheme 1.
Table 5.
First-level indicator weight scheme 2.
Table 6.
First-level indicator weight scheme 3.
The weight of each index was calculated according to the above steps to obtain the weighting scheme (Table 3).
3.3. Comprehensive Evaluation
A weighted comprehensive evaluation is one of the most used methods in a comprehensive evaluation. We consider this to be a comprehensive evaluation of heavy rainfall vulnerability in coastal oil depots.
where is the actual score of the third-level indicators, X is the full score, is the status value and the value range is [0, 1], n is the number of indicators in a layer, is the weight value of the corresponding index, and L is the score status value of the layer index. The final score is obtained in the same manner. For example, the A2 index, after calculation, scored 0.81 (Table 7).
Table 7.
Score table of A2 and its subordinate indexes.
3.4. Classification of Vulnerability
The classification of vulnerability is based on the obtained vulnerability and the value range of vulnerability is [0, 1]. The specific analyses are presented in Table 8.
Table 8.
Heavy rainfall vulnerability classification table.
4. Conclusions
Research on the risk management of coastal oil depots during heavy rainfall disasters is still relatively weak. In this study, we constructed an emergency management system suitable for coastal oil depots by studying their vulnerability to heavy rainfall events. The damage caused to coastal oil depots by heavy rainfall was analyzed to determine the factors affecting the vulnerability of disaster-bearing bodies.
An evaluation index of heavy rainfall vulnerability in coastal oil depots was established using a questionnaire survey, expert scoring, and complex network theory combined with information entropy theory. Using the comprehensive evaluation method with three levels of indicators, it was found that “safety management perfection-A33” holds the highest weight in the evaluation system, which means the oil depot operating corporation should this give a high priority and carry out continuous improvement activities. A final score of risk assessment was gained and could be presented visually with its prewarning level to an oil depot corporation.
Considering that most of the coastal oil depots are located in industrial parks or remote island areas, connecting with outside emergency rescue responders is crucial in responding to natural disasters. With the wide application of mobile social networks in different industries, social network technology (WeChat is more commonly used in China) can be applied to send a message including precipitation trends, safety warning levels, etc., to the workgroup, composed of the emergency management department of the oil depot company, local rescue teams, and local government, to obtain a fast transmission of information and more effective cooperation under extreme weather conditions. When a disaster occurs, emergency procedures can be triggered in a timely manner to minimize the damage and impact caused by a natural hazard.
Author Contributions
Conceptualization, J.G.; methodology, J.G. and J.W.; formal analysis, J.G.; investigation, B.H.; resources, B.Z.; data curation, J.W.; writing—original draft preparation, J.W. and B.H.; writing—review and editing, C.L.; visualization, B.Z.; supervision, J.H.; funding acquisition, J.H. All authors have read and agreed to the published version of the manuscript.
Funding
This work was supported by the Zhoushan Science and Technology Project (2022C01020), Zhejiang Province Key Research and Development Plan (2021C03152), and Zhoushan Science and Technology Project (2021C21011).
Institutional Review Board Statement
Not applicable.
Informed Consent Statement
Not applicable.
Data Availability Statement
Not applicable.
Conflicts of Interest
The authors declare no conflict of interest.
References
- Xie, S.; Dong, S.; Chen, Y.; Peng, Y.; Li, X. A novel risk evaluation method for fire and explosion accidents in oil depots using bow-tie analysis and risk matrix analysis method based on cloud model theory. Reliab. Eng. Syst. Saf. 2021, 215, 107791. [Google Scholar] [CrossRef]
- Cruz, A.M.; Krausmann, E. Vulnerability of the oil and gas sector to climate change and extreme weather events. Clim. Change 2013, 121, 41–53. [Google Scholar] [CrossRef]
- Shuai, J.; Han, K.; Xu, X. Risk-based inspection for large-scale crude oil tanks. J. Loss Prev. Process Ind. 2012, 25, 166–175. [Google Scholar] [CrossRef]
- Chen, C.; Khakzad, N.; Reniers, G. Dynamic vulnerability assessment of process plants with respect to vapor cloud explosions. Reliab. Eng. Syst. Saf. 2020, 200, 106934. [Google Scholar] [CrossRef]
- Shi, L.; Shuai, J.; Xu, K. Fuzzy fault tree assessment based on improved AHP for fire and explosion accidents for steel oil storage tanks. J. Hazard. Mater. 2014, 278, 529–538. [Google Scholar] [CrossRef] [PubMed]
- Chen, L.Q.; Feng, Y.X.; Zhen, H.L.; Li, Q.C.; Lu, J.Y. Risk assessment of large crude oil depot based on interpretative structural model and system dynamics. Int. J. Oil Gas Coal Technol. 2020, 25, 161–183. [Google Scholar] [CrossRef]
- Ding, L.; Khan, F.; Ji, J. A novel vulnerability model considering synergistic effect of fire and overpressure in chemical processing facilities. Reliab. Eng. Syst. Saf. 2022, 217, 108081. [Google Scholar] [CrossRef]
- Liu, Q.; Chen, Z.; Liu, H.; Yin, W.; Yang, Y. CFD simulation of fire dike overtopping from catastrophic ruptured tank at oil depot. J. Loss Prev. Process Ind. 2017, 49, 427–436. [Google Scholar] [CrossRef]
- Zhou, J.; Reniers, G. Analysis of emergency response actions for preventing fire-induced domino effects based on an approach of reversed fuzzy Petri-net. J. Loss Prev. Process Ind. 2017, 47, 169–173. [Google Scholar] [CrossRef]
- Sharma, R.K.; Gurjar, B.R.; Singhal, A.V.; Wate, S.R.; Ghuge, S.P.; Agrawal, R. Automation of emergency response for petroleum oil storage terminals. Saf. Sci. 2015, 72, 262–273. [Google Scholar] [CrossRef]
- Khakzad, N.; Reniers, G.; Abbassi, R.; Khan, F. Vulnerability analysis of process plants subject to domino effects. Reliab. Eng. Syst. Saf. 2016, 154, 127–136. [Google Scholar] [CrossRef]
- Wang, W.; Zhang, Y.; Li, Y.; Hu, Q.; Liu, C.; Liu, C. Vulnerability analysis method based on risk assessment for gas transmission capabilities of natural gas pipeline networks. Reliab. Eng. Syst. Saf. 2022, 218, 108150. [Google Scholar] [CrossRef]
- Rossi, L.; Moreno, V.C.; Landucci, G. Vulnerability assessment of process pipelines affected by flood events. Reliab. Eng. Syst. Saf. 2022, 219, 108261. [Google Scholar] [CrossRef]
- Hu, J.; Khan, F.; Zhang, L. Dynamic resilience assessment of the Marine LNG offloading system. Reliab. Eng. Syst. Saf. 2021, 208, 107368. [Google Scholar] [CrossRef]
- Rajeev, K.; Soman, S.; Renjith, V.; George, P. Human vulnerability mapping of chemical accidents in major industrial units in Kerala, India for better disaster mitigation. Int. J. Disaster Risk Reduct. 2019, 39, 101247. [Google Scholar] [CrossRef]
- Li, Z.; Wang, C.; Emrich, C.T.; Guo, D. A novel approach to leveraging social media for rapid flood mapping: A case study of the 2015 South Carolina floods. Cartogr. Geogr. Inf. Sci. 2018, 45, 97–110. [Google Scholar] [CrossRef]
- Huang, Q.; Cervone, G.; Zhang, G. A cloud-enabled automatic disaster analysis system of multi-sourced data streams: An example synthesizing social media, remote sensing and Wikipedia data. Comput. Environ. Urban Syst. 2017, 66, 23–37. [Google Scholar] [CrossRef]
- Santos, M.; Fragoso, M.; Santos, J.A. Regionalization and susceptibility assessment to daily precipitation extremes in mainland Portugal. Appl. Geogr. 2017, 86, 128–138. [Google Scholar] [CrossRef]
- Tsinidis, G.; Di Sarno, L.; Sextos, A.; Furtner, P. A critical review on the vulnerability assessment of natural gas pipelines subjected to seismic wave propagation. Part 1: Fragility relations and implemented seismic intensity measures. Tunn. Undergr. Space Technol. 2019, 86, 279–296. [Google Scholar] [CrossRef] [Green Version]
- Tsinidis, G.; Disarno, L.; Sextos, A.; Furtner, P. A critical review on the vulnerability assessment of natural gas pipelines subjected to seismic wave propagation. Part 2: Pipe analysis aspects. Tunn. Undergr. Space Technol. 2019, 92, 103056. [Google Scholar] [CrossRef]
- Berahman, F.; Behnamfar, F. Probabilistic seismic demand model and fragility estimates for critical failure modes of un-anchored steel storage tanks in petroleum complexes. Probabilistic Eng. Mech. 2009, 24, 527–536. [Google Scholar] [CrossRef]
- Kildashti, K.; Mirzadeh, N.; Samali, B. Seismic vulnerability assessment of a case study anchored liquid storage tank by considering fixed and flexible base restraints. Thin-Walled Struct. 2018, 123, 382–394. [Google Scholar] [CrossRef]
- Dong, M.; Meng, Y.; Song, X.; Qin, C.; Bai, M.; Yin, F.; Zhao, D. Research on vulnerability analysis model of security accident system in petrochemical enterprises. Process Saf. Prog. 2022, 41, 177–190. [Google Scholar] [CrossRef]
- Zhang, J.; Luo, Y. Degree centrality, betweenness centrality, and closeness centrality in social network. In Proceedings of the 2017 2nd International Conference on Modelling, Simulation and Applied Mathematics (MSAM2017), Bangkok, Thailand, 26–27 March 2017; Volume 132, pp. 300–303. [Google Scholar]
- Ghorbani, M.; Li, X.; Zangi, S.; Amraei, N. On the eigenvalue and energy of extended adjacency matrix. Appl. Math. Comput. 2021, 397, 125939. [Google Scholar] [CrossRef]
- Erkan, G.; Radev, D.R. Lexrank: Graph-based lexical centrality as salience in text summarization. J. Artif. Intell. Res. 2004, 22, 457–479. [Google Scholar] [CrossRef]
- Mikhailov, L.; Tsvetinov, P. Evaluation of services using a fuzzy analytic hierarchy process. Appl. Soft Comput. 2004, 5, 23–33. [Google Scholar] [CrossRef] [Green Version]
- Franek, J.; Kresta, A. Judgment scales and consistency measure in AHP. Procedia Econ. Financ. 2014, 12, 164–173. [Google Scholar] [CrossRef] [Green Version]
- Xiao, Q.; He, R.; Ma, C.; Zhang, W. Evaluation of urban taxi-carpooling matching schemes based on entropy weight fuzzy matter-element. Appl. Soft Comput. 2019, 81, 105493. [Google Scholar] [CrossRef]
- Nagpal, R.; Mehrotra, D.; Bhatia, P.K. Usability evaluation of website using combined weighted method: Fuzzy AHP and entropy approach. Int. J. Syst. Assur. Eng. Manag. 2016, 7, 408–417. [Google Scholar] [CrossRef]
- Zhao, H.; Yao, L.; Mei, G.; Liu, T.; Ning, Y. A fuzzy comprehensive evaluation method based on AHP and entropy for a landslide susceptibility map. Entropy 2017, 19, 396. [Google Scholar] [CrossRef]
Publisher’s Note: MDPI stays neutral with regard to jurisdictional claims in published maps and institutional affiliations. |
© 2022 by the authors. Licensee MDPI, Basel, Switzerland. This article is an open access article distributed under the terms and conditions of the Creative Commons Attribution (CC BY) license (https://creativecommons.org/licenses/by/4.0/).