Article

Study on Spatial-Distribution Characteristics Based on Fire-Spot Data in Northern China

Key Laboratory of Sustainable Forest Ecosystem Management-Ministry of Education, School of Forestry, Northeast Forestry University, Harbin 150040, China
*
Authors to whom correspondence should be addressed.
These authors contributed equally to this work.
Sustainability 2022, 14(11), 6872; https://doi.org/10.3390/su14116872
Submission received: 24 April 2022 / Revised: 1 June 2022 / Accepted: 2 June 2022 / Published: 4 June 2022

Abstract

:
Forest fires are an important disturbance in forest ecosystems and can affect the structure and function of forests. These must be mitigated, to eliminate the associated harmful impacts on forests and the environment as well as to have a healthy and sustainable environment for wildlife. The northern region of China (Heilongjiang, Jilin, Liaoning, and Hebei provinces) is one of the important deciduous broadleaf forests and boreal-forest ecosystems in China. Based on the monitoring of historical remote-sensing products, this study analyzes and explores the spatial- and temporal-distribution patterns of forest fires in Northern China in 2020 and 2021, providing a strong scientific basis for forest-fire prevention and management. The number of monthly forest fires in the northern region in 2020 and 2021 was counted, to obtain seasonal and interannual forest-fire variation. The results show that the number of forest fires occurring in Heilongjiang, Jilin, and Liaoning provinces in 2021 is smaller than that in 2020. The occurrence of forest fires is, mainly, concentrated in spring and autumn, especially in April and October. The number of forest fires that occurred in Hebei Province in 2020 and 2021 was almost the same, showing a slight increasing trend, especially with more growth in February. It is worth noting that Heilongjiang Province is the region with the highest number of forest fires, regardless of the comparison of the total number of forest fires in two years or the number of forest fires in a single year. Spatial-clustering analysis (Ripley’s K) was used to analyze the spatial-distribution pattern of forest fires, in each province of northern China, and the results showed that forest fires were significantly aggregated in all four provinces. The experimental analysis conducted in this paper can provide local forest managers and firefighting agencies with the opportunity to better plan for fighting fires and improve forest-management effectiveness. Based on mastering the characteristics of the spatial and temporal dynamics of forest fires, fire-prevention publicity and education should be strengthened, and scientific forest-fire-prevention measures should be applied to plan reasonable forest-protection policies. This will contribute towards a healthy and sustainable environment.

1. Introduction

Forest fires play an important role in forest regeneration and succession as well as the evolution of deciduous broadleaf and boreal forests [1]. However, fires are cyclical, sudden, and can pose significant risks to ecological environment, the economy, and human life. Fires can impact plant-species biodiversity in forests [2,3,4]. In forest ecosystems worldwide, they are important natural disturbances that drive the dynamics of the forest structure and its role [5]. At the same time, forest fires are considered a worldwide forestry disaster, and it is estimated that approximately 1% of the global forest area is destroyed by them each year [6]. In recent years, continued warm and dry weather as well as frequent extreme-weather events have led to severe forest fires in many areas of the world. Including the boreal coniferous forests in Spain, Greece, and the Rocky Mountains in the western United States [7], forest ecosystems are at high risk of functional decline, as a result. In the era of global sustainable development, addressing such fire hazards is imperative.
Since 1987, China has set up a strict forest-fire prevention and suppression policy. However, forest-fire events have not disappeared as a result, and major incidents still occur. Therefore, a macro and accurate grasp of the current spatial- and temporal-distribution characteristics of forest fires can, effectively, reduce the occurrence of fire and minimize the impact on humans, economics, or the ecosystem. It can help to deeply understand the local fire-occurrence pattern, to scientifically recognize and define the ecological role and social features, which is a crucial element in protecting forest resources. At the same time, it is of great practical significance for the rational formulation of forest-fire-management policies and the reduction in the adverse effects on natural ecosystems and human society. The northern part of China has the Greater Khingan Mountains, the Lesser Khingan Mountains, the Changbai Mountains, and the Northeast Plain. They are abundant in resources and are one of the most important natural forest-distribution areas in China as well as the richest area in the world that has plant germplasm resources at the same latitude [8]. At the same time, the northern region is one of the areas most affected by fires, which cause considerable damage and occur mostly in the spring and autumn. Air pollution from fires is a serious environmental problem that poses a risk to both human and ecosystem health [9,10]. With global climate change, there is a clear trend of increasing temperature and uneven rain distribution in the region, including occasional extensive droughts [8]. Forest fires have caused serious harm to resources, terrestrial ecosystems, and, even, the achievements of ecological civilization construction. In particular, they pose a significant threat to the safety of the population and property, so the dynamic situation is worthy of attention [11,12].
Fires occur in a certain spatial area and are characterized by spatial properties. Fire can be viewed as a point event on a regional scale. Spatial-point-pattern analysis is a method to analyze the spatial-distribution pattern of geographic entities or event-occurrence points. Its core problem is to study whether the distribution of geographic entities or events is clustered, uniform, or discrete in space. The probability of fire occurrence varies widely across the world, in different regions and ecosystems, and these are heavily influenced by altitude and slope [13,14,15,16]. Historical forest-fire information is an important basis, for studying the spatial- and temporal-distribution characteristics of forest fires. Remote-sensing technology can provide Earth observation information of different scales as well as clear spatial and temporal characteristics, which is the most recent technical means for monitoring the occurrence and development dynamics of forest-fire events [17,18,19]. It is, also, an important source of information for systematically quantifying the characteristics of historical fire patches and improving the database of forest-fire information. Remote-sensing monitoring of forest fires has a long history and a well-established methodology on regional and, even, global scales. Various global fire products exist, with MODIS and NPP data products being widely used [20,21,22]. Spatial point feature analysis is an important method, to comprehensively understand the overall characteristics of a region. Quantitative statistics as well as analysis of the spatial and temporal characteristics of forest fires in a region, based on historical fire databases or existing global fire products, is one of the common ways to study regional forest fires. In recent years, it has been widely used in forest-fire analysis. Some studies have analyzed forest-fire characteristics and spatial-distribution patterns [23,24,25]. For example, a study using fire-spot statistics and MODIS products applied spatial-statistical methods to describe the spatial distribution and temporal variation of fires in different regions [26]. Some researchers combined multiple fire products (MODIS, NPP) and used the Mann–Kendall method to examine fire trends in several countries in South Asia and Southeast Asia [27]. Reports on forest fires in the northern region, in recent years, have focused on prediction and suppression methods [28,29,30,31]. Therefore, it is necessary to conduct research on the forest-fire spatial- and temporal-distribution patterns in the northern region. In this study, forest-fire data, from four typical provinces (Heilongjiang, Jilin, Liaoning, and Hebei Provinces) in the northern region of China, from 2020 to 2021, are used as the research object. This study analyzes the general trends in terms of interannual, seasonal, and monthly time frames, as well as the spatial- and temporal-distribution characteristics of forest fires. Here, we aim to provide a basis for forest-fire prediction and management in the northern region. The main objectives of this study were to (1) identify and compare the spatial-distribution characteristics of the four provinces, (2) obtain the fire-hotspot areas in each province, and (3) provide future direction of forest-fire management. This study aims to provide insights and support, for the easy implementation of regional fire-management strategies in different forest regions of northern China.

2. Materials and Methods
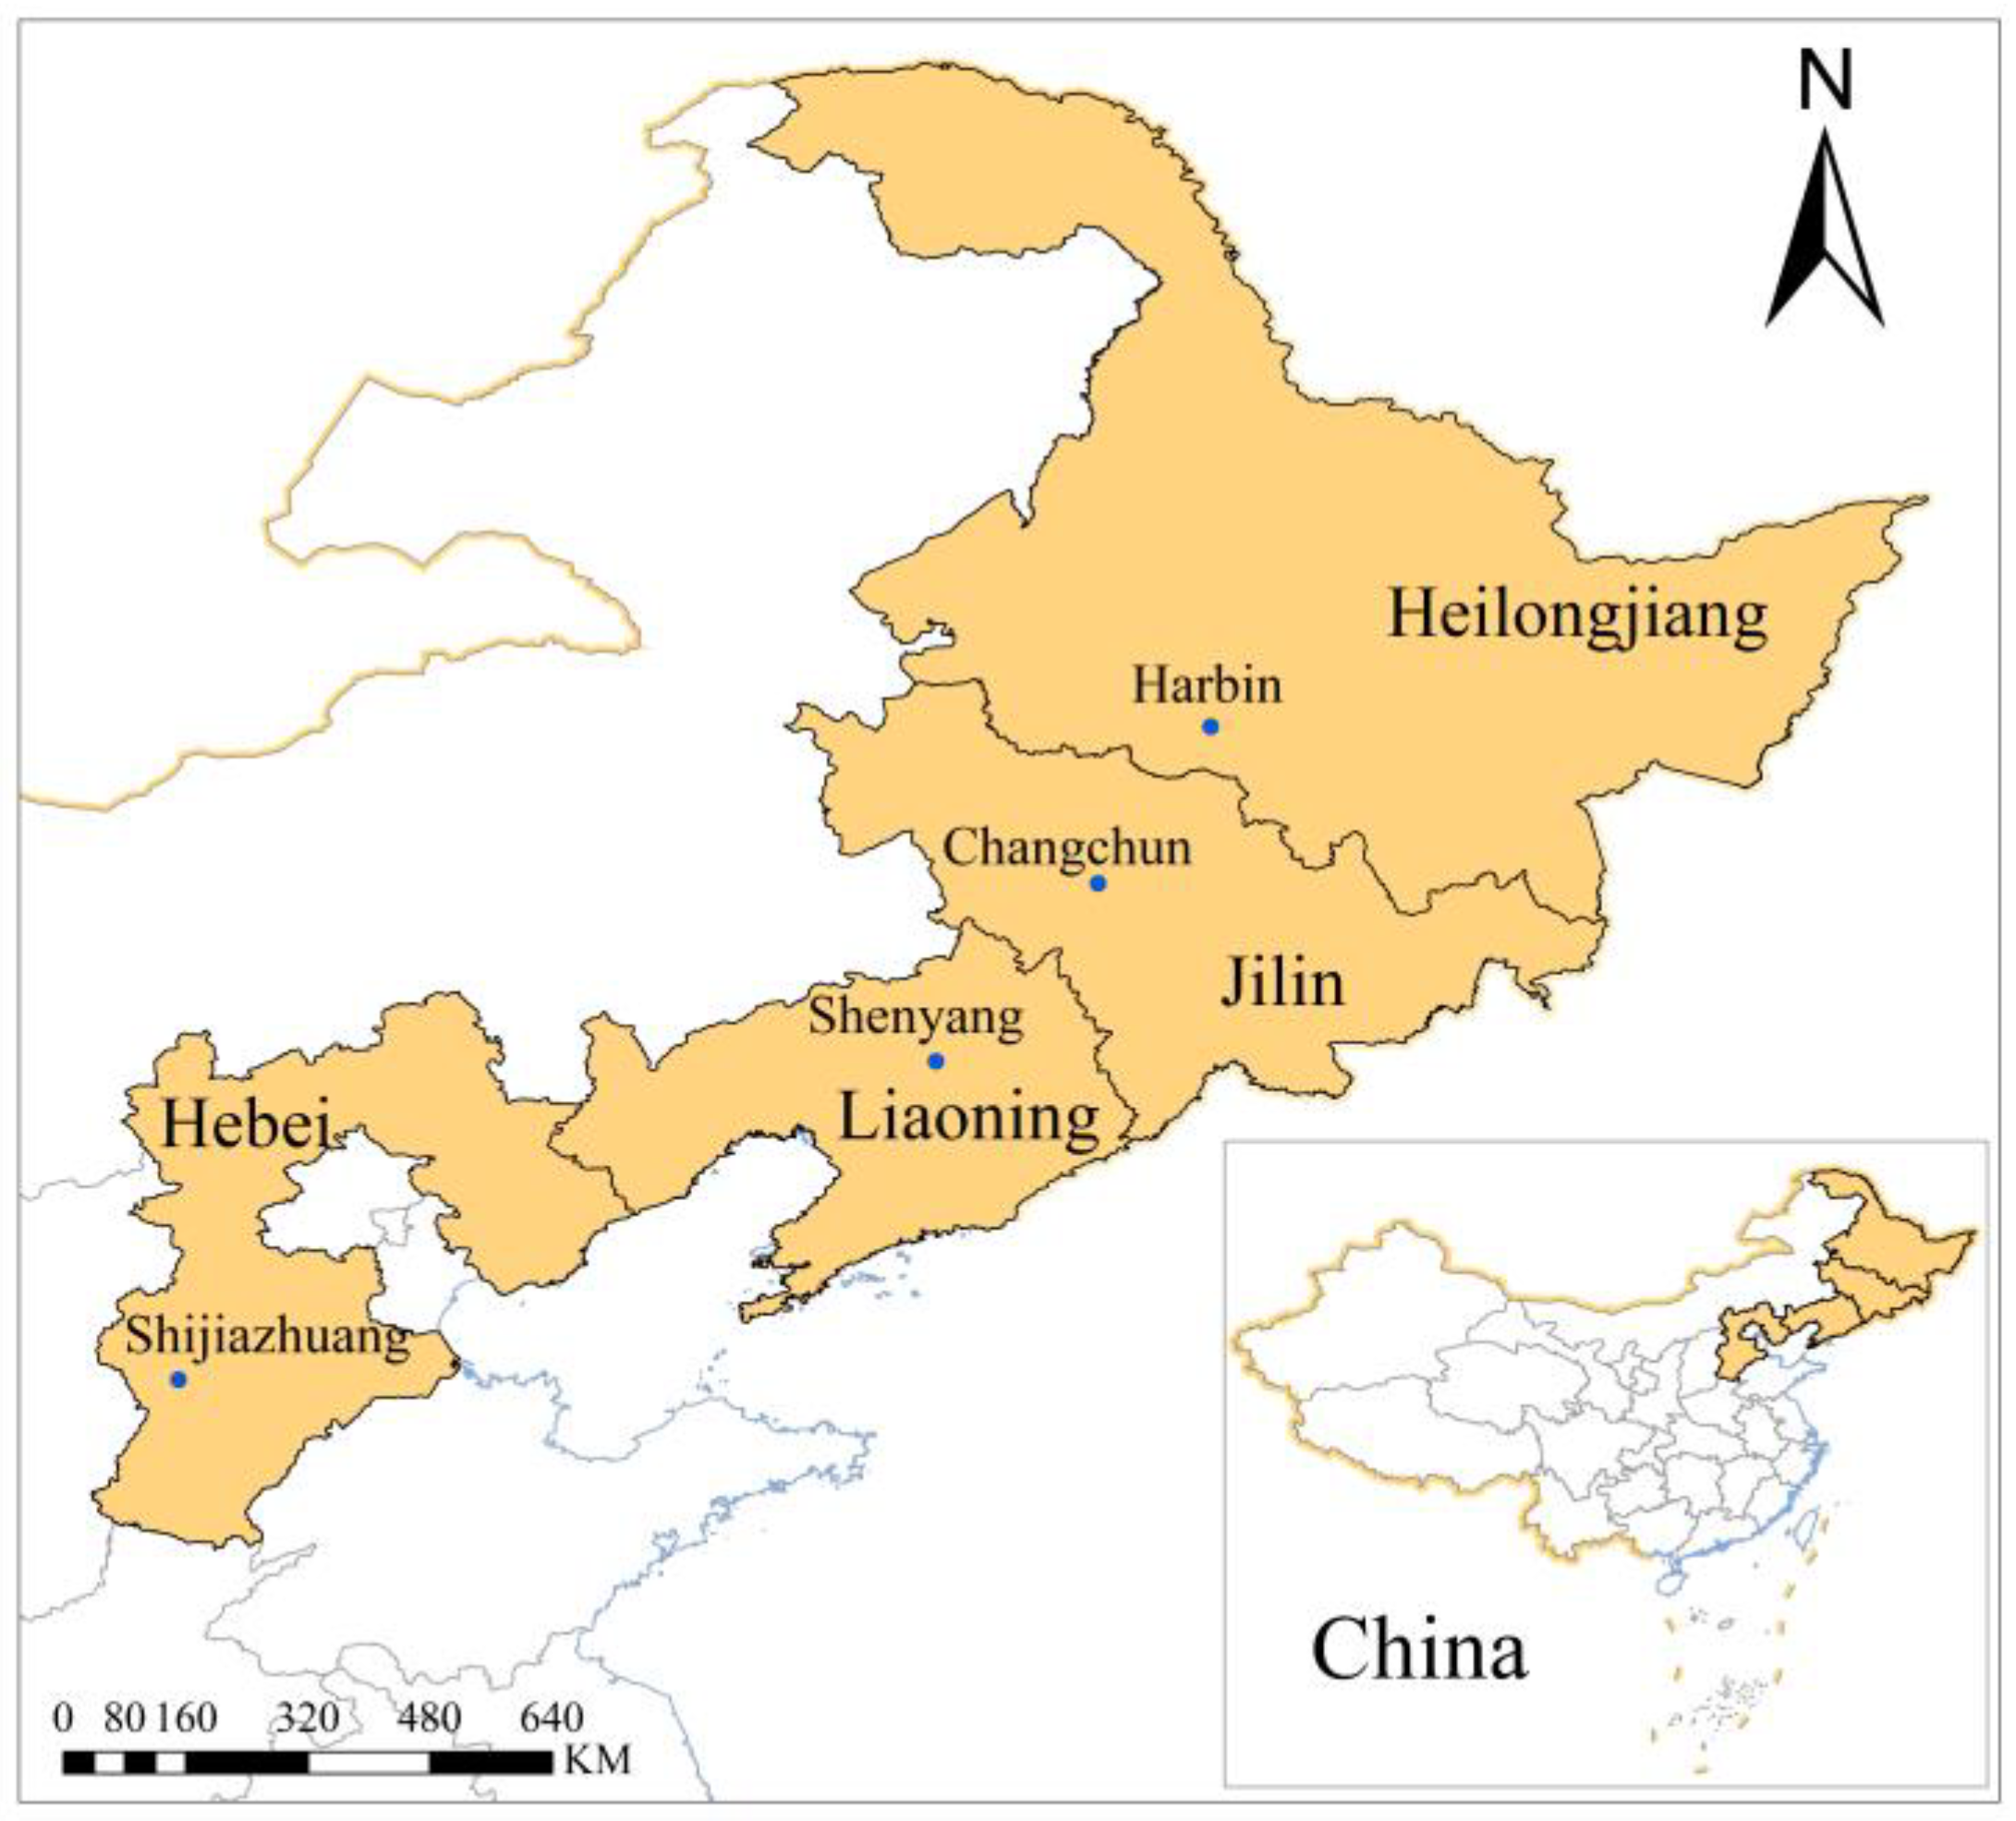
2.1. Study Area

Heilongjiang, Jilin, Liaoning, and Hebei provinces (named HLJ, JL, LN, and HB, respectively) in the northern region of China were used as the study area (Figure 1). HLJ is located at 121°11′~135°05′ E and 43°25′~53°23′ N, bordering JL in the south and Russia across the river in the northeast. The province covers an area of 47.3 × 10⁴ square kilometers. The mountain altitudes range from 300 m to 1600 m. The climate is continental, cold, and dry in the winter, hot and rainy in the summer, and windy in the spring and autumn. The air humidity is low, and the annual precipitation is 500~600 mm. The main tree species include Pinus koraiensis, Larix gmelinii, Picea koraiensis, Quercus mongolica, and Betula platyphylla. JL is located in the eastern part of northeastern China and is connected to LN and HLJ. It is located between 121°38′~131°19′ E and 40°52′~46°18′ N. The province covers an area of 18.74 × 10⁴ square kilometers. The mountain altitudes range from 200 m to 1687 m. The climate is a temperate continental-monsoon climate, with four distinct seasons, including rain and heat in the same season. The average annual precipitation is 400~600 mm, but there are large seasonal and regional differences. The province is rich in forest vegetation types, and the main tree species include Pinus koraiensis, Picea asperata, Larix gmelinii, and Fraxinus mandshurica. LN is located between 118°53′~125°46′ E and 38°43′~43°26′ N. It borders HB to the southwest and JL to the northeast. The province covers an area of 14.8 × 10⁴ square kilometers. The mountain altitudes range from 300 m to 1336 m. The climate is temperate monsoon, with long winters and warm summers, short springs and autumns, and four distinct seasons. The average temperature throughout the year is between 7~11 °C, and the annual precipitation is between 600~1100 mm. LN has the heaviest rainfall in northern China. The main tree species include Pinus tabuliformis, Alnus japonica, Fraxinus mandshurica, and Quercus mongolica. HB is located between 113°27′~119°50′ E and 36°05′~42°40′ N. Surrounding the capital city of Beijing, it borders LN to the northeast. The province covers an area of 18.88 × 10⁴ square kilometers. The mountain altitudes range from 200 m to 2700 m. The climate is a temperate continental monsoon climate, with four distinct seasons. The average annual precipitation is 484.5 mm. The main tree species include Picea asperata, Larix gmelinii, Pinus sylvestris, and Populus hopeiensis. The total forest area of northern China is 43.796 million ha. HLJ, JL, LN, and HB have a forest area of 21.5 million ha, 9.56 million ha, 6.129 million ha, and 6.607 million ha, respectively, accounting for 49.1%, 21.83%, 14%, and 15.07% of the total in northern China, respectively.

2.2. Data Sources

The availability of satellite data has revolutionized fire monitoring, allowing for a more consistent and comprehensive assessment of the temporal and spatial patterns of fire occurrence and burned areas. In particular, since the launch of the Moderate Resolution Imaging Spectroradiometer (MODIS) sensor on the Terra (launched in December 1999) and Aqua (launched in May 2002) satellites, remote-sensing data obtained from them have been identified as a suitable and reliable source for monitoring vegetation fires [32,33]. This study uses the Terra/MODIS and Aqua/MODIS fire-spot datasets, with a nominal horizontal resolution of approximately 1 km2, which are available from the Ministry of Ecological and Environmental Center for Satellite Application on Ecology and Environment (http://www.secmep.cn/ accessed on 4 May 2002). This study, also, used NPP satellite-monitoring data for dataset supplementation and validation. This study extracted fire spots covering the northern region of China (HLJ, JL, LN, and HB), from 2020 to 2021, within the forest area. The fire-spot datasets include specific information on the location, time of fire, latitude, and longitude of forest fires, in each province, from 2020 to 2021.

2.3. Distribution Pattern of Forest-Fire Frequency

The collected fire-spot-information data were integrated into data tables, according to the provinces, and a database of forest-fire spots was set up for each province. The processed fire-spot data are overlaid with the aligned forest-area data of the province, to filter the fire-spot data, within the forest area of the province. The spatial distribution of the number of forest fires in each province between years and seasons was mapped, and the overall spatial-distribution patterns of forest fires in different provinces, between years and in each season, were analyzed. The fire spots in each province were extracted, and separate data tables were created by year, season, and month. The number of fire spots in the spring (March–May), summer (June–August), autumn (September–November), and winter (December–February), in 2020 and 2021, was counted for each province in the northern region. Then, line graphs were plotted, to explore the specific number of changes in each province, over a two-year period. Thus, this paper analyzed the characteristics and patterns of interannual, seasonal, and monthly changes in fires, in each province.

2.4. Spatial Cluster Analysis

Multi-distance spatial-clustering analysis (Ripley’s K-function) has been widely used to describe the relationship between two or more point patterns. This method treats the local landscape as a point in space, draws a point-location-distribution map, and analyzes the spatial-distribution pattern of the landscape, on the basis of the point map [34,35,36]. In this study, Ripley’s K function was used to calculate the spatial-distribution pattern of forest fires and analyze the spatial state of forest-fire distribution, in each province. The Ripley’s K(d) function is defined as:
K ( d ) = A i = 1 n j = 1 n d i j ( d ) n 2 ( i , j = 1 , 2 , , n , i j , d i j d )
where n is the number of fire points; d is the distance scale; dij is the distance between fire points i and j; and A is the area of the study area.
To make the results more reliable and stable, the square root of K(d)/π is introduced to correct the function, resulting in the L(d) function with the following equation.
L ( d ) = K ( d ) π d
If the value of L(d) is greater than the expected value, the fire spots show an aggregated distribution. If the value of L(d) is less than the expected value, the fire spots show a discrete distribution. The spatial-aggregation distribution of fire spots is statistically significant, if the value of L(d) is greater than the value of the upper packet traces. The spatially discrete distribution of fire spots is statistically significant, if the value of L(d) is smaller than the value of the lower packet traces.

2.5. Hotspot Analysis

The kernel-density-estimation (KDE) method considers events occurring at arbitrary locations in space, but the magnitude of the probability of occurrence at separate locations varies [37,38]. The probability of events in areas with dense points is high, and the probability of events in areas with sparse points is low. Therefore, the spatial density of events can be used to represent the spatial-point pattern. In this study, after determining that the fire spots in the study area are spatially clustered and distributed, a kernel-density analysis was conducted for the fire spots in the study area, to more intuitively reflect the spatially significant clustered distribution areas and patterns of fires. The expression for the density f(x) at point x, where the fire occurred, is shown in Equation (3).
f ( x ) = 1 n h i = 1 n k ( x x i h )
where k is the kernel function; h is the bandwidth of the kernel function; x is the set of fire points (x1, x2, …, xn); and xxi is the distance from the estimated point to sample xi.

3. Results

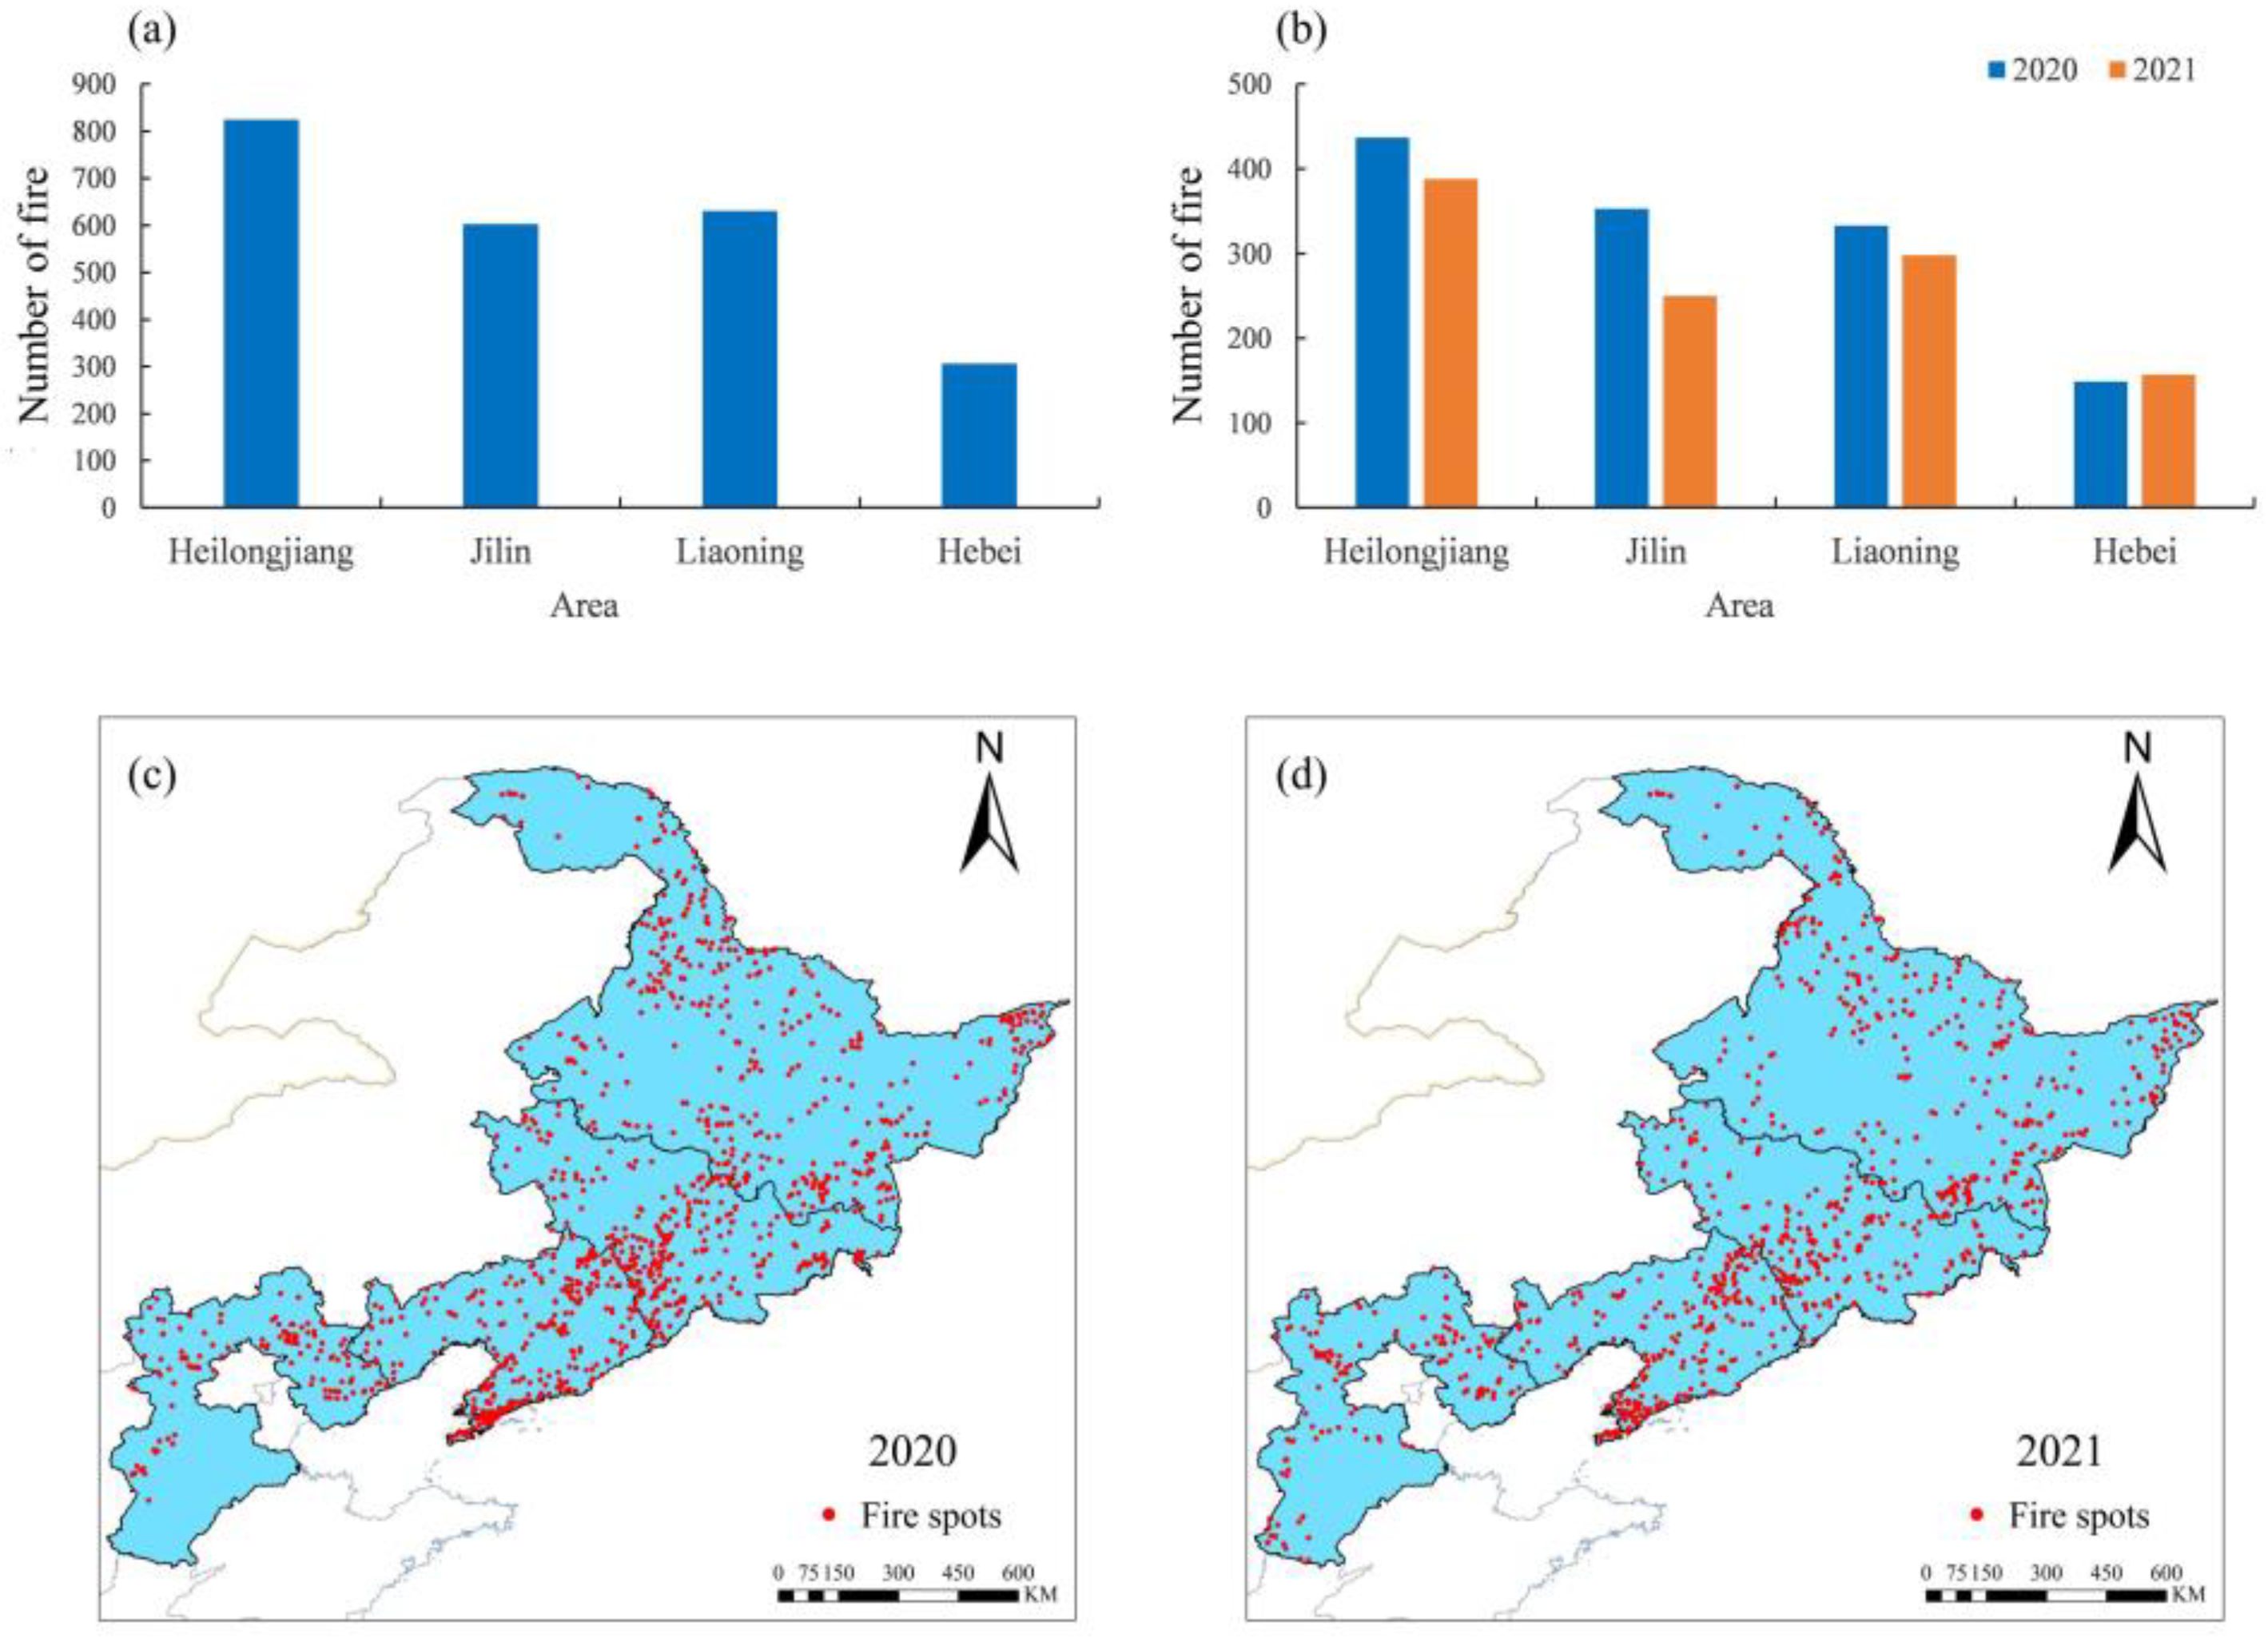
3.1. Characteristics of Interannual Variation in Fire

As shown in Figure 2a,b, the total number of fire spots in HLJ, JL, LN, and HB during the study period were 825, 603, 631, and 306, respectively; accounting for 34.9%, 25.5%, 26.7%, and 12.9% of the total number of fire spots in the northern region in both years, respectively. Among them, HLJ, JL, LN, and HB had 437, 353, 333, and 149 fire spots, respectively, in 2020, for a total of 1272; the number of fire spots, in 2021, was 388, 250, 298, and 157, respectively, for a total of 1093. The spatial distribution of annual fire spots in the northern region, in 2020 and 2021, is shown in Figure 2c,d. The number of forest fires in each province and the spatial-distribution results show that the total number of fire spots in the northern provinces in 2021 is smaller than the total number of fire spots in 2020. Among them, the number of fire spots in HLJ, JL, and LN in 2021 was smaller than the number of fire spots in 2020, indicating that the number of fires in 2021 was reduced, while the number of fire spots in HB in 2021 shows a slight increase in the trend. Specifically, both 2020 and 2021 show the highest number of fire spots located in HLJ and the lowest number of fire spots in HB. Moreover, the results show that HLJ has the largest share of the total number of fire spots in 2020 and 2021, while HB has the smallest share. It is worth noting that HLJ has about 2.5 times as many fires as HB. However, in terms of forest area, HLJ is the largest in the northern region, accounting for about 3.5 times as much as HB.

3.2. Characteristics of Fire Season and Month Variation

In this paper, the spatial- and temporal-distribution patterns of forest fires in each province with a seasonal distribution pattern were analyzed. For the spatial distribution of fire spots, fires in all provinces of the northern region in 2020 were concentrated in spring and autumn, and spring was higher than autumn (Figure 3 and Figure 4). Among them, HLJ had the highest number of fire spots in April and October, followed by May. JL had the most in April and November, followed by October. LN had the most in April and November. HB had the most in March and October. The distribution of fire spots in 2021 is more dispersed, but the common denominator is that each province has the lowest number of fire points in winter (Figure 3). HLJ had the highest number of fires in autumn, followed by summer, and was concentrated in April and October, followed by August. JL and LN had similar trends, with the highest number of fires in spring, followed by summer, and both were concentrated in March and April. Compared with the other three provinces, HB had the lowest number of fire spots. Unlike the trend in the other three provinces, HB had the most fires in the summer and winter, and the fires were, mainly, concentrated in June and August (Figure 4).

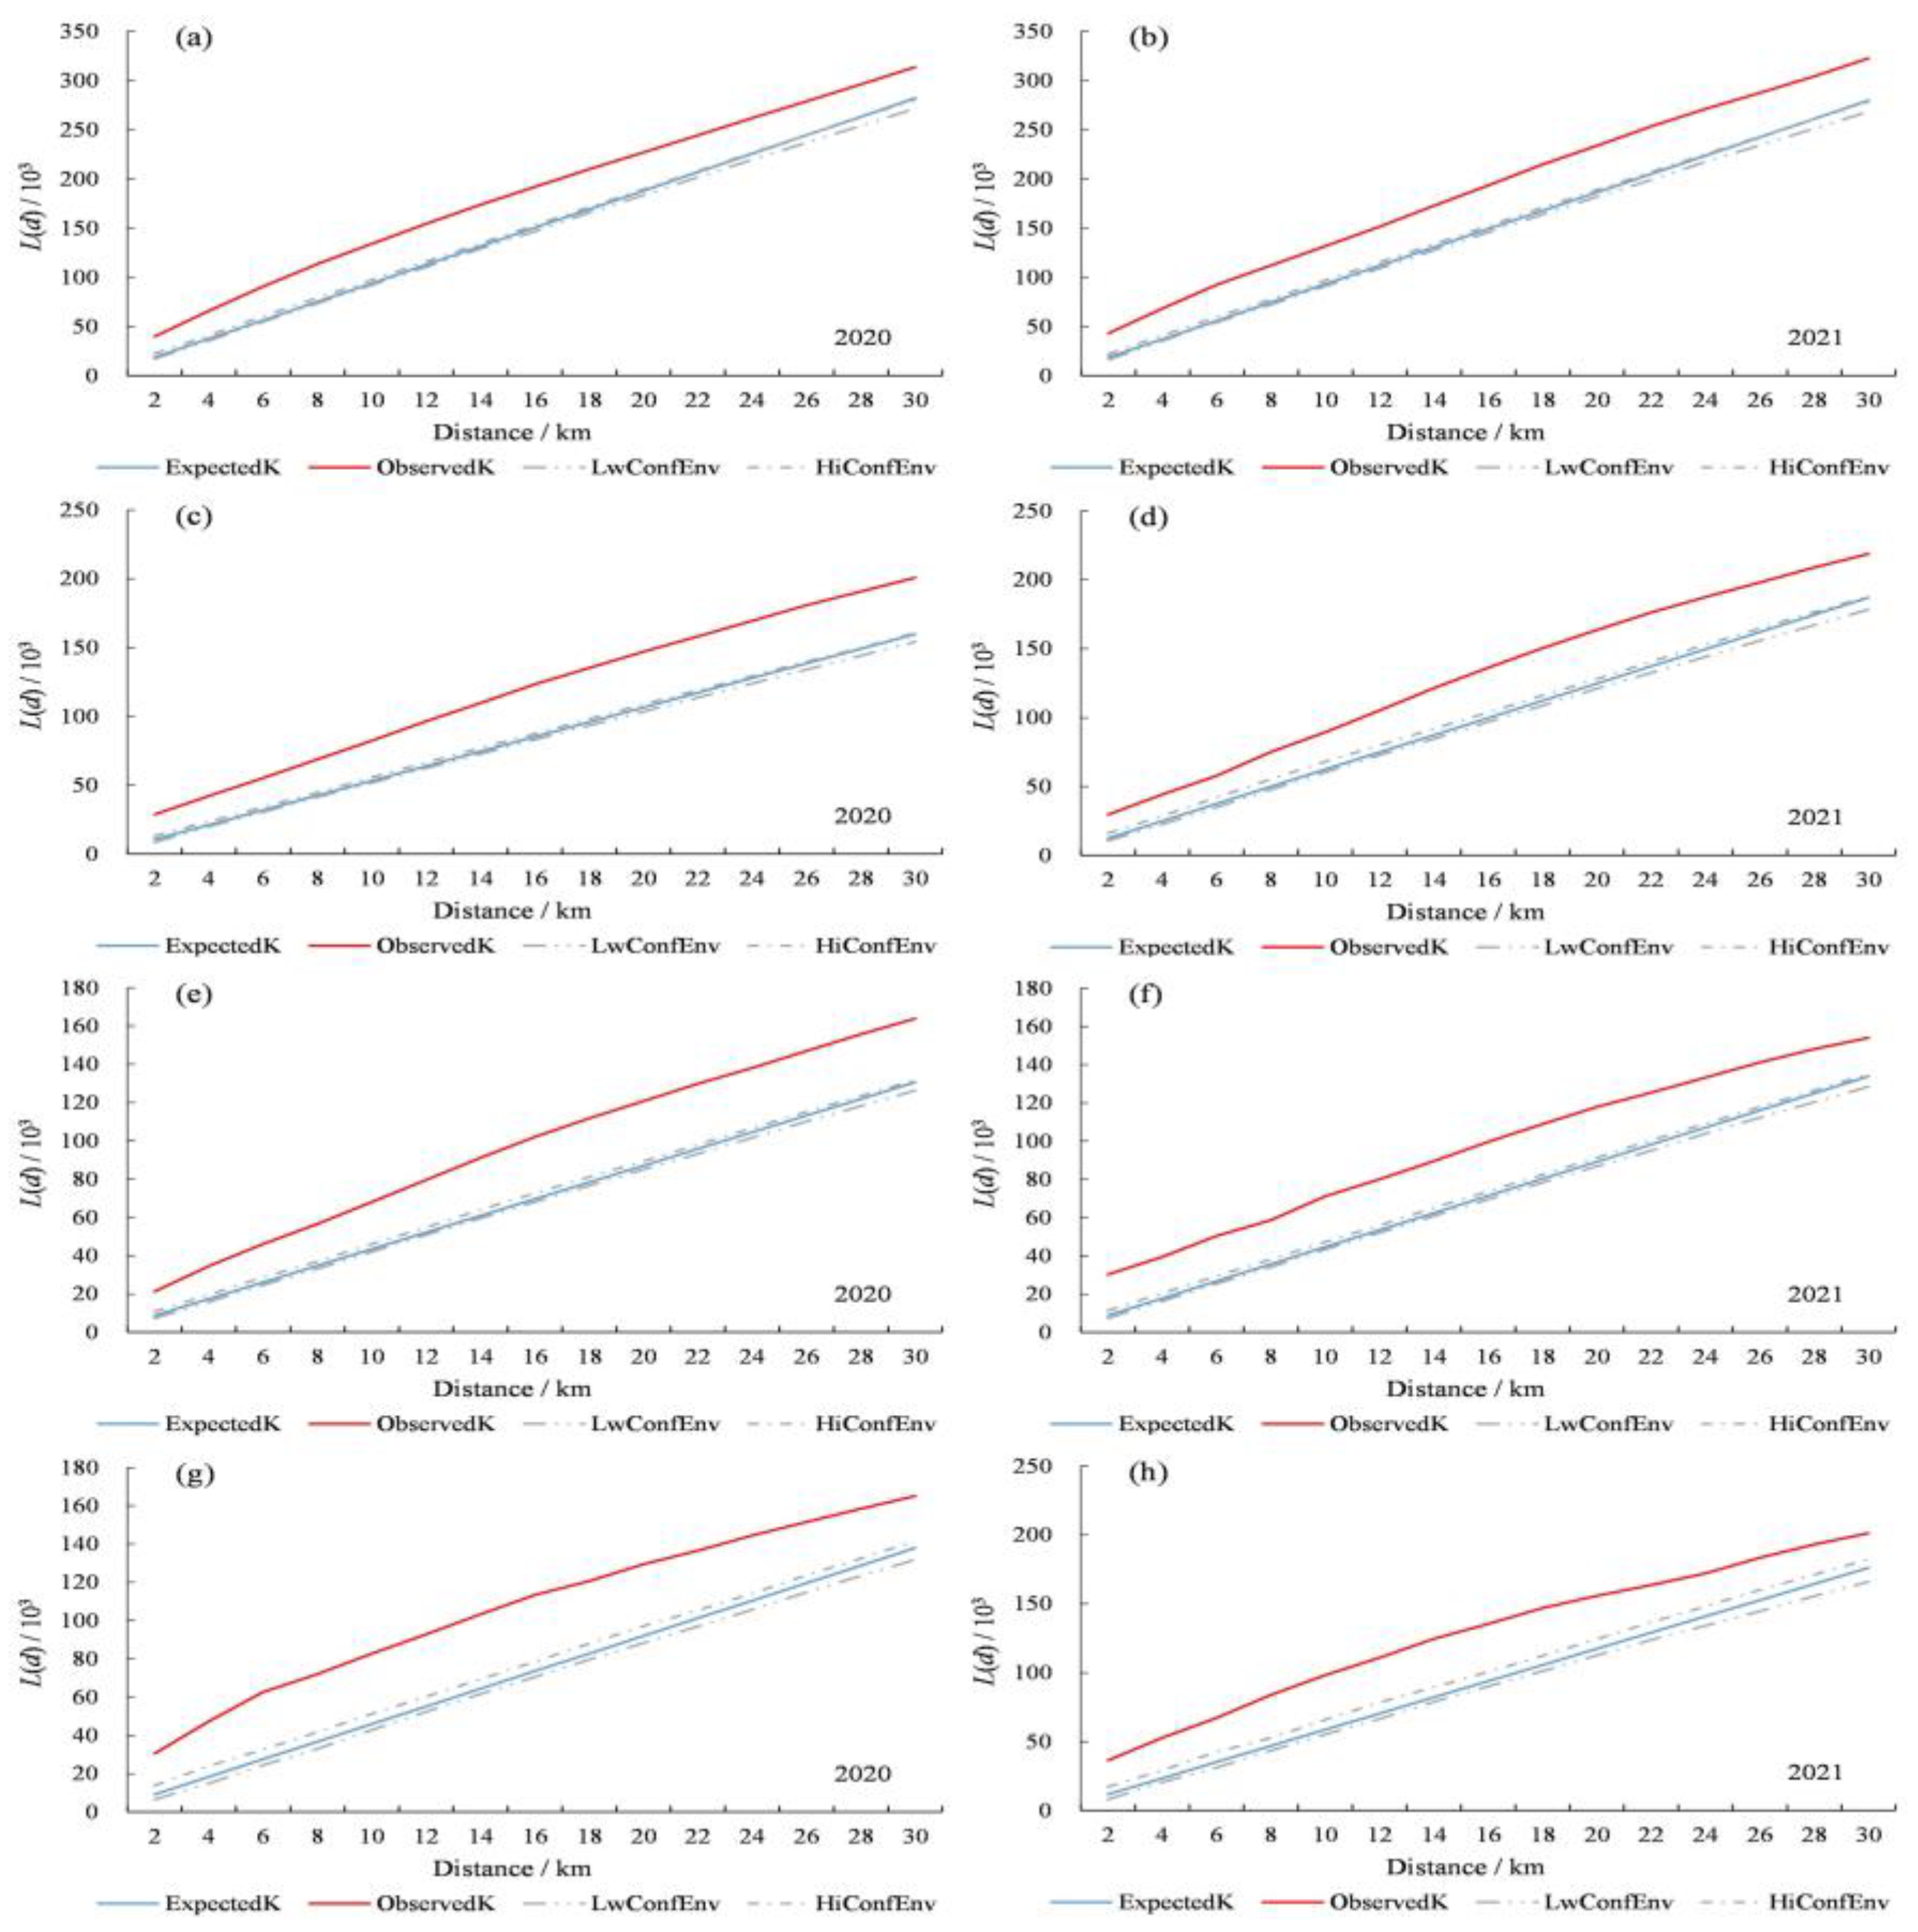
3.3. Fire Spatial-Distribution Pattern

Based on the results of the multi-distance spatial-clustering analysis, the observed L(d) values were plotted against the expected values as well as the upper and lower packet traces. The L(d) values of HLJ, JL, LN, and HB, in 2020 and 2021, are greater than the expected values and greater than the upper packet traces (Figure 5). Forest fires, in 2020 and 2021, in all four provinces show a significant spatial-aggregation distribution.

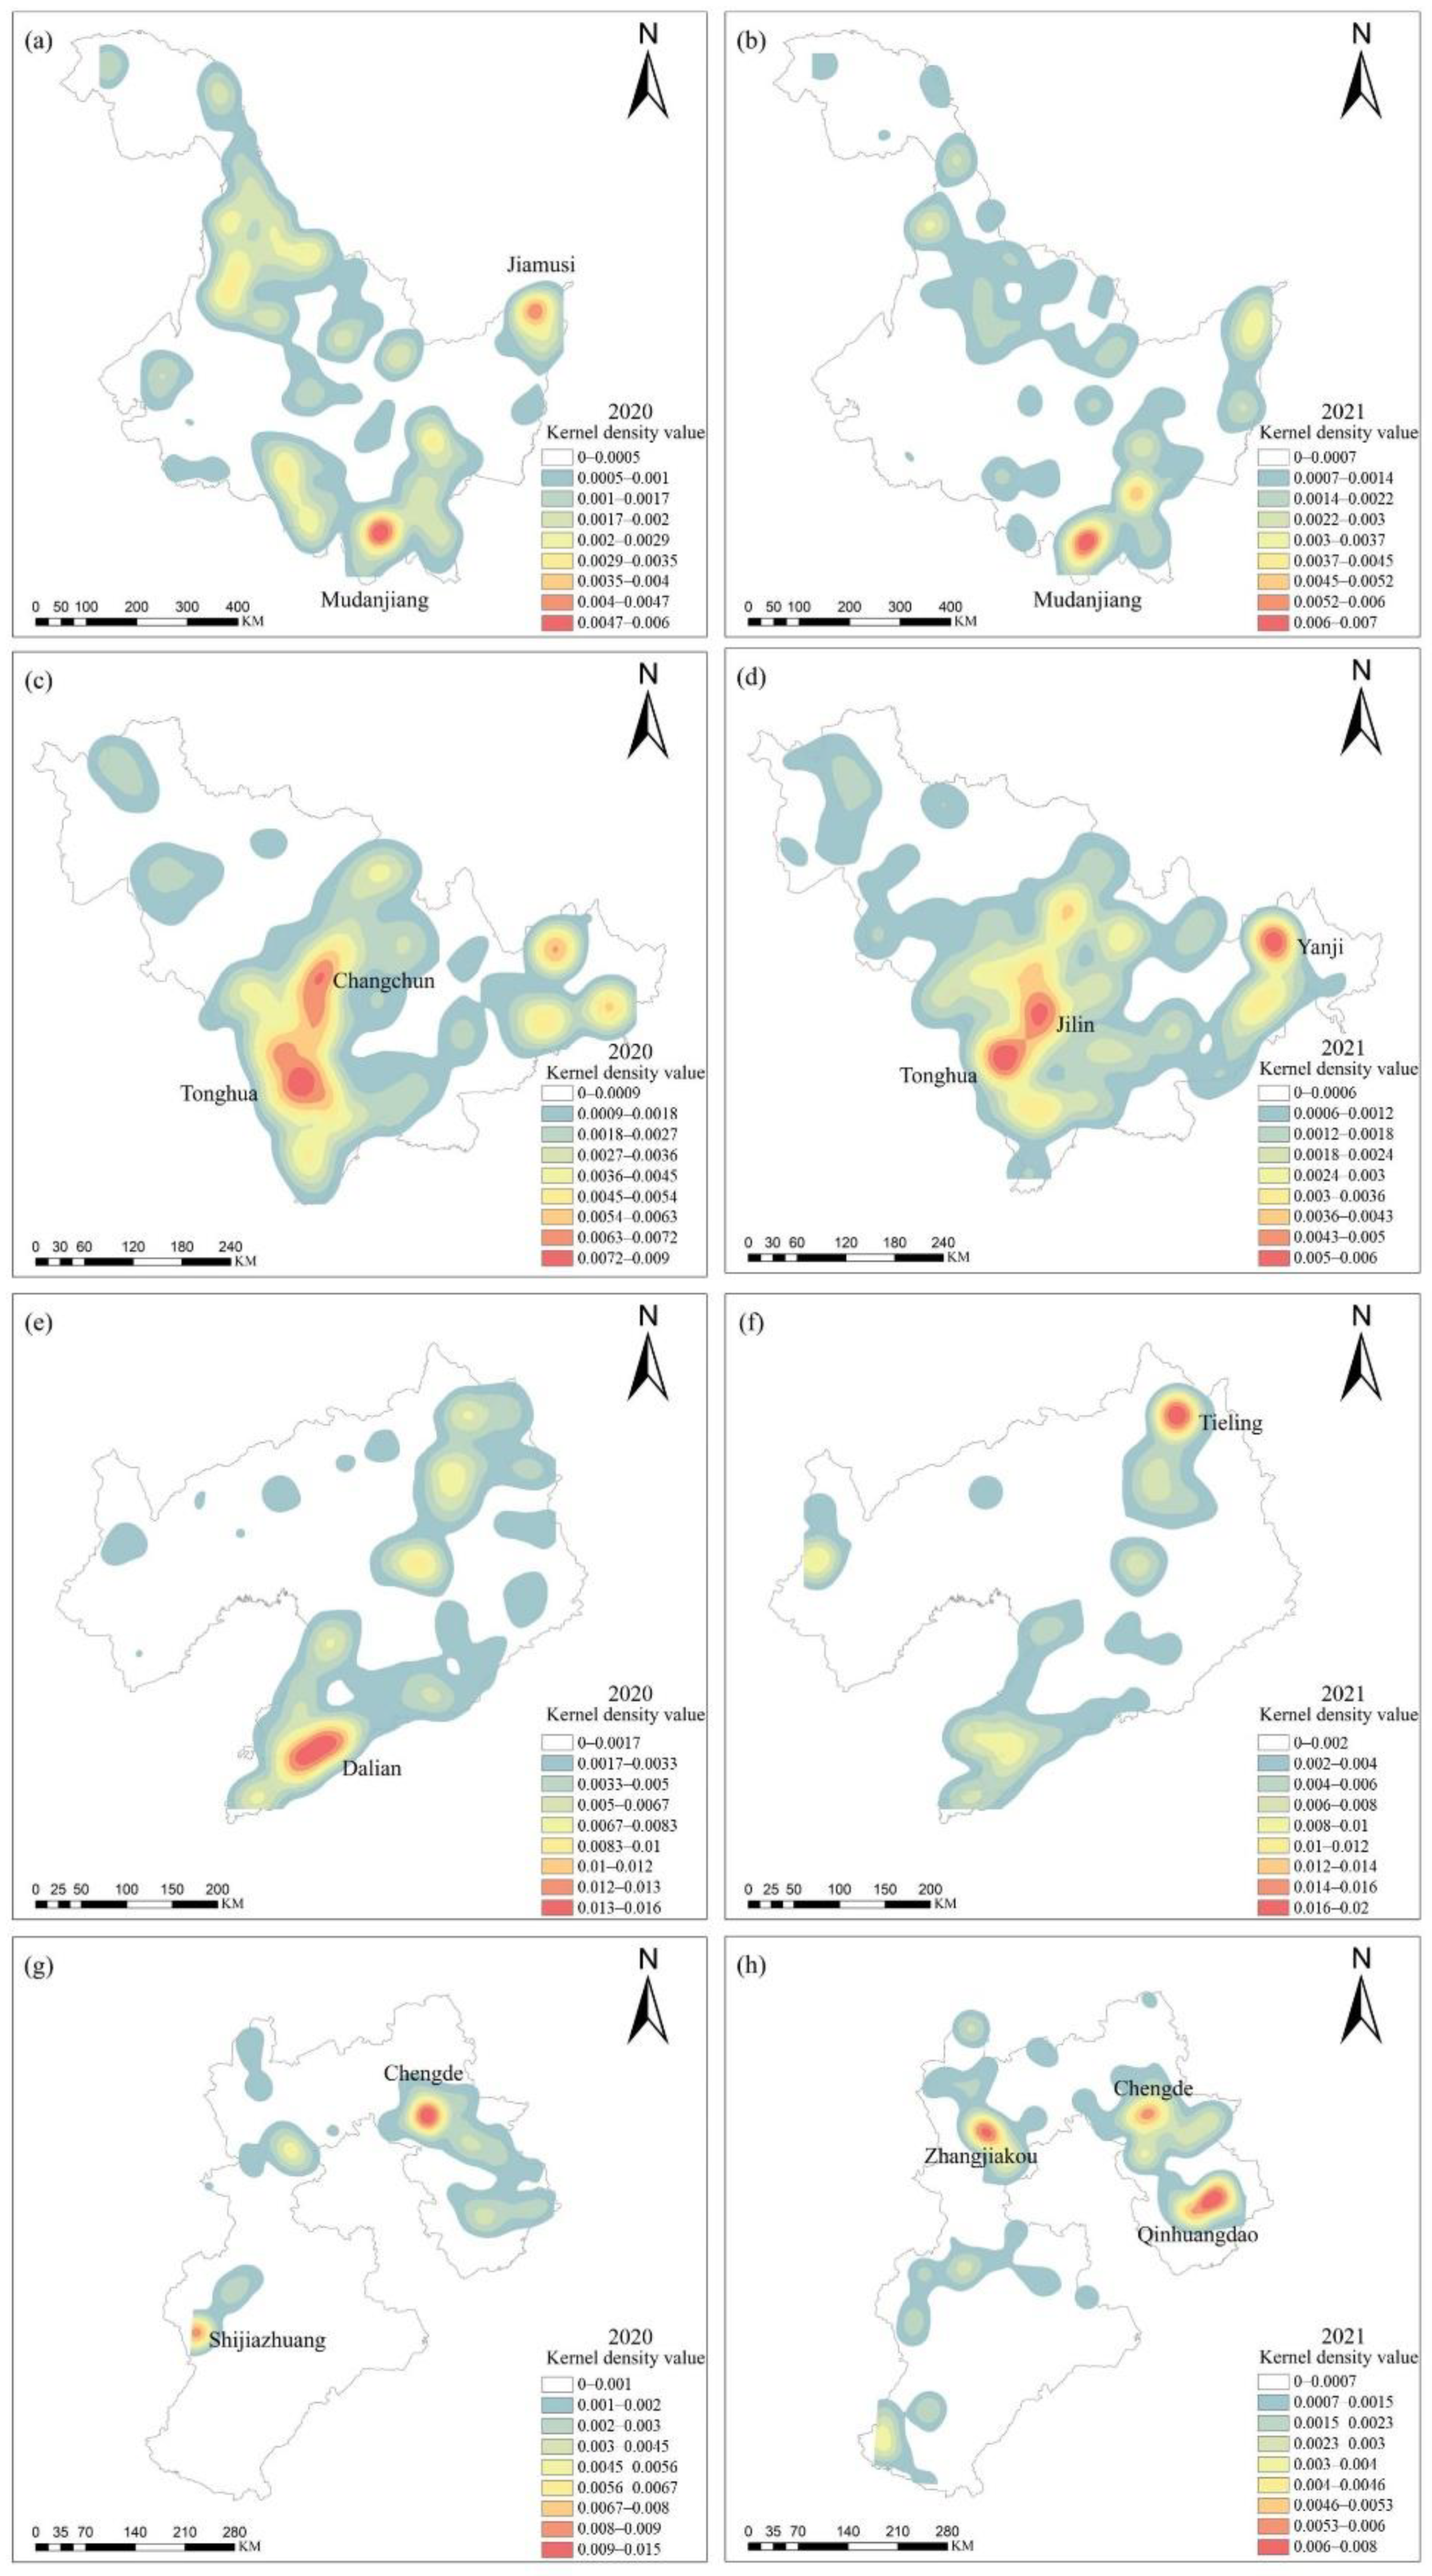
3.4. Fire Hotspot Analysis

Hotspot areas and changes in fire occurring in the study area, in 2020 and 2021, were obtained. There were two main hotspot areas for fires in HLJ in 2020, which were Mudanjiang and Jiamusi. In 2021, the hotspot area for fires in HLJ was Mudanjiang, reducing the area of Jiamusi (Figure 6a,b). JL had two fire-hotspot areas (Tonghua and Changchun), in 2020. In 2021, the hotspot areas were Tonghua, Jilin, and Yanji, showing a decrease in Changchun fire spots and an increase in Jilin and Yanji (Figure 6c,d). The hotspot area of fire spots in LN was Dalian in 2020 and Tieling in 2021, indicating that the fire-spot-gathering place changed from Dalian to Tieling (Figure 6e,f). There were two hotspot areas located in HB in 2020, Chengde and Shijiazhuang, and in 2021, the hotspot areas were Qinhuangdao, Zhangjiakou, and Chengde (Figure 6g,h).

4. Discussion

Heilongjiang, Jilin, Liaoning, and Hebei provinces are important parts of northern China’s northern forests, but they are, also, areas with higher forest-fire hazards, so are key regions for forest-fire prevention nationwide [39]. Mastering the spatial and temporal patterns of forest fires is an important basis for forest-fire prevention and management. Moderate-resolution remote-sensing satellite observations are an important technical tool for current, continuous global forest-fire monitoring [40,41]. However, in the process of satellite monitoring, due to the existence of its own limitations and the shortcomings of the product, identifying small fires is not obvious, thus, the existence of fire-point-recognition-accuracy limitation. However, studies of the spatial and temporal distribution of fire spots are an important source of data and play a key role at the regional and global scales [42,43].
In this paper, the number of forest fires monitored and their spatial- and temporal-distribution patterns in Heilongjiang, Jilin, Liaoning, and Hebei provinces, from 2020 to 2021, were studied. This study can provide a comprehensive picture of the spatial and temporal distribution of forest fires in northern China, in the past two years, which is of great practical significance for future forest-fire-prevention work in the region. The number of forest fires in HLJ, JL, and LN showed a decreasing trend, during the study period. This is, mainly, due to the gradual standardization and legalization of forest-fire management, in recent years, in all provinces. The gradual strengthening of forest-fire monitoring and a series of measures have significantly reduced the chance of forest fires and the degree of harm they cause [44,45]. According to a study of forest fires in the relevant northern regions, the annual number of fires has shown an overall decreasing trend, within a certain fluctuation range, since 2010 [46]. HB had a small but slight increase in the number of forest fires, in 2021, compared to the previous year, and the number of annual forest fires remained almost unchanged. However, specifically, the fire-spot data from HB indicated that the relative increase in the number of fire spots in HB, in February 2021, is the main reason for the increase in the number of annual fire spots. On the one hand, due to the resolution limits when the satellite monitors the fire spots, some non-fires are misjudged as fires, resulting in an increase in the number of fires [47,48]. On the other hand, this may be because the local fire-prevention season is not in February, and people are relatively unaware of fire prevention, so they ignore the importance of fire prevention, causing an increase in the number of fires [49,50].
The number of forest fires showed some variability, among the different provinces. The number of fires in HLJ is higher than in other provinces. The number of fire spots in HB is the lowest, among the four provinces. It is worth noting that, since HLJ has the largest forest area, the largest number of fire spots does not mean that HLJ has a high probability of forest fires, as it can mean that the pressure of preventing forest fires in some areas is more severe than in other provinces, which is consistent with previous findings [51]. Therefore, it is important for HLJ to strengthen the investment in fire prevention efforts, increase monitoring and fire management, and limit the size of fires before they become damaging. One limitation of this study’s data is that fires smaller than 1 square kilometer were not detected, which does not mean they did not occur. Therefore, small-fire-detection methods need to be explored in the future. In addition, climate, topographic and other environmental factors, and economic factors will affect the occurrence of forest fires, so the relationships between and the influence among these factors need to be further explored [52,53,54]. Each province should develop a corresponding forest-fire-fighting plan, according to the actual fire situation in that province, to target forest-fire-prevention work and improve forest-fire-management efficiency.
With seasonal distributions, fire spots in the provinces are, mainly, concentrated in spring and autumn, with spring being significantly higher than autumn. Spring is dry with little rain and frequent high winds, especially before the vegetation becomes green, and forest trees have little water content. There are more dead branches and leaves on the ground, resulting in more forest fires [55]. In the summer, more rainfall increases the water content of flammable materials, which reduces the risk of forest fires, so the number of forest fires decreases. With the onset of autumn, the vegetation gradually ends its growth for the year, so branches and leaves gradually dry up and wither. When there are many dead branches and leaves on the ground, the soil’s microbial activity increases dramatically, which accelerates the decomposition of dead branches and leaves; the structure can be changed as well, thus contributing more readily available fuels to burn [56,57]. This, coupled with the fact that late fall is the peak time for farmers to burn, has led to a frequent increase in forest fires in September and October, with a small peak throughout the year. From December to February, with low temperatures and snow cover, almost no forest fires occurred [58].
Forest fires in the northern provinces have significant spatial- and temporal-distribution characteristics, and the distribution of fire spots in each province shows a significant clustering distribution and has significant clustering hotspot areas. For HLJ, where the phenomenon is that fires are, mainly, located in Mudanjiang and Jiamusi, this is not an accident but is conditioned by inducing factors. According to previous studies on the composition of tree species, most in Mudanjiang are flammable coniferous species, and fires occur frequently [59]. Climatically, the average wind speed in the region is too high, resulting in a dry climate and a high chance of fires. Mudanjiang, in particular, has had little rainfall in the past two years, so the flammable material is unusually dry, making it highly susceptible to forest fires, and it is not easy to fight them. It is worth noting that the average temperature in Mudanjiang is high, making it easy for flammable materials to reach the ignition point and, thus, be more likely to cause forest fires [60,61]. Hotspot areas of fires in JL are, mainly, concentrated in the southern region. In addition to the high distribution of local flammable tree species, more importantly, the altitude of the southern region is mostly in the range of 100–500 m. A lower altitude makes forest fires more likely to occur. This is because as altitude decreases, human activity increases, thus increasing the likelihood of human-caused fires; as altitude decreases, temperatures rise, thus increasing the probability of fires [62]. The Tieling and Dalian areas located in LN have a high distribution of forest fires, which are, mostly, distributed in spring. This is because the region’s spring temperatures rise quickly, there is less rain, and there is more windy weather. The vegetation is, mostly, pure oleander, shrub forests, with other flammable species, and weeds grow thickly, making it easy for forest fires to start [63]. The northeastern part of HB is the area where forest fires are concentrated, as the topography of the area is complex, so forest fires occur in the mountainous areas, since the wind speed is higher, and the relative humidity is lower in mountainous areas than in other regions. The slope of the area is smaller, and forest fires are concentrated in the range of 0–2°, which is favorable for forest fires. On the one hand, the higher the slope is, the steeper the terrain, with less human activity. The lower the temperature is, due to the local microclimate, on the other hand, will reduce the occurrence of forest fires [64,65].
This study found that the number of fire spots in each province, during different years, and the number of fire points between different provinces, in each year, varied significantly. This variation may be because the weather conditions vary from province to province at separate times, resulting in some variations in the number of forest fires. Our results show the hotspot areas for each province. For example, the HLJ province had Mudanjiang and Jiamusi as the hotspots. Based on our results, local forest management and fire prevention should be focused on these hotspot areas. Close attention should be given to climate anomalies, by increasing input and taking timely preventive measures. The results of the spatial distribution of fires in this paper have important implications for the development of sustainable forest-management strategies, which take into account the requirements of many stakeholders. The results of this study can provide direction for future forest-fire management and help with environmental sustainability. Supervision should be strengthened, especially in the critical period of fire prevention in areas with frequent human activity, and more man-made sources of fire should be avoided, to maximize forest-fire prevention. In subsequent studies, other factors affecting the occurrence of forest fires, such as climate and vegetation, can be combined into a comprehensive analysis, to provide a theoretical basis for the spatial distribution and trends of fires, in different forest ecosystems.

5. Conclusions

The forest fires in northern China, in 2020 and 2021, have distinct spatial and temporal distributions, with the annual number of fires in each province showing a general downward trend in the variation. Based on the results of this study, future direction of forest-fire management can be provided, and inspections and supervision of high forest-fire periods and areas can be strengthened. This paper provides a theoretical basis for firefighters, to decide on fire-prevention and control priorities as well as the rational allocation of firefighting resources. It, also, provides new ideas for the follow-up research of spatial-point-pattern analysis, in firefighting work. In addition to spatial- and temporal-distribution characteristics, environmental factors, such as temperature, rainfall, wind speed, wind direction, and topography, also, have important effects on the occurrence and spread of forest fires. Further studies on the relationship between forest-fire distribution and the above environmental causes, in the northern regions, are still needed. These, when achieved in their true essence, will help lay the foundation for enhanced environmental sustainability.

Author Contributions

Conceptualization, M.L. and B.W.; methodology, Z.W.; software, Y.T.; validation, M.L. and B.W.; formal analysis, S.B.; investigation, Z.W.; resources, M.L.; data curation, M.L.; writing–original draft preparation, Y.T.; writing–review and editing, Z.W.; visualization, X.Z.; supervision, X.Z.; project administration, B.W.; funding acquisition, M.L. All authors have read and agreed to the published version of the manuscript.

Funding

This research was funded by the University of Science and Technology of China, grant number 2020YFC1511603.

Institutional Review Board Statement

Not applicable.

Informed Consent Statement

Not applicable.

Data Availability Statement

The data used in the study are available from the authors and can be shared upon reasonable requests.

Conflicts of Interest

The authors declare no conflict of interest.

References

  1. Chandra, K.; Bhardwaj, A.K. Incidence of forest fire in India and its effect on terrestrial ecosystem dynamics, nutrient and microbial status of soil. Int. J. Agric. For. 2015, 5, 69–78. [Google Scholar]
  2. Bond, W.J.; Woodward, F.I.; Midgley, G.F. The global distribution of ecosystems in a world without fire. New Phytol. 2005, 165, 525–538. [Google Scholar] [CrossRef] [PubMed]
  3. Parente, J.; Pereira, M.; Amraoui, M.; Tedim, F. Negligent and intentional fires in Portugal: Spatial distribution characterization. Sci. Total Environ. 2018, 624, 424–437. [Google Scholar] [CrossRef] [PubMed] [Green Version]
  4. Wu, Z.; Li, M.; Wang, B.; Quan, Y.; Liu, J. Using artificial intelligence to estimate the probability of forest fires in Heilongjiang, northeast China. Remote Sens. 2021, 13, 1813. [Google Scholar] [CrossRef]
  5. Schoennagel, T.; Smithwick, E.A.; Turner, M.G. Landscape heterogeneity following large fires: Insights from Yellowstone National Park, USA. Int. J. Wildland Fire 2008, 17, 742–753. [Google Scholar] [CrossRef]
  6. Food and Agriculture Organization of the United Nations; Forestry Department (Rome). Global Forest Resources Assessment 2010: Main Report; Food and Agriculture Organization of the United Nations: Rome, Italy, 2010. [Google Scholar]
  7. De Groot, W.J.; Flannigan, M.D.; Cantin, A.S. Climate change impacts on future boreal fire regimes. For. Ecol. Manag. 2013, 294, 35–44. [Google Scholar] [CrossRef]
  8. Cui, S.; Song, Z.; Zhang, L.; Shen, Z.; Hough, R.; Zhang, Z.; An, L.; Fu, Q.; Zhao, Y.; Jia, Z. Spatial and temporal variations of open straw burning based on fire spots in northeast China from 2013 to 2017. Atmos. Environ. 2021, 244, 117962. [Google Scholar] [CrossRef]
  9. Rohde, R.A.; Muller, R.A. Air pollution in China: Mapping of concentrations and sources. PLoS ONE 2015, 10, e0135749. [Google Scholar] [CrossRef]
  10. Yang, G.; Wang, Y.; Zeng, Y.; Gao, G.F.; Liang, X.; Zhou, M.; Wan, X.; Yu, S.; Jiang, Y.; Naghavi, M. Rapid health transition in China, 1990–2010: Findings from the Global Burden of Disease Study 2010. Lancet 2013, 381, 1987–2015. [Google Scholar] [CrossRef]
  11. Lelieveld, J.; Evans, J.S.; Fnais, M.; Giannadaki, D.; Pozzer, A. The contribution of outdoor air pollution sources to premature mortality on a global scale. Nature 2015, 525, 367–371. [Google Scholar] [CrossRef]
  12. Earl, N.; Simmonds, I. Spatial and temporal variability and trends in 2001–2016 global fire activity. J. Geophys. Res. Atmos. 2018, 123, 2524–2536. [Google Scholar] [CrossRef]
  13. Marlon, J.R.; Bartlein, P.J.; Carcaillet, C.; Gavin, D.G.; Harrison, S.P.; Higuera, P.E.; Joos, F.; Power, M.; Prentice, I. Climate and human influences on global biomass burning over the past two millennia. Nat. Geosci. 2008, 1, 697–702. [Google Scholar] [CrossRef]
  14. Earl, N.; Simmonds, I. Variability, trends, and drivers of regional fluctuations in Australian fire activity. J. Geophys. Res. Atmos. 2017, 122, 7445–7460. [Google Scholar] [CrossRef]
  15. Andela, N.; Morton, D.C.; Giglio, L.; Chen, Y.; van der Werf, G.R.; Kasibhatla, P.S.; DeFries, R.S.; Collatz, G.; Hantson, S.; Kloster, S. A human-driven decline in global burned area. Science 2017, 356, 1356–1362. [Google Scholar] [CrossRef] [Green Version]
  16. Rabin, S.S.; Magi, B.; Shevliakova, E.; Pacala, S.W. Quantifying regional, time-varying effects of cropland and pasture on vegetation fire. Biogeosciences 2015, 12, 6591–6604. [Google Scholar] [CrossRef] [Green Version]
  17. Zhuang, Y.; Li, R.; Yang, H.; Chen, D.; Chen, Z.; Gao, B.; He, B. Understanding temporal and spatial distribution of crop residue burning in China from 2003 to 2017 using MODIS data. Remote Sens. 2018, 10, 390. [Google Scholar] [CrossRef] [Green Version]
  18. Giglio, L.; Boschetti, L.; Roy, D.P.; Humber, M.L.; Justice, C.O. The Collection 6 MODIS burned area mapping algorithm and product. Remote Sens. Environ. 2018, 217, 72–85. [Google Scholar] [CrossRef]
  19. Chuvieco, E.; Yue, C.; Heil, A.; Mouillot, F.; Alonso-Canas, I.; Padilla, M.; Pereira, J.M.; Oom, D.; Tansey, K. A new global burned area product for climate assessment of fire impacts. Glob. Ecol. Biogeogr. 2016, 25, 619–629. [Google Scholar] [CrossRef] [Green Version]
  20. Pratamasari, A.; Permatasari, N.K.F.; Pramudiyasari, T.; Manessa, M.D.M.; Supriatna, S. Spatial distribution patterns analysis of hotspot in Central Kalimantan using fimrs modis data. J. Geogr. Trop. Environ. 2020, 4, 24–34. [Google Scholar] [CrossRef]
  21. Sabani, W.; Rahmadewi, D.; Rahmi, K.; Priyatna, M.; Kurniawan, E. Utilization of MODIS data to analyze the forest/land fires frequency and distribution (case study: Central Kalimantan Province). IOP Conf. Ser. Earth Environ. Sci. 2019, 243, 012032. [Google Scholar] [CrossRef]
  22. Chhabra, A.; Sehgal, V.K.; Dhakar, R.; Jain, N.; Verma, R.V. Monitoring of Active Fire Events Due to Paddy Residue Burning in Indo-Gangetic Plains Using Thermal Remote Sensing; International Society for Photogrammetry and Remote Sensing: Nice, France, 2019. [Google Scholar]
  23. Guo, C.; Liu, K.; Li, G.; Liu, Y.; Wang, Y. Comparative Analysis of Fire Detection Algorithms in North China. In Proceedings of the 6th International Symposium of Space Optical Instruments and Applications, Delft, The Netherlands, 24–25 September 2019; pp. 153–169. [Google Scholar]
  24. Li, R.; Fu, Y.; Bergeron, Y.; Valeria, O.; Chavardès, R.D.; Hu, J.; Wang, Y.; Duan, J.; Li, D.; Cheng, Y. Assessing forest fire properties in Northeastern Asia and Southern China with satellite microwave Emissivity Difference Vegetation Index (EDVI). ISPRS J. Photogramm. Remote Sens. 2022, 183, 54–65. [Google Scholar] [CrossRef]
  25. Wang, W.; Zhang, Q.; Luo, J.; Zhao, R.; Zhang, Y. Estimation of Forest Fire Emissions in Southwest China from 2013 to 2017. Atmosphere 2019, 11, 15. [Google Scholar] [CrossRef] [Green Version]
  26. Yi, K.; Bao, Y.; Zhang, J. Spatial distribution and temporal variability of open fire in China. Int. J. Wildland Fire 2017, 26, 122–135. [Google Scholar] [CrossRef] [Green Version]
  27. Vadrevu, K.P.; Lasko, K.; Giglio, L.; Schroeder, W.; Biswas, S.; Justice, C. Trends in vegetation fires in south and southeast Asian countries. Sci. Rep. 2019, 9, 7422. [Google Scholar] [CrossRef]
  28. Jiang, W.; Wang, F.; Fang, L.; Zheng, X.; Qiao, X.; Li, Z.; Meng, Q. Modelling of wildland-urban interface fire spread with the heterogeneous cellular automata model. Environ. Model. Softw. 2021, 135, 104895. [Google Scholar] [CrossRef]
  29. Rui, X.; Hui, S.; Yu, X.; Zhang, G.; Wu, B. Forest fire spread simulation algorithm based on cellular automata. Nat. Hazards 2018, 91, 309–319. [Google Scholar] [CrossRef]
  30. Elia, M.; D’Este, M.; Ascoli, D.; Giannico, V.; Spano, G.; Ganga, A.; Colangelo, G.; Lafortezza, R.; Sanesi, G. Estimating the probability of wildfire occurrence in Mediterranean landscapes using Artificial Neural Networks. Environ. Impact Assess. Rev. 2020, 85, 106474. [Google Scholar] [CrossRef]
  31. Janiec, P.; Gadal, S. A comparison of two machine learning classification methods for remote sensing predictive modeling of the forest fire in the North-Eastern Siberia. Remote Sens. 2020, 12, 4157. [Google Scholar] [CrossRef]
  32. Justice, C.; Giglio, L.; Korontzi, S.; Owens, J.; Morisette, J.; Roy, D.; Descloitres, J.; Alleaume, S.; Petitcolin, F.; Kaufman, Y. The MODIS fire products. Remote Sens. Environ. 2002, 83, 244–262. [Google Scholar] [CrossRef]
  33. Amraoui, M.; Pereira, M.G.; DaCamara, C.C.; Calado, T.J. Atmospheric conditions associated with extreme fire activity in the Western Mediterranean region. Sci. Total Environ. 2015, 524, 32–39. [Google Scholar] [CrossRef]
  34. Guo, F.; Su, Z.; Wang, G.; Sun, L.; Tigabu, M.; Yang, X.; Hu, H. Understanding fire drivers and relative impacts in different Chinese forest ecosystems. Sci. Total Environ. 2017, 605, 411–425. [Google Scholar] [CrossRef]
  35. Stoyan, D.; Penttinen, A. Recent applications of point process methods in forestry statistics. Stat. Sci. 2000, 15, 61–78. [Google Scholar]
  36. Guo, F.; Innes, J.L.; Wang, G.; Ma, X.; Sun, L.; Hu, H.; Su, Z. Historic distribution and driving factors of human-caused fires in the Chinese boreal forest between 1972 and 2005. J. Plant Ecol. 2015, 8, 480–490. [Google Scholar] [CrossRef] [Green Version]
  37. Monjarás-Vega, N.A.; Briones-Herrera, C.I.; Vega-Nieva, D.J.; Calleros-Flores, E.; Corral-Rivas, J.J.; López-Serrano, P.M.; Pompa-García, M.; Rodríguez-Trejo, D.A.; Carrillo-Parra, A.; González-Cabán, A. Predicting forest fire kernel density at multiple scales with geographically weighted regression in Mexico. Sci. Total Environ. 2020, 718, 137313. [Google Scholar] [CrossRef]
  38. Flores-Garnica, J.G.; Macías-Muro, A. Bandwidth selection for kernel density estimation of forest fires. Rev. Chapingo Ser. Cienc. For. Y Del Ambiente 2018, 24, 313–327. [Google Scholar] [CrossRef]
  39. Li, J.; Bo, Y.; Xie, S. Estimating emissions from crop residue open burning in China based on statistics and MODIS fire products. J. Environ. Sci. 2016, 44, 158–170. [Google Scholar] [CrossRef] [PubMed]
  40. Giglio, L.; Schroeder, W.; Justice, C.O. The collection 6 MODIS active fire detection algorithm and fire products. Remote Sens. Environ. 2016, 178, 31–41. [Google Scholar] [CrossRef] [Green Version]
  41. Xie, H.; Du, L.; Liu, S.; Chen, L.; Gao, S.; Liu, S.; Pan, H.; Tong, X. Dynamic monitoring of agricultural fires in China from 2010 to 2014 using MODIS and GlobeLand30 data. ISPRS Int. J. Geo-Inf. 2016, 5, 172. [Google Scholar] [CrossRef] [Green Version]
  42. Kumari, B.; Pandey, A.C. MODIS based forest fire hotspot analysis and its relationship with climatic variables. Spat. Inf. Res. 2020, 28, 87–99. [Google Scholar] [CrossRef]
  43. Roy, D.P.; Kumar, S.S. Multi-year MODIS active fire type classification over the Brazilian Tropical Moist Forest Biome. Int. J. Digit. Earth 2017, 10, 54–84. [Google Scholar] [CrossRef] [Green Version]
  44. Wu, Z.; He, H.S.; Keane, R.E.; Zhu, Z.; Wang, Y.; Shan, Y. Current and future patterns of forest fire occurrence in China. Int. J. Wildland Fire 2019, 29, 104–119. [Google Scholar] [CrossRef]
  45. Tao, J.; Zhang, Y.; Yuan, X.; Wang, J.; Zhang, X. Analysis of forest fires in Northeast China from 2003 to 2011. Int. J. Remote Sens. 2013, 34, 8235–8251. [Google Scholar] [CrossRef]
  46. Jazebi, S.; De Leon, F.; Nelson, A. Review of wildfire management techniques—Part I: Causes, prevention, detection, suppression, and data analytics. IEEE Trans. Power Deliv. 2019, 35, 430–439. [Google Scholar] [CrossRef]
  47. Wang, J.; Wang, G.; Qi, J.; Liu, Y.; Zhang, W. Research of Forest Fire Points Detection Method Based on MODIS Active Fire Product. In Proceedings of the 2021 28th International Conference on Geoinformatics, Nanchang, China, 3–5 November 2021; pp. 1–5. [Google Scholar]
  48. Parto, F.; Saradjian, M.; Homayouni, S. MODIS brightness temperature change-based forest fire monitoring. J. Indian Soc. Remote Sens. 2020, 48, 163–169. [Google Scholar] [CrossRef]
  49. Sapiains, R.; Ugarte, A.M.; Aldunce, P.; Marchant, G.; Romero, J.A.; Gonzalez, M.E.; Inostroza-Lazo, V. Local perceptions of fires risk and policy implications in the hills of Valparaiso, Chile. Sustainability 2020, 12, 4298. [Google Scholar] [CrossRef]
  50. Pastor, E.; Muñoz, J.A.; Caballero, D.; Àgueda, A.; Dalmau, F.; Planas, E. Wildland–Urban interface fires in Spain: Summary of the policy framework and recommendations for improvement. Fire Technol. 2020, 56, 1831–1851. [Google Scholar] [CrossRef]
  51. Yang, W.; Jiang, X. Evaluating forest fire probability under the influence of human activity based on remote sensing and GIS. Nat. Hazards Earth Syst. Sci. Discuss. 2020, 1–16. [Google Scholar] [CrossRef]
  52. Davis, K.T.; Dobrowski, S.Z.; Higuera, P.E.; Holden, Z.A.; Veblen, T.T.; Rother, M.T.; Parks, S.A.; Sala, A.; Maneta, M.P. Wildfires and climate change push low-elevation forests across a critical climate threshold for tree regeneration. Proc. Natl. Acad. Sci. USA 2019, 116, 6193–6198. [Google Scholar] [CrossRef] [Green Version]
  53. Rafael, M.-T.; María, S.-C.; Sergio, O.-M.; Oscar, C.-V. Environmental and economic impact of Forest fires in Puerto Rico 2013–2014. Open J. For. 2015, 5, 353. [Google Scholar] [CrossRef] [Green Version]
  54. Westerling, A.L.; Hidalgo, H.G.; Cayan, D.R.; Swetnam, T.W. Warming and earlier spring increase western US forest wildfire activity. Science 2006, 313, 940–943. [Google Scholar] [CrossRef] [Green Version]
  55. Marín, P.-G.; Julio, C.J.; Dante Arturo, R.-T.; Daniel Jose, V.-N. Drought and spatiotemporal variability of forest fires across Mexico. Chin. Geogr. Sci. 2018, 28, 25–37. [Google Scholar] [CrossRef] [Green Version]
  56. Dos Reis, M.; de Alencastro Graça, P.M.L.; Yanai, A.M.; Ramos, C.J.P.; Fearnside, P.M. Forest fires and deforestation in the central Amazon: Effects of landscape and climate on spatial and temporal dynamics. J. Environ. Manag. 2021, 288, 112310. [Google Scholar] [CrossRef] [PubMed]
  57. Reddy, C.S.; Bird, N.G.; Sreelakshmi, S.; Manikandan, T.M.; Asra, M.; Krishna, P.H.; Jha, C.; Rao, P.; Diwakar, P. Identification and characterization of spatio-temporal hotspots of forest fires in South Asia. Environ. Monit. Assess. 2019, 191, 1–17. [Google Scholar] [CrossRef] [PubMed]
  58. Kim, T.; Hwang, S.; Choi, J. Characteristics of Spatiotemporal Changes in the Occurrence of Forest Fires. Remote Sens. 2021, 13, 4940. [Google Scholar] [CrossRef]
  59. Ying, L.; Zheng, Z.; Li-juan, C.; Siji, K.; Li, J. Suggestions on forest ecological compensation—taking Mudanjiang city as an example. J. Northeast. Agric. Univ. Engl. Ed. 2015, 22, 66–75. [Google Scholar] [CrossRef]
  60. Guo, X.; Zhang, H.; Wang, Y.; Zhao, J.; Zhang, Z. The driving factors and their interactions of fire occurrence in Greater Khingan Mountains, China. J. Mt. Sci. 2020, 17, 2674–2690. [Google Scholar] [CrossRef]
  61. Ma, W.; Feng, Z.; Cheng, Z.; Chen, S.; Wang, F. Identifying forest fire driving factors and related impacts in china using random forest algorithm. Forests 2020, 11, 507. [Google Scholar] [CrossRef]
  62. West, J.B. Safe upper limits for oxygen enrichment of room air at high altitude. High Alt. Med. Biol. 2001, 2, 47–51. [Google Scholar] [CrossRef]
  63. Wu, J.; Zhang, Y.; Sun, L.; Ji, R.; Yu, W.; Feng, R. Forest Fire Intensity Monitoring Using the Himawari Weather Satellite―Taking Liaoning Forest Fires as Examples. E3S Web Conf. 2019, 131, 01088. [Google Scholar] [CrossRef]
  64. Liu, Z.; Yang, J.; Chang, Y.; Weisberg, P.J.; He, H.S. Spatial patterns and drivers of fire occurrence and its future trend under climate change in a boreal forest of Northeast China. Glob. Change Biol. 2012, 18, 2041–2056. [Google Scholar] [CrossRef]
  65. Nunes, A.; Lourenço, L.; Meira, A.C. Exploring spatial patterns and drivers of forest fires in Portugal (1980–2014). Sci. Total Environ. 2016, 573, 1190–1202. [Google Scholar] [CrossRef] [PubMed]
Figure 1. Location of the research area in the northern region of China.
Sustainability 14 06872 g001
Figure 2. Spatial distribution of annual number of fire spots in northern China. (a) Total number of fires in northern China, (b) number of fires by province in the northern region in 2020 and 2021; (c,d) are the spatial distribution of annual fire spots in the northern region, in 2020 and 2021, respectively.
Sustainability 14 06872 g002
Figure 3. Seasonal distribution of fire spots in northern China, in 2020 and 2021. (ad) are the distribution of fire spots, from spring to winter in 2020, respectively, (eh) show the distribution of fire spots, from spring to winter in 2021, respectively.
Sustainability 14 06872 g003
Figure 4. Seasonal changes and monthly changes in the number of fire spots in northern China. (a,b) are the seasonal changes of fire spots, in 2020 and 2021, respectively, (c,d) are the graphs of monthly changes of fire spots, in 2020 and 2021, respectively.
Sustainability 14 06872 g004
Figure 5. Spatial-distribution pattern of fire spots in Heilongjiang (a,b), Jilin (c,d), Liaoning (e,f), and Hebei (g,h), in 2020 and 2021, respectively.
Sustainability 14 06872 g005
Figure 6. Distribution maps of fire spots nuclear density in Heilongjiang (a,b), Jilin (c,d), Liaoning (e,f), and Hebei (g,h), in 2020 and 2021, respectively.
Sustainability 14 06872 g006
Publisher’s Note: MDPI stays neutral with regard to jurisdictional claims in published maps and institutional affiliations.

