Environmental Regulation, Digital Financial Inclusion, and Environmental Pollution: An Empirical Study Based on the Spatial Spillover Effect and Panel Threshold Effect
Abstract
:1. Introduction
2. Literature Review
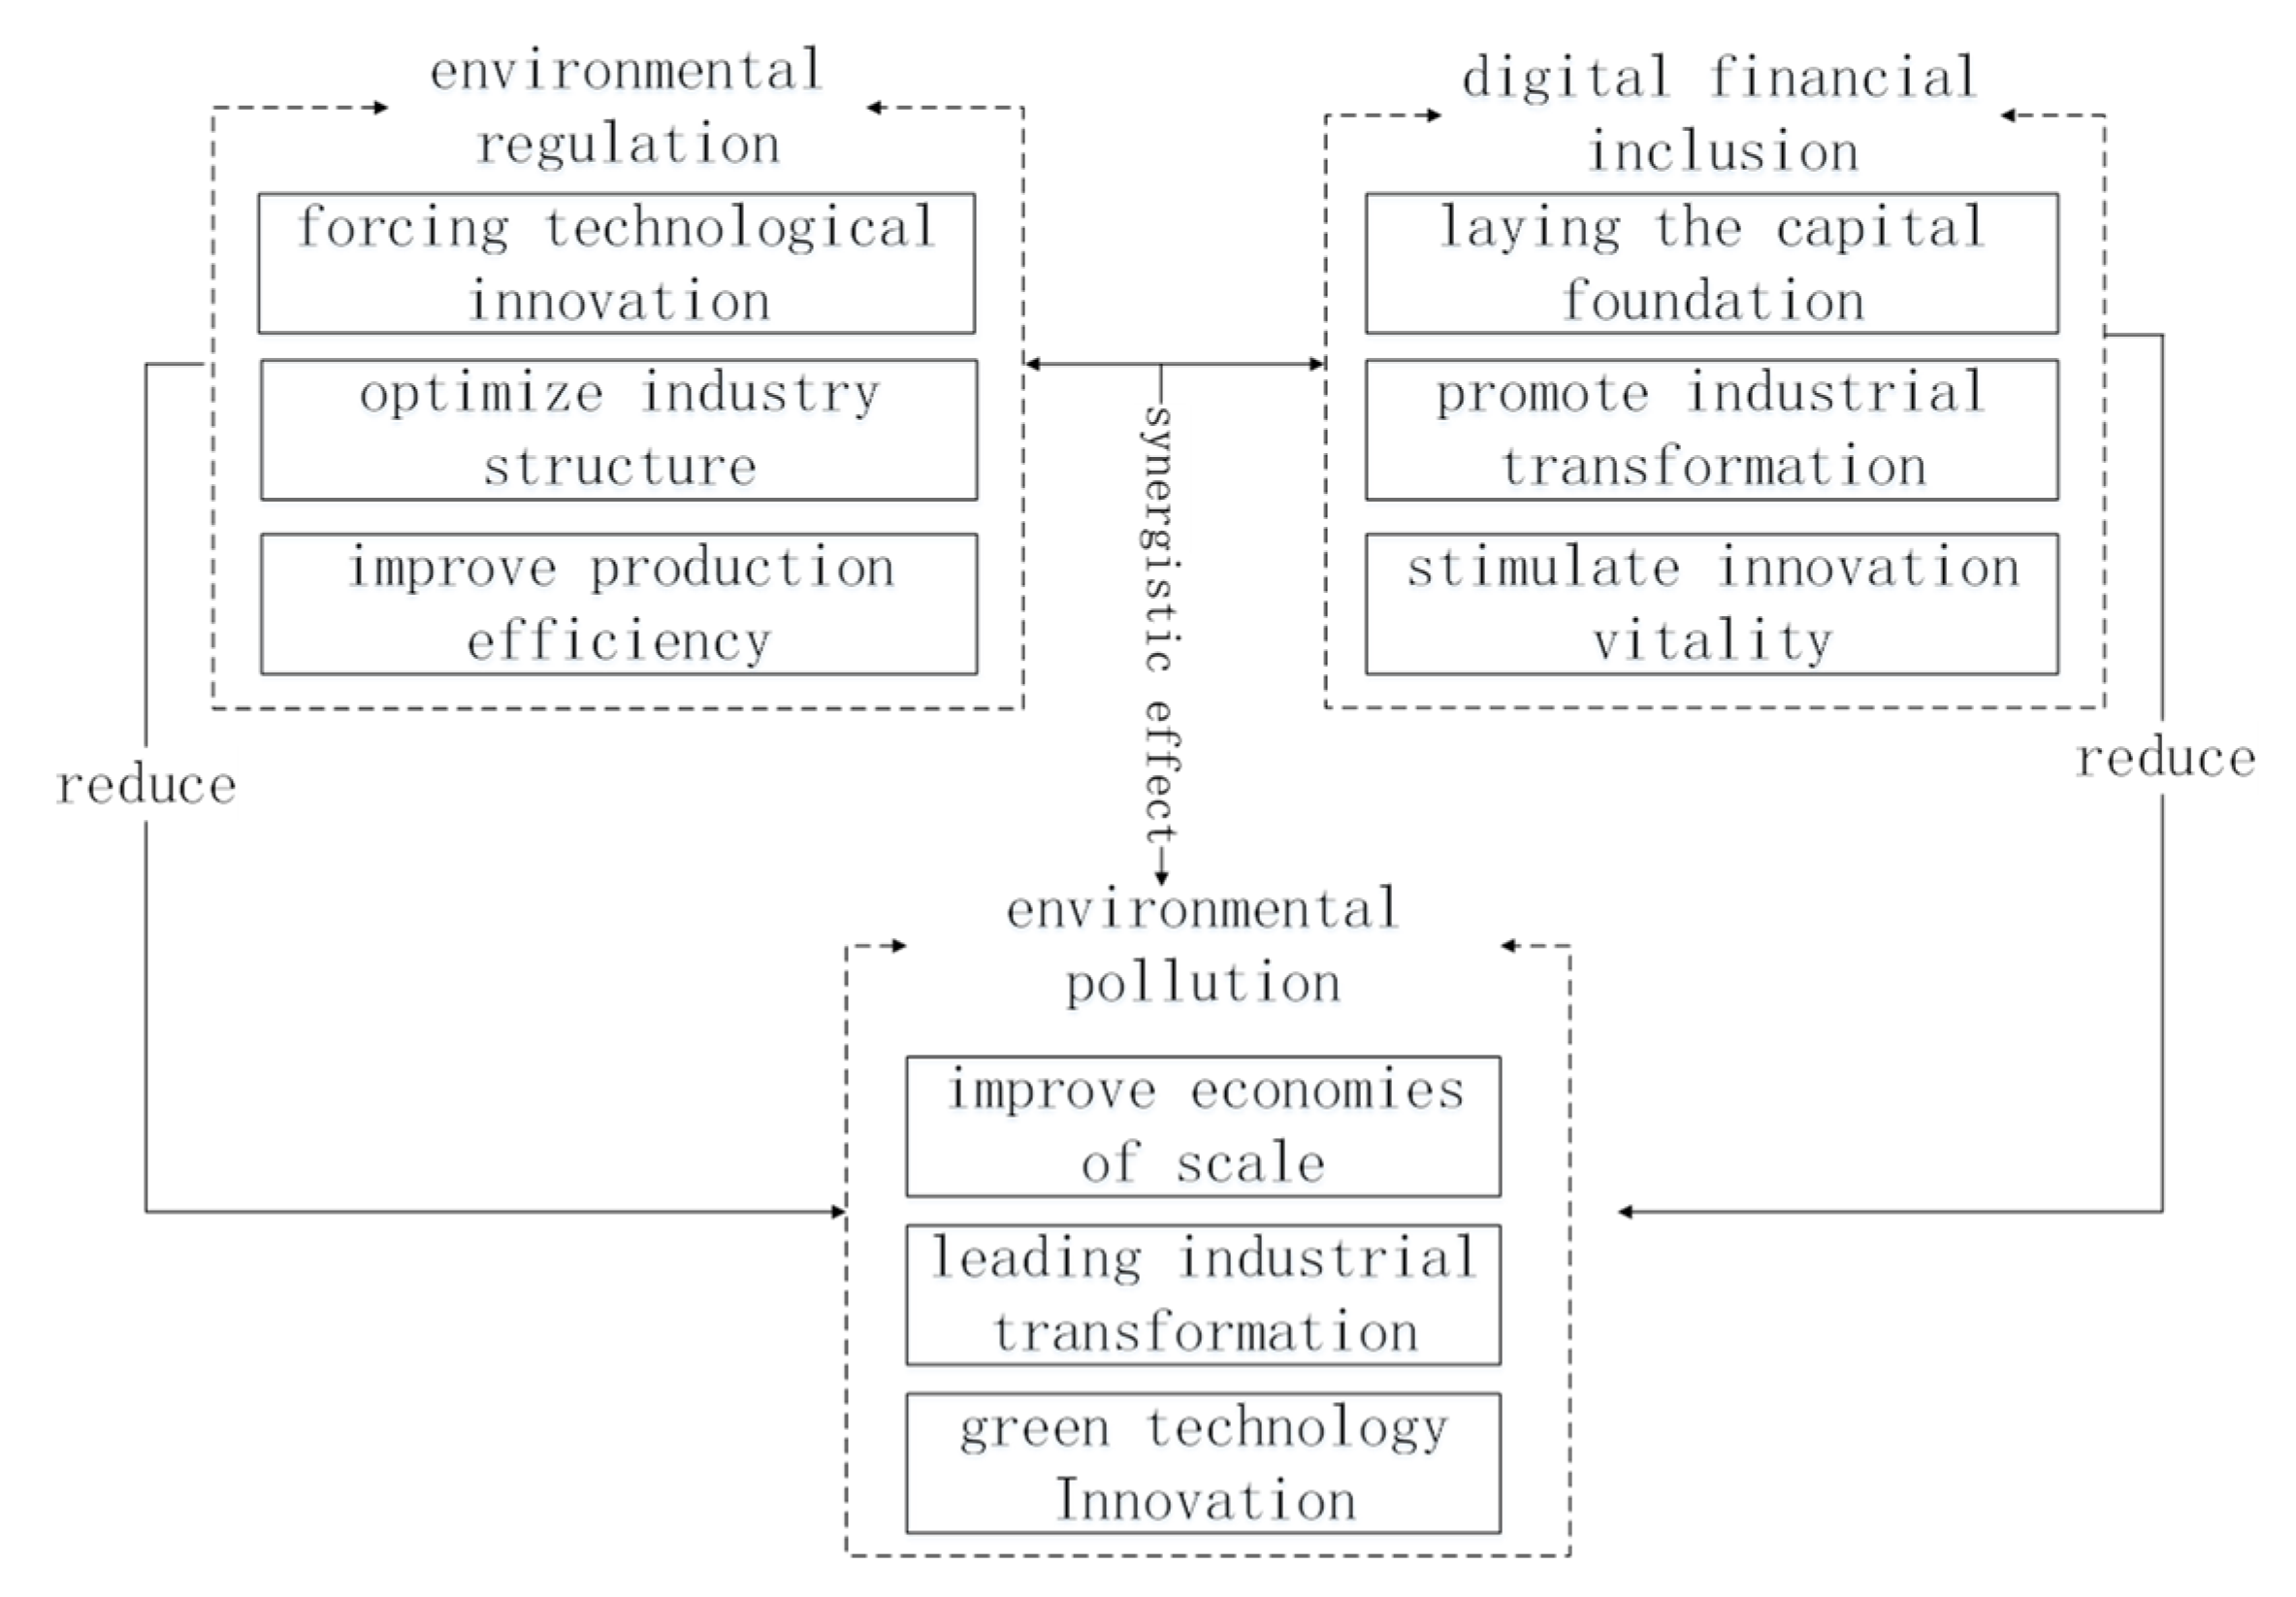
3. Research Hypothesis
4. Data Sources and Research Methods
4.1. Index Selection
4.1.1. Explained Variable
4.1.2. Core Explanatory Variables
4.1.3. Control Variables
4.2. Data Description
4.3. Research Methods
4.3.1. Spatial Correlation Test
4.3.2. Weight Matrix Settings
4.3.3. Spatial Econometric Model
4.3.4. Panel Threshold Model
5. Empirical Results
5.1. Spatial Econometric Model
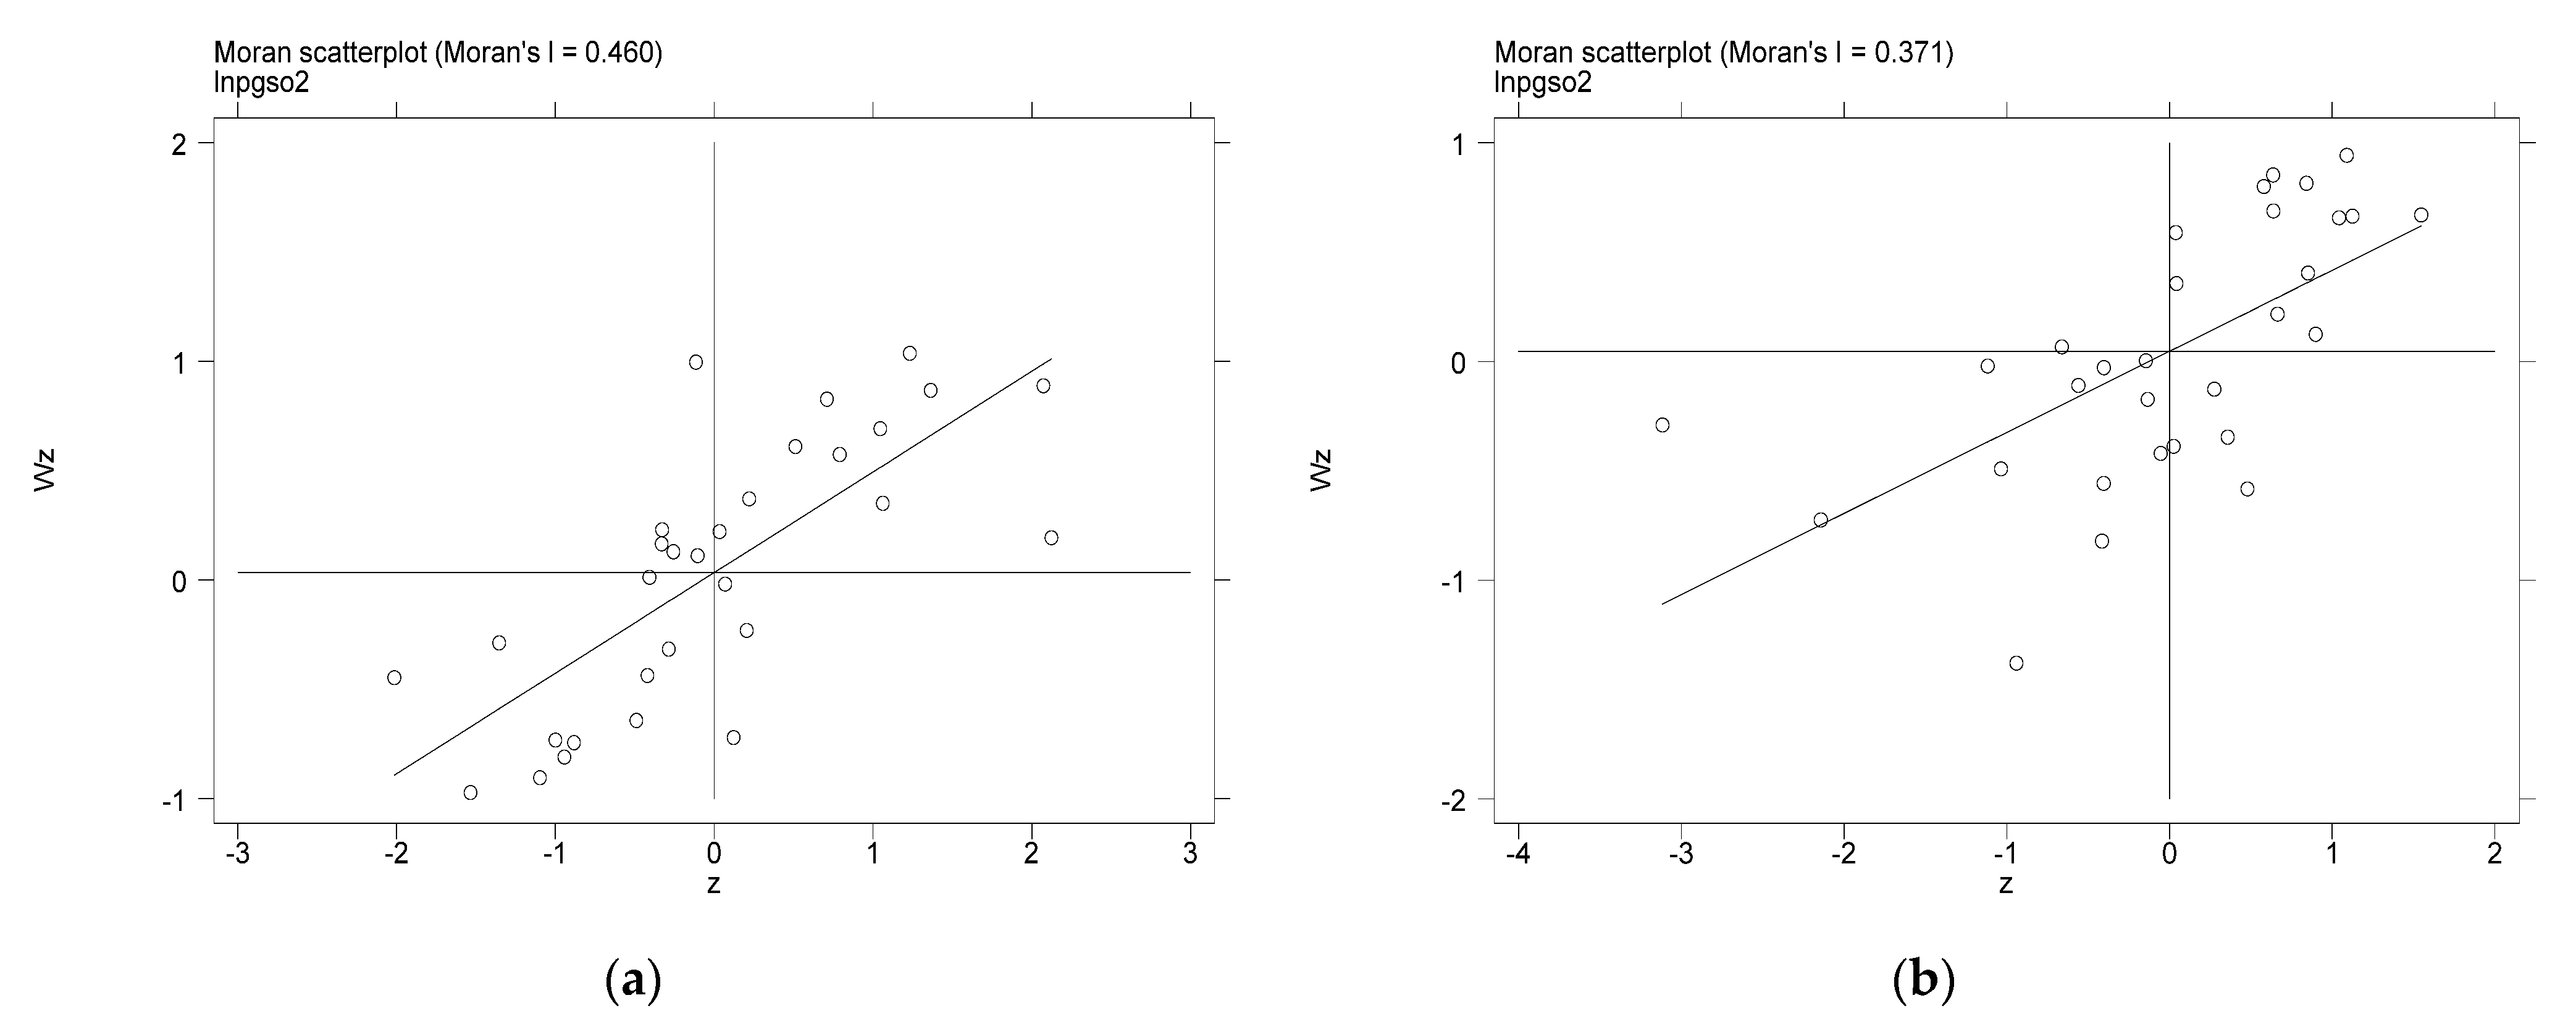
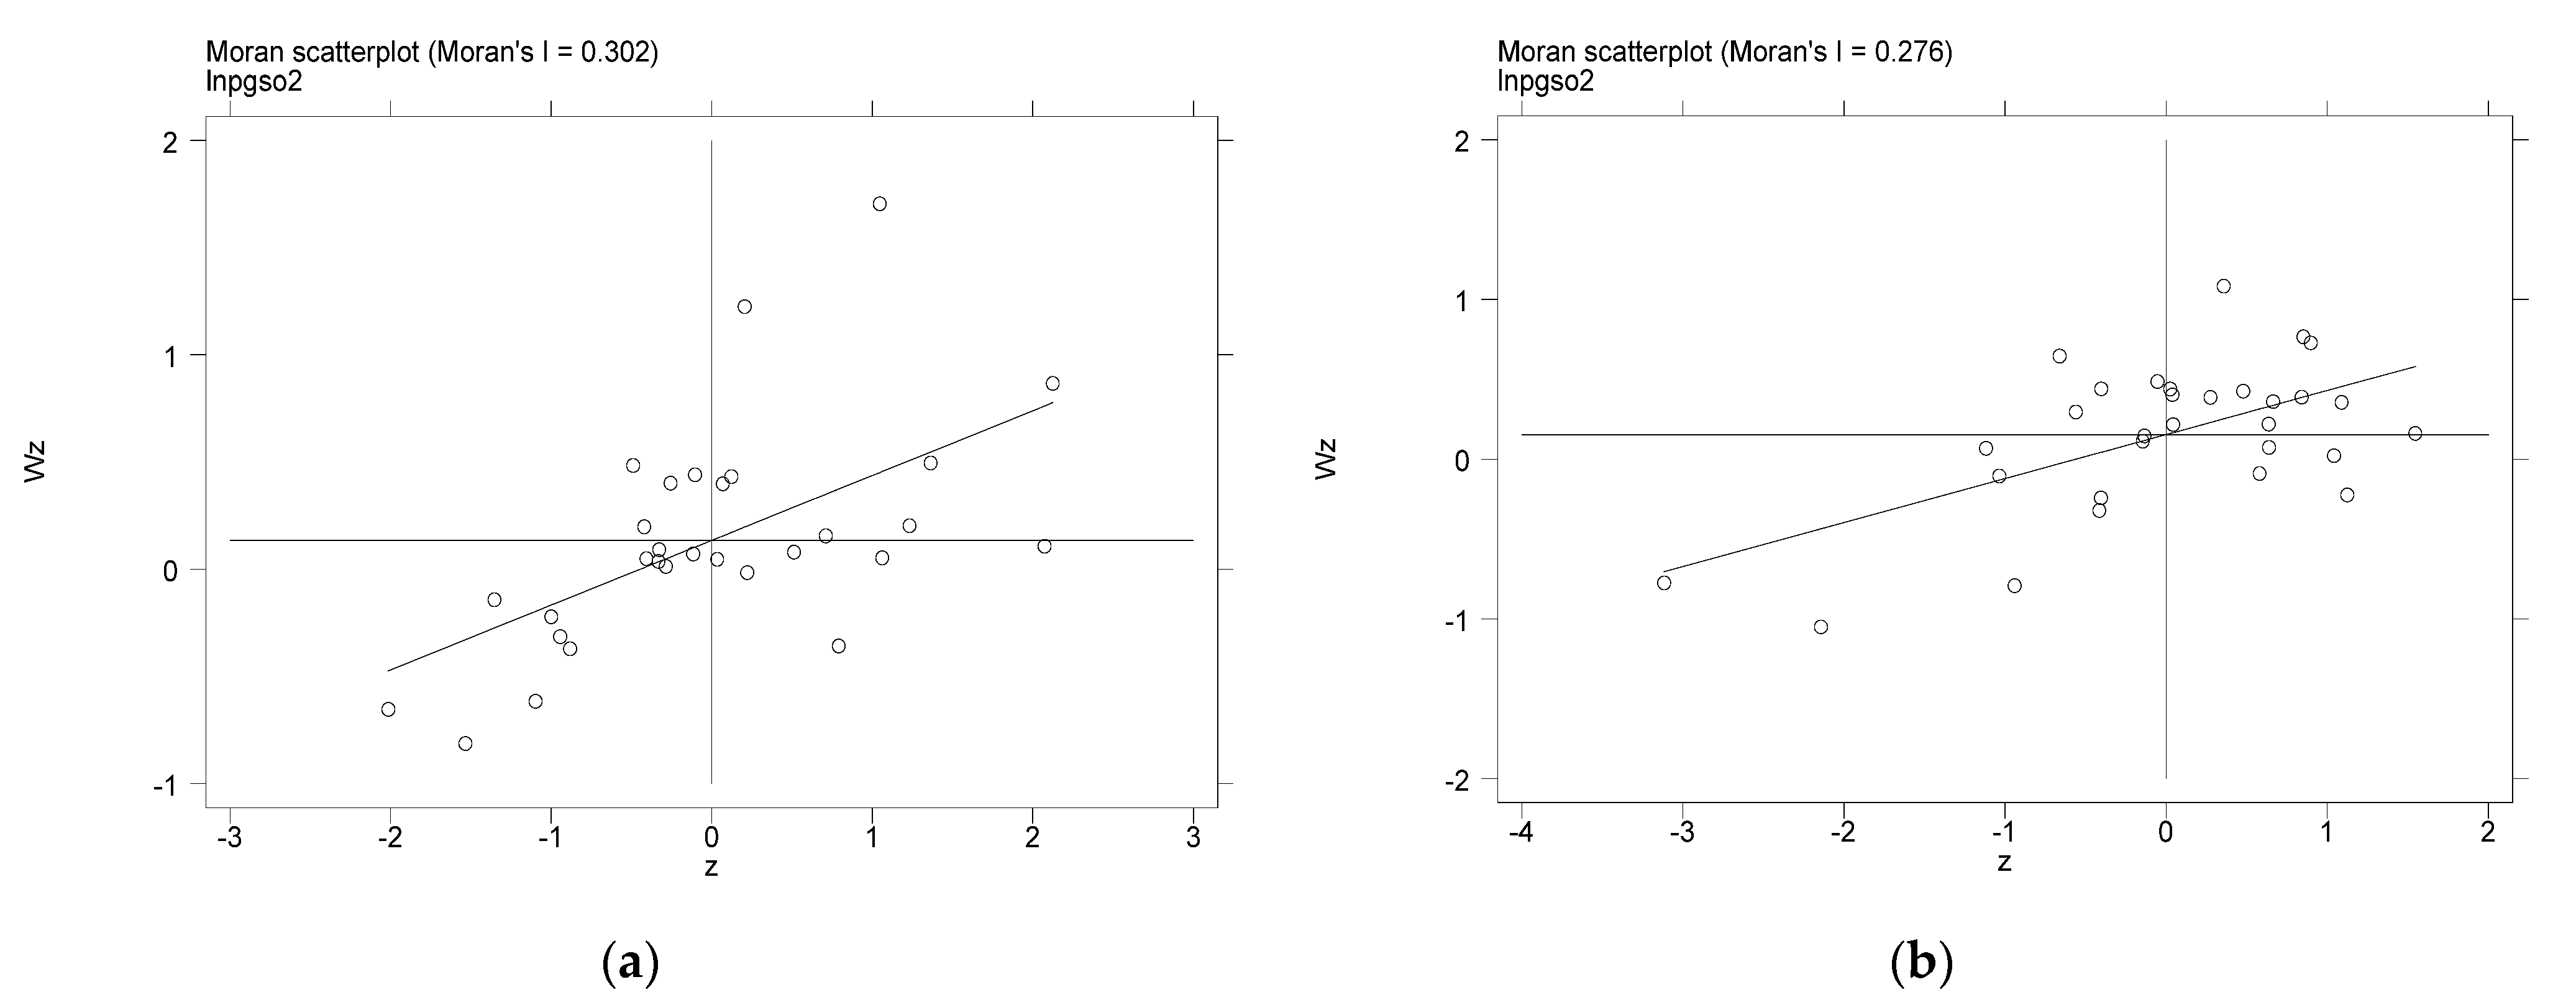
5.1.1. Spatial Correlation Test
5.1.2. Analysis of Spatial Econometric Models
5.1.3. Spatial Effect Decomposition
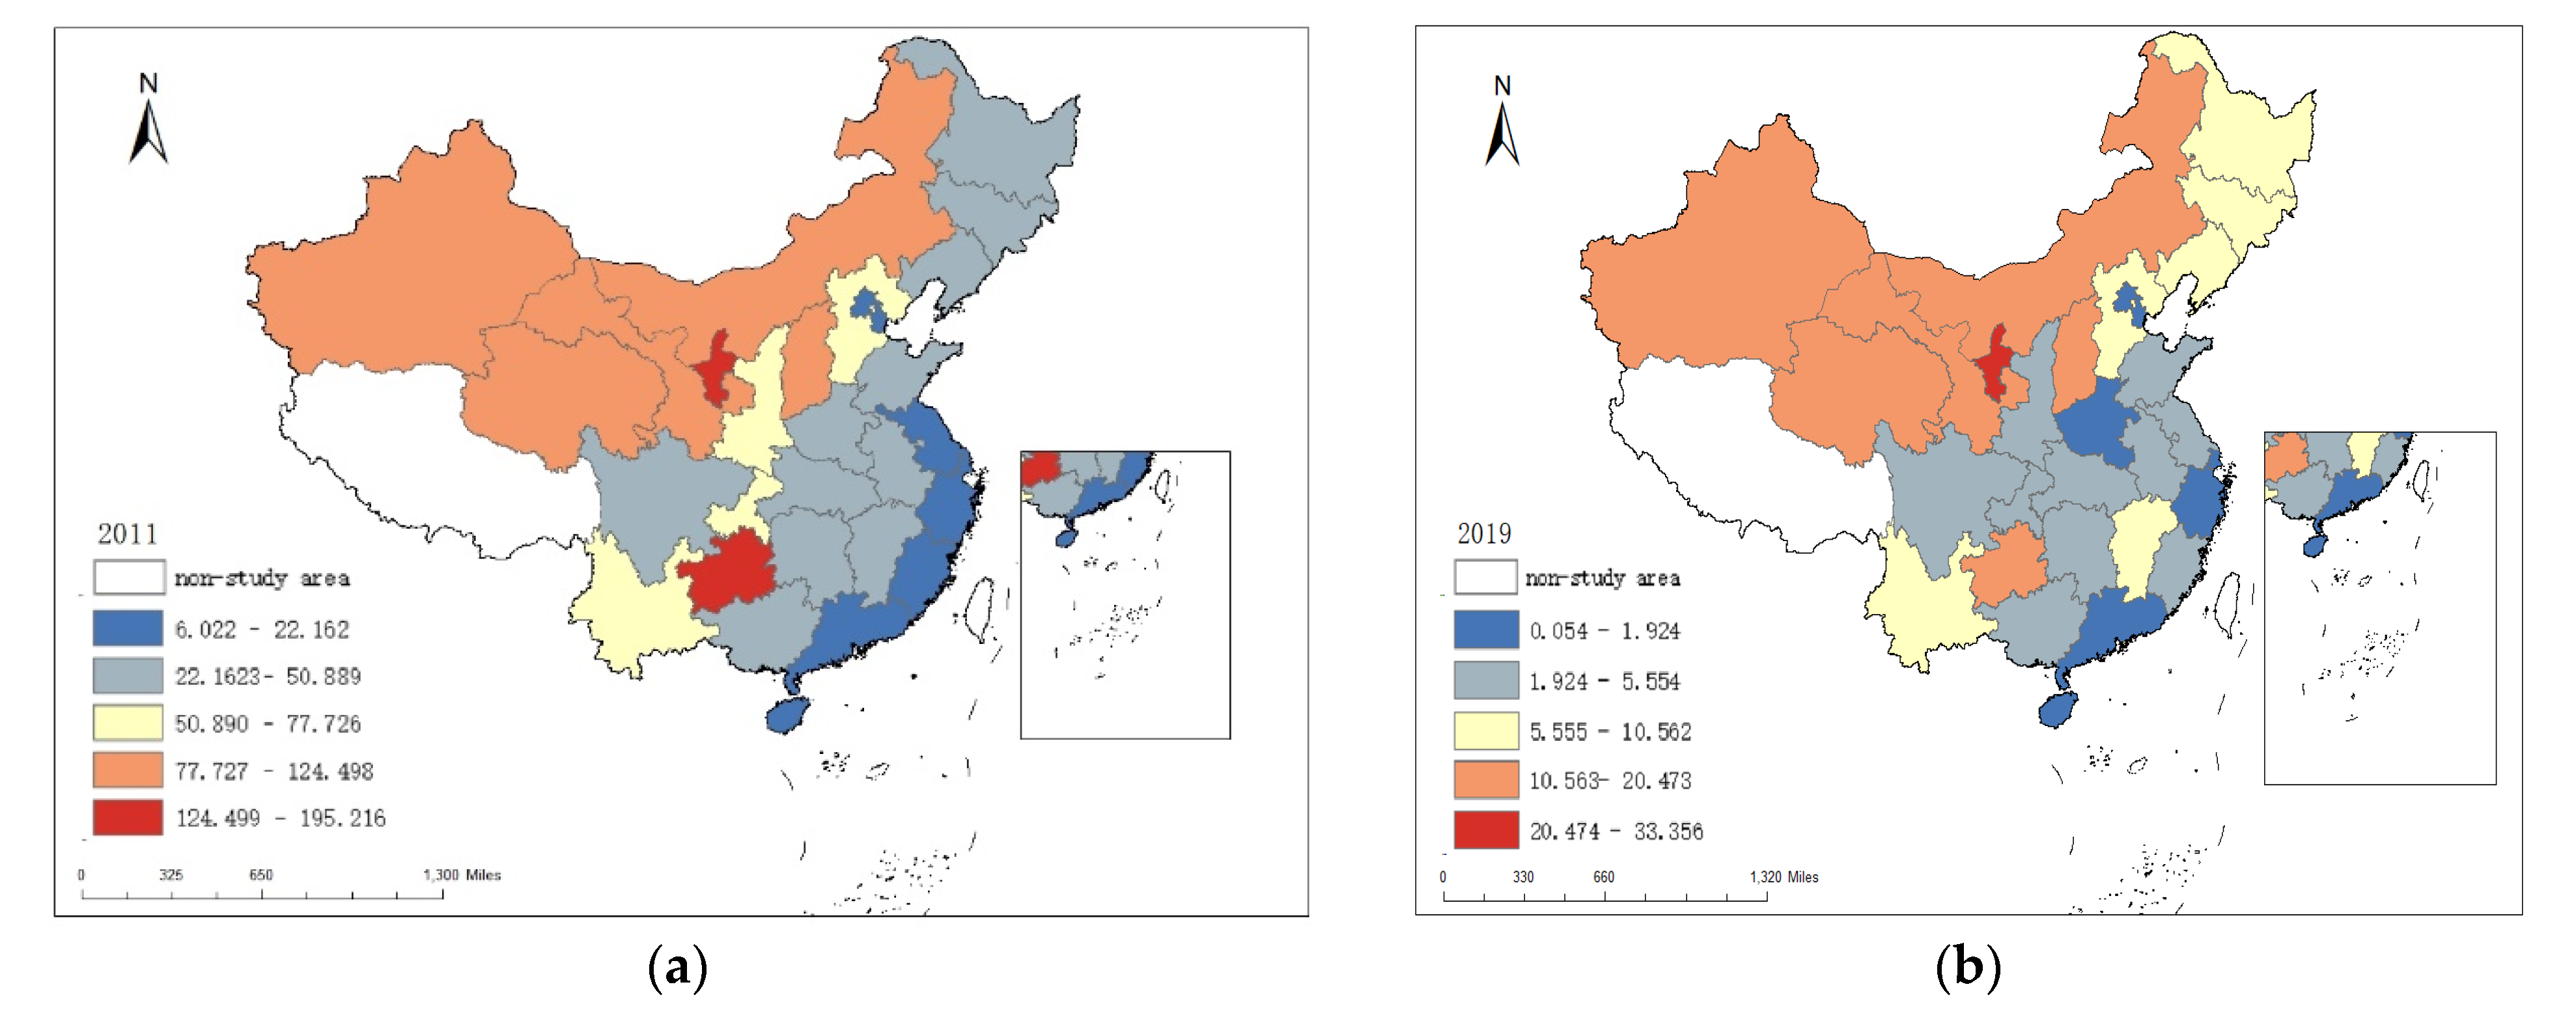
5.1.4. Research on Regional Space
5.2. Empirical Analysis of the Panel Threshold Mode
5.2.1. Threshold Effect Test
5.2.2. Analysis of Threshold Regression Results
5.3. Discussion of Empirical Results
6. Conclusions
7. Suggestions
7.1. Policy Recommendations
7.2. Research Limitations and Future Research
Author Contributions
Funding
Institutional Review Board Statement
Informed Consent Statement
Data Availability Statement
Conflicts of Interest
References
- Chen, H.; Luo, L. The Impact and Spatial Effects of Environmental Regulation on High-quality Economic Development: Based on the Intermediary Perspective of Industrial Structure Transformation. J. Beijing Inst. Technol. 2021, 23, 27–40. [Google Scholar]
- Yang, J.; Sun, J. Financial Development, Capital Allocation Efficiency and Real Economy—From the Perspective of Financial Development in Different Dimensions. Inv. Res. 2021, 40, 36–53. [Google Scholar]
- Hu, Z.; Zhang, Y.; Deng, J.; Yang, Z. Research on Mechanism of and Effects of Stringent Environment Regulation on Economic Growth. J. Hunan Univ. 2021, 35, 50–59. [Google Scholar]
- Ma, H.; Qu, X. Impact of Digital Financial Inclusion on the High-quality Economic Development—Based on Rural Human Capital and Digital Divide Perspective. Inq. Into Econ. Issues 2021, 10, 173–190. [Google Scholar]
- Ran, M.; Tong, X. Financial Misallocation, Political Connection and Enterprise Innovation Output. Sci. Res. Manag. 2020, 41, 89–97. [Google Scholar]
- Porter, M.E.; Van Der Linde, C. Toward a new conception of the environment-competitiveness relationship. J. Econ. Perspect. 1995, 4, 97–118. [Google Scholar] [CrossRef] [Green Version]
- Dasgupta, S.; Laplante, B.; Mamingi, N.; Wang, H. Inspections, Pollution Prices, and Environmental Performance: Evidence from China. Ecol. Econ. 2001, 36, 487–498. [Google Scholar] [CrossRef]
- Thiel, C.; Nijs, W.; Simoes, S.; Schmidt, J.; van Zyl, A.; Schmid, E. The Impact of the EU Car CO2 Regulation on the Energy System and the Role of Electro-mobility to Achieve Transport Decarbonisation. Energy Policy 2016, 96, 153–166. [Google Scholar] [CrossRef]
- Magat, W.A.; Viscusi, W.K. Effectiveness of the EPA’S Regulatory Enforcement: The Case of Industrial Effluent Standards. J. Law Econ. 1990, 33, 331–360. [Google Scholar] [CrossRef]
- Laplante, B.; Rilstone, P. Environmental Inspections and Emissions of the Pulp and Paper Industry in Quebec. J. Environ. Econ. Manag. 2004, 31, 19–36. [Google Scholar] [CrossRef]
- Berman, E.; Bui, L. Environmental regulation and productivity: Evidence from oil refineries. Rev. Econ. Stat. 2001, 83, 498–510. [Google Scholar] [CrossRef] [Green Version]
- Peuckert, J. What shapes the impact of environmental regulation on competitiveness? Evidence from Executive Opinion Surveys. Environ. Innov. Soc. Transit. 2014, 10, 77–94. [Google Scholar] [CrossRef]
- Langpap, C.; Shimshack, J.P. Private citizen suits and public enforcement: Substitutes or complements? J. Environ. Econ. Manag. 2010, 59, 249. [Google Scholar] [CrossRef]
- Shapiro, J.S.; Walker, R. Why Is Pollution from US Manufacturing Declining? The Roles of Environmental Regulation, Productivity, and Trade. Am. Econ. Rev. 2018, 108, 3814–3854. [Google Scholar] [CrossRef] [Green Version]
- Dasgupta, S.; Laplante, B.; Wang, H.; Wheeler, D. Confronting the environmental Kuznets curve. J. Econ. Perspect. 2002, 16, 147–168. [Google Scholar] [CrossRef] [Green Version]
- Taksibi, F.; Khajehpour, H.; Saboohi, Y. On the environmental effectiveness analysis of energy policies: A case study of air pollution in the megacity of Tehran. Sci. Total Environ. 2020, 705, 135824. [Google Scholar] [CrossRef]
- Chiesa, M.; Perrone, M.G.; Cusumano, N. An environmental, economical and socio-political analysis of a variety of urban air-pollution reduction policies for primary pm10 and NOx: The case study of the Province of Milan (Northern Italy). Environ. Sci. Pol. 2014, 44, 39–50. [Google Scholar] [CrossRef]
- Sinn, H.W. Public Policies Against Global Warming: A Supply Side Approach. Int. Tax. Public Financ. 2008, 15, 360–394. [Google Scholar] [CrossRef]
- Hoel, M. Is there a Green Paradox? CESifo Work. Pap. Ser. 2010, 100, 1999–2030. [Google Scholar] [CrossRef]
- Eichner, T.; Pethig, R. Carbon Leakage, The Green Paradox, and Perfect Future Markets. Intern. Econ. Rev. 2011, 52, 767–805. [Google Scholar] [CrossRef]
- Saltari, E.; Travaglini, G. The Effects of Environmental Policies on the Abatement Investment Decisions of a Green Firm. Resour. Energy. Econ. 2011, 33, 666–685. [Google Scholar] [CrossRef]
- Leiter, A.M.; Arolini, A.; Winner, H. Environmental Regulation and Investment: Evidence from European Industry Data. Ecol. Econ. 2011, 70, 759–770. [Google Scholar] [CrossRef]
- Greenstone, M. Did the Clean Air Act cause the remarkable decline in sulfur dioxide concentrations? J. Environ. Econ. Manag. 2004, 47, 585–611. [Google Scholar] [CrossRef]
- Blackman, A.; Kildegaard, A. Clean technological change in developing country industrial clusters: Mexican leather tanning. Environ. Econ. Policy Stud. 2010, 12, 115–132. [Google Scholar] [CrossRef] [Green Version]
- Smulders, S.; Tsur, Y.; Zemel, A. Announcing climate policy: Can a green paradox arise without scarcity? J. Enviro. Econ. Manag. 2012, 64, 364–376. [Google Scholar] [CrossRef] [Green Version]
- Becker, R.A. Air pollution abatement costs under the Clean Air Act: Evidence from the PACE survey. J. Environ. Econ. Manag. 2005, 50, 144–169. [Google Scholar] [CrossRef] [Green Version]
- Diaz-Mendez, S.E.; Torres-Rodriguez, A.A.; Abatal, M.; Escalante Soberanis, M.A.; Bassam, A.; Pedraza-Basulto, G.K. Economic, environmental and health co-benefits of the use of advanced control strategies for lighting in buildings of Mexico. Energy Policy 2018, 113, 401–409. [Google Scholar] [CrossRef]
- Zhao, X.; Sun, B. The Influence of Chinese Environmental Regulation on Corporation Innovation and Competitiveness. J. Clean. Prod. 2015, 86, 311–322. [Google Scholar] [CrossRef]
- Dai, Q.; Yang, J.; Zhang, X.; Hu, S. Transfer characteristics, patterns and mechanisms of polluting enterprises and industries. Geogr. Res. 2020, 39, 1511–1533. [Google Scholar]
- Wang, Y.; Shen, N. Environmental regulation and environmental productivity: The case of China. Renew. Sust. Energ. Rev. 2016, 62, 758–766. [Google Scholar] [CrossRef]
- Xie, R.; Yuan, Y.; Huang, J. Different Types of Environmental Regulations and Heterogeneous Influence on “Green” Productivity: Evidence from China. Ecol. Econ. 2017, 132, 104–112. [Google Scholar] [CrossRef]
- Guo, W.; Chen, Y. Assessing the efficiency of China’s environmental regulation on carbon emissions based on Tapio decoupling models and GMM models. Energy Rep. 2018, 4, 713–723. [Google Scholar]
- Ouyang, X.; Shao, Q.; Zhu, X.; He, Q.; Xiang, C.; Wei, G. Environmental regulation, economic growth and air pollution: Panel threshold analysis for OECD countries. Sci. Total Environ. 2019, 657, 234–241. [Google Scholar] [CrossRef]
- Tamazian, A.; Juan, P.; Krishna, C.V. Does Higher Economic and Financial Development Lead to Environmental Degradation: Evidence from BRIC Countries. Energy Policy 2009, 37, 246–253. [Google Scholar] [CrossRef]
- Shahbaz, M.; Solarin, S.A.; Mahmood, H. Does Financial Development Reduce CO2 Emissions in Malaysian Economy? A Time Series Analysis. Econ. Mod. 2013, 35, 145–152. [Google Scholar] [CrossRef] [Green Version]
- Shahbaz, M.; Shahzad, S.; Ahmad, N.; Alam, S. Financial Development and Environmental Quality: The Way Forward. Energy Policy 2016, 98, 353–364. [Google Scholar] [CrossRef] [Green Version]
- Zhang, Y. The Impact of Financial Development on Carbon Emissions: An Empirical Analysis in China. Energy Policy 2011, 39, 2197–2203. [Google Scholar] [CrossRef]
- Zhao, J.; Liu, C.; Li, C. The impact of financial development on carbon emissions: “Promoting effect” or “inhibiting effect”?—The Mediating Effect Model Based on the Heterogeneity of Technological Progress. J. Xinjiang Univ. 2020, 4, 1–10. [Google Scholar]
- Charfeddine, L.; Khedirik, B. Financial development and environmental quality in UAE: Cointegration with structural breaks. Renew. Sust. Energ. Rev. 2016, 55, 1322–1335. [Google Scholar] [CrossRef]
- Hu, Z.; Li, Y. The dual effects and threshold characteristics of financial development on environmental pollution. China Soft Sci. 2019, 7, 68–80. [Google Scholar]
- Xu, M.; Xu, X.; Xie, Q. The transmission role of inclusive finance in green ecological development. Shandong Soc. Sci. 2018, 3, 176–186. [Google Scholar]
- Zaidi, S.A.; Muzzammil, H.; Qamar, Z. Dynamic Linkages between Financial Inclusion and Carbon Emissions: Evidence from Selected OECD Countries. Resour. Environ. Sust. 2021, 4, 100022. [Google Scholar] [CrossRef]
- Xu, Z.; Gao, Y.; Huo, Z. The Pollution Reduction Effect of Digital Finance. Financ. Econ. 2021, 4, 28–39. [Google Scholar]
- Wan, J.; Pu, Z.; Tavera, C. The impact of digital finance on pollutants emission: Evidence from Chinese cities. Environ Sci. Pollut. Res. 2022. [Google Scholar] [CrossRef]
- Zheng, W.; Zhao, H.; Zhao, M. Is the Development of Digital Finance Conducive to Environmental Pollution Control?—Also Discussing the Regulating Role of Local Resource Competition. Ind. Econ. Res. 2022, 1, 1–13. [Google Scholar]
- Liu, T.; Xu, Z.; Zhang, K. The Impact of Digital Finance on the Synergy of Economic Development and Ecological Environment. Mod. Financ. Econ. J. Tianjin Univ. Financ. Econ. 2022, 42, 21–36. [Google Scholar]
- Li, G.; Fang, X.; Liu, M. Will Digital Inclusive Finance Make Economic Development Greener? Evidence from China. Front. Environ. Sci. 2021, 9, 762231. [Google Scholar] [CrossRef]
- Yang, L.; Wang, L.; Ren, X. Assessing the impact of digital financial inclusion on PM2.5 concentration: Evidence from China. Environ. Sci. Pollut. Res. 2022, 29, 22547–22554. [Google Scholar] [CrossRef] [PubMed]
- Zhao, H.; Yang, Y.; Li, N.; Liu, D.; Li, H. How Does Digital Finance Affect Carbon Emissions? Evidence from an Emerging Market. Sustainability 2021, 13, 12303. [Google Scholar] [CrossRef]
- He, M.; Yang, X. Digital Financial Inclusion, Carbon Emissions and Total Factor Productivity. Financ. Forum 2021, 26, 18–25. [Google Scholar]
- Deng, R.; Zhang, A. The impact and mechanism of China’s urban digital finance development on carbon emission performance. Resour. Sci. 2021, 43, 2316–2330. [Google Scholar]
- Yao, F.; Wang, T.; Tan, L. The Impact of Digital Inclusive Finance on Carbon Emission Efficiency: An Empirical Analysis from a Spatial Perspective. Financi. Econ. Res. 2021, 36, 142–158. [Google Scholar]
- Ni, Y.; Chen, B.; Wang, Y. Financial Development, Environmental Regulation and Green Total Factor Productivity: An Empirical Analysis Based on Spatial Durbin Model. J. Guizhou Univ. Financ. Econ. 2020, 3, 12–21. [Google Scholar]
- Li, R.; Yang, Y. Environmental Regulation, Financial Resource Allocation and Green Development Efficiency. Ecol. Econ. 2020, 36, 147–152. [Google Scholar]
- Li, L.; Tian, W. Environmental Regulation, Financial Development and Industrial Structure Upgrading. Explor. Financ. Theory 2018, 6, 15–24. [Google Scholar]
- Wang, F.; Shi, X.; Liu, J.; He, X.; Chen, H. Environmental Regulation, Financial Development and Industrial Structure Upgrading. Financ. Econ. 2018, 8, 55–61. [Google Scholar]
- Li, Y.; Li, F.; Li, X. Environmental Regulation, Digital Inclusive Finance and Urban Industrial Upgrading—Analysis Based on Spatial Spillover Effect and Regulation Effect. Inq. Into Econ. Issues 2022, 1, 50–66. [Google Scholar]
- ShangGuan, X.; Ge, B. Digital Finance, Environmental Regulation and High-quality Economic Development. Mod. Financ. Econ. J. Tianjin Univ. Financ. Econ. 2021, 41, 84–98. [Google Scholar]
- Cao, S.; Nie, L.; Sun, H.; Sun, W.; Taghizadeh-Hesary, F. Digital finance, green technological innovation and energy-environmental performance: Evidence from China’s regional economies. J. Clean. Prod. 2021, 327, 129458. [Google Scholar] [CrossRef]
- Ding, R.; Shi, F.; Hao, S. Digital Inclusive Finance, Environmental Regulation, and Regional Economic Growth: An Empirical Study Based on Spatial Spillover Effect and Panel Threshold Effect. Sustainability 2022, 14, 4340. [Google Scholar] [CrossRef]
- Becker, R.A.; Pasurka, C.; Shadbegian, R.J. Do environmental regulations disproportionately affect small businesses? Evidence from the pollution abatement costs and expenditures survey. J. Environ. Econ. Manag. 2013, 66, 523–538. [Google Scholar] [CrossRef] [Green Version]
- Millimet, D.L.; Roy, J. Empirical tests of the pollution haven hypothesis when environmental regulation is endogenous. J. Appl. Econ. 2016, 31, 652–677. [Google Scholar] [CrossRef]
- Ambec, S.; Cohen, M.A.; Elgie, S.; Lanoie, P. The porter hypothesis at 20: Can environmental regulation enhance innovation and competitiveness? Rev. Environ. Econ. Policy 2013, 7, 2–22. [Google Scholar] [CrossRef] [Green Version]
- Dechezlepretre, A.; Sato, M. The impacts of environmental regulations on competitiveness. Rev. Environ. Econ. Policy. 2017, 11, 183–206. [Google Scholar] [CrossRef] [Green Version]
- Peng, S.; Bao, Q. China’s Economic Growth and Environmental Pollution: An Empirical Analysis Based on Time Series Data (1985~2003). Cont. Financ. Econ. 2006, 7, 5–12. [Google Scholar]
- Li, X.; Song, M.; An, Q. Study on the Heterogeneity of the Impact of China’s Economic Growth on Environmental Pollution. Nankai Econ. Stud. 2013, 5, 96–114. [Google Scholar]
- Wang, Y.; Han, D. Economic Development, Environmental Pollution and Public Environmental Protection Behavior: A Multi-level Analysis of the 2013 Chinese General Social Survey. J. Renmin. Univ. China 2016, 30, 79–92. [Google Scholar]
- Li, B.; Cao, W. Decoupling Analysis of Economic Development and Environmental Pollution. Econ. Persp. 2014, 7, 48–56. [Google Scholar]
- Shao, S.; Zhang, K.; Dou, J. Energy Conservation and Emission Reduction Effects of Economic Agglomeration: Theory and Chinese Experience. Manag. World 2019, 35, 226. [Google Scholar]
- Qian, H.; Tao, Y.; Cao, S.; Cao, Y. Theory and Empirical Study of China’s Digital Finance Development and Economic Growth. J. Quant. Technic. Econ. 2020, 37, 26–46. [Google Scholar]
- Nie, X.; Jiang, P.; Zheng, X.; Wu, Q. Research on Digital Finance and Regional Technological Innovation Level. J. Financ. Res. 2021, 3, 132–150. [Google Scholar]
- Tang, S.; Wu, X.; Zhu, J. Digital Finance and Enterprise Technological Innovation: Structural Characteristics, Mechanism Identification and Effect Differences under Financial Supervision. Manag. World 2020, 36, 52–66. [Google Scholar]
- Zhang, Q.; Huang, L. Digital Inclusive Finance, Industrial Structure and High-quality Economic Development. Jianghan Forum 2021, 520, 41–51. [Google Scholar]
- Guo, F.; Wang, J.; Wang, F.; Kong, T.; Zhang, X.; Cheng, Z. Measuring China’s Digital Financial Inclusion: Index Compilation and Spatial Characteristics. China Econ. Q. 2020, 19, 1401–1418. [Google Scholar]
- Chen, S.; Zhang, J.; Liu, C. Environmental Regulation, Financing Constraints and Enterprise Pollution Reduction: Evidence from the Adjustment of Pollution Fee Standards. J. Financ. Res. 2021, 9, 51–71. [Google Scholar]
- Lee, C.; Chang, C.; Chen, P. Do CO2 emission levels converge among 21 OECD countries? New evidence from unit root structural break tests. Appl Econ Lett. 2008, 15, 551–556. [Google Scholar] [CrossRef]
- Dominici, F.; Schwartz, J. Air pollution and mortality in the US using Medicare and Medicaid populations. Environ. Epidemiol. 2019, 3, 356–357. [Google Scholar]
- Zhang, L.; Chen, X.; Xue, X.; Sun, M.; Han, B.; Li, C.; Zhao, B. Long-term exposure to high particulate matter pollution and cardiovascular mortality: A 12-year cohort study in four cities in northern China. Environ. Int. 2014, 62, 41–47. [Google Scholar] [CrossRef]
- Xia, X.; Zhang, A.; Liang, S.; Qi, Q.; Jiang, L.; Ye, Y. The association between air pollution and population health risk for respiratory infection: A case study of Shenzhen, China. Int. J. Environ. Res. Public Health 2017, 14, 950. [Google Scholar] [CrossRef] [PubMed] [Green Version]
- Shi, L. Local government dual-target management and environmental pollution: An empirical study based on Chinese urban data. Theor. Prac. Financ. Econ. 2022, 43, 104–113. [Google Scholar]
- Mac, A.; Rjre, B. Determining the trade–environment composition effect: The role of capital, labor and environmental regulations. J. Environ. Econ. Manag. 2003, 46, 363–383. [Google Scholar]
- Levinson, A. Environmental regulations and manufacturers’ location choices: Evidence from the census of manufactures. J. Public Econ. 1996, 62, 5–29. [Google Scholar] [CrossRef]
- Greenstone, M.; Hanna, R. Environmental regulations, air and water pollution, and infant mortality in India. Am. Econ. Rev. 2014, 104, 3038–3072. [Google Scholar] [CrossRef] [Green Version]
- Pavlyuk, O.; Noble, B.F.; Blakley, J.A.E.; Jaeger, J.A.G. Fragmentary provisions for uncertainty disclosure and consideration in ea legislation, regulations and guidelines and the need for improvement. Environ. Impact. Assess. 2017, 66, 14–23. [Google Scholar] [CrossRef]
- Du, W.; Li, M. Can environmental regulation promote the governance of excess capacity in china’s energy sector? The market exit of zombie enterprises. J. Clean. Prod. 2019, 207, 306–316. [Google Scholar] [CrossRef]
- Du, W.; Li, M. Influence of environmental regulation on promoting the low carbon transformation of China’s foreign trade: Based on the dual margin of export enterprise. J. Clean. Prod. 2019, 244, 11868. [Google Scholar] [CrossRef]
- Li, Y.; Zhao, T.; Wu, Y.; Ni, S. Environmental Regulation, Land Resource Misallocation and Environmental Pollution. Stat. Dec. 2022, 3, 71–76. [Google Scholar]
- Li, Z.; Zhang, M. Political Economic Analysis of China’s Regional Low-Carbon Competitiveness: Theory and Empirical Research. J. Financ. Econ. 2016, 42, 133–144. [Google Scholar]
- Li, X.; Ran, G. How does the development of digital finance affect the quality of technological innovation? Mod. Econ. Res. 2021, 9, 69–77. [Google Scholar]
- Lv, Y.; Gao, B. The direct impact of new urbanization on environmental pollution and spatial spillover: Taking 108 cities in the Yangtze River Economic Belt as Example. J. Dalian Univ. Technol. Soc. Sci. 2021, 42, 41–51. [Google Scholar]
- Chen, X.; Chen, Y.; Chang, C. The effects of environmental regulation and industrial structure on carbon dioxide emission: A nonlinear investigation. Environ. Sci. Pollut. Res. 2019, 26, 30252–30267. [Google Scholar] [CrossRef]
- Jalil, A.; Feridun, M. The impact of growth, energy and financial development on the environment in China: A cointegration analysis. Energy Econ. 2011, 33, 284–291. [Google Scholar] [CrossRef]
- Wang, D.; Li, J. Fiscal Decentralization, Technological Innovation and Environmental Pollution. Stat. Dec. 2021, 37, 131–135. [Google Scholar]
- Huang, T.; Zhao, X.; Chen, K. Technological Innovation, Environmental Pollution and Regulatory Policies: The Perspective of Transformational Innovation Policy. Sci. Sci. Manag. S T 2020, 41, 49–65. [Google Scholar]
- Wang, S.; Li, Q.; Fang, C.; Zhou, C. The relationship between economic growth, energy consumption, and CO2 emissions: Empirical evidence from China. Sci. Total Environ. 2016, 542, 360–371. [Google Scholar] [CrossRef]
- Lin, Y. Analysis of the synergistic effect of industrial agglomeration, resource misallocation and environmental governance. Ecol. Econ. 2022, 38, 204–210. [Google Scholar]
- Cai, F.; Li, Y. Analysis of the main influencing factors of environmental pollution in my country. Stat. Dec. 2014, 12, 123–126. [Google Scholar]
- Li, Q.; Ding, C. Environmental regulation, spatial spillover and industrial upgrading: Evidence from the Yangtze River Economic Zone. J. Chongqing Univ. 2018, 6, 17–28. [Google Scholar]
- Liang, W.; Yang, M. Urbanization, economic growth and environmental pollution: Evidence from China. Sustain. Comput. Inf. 2019, 21, 1–9. [Google Scholar] [CrossRef]
- He, X. The impact of urbanization on the quality of China’s economic growth: An analysis based on provincial panel data. Urban Probl. 2019, 1, 4–13. [Google Scholar]
- Eskeland, G.S.; Harrison, A.E. Moving to greener pastures? Multinationals and the pollution haven hypothesis. J. Dev. Econ. 2003, 70, 1–23. [Google Scholar] [CrossRef] [Green Version]
- Cole, M.A. 2004. Trade, the pollution haven hypothesis and the environmental Kuznets curve: Examining the linkages. Ecol. Econ. 2004, 48, 71–81. [Google Scholar] [CrossRef]
- Hoffmann, R.; Lee, C.G.; Ramasamy, B.; Yeung, M. FDI and pollution: A granger causality test using panel data. J. Int. Dev. 2005, 17, 311–317. [Google Scholar] [CrossRef]
- Pao, H.T.; Tsai, C.M. Multivariate Granger causality between CO2 emissions, energy consumption, FDI (foreign direct investment) and GDP (gross domestic product): Evidence from a panel of BRIC (Brazil, Russian Federation, India, and China) countries. Energy 2011, 36, 685–693. [Google Scholar] [CrossRef]
- Sun, Z.; Nie, W. The impact of fiscal information transparency on regional green innovation capacity under the carbon neutrality goal: Based on the dual perspectives of spatial spillover effect and threshold effect. Sci. Technol. Progr. Policy 2021, 38, 58–66. [Google Scholar]
- Palmer, K.; Krupnick, A.; Siegel, D.S. Social Costing in Electricity in Maryland: Effects of Pollution, Investment and Princes. Energy J. 1995, 16, 1–26. [Google Scholar] [CrossRef]
- Mondschein, V.S.; Schilkrut, A. Optimal Investment Policies for Pollution Control in the Copper Industry. Interfaces 1997, 27, 69–87. [Google Scholar] [CrossRef]
- Kingston, K. The Dilemma of Minerals Dependent Economy: The Case of Foreign Direct Investment and Pollution in Nigeria. Afr. J. Soc. Sci. 2011, 1, 1–14. [Google Scholar]
- Bernauer, T.; Koubi, V. Are bigger governments better providers of public goods? Evidence from air pollution. Public Choice 2013, 156, 593–609. [Google Scholar] [CrossRef] [Green Version]
- Halkos, G.E.; Paizanos, E.A. The effect of government expenditure on the environment: An empirical investigation. Ecol. Econ. 2013, 91, 48–56. [Google Scholar] [CrossRef]
- Lopez, R.; Palacios, A. Why has Europe Become Environmentally Cleaner? Decomposing the Roles of Fiscal, Trade and Environmental Policies. Environ. Resour. Econ. 2014, 58, 91–108. [Google Scholar] [CrossRef]
- Sun, H.; Zaenhal, D. The Impact of Heterogeneous Environmental Regulation on Urban Environmental Pollution: A Study Based on Static and Dynamic Spatial Durbin Models. East China. Econ. Manag. 2021, 35, 75–82. [Google Scholar]
- Ping, Z.; Wu, X.; Wu, X. Analysis of the Impact of Economic Growth on Industrial Pollution in the Yangtze River Economic Belt Based on Spatial Durbin Model of Geographic Distance Matrix. Ecol. Econ. 2019, 35, 161–167. [Google Scholar]
- Wang, H.; He, X. Can the opening of the service industry reduce the level of regional environmental pollution—Based on the perspective of spatial spillover effects. J. Southwest Minzu Univ. 2021, 42, 92–103. [Google Scholar]
- He, Z.; Cao, C.; Wang, J. Spatial Spillover Effect of Environmental Regulations and Industrial Agglomeration on Environmental Pollution. East China. Econ. Manag. 2022, 36, 12–23. [Google Scholar]
| Variable | Definition | Obs | Mean | Std. Dev. | Min | Max | Unit |
|---|---|---|---|---|---|---|---|
| lnpoll | environmental pollution | 270 | 3.671 | 1.272 | −1.573 | 6.202 | Ton |
| reg | environmental regulation | 270 | 0.030 | 0.010 | 0.003 | 0.068 | % |
| dfi | digital financial inclusion | 270 | 2.034 | 0.916 | 0.183 | 4.103 | -- |
| pgdp | regional economy | 270 | 5.455 | 2.633 | 1.641 | 16.422 | million |
| ind | industrial structure | 270 | 1.174 | 0.666 | 0.518 | 5.169 | % |
| tec | technological innovation | 270 | 5.214 | 7.607 | 0.050 | 52.739 | 10,000 pieces |
| pop | population size | 270 | 4562 | 2731 | 568 | 11521 | 10,000 people |
| edu | education level | 270 | 87 | 51 | 5 | 232 | 10,000 people |
| urb | urbanization level | 270 | 57.51 | 12.41 | 17.81 | 89.60 | % |
| fdi | actual use of foreign capital | 270 | 0.022 | 0.017 | 0.000 | 0.080 | % |
| fix | fixed asset investment | 270 | 0.794 | 0.256 | 0.210 | 1.480 | % |
| gov | level of government intervention | 270 | 0.249 | 0.103 | 0.110 | 0.628 | % |
| Year | Adjacency Distance Matrix | Economic Distance Matrix | ||||
|---|---|---|---|---|---|---|
| Moran’s I | Z Value | p Value | Moran’s I | Z Value | p Value | |
| 2011 | 0.460 | 4.146 | 0.000 | 0.302 | 3.205 | 0.001 |
| 2012 | 0.451 | 4.070 | 0.000 | 0.288 | 3.069 | 0.001 |
| 2013 | 0.458 | 4.117 | 0.000 | 0.278 | 2.966 | 0.002 |
| 2014 | 0.461 | 4.155 | 0.000 | 0.270 | 2.894 | 0.002 |
| 2015 | 0.470 | 4.272 | 0.000 | 0.268 | 2.908 | 0.002 |
| 2016 | 0.366 | 3.381 | 0.000 | 0.282 | 3.036 | 0.001 |
| 2017 | 0.381 | 3.576 | 0.000 | 0.304 | 3.306 | 0.000 |
| 2018 | 0.376 | 3.565 | 0.000 | 0.309 | 3.391 | 0.000 |
| 2019 | 0.371 | 3.533 | 0.000 | 0.276 | 3.070 | 0.001 |
| Test Based on Different Space Matrices | LR Statistic | Degrees of Freedom | p Value | |
|---|---|---|---|---|
| Calculated based on W1 | Spatial fixed effects | 92.89 | 30 | 0.0000 *** |
| time fixed effects | 309.92 | 9 | 0.0000 *** | |
| Calculated based on W2 | Spatial fixed effects | 102.80 | 30 | 0.0000 *** |
| time fixed effects | 354.70 | 9 | 0.0000 *** | |
| Hausman test | 0.0000 *** | |||
| Test Based on Different Space Matrices | SAR/SDM | SEM/SDM | |
|---|---|---|---|
| Calculated based on W1 | LR test | 33.84 (0.0000) *** | 46.64 (0.0000) *** |
| Wald test | 35.30 (0.0002) *** | 51.19 (0.0000) *** | |
| Calculated based on W2 | LR test | 44.91 (0.0001) *** | 41.28 (0.0000) *** |
| Wald test | 50.73 (0.0001) *** | 45.59 (0.0000) *** | |
| Variable | Adjacency Distance Matrix | Economic Distance Matrix | ||
|---|---|---|---|---|
| Model I | Model II | Model III | Model IV | |
| reg | −8.122 *** (−3.45) | −6.729 *** (−2.83) | −8.170 *** (−3.37) | −6.395 ** (−2.56) |
| dfi | −0.636 ** (−2.02) | −0.637 ** (−2.04) | −0.634 ** (−1.98) | −0.681 ** (−2.13) |
| reg × dfi | −4.128 ** (−2.24) | −4.487 ** (−2.44) | ||
| pgdp | −0.298 *** (−9.76) | −0.303 *** (−9.84) | −0.258 *** (−8.43) | −0.268 *** (−8.76) |
| ind | −0.023 (−0.18) | −0.028 (−0.23) | −0.018 (−0.16) | −0.040 (−0.34) |
| tec | 0.012 (1.21) | 0.015 (1.56) | 0.006 (0.63) | 0.014 (1.29) |
| pop | −0.000 (−0.75) | −0.000 (−0.99) | −0.001 * (−1.67) | −0.001 ** (−2.25) |
| edu | −0.008 *** (−3.00) | −0.009 *** (−3.43) | −0.003 (−1.18) | −0.004 (−1.53) |
| urb | 0.002 (0.24) | 0.003 (0.40) | 0.005 (0.86) | 0.005 (0.84) |
| fdi | −0.933 (−0.45) | 0.263 (0.13) | 0.441 (0.23) | 1.533 (0.78) |
| fix | 0.395 *** (2.79) | 0.441 *** (3.13) | 0.134 (1.02) | 0.189 (1.43) |
| gov | −4.219 *** (−3.75) | −3.971 *** (−3.57) | −0.461 (−0.45) | −0.826 (−0.79) |
| region | yes | yes | yes | yes |
| year | yes | yes | yes | yes |
| ρ | −0.343 *** (−3.54) | −0.322 *** (−3.34) | −0.423 *** (−4.36) | −0.402 *** (−4.05) |
| R2 | 0.832 | 0.839 | 0.833 | 0.8411 |
| Variable | Model I | Model II | ||||
|---|---|---|---|---|---|---|
| Direct Effect | Indirect Effect | Total Effect | Direct Effect | Indirect Effect | Total Effect | |
| reg | −9.732 *** (−4.15) | 16.701 *** (3.67) | 6.969 (1.48) | −8.019 *** (−3.37) | 13.953 *** (2.75) | 5.934 (1.15) |
| dfi | −0.632 * (−1.89) | 0.084 (0.16) | −0.548 (−1.03) | 0.634 * (−1.93) | 0.098 (0.20) | −0.536 (−1.01) |
| reg × dfi | −4.500 ** (−2.53) | 6.922 ** (2.30) | 2.422 (0.73) | |||
| pgdp | −0.296 *** (−9.86) | 0.010 (0.21) | −0.286 *** (−5.23) | −0.305 *** (−9.78) | 0.028 (0.56) | −0.277 *** (−4.88) |
| ind | −0.007 (−0.06) | −0.210 (−0.82) | −0.218 (−0.72) | −0.011 (−0.10) | −0.191 (−0.72) | −0.202 (−0.67) |
| tec | 0.009 (0.93) | 0.029 * (1.69) | 0.038 ** (2.25) | 0.014 (1.35) | 0.024 (1.37) | 0.037 ** (2.13) |
| pop | −0.000 (−0.79) | 0.000 (0.67) | 0.000 (0.19) | −0.000 (−1.06) | 0.001 (0.88) | 0.000 (0.19) |
| edu | −0.008 *** (−2.89) | −0.001 (−0.29) | −0.009 (−1.64) | −0.009 *** (−3.77) | 0.001 (0.12) | −0.008 (−1.55) |
| urb | 0.003 (0.45) | −0.014 (−1.39) | −0.012 (−1.11) | 0.004 (0.68) | −0.015 (−1.41) | −0.010 (−0.97) |
| fdi | −0.799 (−0.40) | −0.409 (−0.09) | −1.208 (−0.25) | 0.349 (0.17) | −0.970 (−0.23) | −0.621 (−0.13) |
| fix | 0.391 *** (2.68) | 0.060 (0.23) | 0.451 (1.54) | 0.440 *** (3.27) | −0.036 (−0.14) | 0.404 (1.34) |
| gov | −3.881 *** (−3.35) | −3.542 * (−1.83) | −7.424 *** (−3.28) | −3.642 *** (−3.28) | 3.306 * (−1.67) | −6.948 *** (−3.04) |
| Variable | East | Central | West | |||
|---|---|---|---|---|---|---|
| Model V | Model VI | Model VII | Mode VIII | Mode IX | Mode X | |
| reg | −9.453 ** (−2.37) | −2.548 (−0.61) | −3.994 (−1.23) | −3.120 (−0.95) | 6.832 (1.31) | 7.418 (1.43) |
| dfi | 0.245 (0.61) | −0.088 (−0.23) | −0.931 ** (−1.99) | −0.718 (−1.45) | −0.514 (−1.03) | −0.555 (−1.12) |
| reg × dfi | −10.693 *** (−3.60) | −1.109 (−0.22) | 4.736 (1.18) | |||
| control variable | yes | yes | yes | yes | yes | yes |
| region | yes | yes | yes | yes | yes | yes |
| year | yes | yes | yes | yes | yes | yes |
| ρ | −0.219 ** (−2.09) | −0.171 * (−1.66) | −0.217 * (−1.82) | −0.217 * (−1.82) | 0.595 *** (8.01) | 0.597 *** (7.88) |
| R2 | 0.7057 | 0.6961 | 0.7057 | 0.6961 | 0.9062 | 0.9089 |
| Variable | Environmental Regulation as the Threshold Variable | Digital Financial Inclusion as the Threshold Variable | ||
|---|---|---|---|---|
| Single Threshold | Double Threshold | Single Threshold | Double Threshold | |
| 95% confidence interval of single threshold estimation | 0.0529 (0.0506, 0.0532) | 0.0268 (0.0259, 0.0270) | 2.5678 (2.5447, 2.5817) | 2.3953 (2.3571, 2.3986) |
| 95% confidence interval of double threshold estimation | 0.0529 (0.0506, 0.0532) | 3.0991 (3.0972, 3.1085) | ||
| F-statistic | 25.22 | 8.73 | 47.86 | 9.96 |
| p-value | 0.0267 | 0.5200 | 0.0067 | 0.5167 |
| 10% critical value | 19.6237 | 29.0264 | 28.7940 | 18.3804 |
| 5% critical value | 23.4761 | 38.8505 | 32.8952 | 21.5814 |
| 1% critical value | 30.8864 | 54.5408 | 42.3800 | 32.8038 |
| Variable | Value | t-Value | Value | t-Value |
|---|---|---|---|---|
| pgdp | −0.3997 *** | −10.11 | −0.3933 *** | −13.08 |
| ind | −0.5671 *** | −3.63 | −0.3640 ** | −2.51 |
| tec | 0.0216 | 1.58 | 0.0265 ** | 2.08 |
| pop | −0.0011 ** | −2.13 | −0.0011 ** | −2.25 |
| edu | −0.0069 * | −1.91 | −0.0040 | −1.18 |
| urb | −0.0082 | −0.86 | −0.0053 | −0.62 |
| fdi | 2.9274 | 1.01 | 4.9833 * | 1.94 |
| fix | 0.5503 *** | 2.97 | 0.1264 | 0.73 |
| gov | −1.0037 | −0.67 | −1.9155 | −1.52 |
| Cons | 12.5471 *** | 5.52 | 12.1650 *** | 6.13 |
| reg ≤ 0.0529 | −0.0975 | −1.21 | ||
| reg > 0.0529 | −0.2939 *** | −3.1 | ||
| dfi ≤ 2.5678 | 0.0261 | 0.01 | ||
| dfi > 2.5678 | −13.5543 *** | −4 | ||
| R2 | 0.8644 | 0.8600 | ||
Publisher’s Note: MDPI stays neutral with regard to jurisdictional claims in published maps and institutional affiliations. |
© 2022 by the authors. Licensee MDPI, Basel, Switzerland. This article is an open access article distributed under the terms and conditions of the Creative Commons Attribution (CC BY) license (https://creativecommons.org/licenses/by/4.0/).
Share and Cite
Shi, F.; Ding, R.; Li, H.; Hao, S. Environmental Regulation, Digital Financial Inclusion, and Environmental Pollution: An Empirical Study Based on the Spatial Spillover Effect and Panel Threshold Effect. Sustainability 2022, 14, 6869. https://doi.org/10.3390/su14116869
Shi F, Ding R, Li H, Hao S. Environmental Regulation, Digital Financial Inclusion, and Environmental Pollution: An Empirical Study Based on the Spatial Spillover Effect and Panel Threshold Effect. Sustainability. 2022; 14(11):6869. https://doi.org/10.3390/su14116869
Chicago/Turabian StyleShi, Fenfen, Rijia Ding, Heqing Li, and Suli Hao. 2022. "Environmental Regulation, Digital Financial Inclusion, and Environmental Pollution: An Empirical Study Based on the Spatial Spillover Effect and Panel Threshold Effect" Sustainability 14, no. 11: 6869. https://doi.org/10.3390/su14116869
APA StyleShi, F., Ding, R., Li, H., & Hao, S. (2022). Environmental Regulation, Digital Financial Inclusion, and Environmental Pollution: An Empirical Study Based on the Spatial Spillover Effect and Panel Threshold Effect. Sustainability, 14(11), 6869. https://doi.org/10.3390/su14116869


