Article

Dynamic Versus Static Life Cycle Assessment of Energy Renovation for Residential Buildings

1
Department of Architecture, KU Leuven, Kasteelpark Arenberg 1 Box 2431, 3001 Leuven, Belgium
2
Molse Bouwmaatschappij, Social Housing Company, Bosveld 152, 2400 Mol, Belgium
3
Zonnige Kempen, Social Housing Company, Grote Markt 39, 2260 Westerlo, Belgium
*
Author to whom correspondence should be addressed.
Sustainability 2022, 14(11), 6838; https://doi.org/10.3390/su14116838
Submission received: 23 April 2022 / Revised: 26 May 2022 / Accepted: 30 May 2022 / Published: 2 June 2022

Abstract

:
Currently, a life cycle assessment is mostly used in a static way to assess the environmental impacts of the energy renovation of buildings. However, various aspects of energy renovation vary in time. This paper reports the development of a framework for a dynamic life cycle assessment and its application to assess the energy renovation of buildings. To investigate whether a dynamic approach leads to different decisions than a static approach, several renovation options of a residential house were compared. To identify the main drivers of the impact and to support decision-making for renovation, a shift of the reference study period—as defined in EN 15643-1 and EN 15978—is proposed (from construction to renovation). Interventions related to the energy renovation are modelled as current events, while interventions and processes that happen afterwards are modelled as future events, including dynamic parameters, considering changes in the operational energy use, changes in the energy mix, and future (cleaner) production processes. For a specific case study building, the dynamic approach resulted in a lower environmental impact than the static approach. However, the dynamic approach did not result in other renovation recommendations, except when a dynamic parameter for electricity production was included.

1. Introduction

In 1997, the Kyoto protocol [1] drew attention to the need to reduce greenhouse gas (GHG) emissions to mitigate climate change. In 2015, the Paris Agreement [2] renewed attention to climate change, i.e., to limit the increase in the global average temperature to below 2 °C. Moreover, in 2015, the United Nations adopted the 17 Sustainable Development Goals as part of the 2030 Agenda for Sustainable Development [3], broadening the scope from climate change to other environmental and societal problems, such as clean energy and responsible consumption and production. In past decades, public authorities and industrial sectors have come up with various initiatives to reduce climate change and our environmental impact(s) (EI). A report from the European Commission to the European Parliament on resource efficiency opportunities in the building sector [4] (p. 2) declares that “the construction and use of buildings in the European Union account for about half of the extracted materials and energy consumption … and generates about one third of all waste in Europe”. Households were responsible for 27.2% of the European energy consumption in 2017, which was a decrease of only 0.2% compared to 2007 [5]. Space heating was the main use of energy in households (64.1%) as well as the production of sanitary hot water (SHW) (14.8%) [5]. Given these numbers, the focus of renovation, to date, is on energy reduction.
To reduce residential energy consumption in Flanders, Belgium, a specific framework for renovation, the Renovation Pact [6], was set up in 2014. According to the Renovation Pact, more than 90,000 buildings should be renovated per year to the Nearly Zero Energy Building (NZEB) standard to achieve the policy goals by 2050 [7]. In addition to mitigating the energy use of buildings, a transition to more renewable energy sources is anticipated in electricity production [8]. Such electricity mix/energy source changes will clearly influence the life cycle EI of buildings.
A study by Röck et al. [9] on the embodied carbon of a set of residential buildings in Europe, compared with the Swiss SIA benchmark [10], showed that 20–50% of the life cycle GHG emissions of buildings were related to the manufacturing and processing of building materials. Therefore, the full life cycle of buildings should be studied to ensure that the overall impacts of buildings are reduced.

2. State-of-the-Art

A life cycle assessment (LCA) is an internationally accepted method used to assess the life cycle EI of buildings [11]. A review on the use of a LCA to assess sustainability [12] and, more specifically, to assess the environmental impacts of building renovation measures [13], showed that there are various methodological discussions ongoingly related to, amongst others, the system boundaries, functional unit definitions, life cycle inventory (LCI) method, and definition of the operational and end-of-life stages. Moreover, the literature review revealed that, to date, a LCA is mostly used in a static approach, i.e., assuming that the situation of today will be identical in the future. On the contrary, a building’s performance typically changes when the building is renovated due to changing characteristics and/or changes in user behaviour (e.g., improved airtightness, increase in average indoor temperature). In such a static approach, it is assumed that the impact of the production of building materials remains unchanged over time and that technology will not improve (e.g., the efficiency of the heating system). Although no specific data on the evolution of the EI of the production of construction materials are available, a decrease in the impact can be expected. Static approaches assume that the electricity mix remains unchanged through time, while important changes are expected [14,15]. To assess the effects of these changing parameters. a dynamic life cycle assessment (DLCA) is required. In a literature review on the dynamic variables for the DLCA of buildings, presented by Su et al. [16], eight building-related dynamic variables were discussed: occupants and behaviours, energy evolution, degradation of materials and devices, carbon absorption, expected service life of components and devices, temperature change, technological evolution, and waste recycling rates. Sohn et al. [17] defined three types of dynamism in LCA: dynamic process inventory, dynamic systems, and dynamic characterization. Pehnt [18] used a dynamic LCA to study changes in technology, more specifically, future renewable energy systems and proved that the inputs of finite energy resources and the GHG of renewable energy chains were low compared to conventional systems. Asdrubali et al. [19] found that the consequences of the decarbonisation of electricity production and grid-building interaction influence the DLCA results for an “all-electric” NZEB, while Reinert et al. [20] used DLCA to assess the environmental impacts of future German energy production. Collinge et al. [21] used DLCA to assess the global warming potential (GWP) impacts of dynamic electricity grid models and found that—for specific case studies—the static LCA approach underestimates the use phase impacts of a conventional green building and the benefits of an NZEB building. A literature review by Lueddeckens et al. [22], regarding the temporal issues in LCA, revealed that temporally differentiated LCI and time-dependent characterization improved the accuracy of LCA. Moreover, the authors highlighted that the length of the time horizon and discounting were still issues of discussion. The latter was likewise discussed by Janjua et al. [23], who studied the implications of the service life of materials and technical installations in residential buildings using LCA. Changes in the environmental systems were studied by Levasseur et al. [24], who developed time-dependent characterization factors for GWP, including the temporal profile of emissions. Additionally, Kendall [25] proposed that time-adjusted warming potentials include the year in which CO2 emissions occur. Shah [26], Lebailly [27], and Shimako [28] researched time-dependent characterization factors for other impact categories, respectively, photochemical oxidant formation, freshwater ecotoxicity, and toxicity.
This paper investigated how the life cycle EI of renovation measures could be better estimated considering changes over time. Hence, dynamic parameters linked to the consequences of renovation measures are studied in this paper, such as changes in the indoor temperature, airtightness, thermal performance of the building envelope, and type and efficiency of the heating system. In addition, some societal changes are considered, such as cleaner production of building materials and changes in the electricity mix. This paper attempted to further develop the framework of DLCA, to assess the renovation of residential buildings. Changes in the impact assessment method are out of the scope of this paper. In addition to studying the effects of these dynamic parameters, we investigated whether different decisions would be taken when these temporal changes were considered compared to static modelling.

3. Materials and Methods

International standards [29,30] note that a LCA should be carried out in four phases. In the first phase, the goal and scope of the LCA are defined, i.e., a description of the purpose of the LCA: what is studied and for what reason, and what is included in the assessment. The goal and scope also include the definition of the functional unit, describing which function is provided (what), the extent of the function (how much), the expected level of quality (how well), and the duration (how long). In the second phase, i.e., the life cycle inventory (LCI), all relevant data are collected. In phase three, the life cycle impact assessment (LCIA) is conducted. This is the actual calculation of the impact. In the final phase, the interpretation and the results of the LCIA are assessed; for example, the main drivers of the impact are identified, the completeness of the data is assessed, and sensitivity assessments are conducted. Often, more specific information (or the opposite—a lack of data) is found during the LCI or LCIA, leading to a refinement of the goal and scope, making LCA an iterative process.
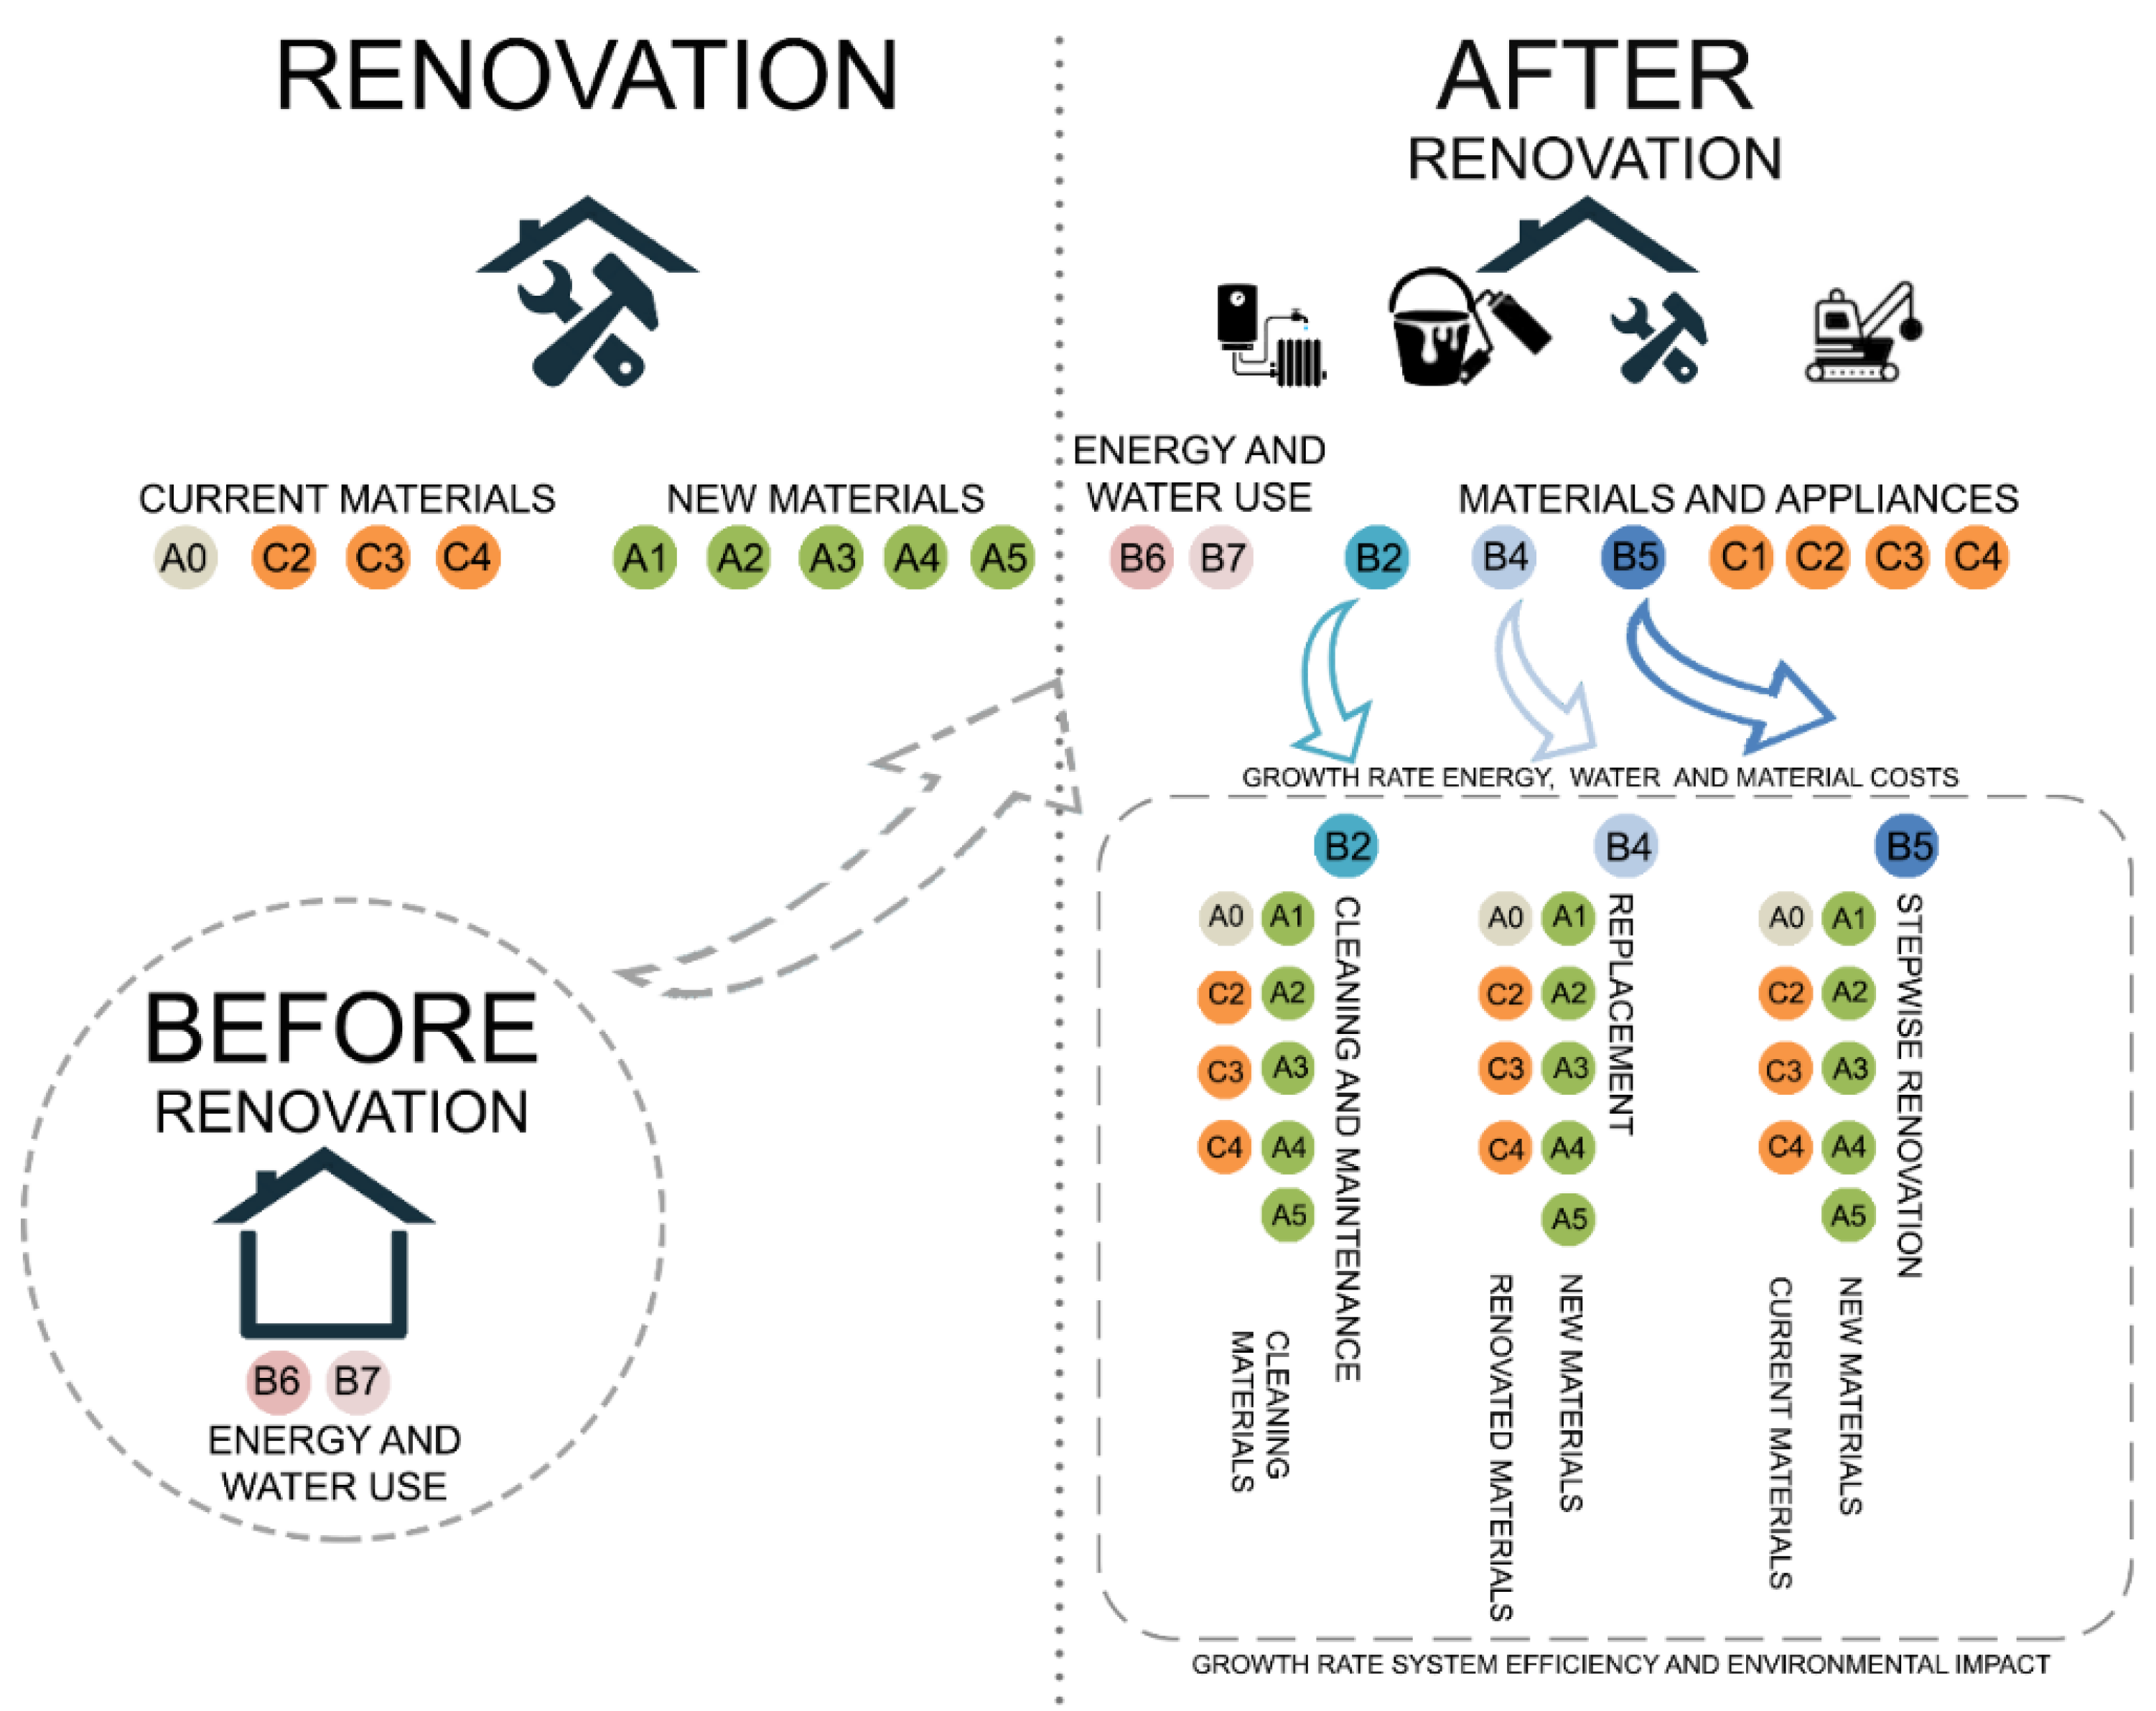
In this paper, the dynamic parameter effects on the environmental impacts of a low-cost energy renovation (insulating the cavity) and an in-depth NZEB renovation of a residential house (with a remaining service life of 60 years) were studied. The system boundaries are presented in Figure 1. Since this paper focuses on energy renovation, internal renovation of the building is out of our scope. Furthermore, preparatory activities (A0.2) and land purchase and transformation (A0.3) are not included in this paper as the focus is on the renovation of existing buildings. Furthermore, in line with the Belgian legislation [31], module D (recycling or reuse of materials at their EOL) is therefore not included in this research.
More details on the build-up of the existing building and the renovation measures studied are described in Section 4. For the inventory, the ecoinvent database version 3.6 [33] was used.
The environmental impact assessment was conducted via static and dynamic approaches. Before elaborating on the DLCA, first, the static LCA approach that was used as a comparative base is described in Section 3.1. The subsequent paragraphs describe the dynamic modellings of the various parameters, i.e., changes in operational energy use (Section 3.2.1), future (cleaner) production processes (Section 3.2.2), and changes in electricity mix (Section 3.2.3).
Section 5 compares the outcomes of both LCA approaches and identifies the differences in the results and decision making.

3.1. Description of the Life Cycle Assessment for Renovation Using a Static Approach

The static LCA approach used in this paper as the comparative base is the Belgian LCA method for buildings, i.e., the “Bepalingsmethode Milieugerelateerde Materiaalprestatie van Gebouwelementen” (“Environmental profile of building elements”), henceforth referred to as the static MMG method [34]. This MMG method is developed specifically for buildings and for the Belgian context. It uses generic inventory data harmonised for the Belgian context and includes the average Belgian scenarios, e.g., for transport to building sites, installations, maintenance, and end-of-life (EOL) treatments. The scenarios from the MMG method used in this paper are presented in the Supplementary Materials. The MMG method was translated into an online software tool, TOTEM (Tool to Optimise the Total EI of Materials, www.totem-building.be, accessed on 20 May 2022); it is widely used by designers in Belgium. The TOTEM tool and, hence, the underlying MMG method, are continuously being updated and extended. Version 2.2 was used for the analysis in this paper.
As mentioned by Habert et al. [35], it is important to look beyond the environmental impacts of GHG emissions to avoid burdens shifting to other environmental concerns [36], such as biodiversity loss, water scarcity, and resource depletion [37,38,39]. In line with the European standards EN 15978 [11], seven impact categories are considered as the “CEN” indicators. The impact categories were additionally requested in Belgian legislation [31]; the “CEN+” indicators are also considered. As the research on time-depending characterisation factors is limited to global warming [24,25], photochemical oxidant formation [26], freshwater ecotoxicity [27], and toxicity [28], and no methods are available that include time-depending characterisation factors for the other impact categories, we decided to neglect this issue for all impact categories.
To evaluate the importance of the 17 impact categories included in this paper, weighting was applied based on the monetary valuation of the EI [40], resulting in an aggregated single-score indicator, presented in Table 1. In line with Trigaux’s approach [41], no discounting was included for the environmental costs so that future environmental costs are equally valued as the present environmental costs, or as formulated by Allacker: “this is based on the idea that future generations have the same right to a good environment as the current generation” [42].
In the MMG method, different life cycle stages are considered, based on EN 15643-1 [43] and EN 15978 [11]. Life cycle stage B5 is reserved for renovation. This life cycle stage includes the production of new components of the building (including the production of all materials needed to assemble the component), transport of these new components (including the production of materials lost during transport), construction as part of the refurbishment process, waste management of the refurbishment process (for materials lost during the refurbishment), and the end-of-life of the substituted building components. The MMG method estimates the operational energy use for heating with the equivalent heating degree day (HDD) method [44,45]. As explained by Trigaux [41], the number of EHDDs takes into account how long (time) and how much (temperature) the building is heated, i.e., when the monthly average temperature of no more heating (TNH) is higher than the temperature without heating (TWH). The TWH is based on the insulation level of the building envelope (mean U-value), the ventilation rate, and the solar gains, while the TNH is based on the average indoor temperature and the heating gains from appliances and the people in the building. In MMG, the net energy use for sanitary hot water (SHW) is estimated based on the methodology proposed by PassivHaus Projektierungs Pakket (PHPP) [46], where default values for the consumption of domestic hot water, 25 l/person/day, the temperature of domestic hot water, 60 °C, and the temperature of domestic cold water, 10 °C, are assumed. The electricity used for lighting and appliances is assumed to be 3500 kWh, corresponding to the average EU electricity use per household [47].
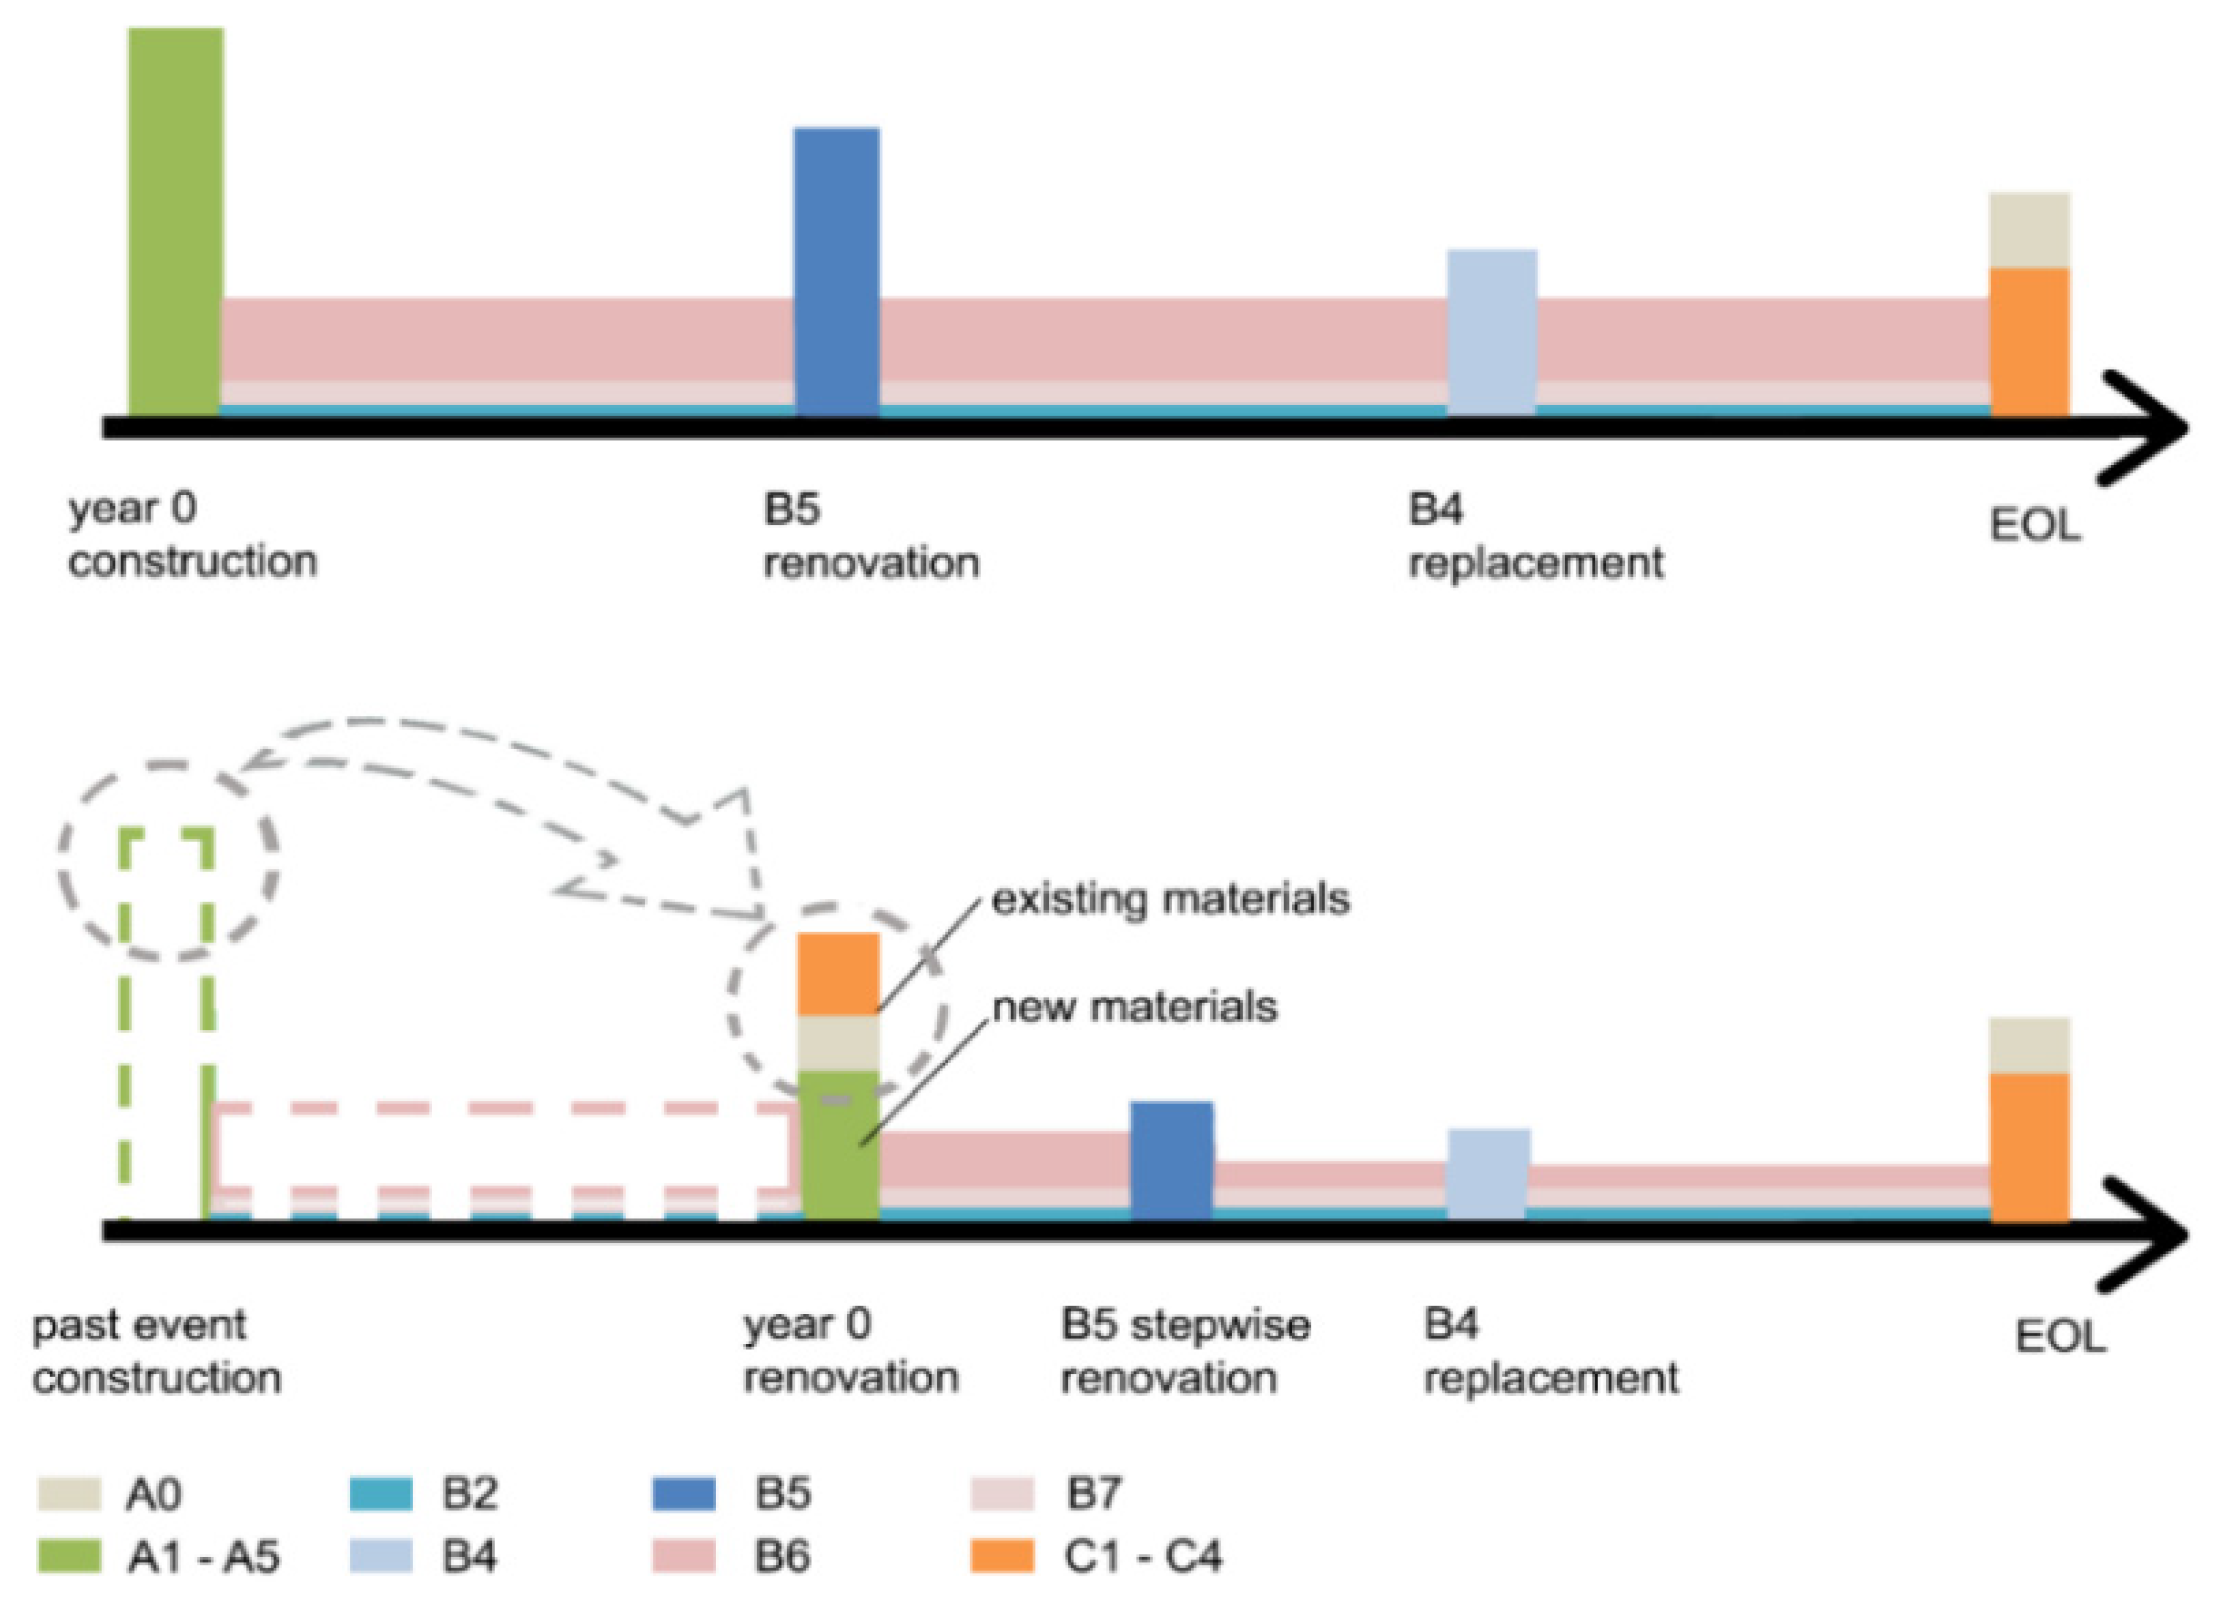
For the use of the MMG approach in the context of this research, some methodological choices were made. First, the functional unit is defined as a residential building with a service life of 60 years from the moment of renovation. Second, traditionally, an LCA assessment of the building starts at the moment of construction; however, as this paper focuses on renovation, a shift of the reference study period is proposed (to a later stage in the service life of the building), more specifically at the moment of renovation. At this moment, it is decided which building components are kept, improved, or dismantled and, hence, a more in-depth assessment of the renovation options and better identification of the hotspots of the renovation measures are possible. The reference study period and life cycle stages that are studied are presented in Figure 2 and Figure 3, respectively.
Figure 3 presents the different life cycle stages based on EN 15643-1 [43] and EN 15978 [11] (concerning where they occur in the renovation process). The timeframe “renovation” in Figure 2 covers the interventions related to the renovation of the building, while the timeframe “after renovation” includes all interventions and processes that occur during the period where residents are in the building after renovation and at the end of the service life of the building. Note that these events will happen in the future and, hence, for these, a dynamic alternative approach is discussed in the following sections. The timeframe “before renovation” is linked to the existing building before renovation. As this research focuses on renovation, the impact of the construction of the building is neglected. However, the energy use before the renovation is calculated as a basis for comparison (to estimate the reduction of energy use after renovation).
Third, at the time of renovation, no additional impact accounts for the building components that are preserved. If building components of the existing building are dismantled before the end of their service lives, a residual value (A0) is attributed. The residual value is added to the impact of the renovation, which is represented by the dashed grey arrow in Figure 3.
In Figure 3, similarly, a residual value is attributed at the end of the service life of the building for the materials that will be dismantled before the end of their service lives, accounting for the residual value being based on the principle of a circular economy, where a value, either financial or environmental, is linked to each material. In this perspective, the residual value can be seen as a penalty in case materials are demolished when they are still useful. The method used in this paper is based on the proposal by Trigaux [41] to calculate the residual EI based on a linear depreciation, linked to the remaining service life of the material, and in line with the method used for economic depreciation, as described in NBN EN 16627 [48].
Fourth, the materials to be replaced are assumed to be manually dismantled, so no dismantling (C1) impact is included in the renovation. For the transport of the waste (C2), waste processing (C3), and disposal (C4), the scenarios of the MMG method, included in the Supplementary Materials (Table S3), are assumed without changes [34]. Although it is expected that reuse and recycling rates will increase in the future, this is not included in this analysis, as, to date, the evolution is still unclear (conservative approach).
Fifth, for the new materials, the production (A1–A3), transport to the building site (A4), and construction, i.e., installation into the building (A5), are included. The scenarios presented in the MMG method for A4 are used and summarised in Table S1 together with the selected Ecoinvent records for the transport processes (Table S2). For life cycle stage A5, the default value of 5% installation waste, as described in the MMG method [34], is followed, except for technical installations and windows. Here, no installation waste is assumed.
Sixth, the timeframe “after renovation” includes the energy (B6) and water (B7) used for the newly renovated situation. As the impact of the water use (B7) is linked to the number of inhabitants, no changes are expected compared to the situation before the renovation; therefore, no water use is included in the calculations in this paper. As a result of the energy renovation, the energy use (B6) decreases after renovation; this is shown by the decreasing pink bar in Figure 3.
Seventh, the module referring to the impact of the release of substances to the indoor environment (B1) presented in the EU standards is not included in this research. Scenarios for maintenance are described in the MMG method [34]; however, as no changes in the maintenance are expected after a renovation, this life cycle stage is not included in this paper. Likewise, accidental damage or failure (B3) is not included in the assessment. For materials with a shorter service life than 60 years (i.e., the service life of the building after renovation), replacements (B4) are included. In this method, module B4 includes only the replacements necessary to guarantee the performance of the material, in line with the MMG method, a replacement of 10% of the finishing materials every 15 years is included [34]. Materials are replaced by identical materials, and no improvement of the element is assumed in stage B4. As shown in Figure 3, this means that no decrease in energy use is included after replacement. Note that the effect of cleaner production is included in the dynamic approach (see Section 3.2.2). In this paper, it is proposed to reserve module B5 for stepwise renovation, meaning renovation measures that occur in the future. As shown in the detailed frame in Figure 2, modules A0, A1–A5, and C2–C4 occur as part of life cycle stages B2, B4, and B5, identifying the production, transport, installation, and waste treatment of the materials needed for cleaning and maintenance, replacement, or future renovation. At the end of the service life of the building, the impacts for demolition (C1) and EOL treatments of the materials (C2–C4) are included.
Finally, the estimation of the energy use for heating was refined. Previous research on renovation showed that the energy savings of renovation measures were often overestimated due to an overestimation of the energy use in the existing building based on the EPB calculations compared to the actual energy use in residential housing [49,50], the so-called energy performance gap. The characteristics of the building [51,52], the estimated mean indoor temperature [50], the assumed climate data, and the behaviour of the users [53] can cause this performance gap [49].
To correctly assess the EI of renovation measures and to make the right decisions, it is important to reduce this performance gap. Therefore, for both the static and dynamic approaches, the net energy use for spatial heating was estimated with the EHDD method [44,45], in line with the MMG method, but with different values. In the static approach, a fixed value of 1200 EHDDs [34] is assumed, whereas in the dynamic approach, the number of EHDDs is calculated for each renovation option.
The net energy needed to produce SHW is not affected by renovation and, therefore, the same approach as in the static MMG method [34] is followed. In addition, the electricity use for appliances follows the MMG method (i.e., 3500 kWh/year is assumed).

3.2. Description of the Life Cycle Assessment for Renovation Using a Dynamic Approach

In Table 2, an overview of the parameters of the MMG method (for which a dynamic alternative is proposed in this paper) is summarised. Each parameter is described in more detail in the subsequent sections.

3.2.1. Dynamic Approach for the Estimation of the Operational Energy Use

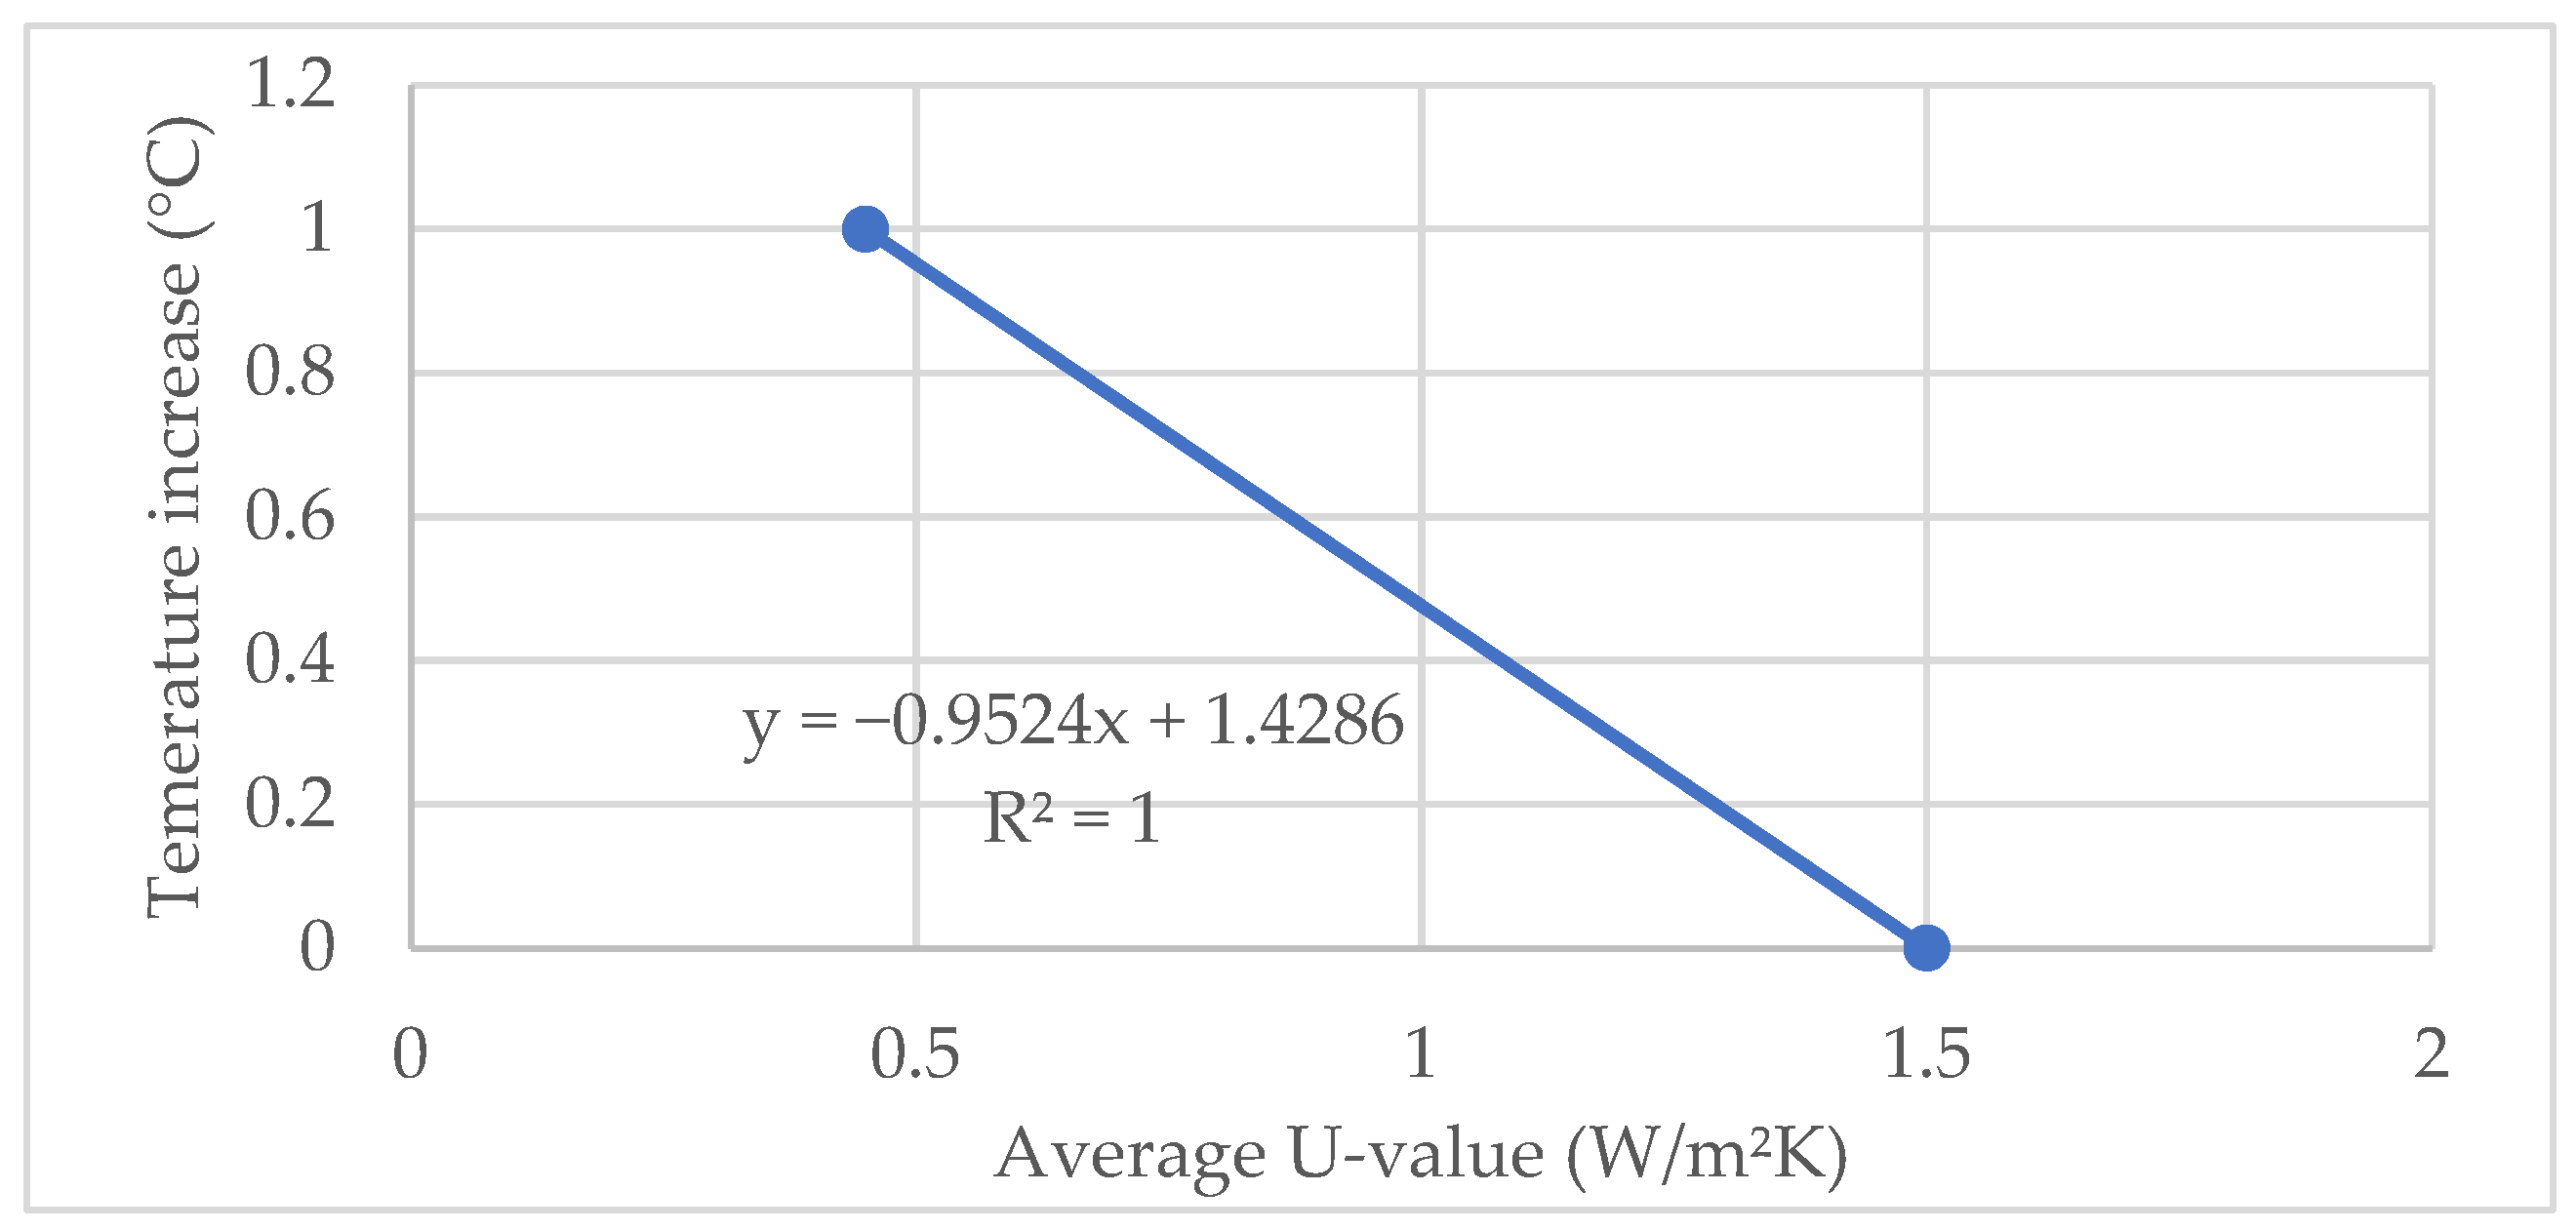
In the dynamic approach, the mean U-value, airtightness, and average indoor temperature are dynamic parameters, and they change after the renovation measures. The number of EHDDs in the dynamic approach will hence differ for each renovation option and before and after renovation. An important parameter to correctly estimate the number of EHDDs with the method proposed by “Diensten voor Programmatie van het Wetenschapsbeleid” (DPWB) [44,45] is the average indoor temperature. The default value for the average indoor temperature used in the energy performance of buildings directive (EPBD) method, 18 °C, has been questioned in recent studies [49,54]. Based on the findings in a Flemish research project (where renovation of both private and social housing was studied), an average indoor temperature of 16.7 °C for the protected volume of the building before the renovation was found [55]. In the dynamic approach in this paper, the number of EHDDs and corresponding energy used for heating were calculated assuming average indoor temperatures of 18 °C, 16 °C, and 14 °C for the case study building (see Section 5.1). In addition, the average indoor temperature typically changed after renovation. In line with the findings by Deurinck et al. [52], who reported an increase in the indoor temperature after renovation due to warmer unheated zones and a smaller temperature drop between two heating periods, an increase of 1 °C for the average indoor temperature after a thorough renovation was assumed in the dynamic approach. To estimate the increase in the indoor temperature for less deep renovations, a linear correlation between the average U-value of the building envelope and the temperature increase is proposed in this paper. Formula (1) is based on a 1 °C increase after a theoretical NZEB renovation with an estimated default average U-value of the building envelope of 0.45 W/m2K and no increase in the indoor temperature for a non-renovated building with an average U-value of the building envelope of 1.5 W/m2K, as presented in Figure 4.
Δ t = 0.9524 × U m + 1.4286
Recent studies found an even higher increase in the average indoor temperature after renovation due to changes in user behaviour [55,56]. As the effects of changes in user behaviour were still uncertain (concerning the higher increase in indoor temperatures), a sensitivity analysis was conducted, with an additional increase of 1 °C (so, in total, 2 °C) after renovation.
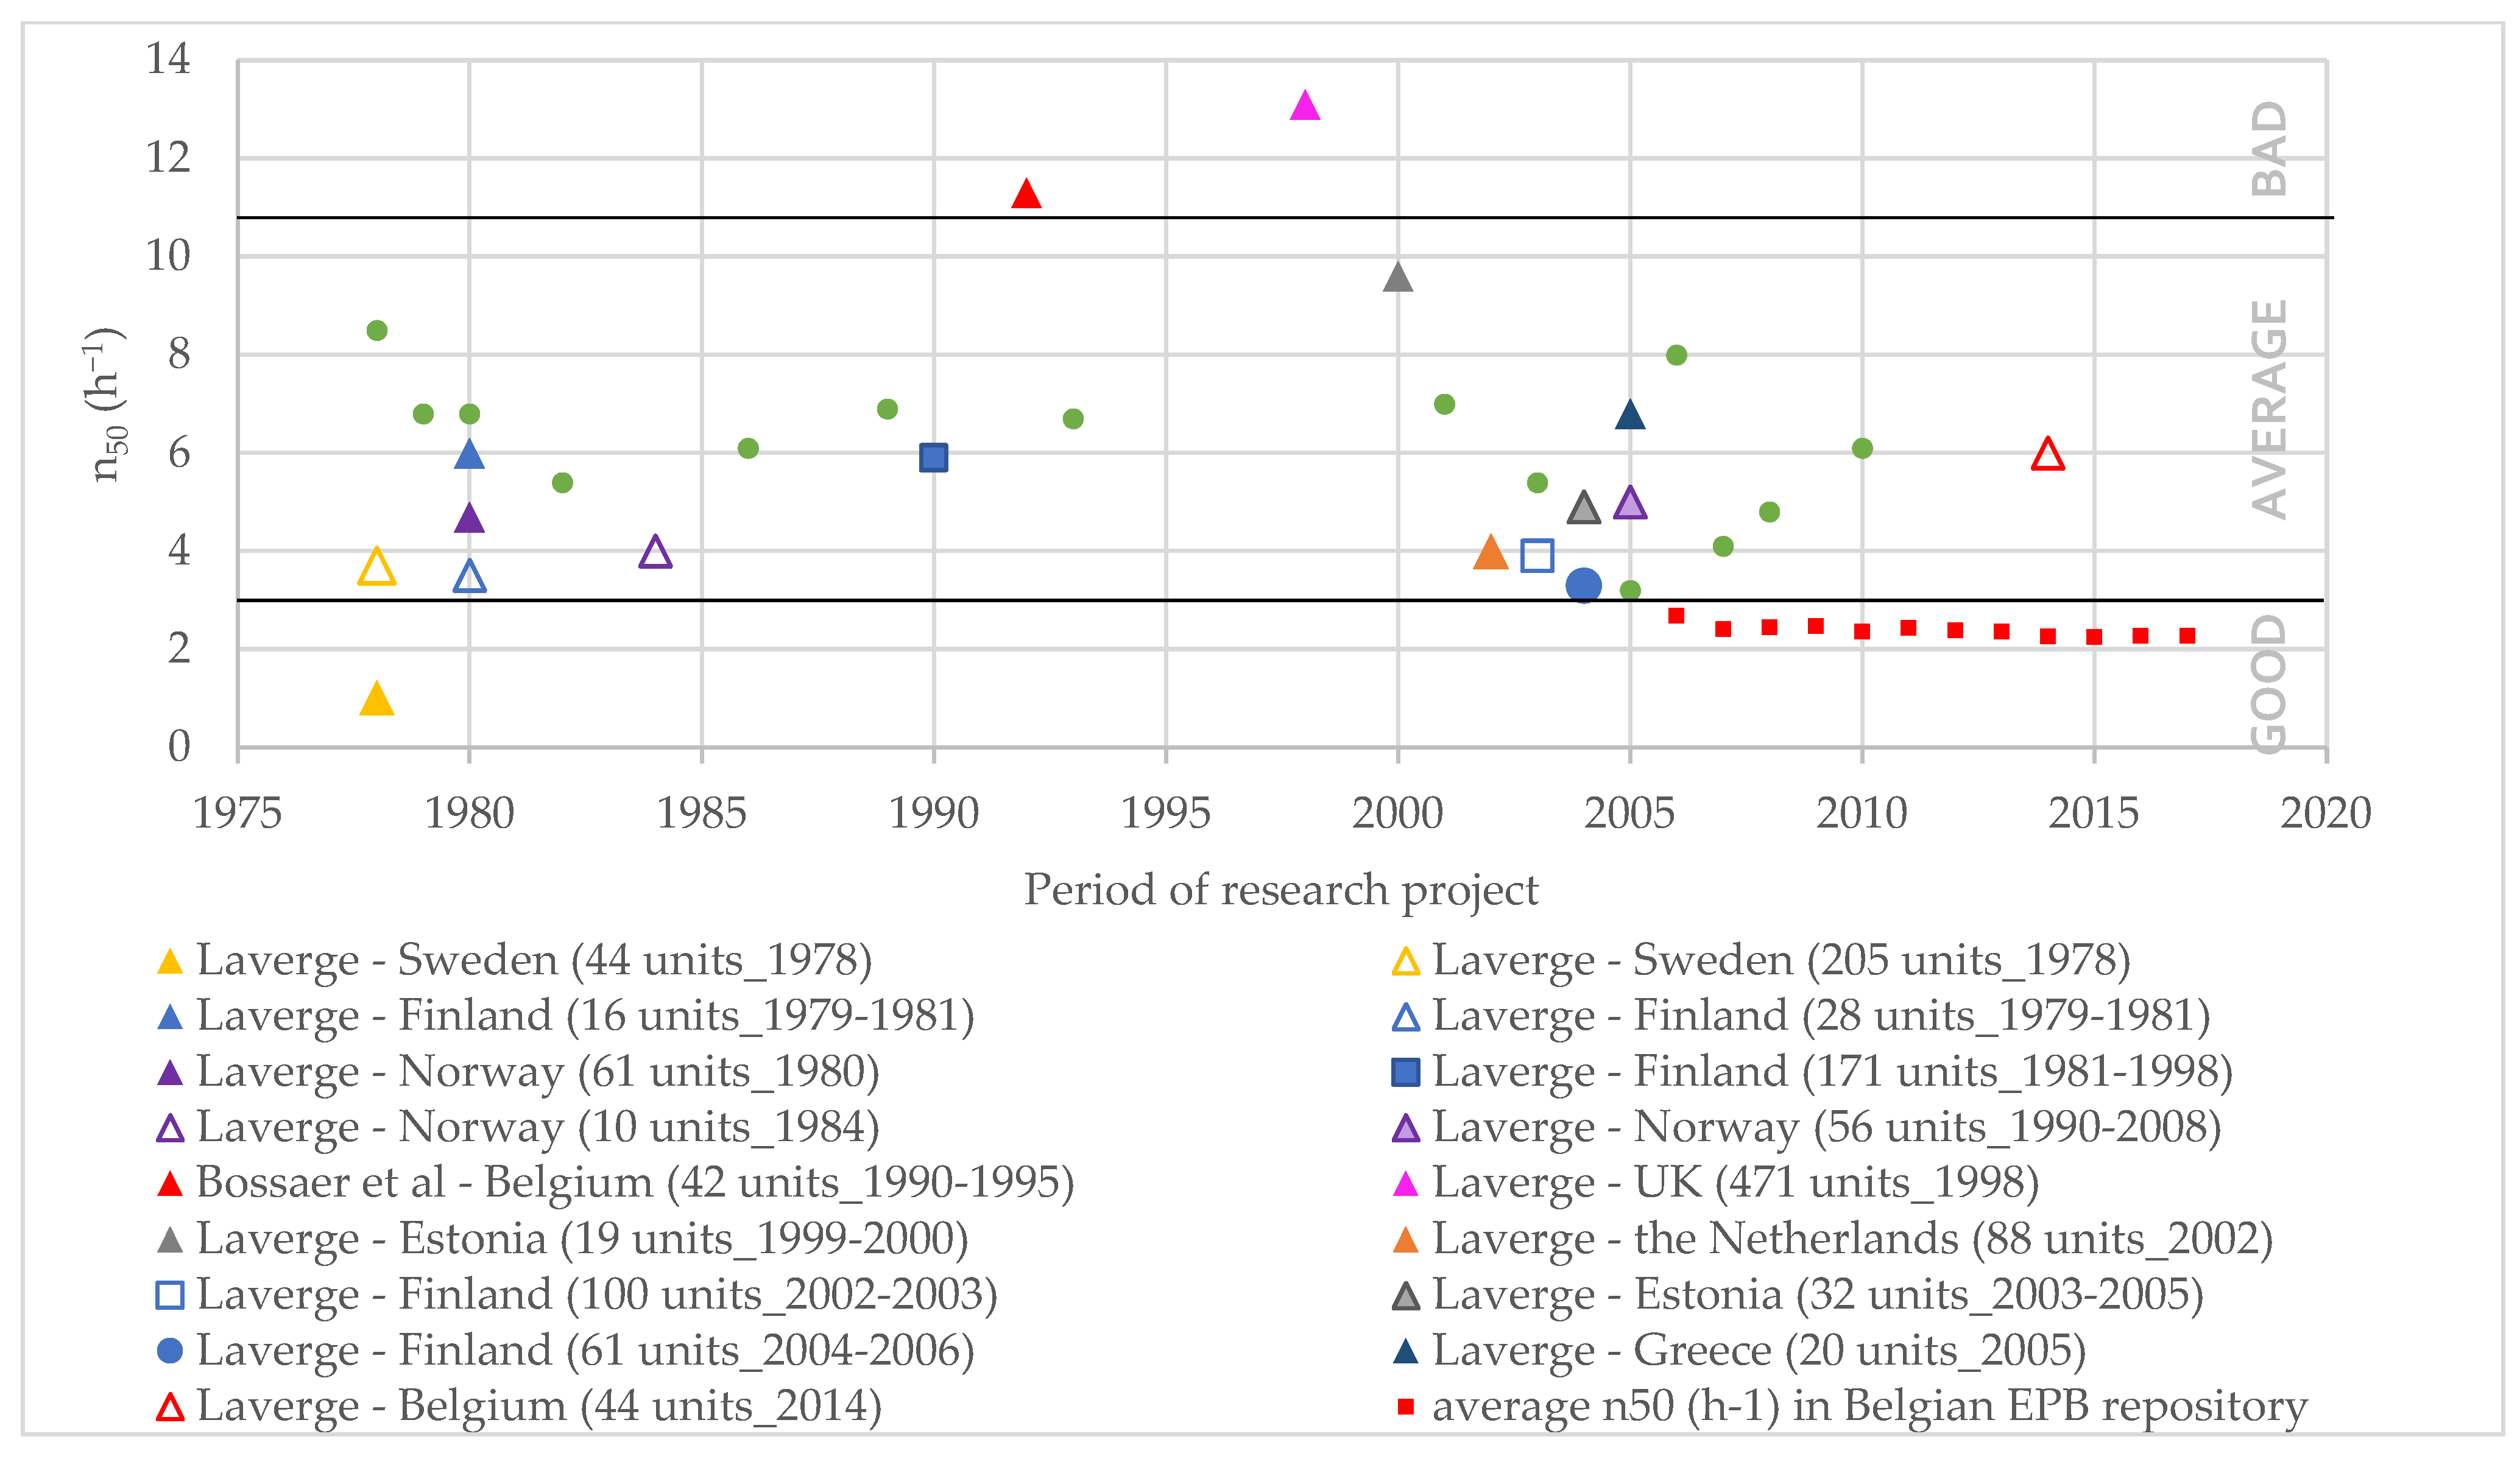
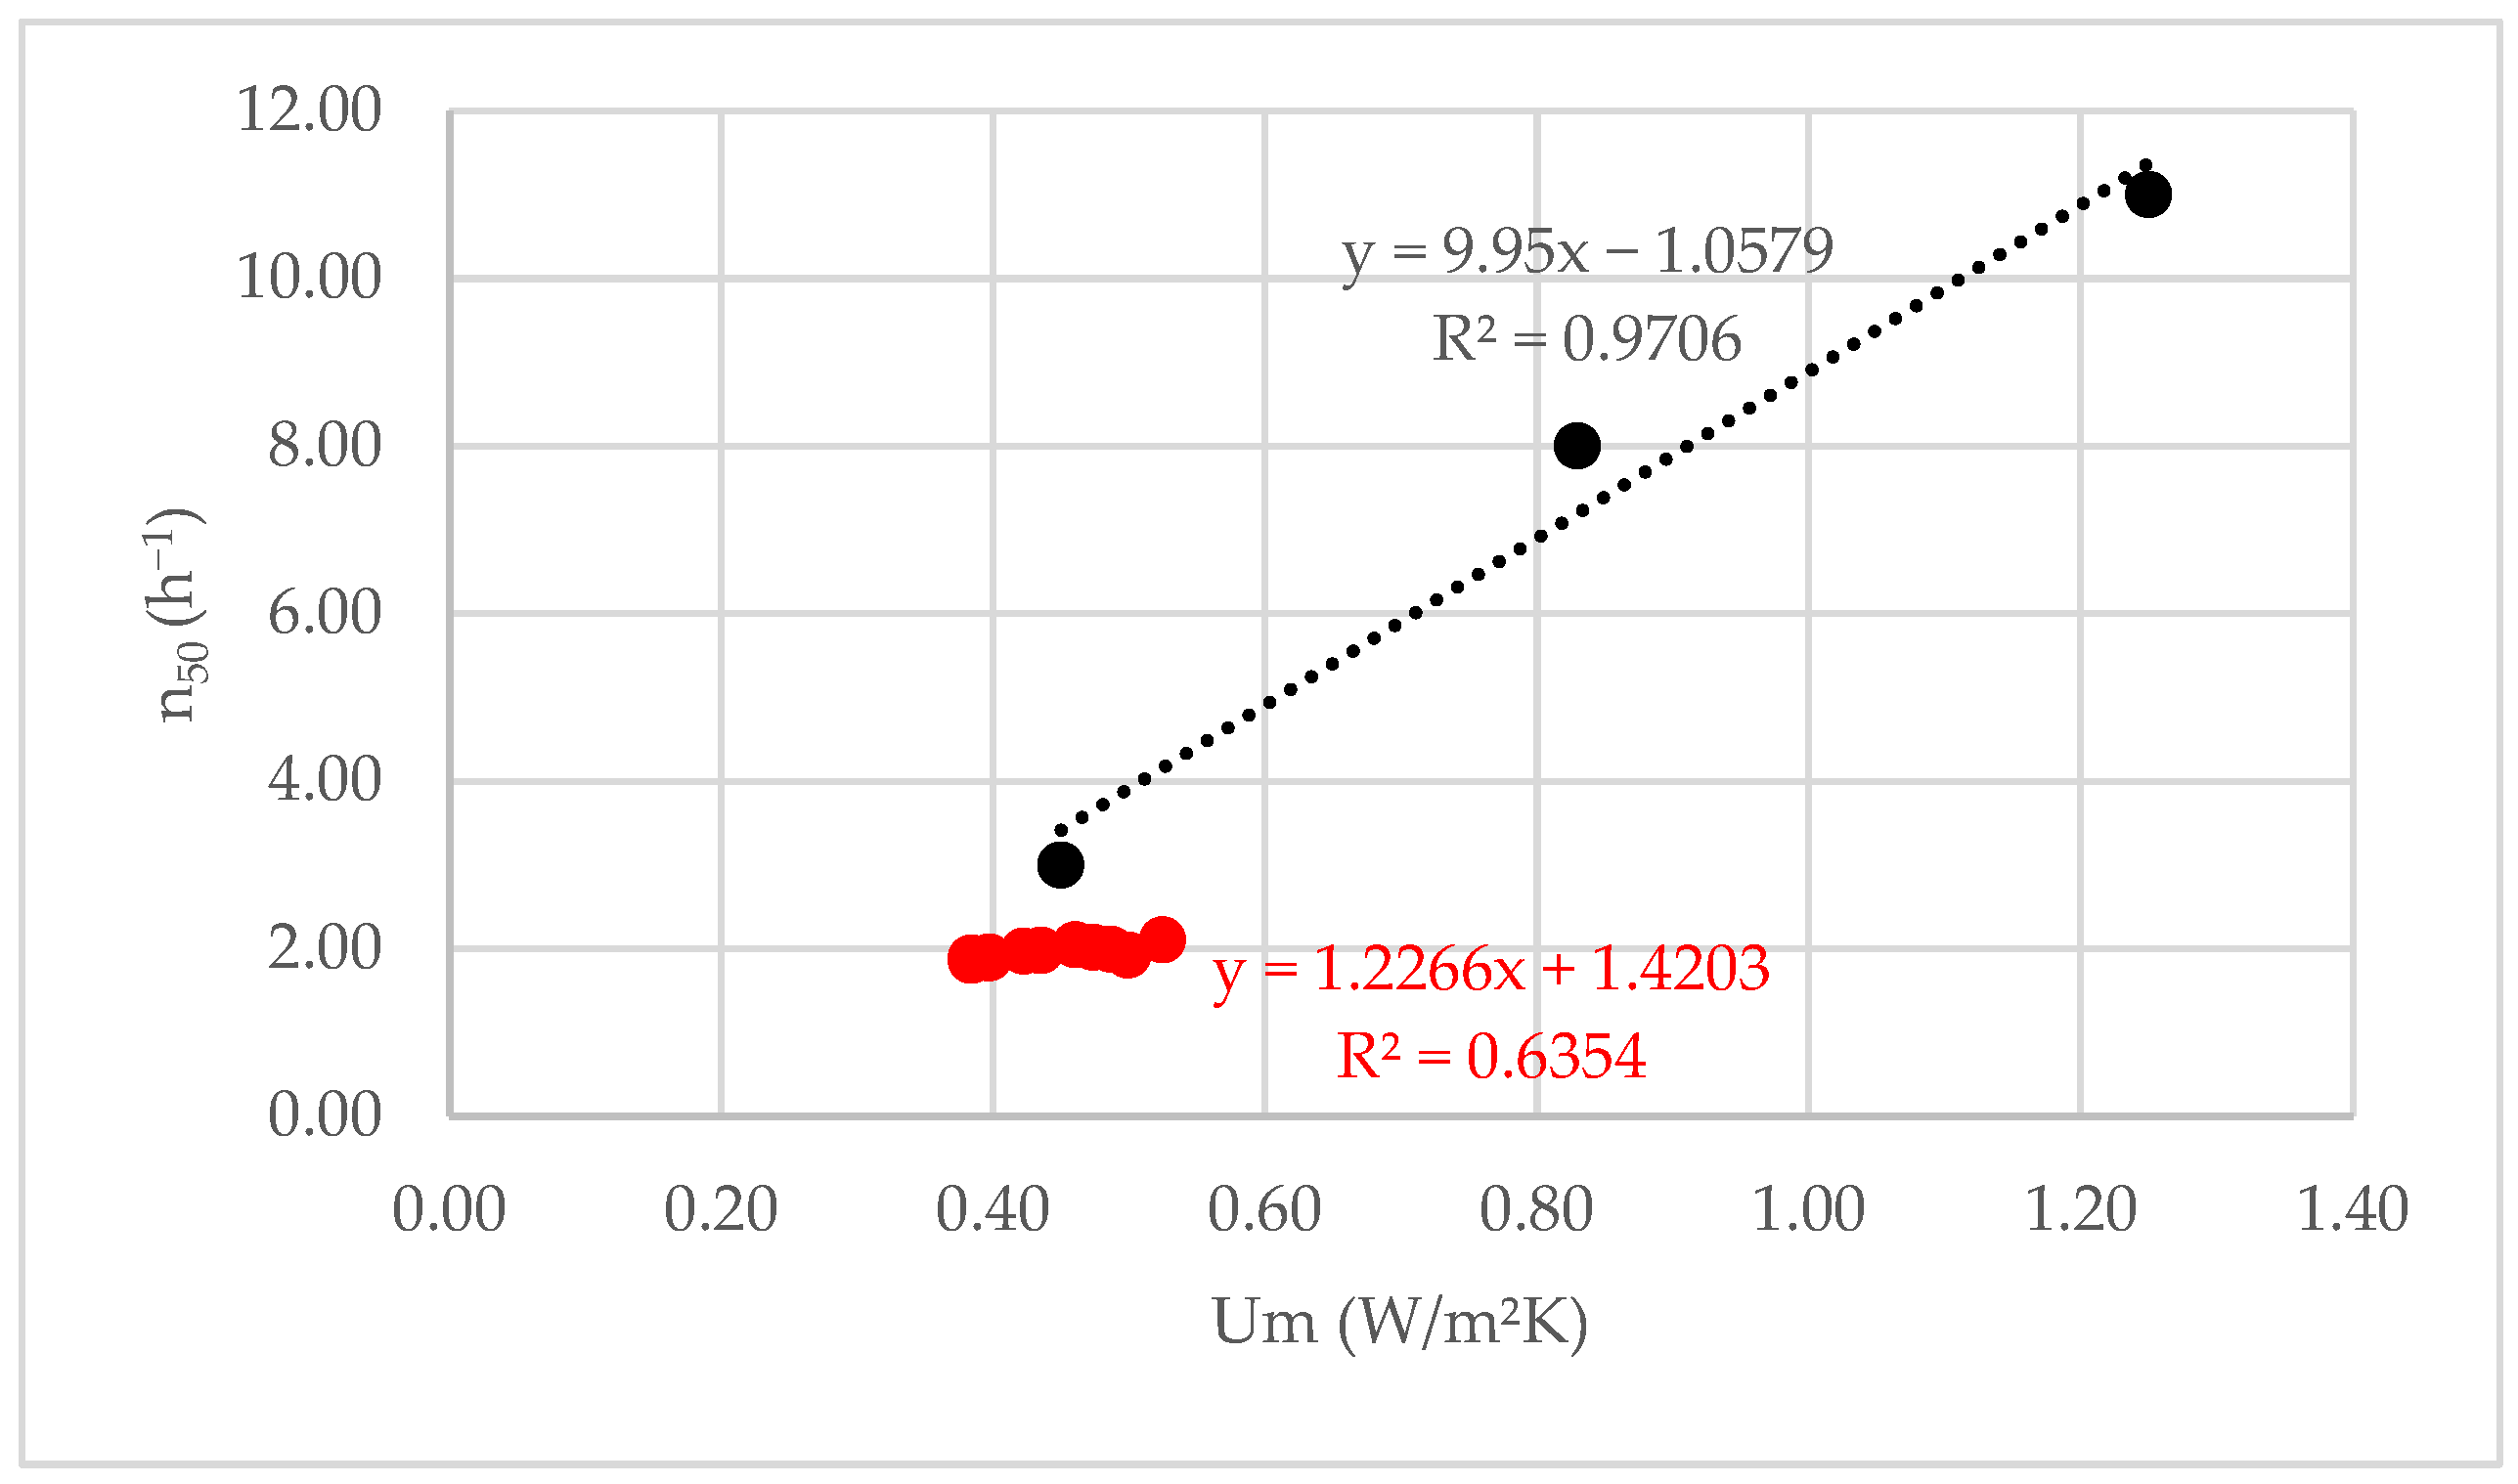
Furthermore, the airtightness of a building is an important parameter influencing heat loss through in- and ex-filtrations. As airtightness is a characteristic of a building’s envelope, it can change due to the renovation measures [57]. Research is being conducted to predict airtightness improvement after renovation [58]. Airtightness data from 16 European surveys on the mean air change rate at 50 Pa and n50 values, mentioned in research conducted by Laverge [59], are presented in Figure 5 together with the results of the research by Alfano et al. [60] and data from the Belgian EPB repository [61]. In the research by Laverge et al. [59], an overview of airtightness levels reported in European surveys is presented for different numbers of cases and different time spans (per country). In Figure 5, the average airtightness levels (per country) reported in the paper by Laverge et al. [59] are presented by the coloured triangles. The green circles present the results reported by Alfano et al. [60], i.e., 20 units in Southern Italy with different years of construction; the red squares represent the average n50 values based on data in the Belgian EPB repository [61]. As in the Belgian EPB repository, only v50 values are required as input for EPB calculations [62], the v50 values are converted to n50 values based on the average value for heated volume and the heat loss surface available in the EPB repository. Based on these data, a differentiation in three categories is proposed: good (n50 < 3 h−1), average (3 ≤ n50 < 11 h−1), and bad (n50 ≥ 11 h−1) airtightness.
As the EPBD does not require performing a blower door test to measure the airtightness, Laverge assumes that the values reported in the Belgian EPB repository correspond with what Laverge refers to as the ‘engaged’ market, i.e., “dwellings that aspire to reach a very good energy performance level” [59] (p. 380). By following this reasoning, it could be possible that buildings with better insulating envelopes have better airtightness, but that is not necessarily the case. To study this assumption, data from the Belgian EPB repository [61] were further analysed to find possible links between the characteristics of the building envelope and the airtightness of the building. In Figure 6, an overview of the average U-value and n50 values for terraced houses in the EPB repository [61] are presented with red dots. A slight decrease in the U-values and airtightness was observed over time. Additionally, data from our own measurements in social housing were added to Figure 6, presented by black dots. The proposed average U-value (1.12 W/m2K) and n50 value (11 h−1) are based on existing social housing projects constructed around 1980 (as the worst case). Although a default v50 value of 12 m3/hm2 (converted to an average n50 value of 7.5 h−1 based on the average value for the heated volume and heat loss surface available in the EPB repository) is proposed in the Belgian EPB method, on-site measurements indicate that the airtightness of old-, non-, or poorly insulated buildings are even worse. These findings are supported by the results of a Flemish research project, where the renovations of both private and social housing were studied [55]. The same research project reported relatively high values for airtightness after renovation. For that reason, in the best-case scenario, an average theoretical U-value (0.45 W/m2K) and n50 value (3 h−1) for an NZEB renovation were assumed (Figure 6). Our own in-situ measurements in social housing buildings constructed in 2000, with an average U-value of 0.83 W/m2K, showed an n50 value of 8 h−1, also presented in Figure 6.
In the static method, the airtightness remains unchanged after renovation and is assumed to correspond with the default v50 value of 12 m3/hm2 in EPBD [62]. In the dynamic approach, an attempt to link improved airtightness to an improved average U-value of the building envelope after renovation is proposed. For the lower U-values, Um < 0.55 W/m2K, the formula describing the linear correlation between the data in the EPBD repository (2) presented in Figure 6 is used. For the higher U-values, Um ≥ 0.55 W/m2K, the formula describing the linear correlation between the data from existing social housing (3) presented in Figure 6 is used.
n 50 = 1.2266 × U m + 1.4203
n 50 = 9.95 × U m 1.0579
Finally, the efficiency of the heating system is important to estimate the gross energy use for space heating and the production of SHW. As the efficiencies of heating systems are expected to increase in the future [18], this was considered in the dynamic approach when replacing the boilers. The FPB estimates a 32% increase in the efficiency of lighting and appliances by 2050 compared to 2015 [14], corresponding with a yearly accumulative growth rate of 0.796%. Van de moortel [63] proposed a 0.5% yearly growth rate for the efficiency of boilers, based on historical data. As the efficiency of condensing gas boilers is assumed to stabilise in the future, a conservative growth rate of 0.5% for the full heating system (i.e., a combination of the efficiency of the heat production, storage, transport, and emission) is assumed in this paper for heating systems with a condensing gas boiler. On the contrary, it can be expected that the technology of heat pumps will further evolve; therefore, a growth rate of 0.796% is assumed for a heating system with a heat pump.

3.2.2. Cleaner Production

Collinge et al. [64] mentioned that there was a lack of data on industrial processes, and they included changes in the energy mix for the production phase as a dynamic parameter. In a discussion forum summary on future technologies [65], it was stated that although LCA is seen as a good method to evaluate the EI of future technologies, harmonised data on future technological and economic development scenarios are still missing. To address the lack of data on sustainable production processes, Ferrari et al. [66] proposed a data monitoring system to collect manufacturing information that could be used as a basis for making LCI dynamic in the future. As no data on the technological progress and cleaner production in Europe are available at this point, a conservative approach was followed in this paper, assuming a growth rate of −0.1% on the EI of the production process. The dynamic parameter influences the life cycle stages B4 and B5 where future replacements are anticipated. Although improvements in transport and EOL treatments of materials are also expected, the scenarios for these life cycle stages are kept unchanged throughout the building service life.

3.2.3. Changes in Electricity Mix

To estimate the impacts of changes in the Belgian electricity mix, the work by Ramon and Allacker [67], based on the energy production forecasts of the FPB [15,68], was used in this paper. In their latest publication on the Belgian energy, transport, and emission projections under the unchanged policy, the FPB stated that more efforts are needed to fulfil the EU targets for 2030 and 2050 [15]. In another study of the FPB, researchers analysed alternative policy scenarios needed to achieve the EU targets [68]. In a recent study by Ramon and Allacker [67], the EI was calculated for three policy scenarios presented by the FPB: the business as usual (BAU) scenario with 60% gas-based and 40% renewable energy source (RES)-based electricity production, the 2030 target scenario with 40% gas-based and 60% RES-based electricity production, and a 1.5 °C target scenario with 16% gas-based and 84% RES-based electricity production. Ramon and Allacker [67] assumed a linear transition among defined electricity mixes for 2020, 2030, 2040, and 2050. After 2050, they assumed a fixed supply mix until 2080, as no data on the supply mix are available for that period. The yearly EI of the Belgian electricity mix, with the BAU scenario as a worst-case scenario and the 1.5 °C target scenario as a best-case scenario, estimated by Ramon and Allacker [67], was used in this paper to replace the current Belgian electricity mix, to estimate the effects of changes in the electricity mix on the EI for different renovation options.

4. Description of the Case Study and the Renovation Options

The case study involved a terraced family house of two floors with three bedrooms for four people, located in the Egelsvennen neighbourhood in Mol, Belgium. The surface and composition of the building elements resulted in an average U-value of the building envelope of 1.24 W/m2K (presented in Table 3). The building was constructed in 1974, and the roof and windows were renovated, respectively, in 1988 and 2006. Despite these renovations, the energy performance certificate (EPC) score of the house is still high: 300–400 kWh/(m2*y). Based on measured consumption data from 2015 to 2018, it was found that the average use of natural gas for the heating and production of SHW was 18,735 kWh per year (i.e., 167 kWh/m2*y), while the average electricity use was 2343 kWh per year [69]. The gas use of the case study building was higher than the average gas use of households in Flanders over the past ten years (15,177 kWh per year), while the electricity used was lower than the average electricity use of households in Flanders, i.e., 3620 kWh per year [47].
Currently, no ventilation system is installed besides exhaust units in the bathroom and the kitchen. The current heat production system consists of a condensing gas boiler with radiators and an overall system efficiency of 78%. The case study building is oriented to the north and the south. The solar gains for the windows on the south facade (5.59 m2) and the north facade (5.08 m2) were estimated with the EPBD method [62] and no obstructions were assumed. The estimated solar gains are presented in Table 4. A default g-value of 0.75 is assumed for the glazing.
As mentioned before, a default service life of 60 years after renovation is assumed [34], and the service lives of materials, elements, and appliances are based on the literature [70]. The build-ups for the NZEB renovation of all elements of the building envelope are presented in Table 5. For the floor and the windows, the dismantling and EOL treatment of the replaced materials are included. For the wall and flat roof, it is assumed that the existing element is completely preserved. The average U-value of the case study building envelope after the NZEB renovation was 0.40 W/m2K and for airtightness, a mean air change rate at 50 Pa of 1.91 h−1 was estimated based on Formula (2). For the low-cost renovation option, 6 cm of mineral wool with a lambda value of 0.04 W/mK was blown in the cavity wall, resulting in an average U-value of the building envelope of 1.04 W/m2K. A mean air change rate at 50 Pa of 9.29 h−1 was assumed after the low-cost renovation option. It was assumed that in all options that were modelled (i.e., no renovation, low-cost renovation, and NZEB renovation), the existing gas boiler was replaced by a condensing gas boiler with a service life of 20 years, resulting in an 84% system efficiency. Natural in- and exhaust were applied for ventilation and no renewable energy was installed. To cover changes in the energy sources for heating, i.e., a phase-out scenario for natural gas in 2050, the last replacement of the heating system before 2050, i.e., in year 20, is modelled with a heat pump as a sensitivity analysis. A heat pump with a COP of 3.6, resulting in a seasonal performance factor (SPF) of 2.86 [71], is assumed in this paper.

5. Results

In this section, we present the results of a stepwise renovation, within year 1, the replacement of the heating system, and in year 5, a renovation of the building envelope.

5.1. Energy Use

The energy use, both in the static and in the dynamic approach, was estimated with the EHDD method. In the static MMG method, the number of EHDDs was fixed to 1200 and remained unchanged before and after renovation, while in the dynamic method, the number of EHDDs was adapted after renovation. In Table 6, the EHDDs for the case study building are shown for a range of U-values and average indoor temperatures. To calculate the number of EHDDs, the n50 values corresponding to the presented U-values, estimated with the formulas presented in Section 3.2.1, were assumed. The results in Table 6 show that a reduction of the average U-value had an important effect on the number of EHDDs, but the indoor temperature seemed to have an even higher impact. For example, for an existing building with an average U-value of 1.24 W/m2K and an average indoor temperature of 18 °C, 2139 EHDDs are assumed. After renovation, the average U-value of the building reduced to 0.40 W/m2K, decreasing the number of EHDDs to 1514. However, when the average indoor temperature increased to 21 °C after renovation due to changes in the user behaviour, the number of EHDDs increased to 2179, which is 2% higher than the initial number of EHDDs. This shows that changes in user behaviour could offset the benefits of the renovation and are important when assessing renovation strategies. However, as this case study building is a social housing unit, a high turnover of tenants is expected. For that reason, only an increase in the indoor temperature after renovation with a maximum of 1 °C is included, in line with the findings by Deurinck et al. [52].
Figure 7 shows how assumptions on the indoor temperature, the thermal resistance of the building envelope, and airtightness affect the number of EHDD after an NZEB renovation for the case study building. The full blue bars represent the numbers of EHDDs for the existing building with an average indoor temperature of 18 °C. Changing the airtightness after renovation (from 11 to 1.91 h−1), represented by the dark blue bars in the graph, decreases the number of EHDDs by 3%, from 2139 to 2084. Changing the U-value of the building envelope after renovation (from 1.24 to 0.40 W/m2K) has a bigger effect and reduces the number of EHDDs from 2139 to 1681, a decrease of 21%. A combination of a reduced airtightness and U-value results in a decrease in the number of EHDDs by 29%. Adding 1 °C to the average indoor temperature after renovation, from 18 °C to 19 °C, and additionally to the changes in the thermal resistance of the building envelope and airtightness, results in a decrease in the number of EHDDs (1726 EHDD) by 19% compared to the situation before renovation. A similar analysis was done for average indoor temperatures of 16 °C and 14 °C, presented by the red and grey bars in the graph. Although the total number of EHDDs was smaller compared to the indoor temperature of 18 °C, the effects of the dynamic parameters for airtightness and the U-value remain similar. The results reveal that variations in the average indoor temperature and average U-value of the building envelope have important impacts on the estimation of the number of EHDDs (and, hence, operational energy use). Although a dynamic parameter for better airtightness after renovation seems less important, it is included in further calculations presented in this paper.
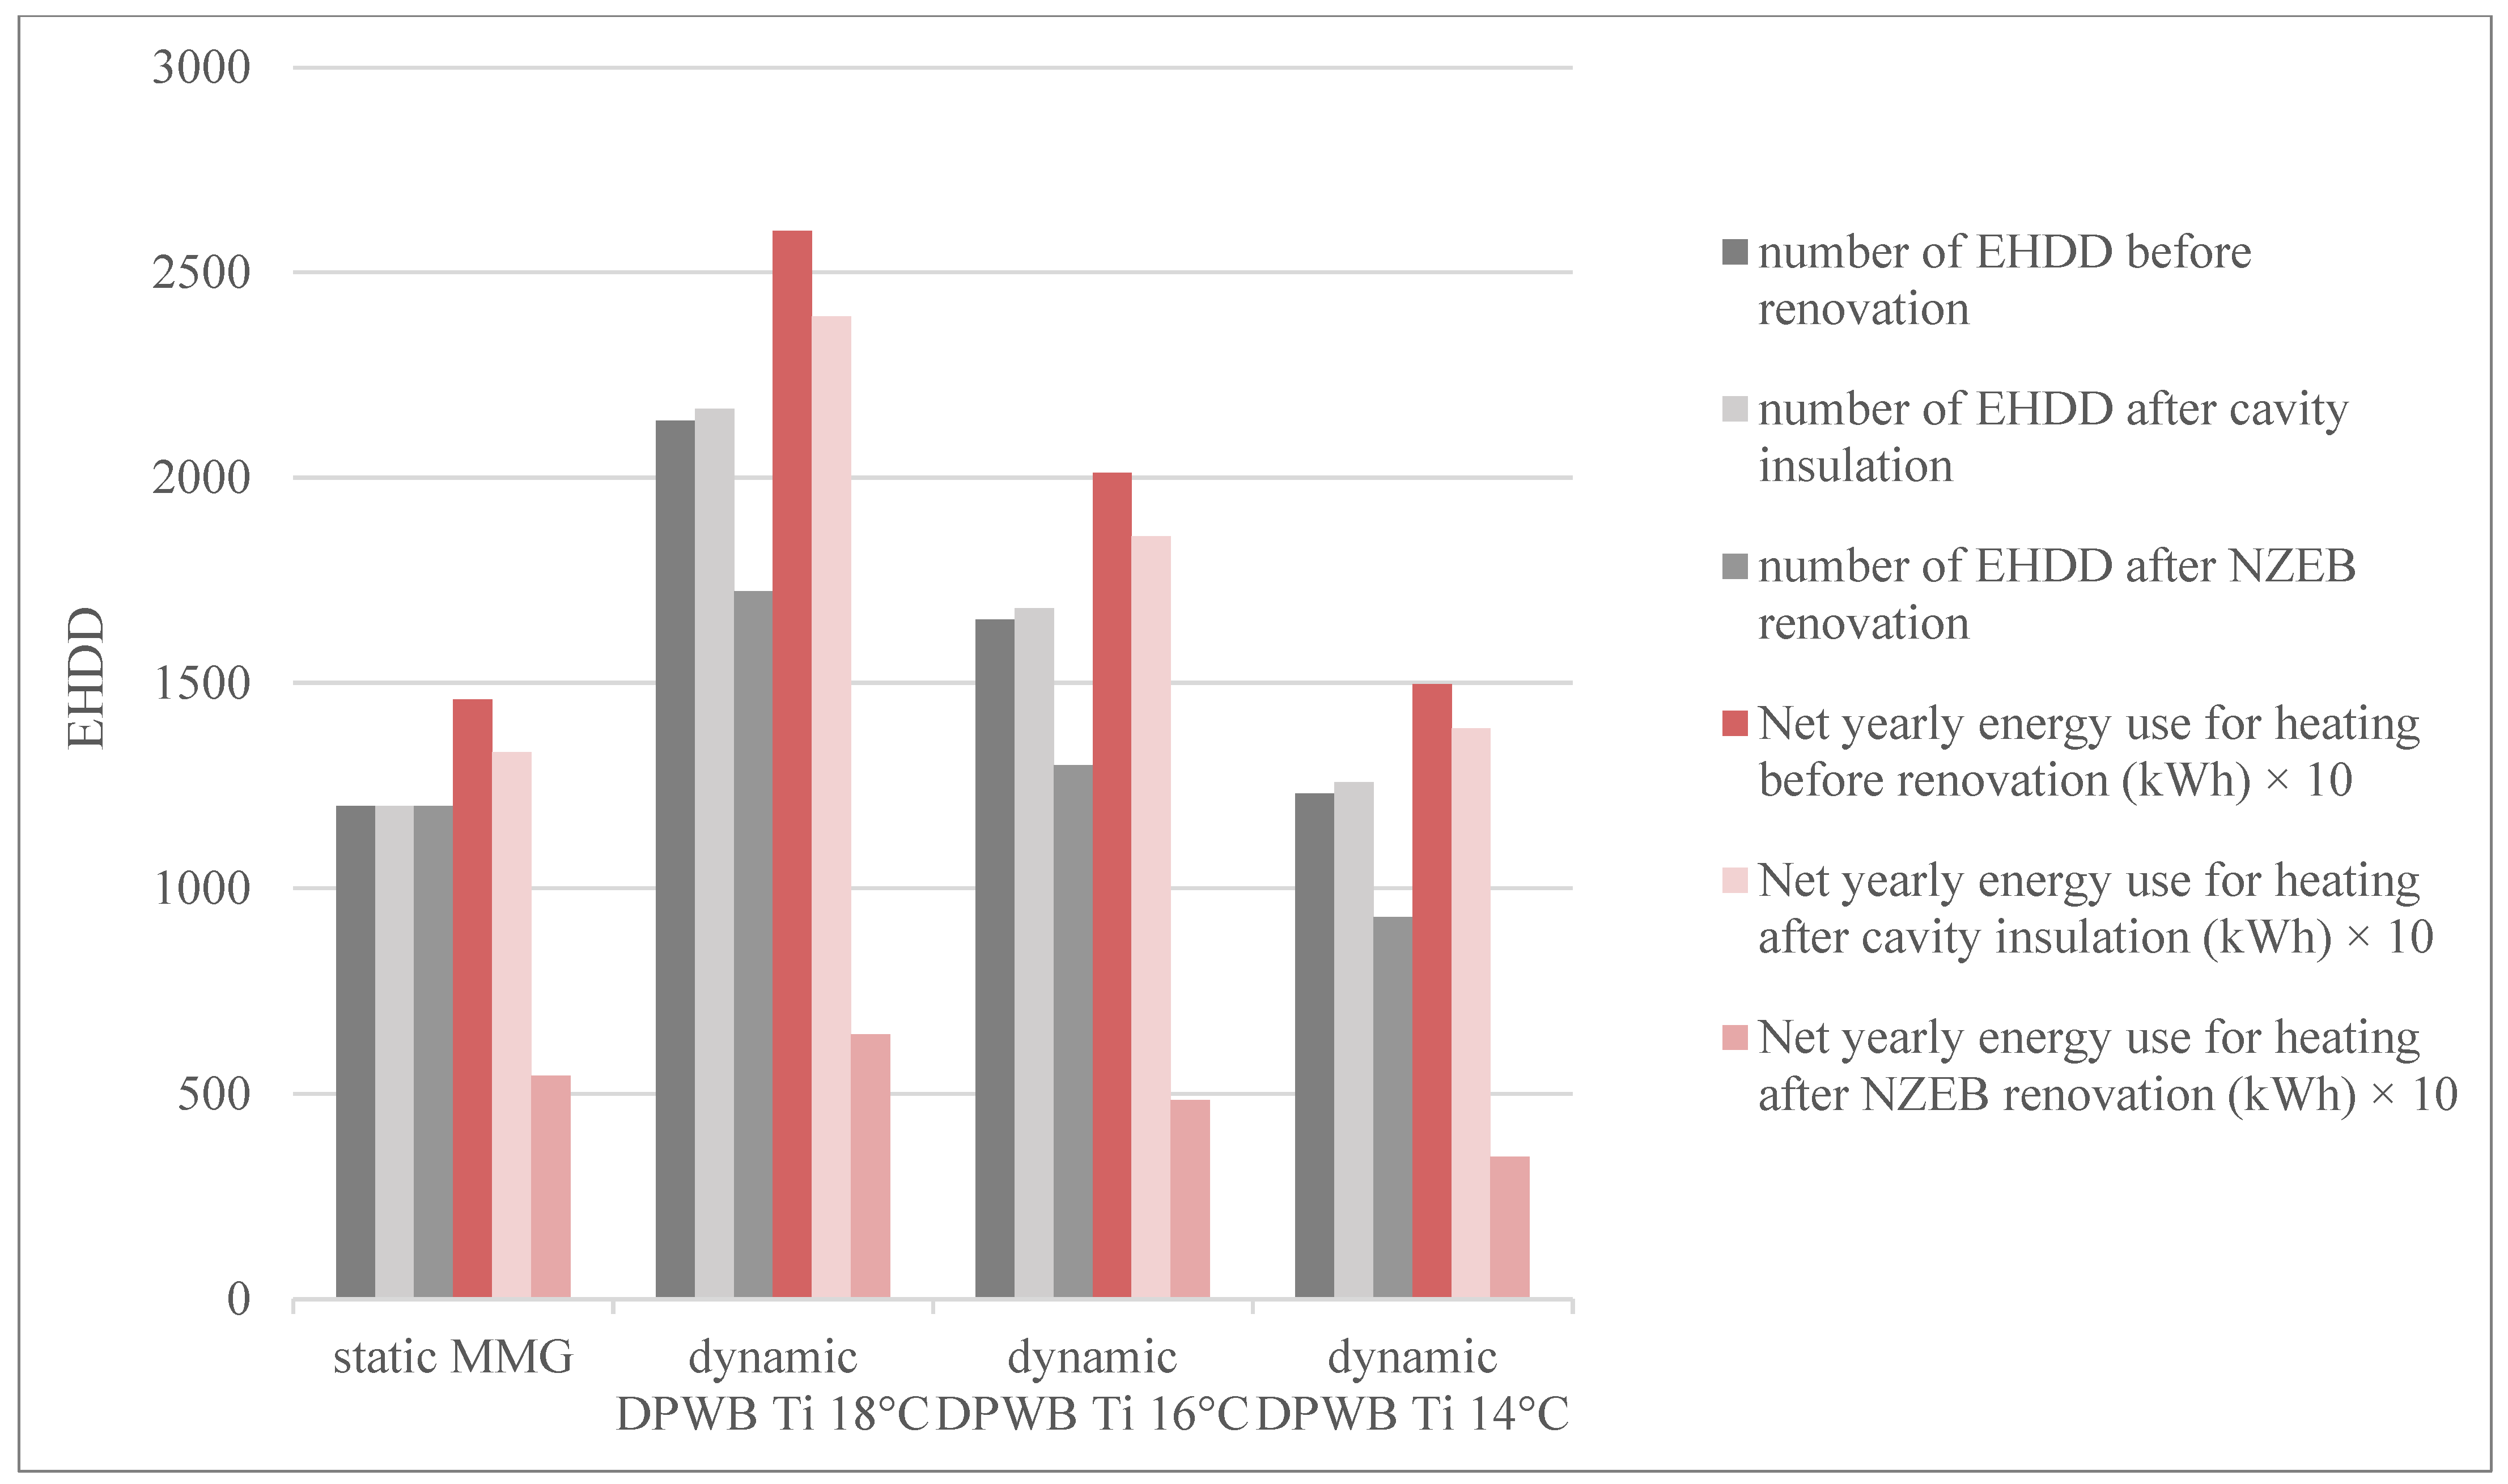
Figure 8 shows that the number of EHDDs estimated with the DPWB method for the existing case study building with an average indoor temperature of 18 °C, an average U-value of 1.24 W/m2K, and n50 of 11 h−1 (i.e., 2139 EHDD), is 78% higher than the assumed value in the static MMG approach (i.e., 1200 EHDD). The number of EHDDs estimated for the existing case study building with an average indoor temperature of 16 °C and identical n50 and average U-value is 1654 EHDD—38% higher than in the static (MMG) approach. For an average indoor temperature of 14 °C, the number of EHDDs for the existing case study building is 1230, only 3% higher than the static approach. By including the increased average indoor temperature, the thermal resistance of the building envelope (1.04 W/m2K for the low-cost renovation option, 0.40 W/m2K for the NZEB renovation option), and airtightness after renovation (9.29h−1 and 1.92 h−1) in the dynamic approach, the number of EHDDs increased to 2168, 1682, and 1258 for average indoor temperatures before the renovation of 18 °C, 16 °C, and 14 °C, respectively, in the low-cost renovation option and reduced to 1723, 1300, and 930 EHDD in the NZEB renovation option, while in the static approach, the number of EHDDs remained unchanged. The increase in the number of EHDDs for the low-cost renovation option was due to the limited increase in the thermal resistance of the building envelope and the increase of 0.44 °C for the indoor temperature after renovation. Figure 8 additionally shows the net yearly energy use for heating (NYEUH). The NYEUH before renovation estimated with 1200 EHDDs, as in the MMG method, was 14,598 kWh, and was again 78%, 38%, and 3% higher when recalculating the EHDDs with the DPWB method, assuming average indoor temperatures of 18 °C, 16 °C, and 14 °C, respectively.
After renovation, better thermal performance was achieved. For the low-cost renovation option, the NYEUH decreased to 13 307 kWh in the static approach and 23,930 kWh, 18,572 kWh, and 13,891 kWh in the dynamic approach, with average indoor temperatures before the renovation of 18 °C, 16 °C, and 14 °C, respectively. The NZEB renovation led to an NYEUH of 5446 kWh after renovation for the static approach and of 6435 kWh, 4851 kWh, and 3469 kWh for the dynamic approach, with average indoor temperatures before the renovation at 18 °C, 16 °C, and 14 °C. respectively. This means that for the low-cost renovation option, the static approach resulted in a lower NYEUH than the dynamic approach, regardless of the estimated average indoor temperature, while for the NZEB renovation option, the results estimated with the dynamic approach were lower for average indoor temperatures of 16 °C and 14 °C. The estimation of the average indoor temperature in the dynamic approach had an effect on the reduction of the number of EHDDs after renovation. While in the static approach, only the thermal resistance of the building envelope was adapted to estimate the NYEUH after renovation; in the static approach, both the thermal resistance of the building envelope and the number of EHDDs were adapted. In the static approach, a reduction in the NYEUH of 63% between the unrenovated building and the NZEB renovation was found, while in the dynamic approach, a reduction in the NYEUH of 77% was found between the unrenovated building and the NZEB renovation when an average indoor temperature of 14 °C was assumed. Adapting the number of EHDDs on top of adapting the thermal resistance of the building envelope resulted in an additional 14% reduction of the estimated NYEUH.
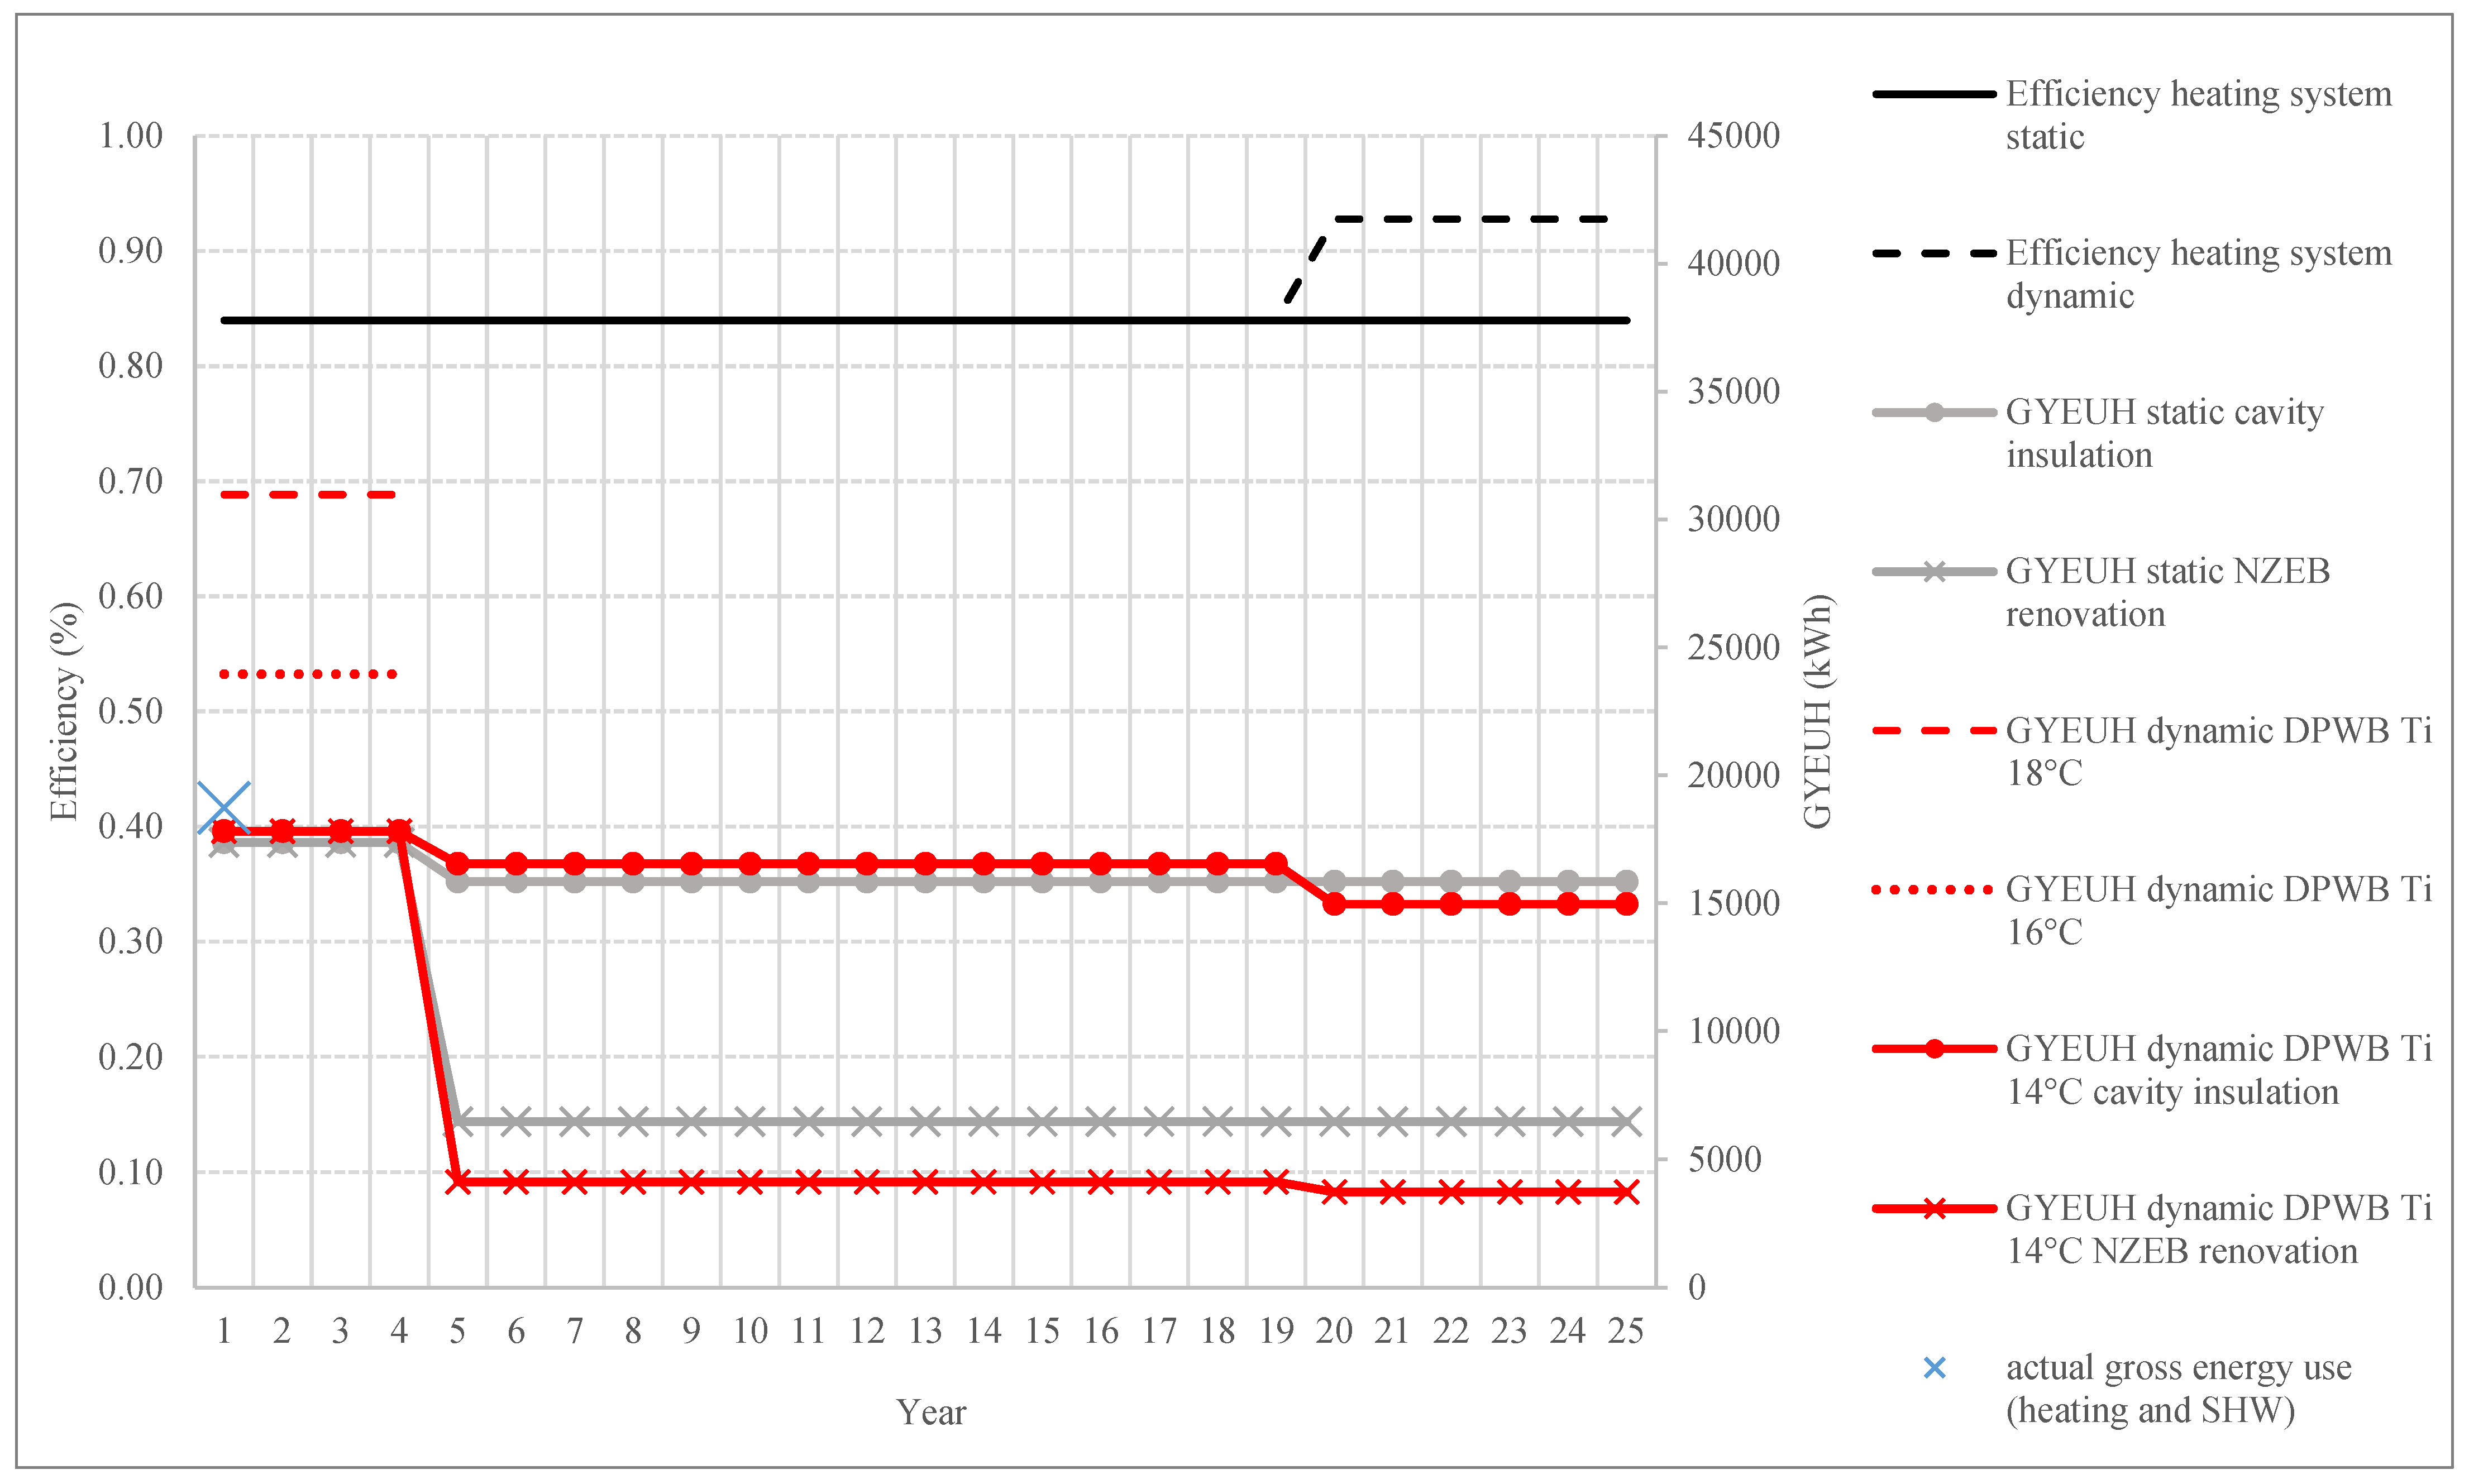
As mentioned before, the first step of the renovation involved replacing the heating system with a new condensing gas boiler in year 1, resulting in a new system efficiency of 84% in both the static and dynamic approaches, as shown in Figure 9. In the static approach, the system efficiency remained unchanged during the rest of the service life. To explain the concept of including a better efficiency in the dynamic approach, only the first 25 years of the resulting service life of the building are included in Figure 9. In the dynamic approach, a yearly increase of 0.5% in the efficiency of the gas boiler was included, resulting in a system efficiency of 93% when the gas boiler is replaced in year 20. Likewise, an increase in the efficiency is included when the heating system is replaced in year 40.
In addition to the efficiency of the heating system, the Gross yearly energy use for heating (GYEUH) of the case study building (before and after the NZEB renovation) is presented in Figure 9, together with the measured gross yearly energy use (average of 2015–2018, blue cross in the graph). The GYEUH before renovation, estimated with the static approach, was 17,383 kWh, 7% lower than the measured gross energy use. It should be noted that the measured energy use is both for heating and for the production of SHW, while the estimated energy use is only for heating. The GYEUH estimated with the dynamic approach for an average indoor temperature of 18 °C was 30,979 kWh, 65% higher than the measured gross energy use. In line with the findings by Delghust [49] and Lambie and Saelens [54], the results for the GYEUH based on an average indoor temperature before the renovation of 18 °C showed a clear overestimation. When an average indoor temperature of 16 °C was assumed, the estimated GYEUH was 23,962 kWh—28% higher than the measured gross energy use. The GYEUH estimated with the dynamic approach for an average indoor temperature of 14 °C, namely 17,820 kWh, seemed to be the best estimation, as this was 5% lower than the measured gross energy used. For that reason, the results with the dynamic approach further presented in this paper considered an average indoor temperature of 14 °C before renovation increased 0.44 °C or 1 °C after renovation and a better thermal resistance (1.04 W/m2K or 0.40 W/m2K) and airtightness (9.29 h−1 or 1.92 h−1) after renovation.
The results for both the low-cost and the NZEB renovations of the building envelope are presented in Figure 9 (by the grey lines for the static approach and the red lines for the dynamic approach). For the low-cost renovation option, the line with dots, the static approach shows a smaller result up to year 20, as in the dynamic approach, an increase in the indoor temperature is included. After year 20, the results calculated with the dynamic approach are 6% lower due to including the increased efficiency of the heating system when it is replaced. For the NZEB renovation option, the line with crosses, the result with the dynamic approach is lower from the moment of renovation due to a reduced number of EHDDs after renovation, while this is kept constant in the static approach. Similar to the low-cost renovation option, the results in year 20 are 6% lower in the dynamic approach than in the static approach, as here, the increased efficiency of the gas boiler is included. As another growth rate was assumed for the efficiency of heat pumps, a decrease in the GYEUH in the dynamic approach compared to the static approach of 10% in year 20 and 17% in year 40, was found.

5.2. Environmental Impact

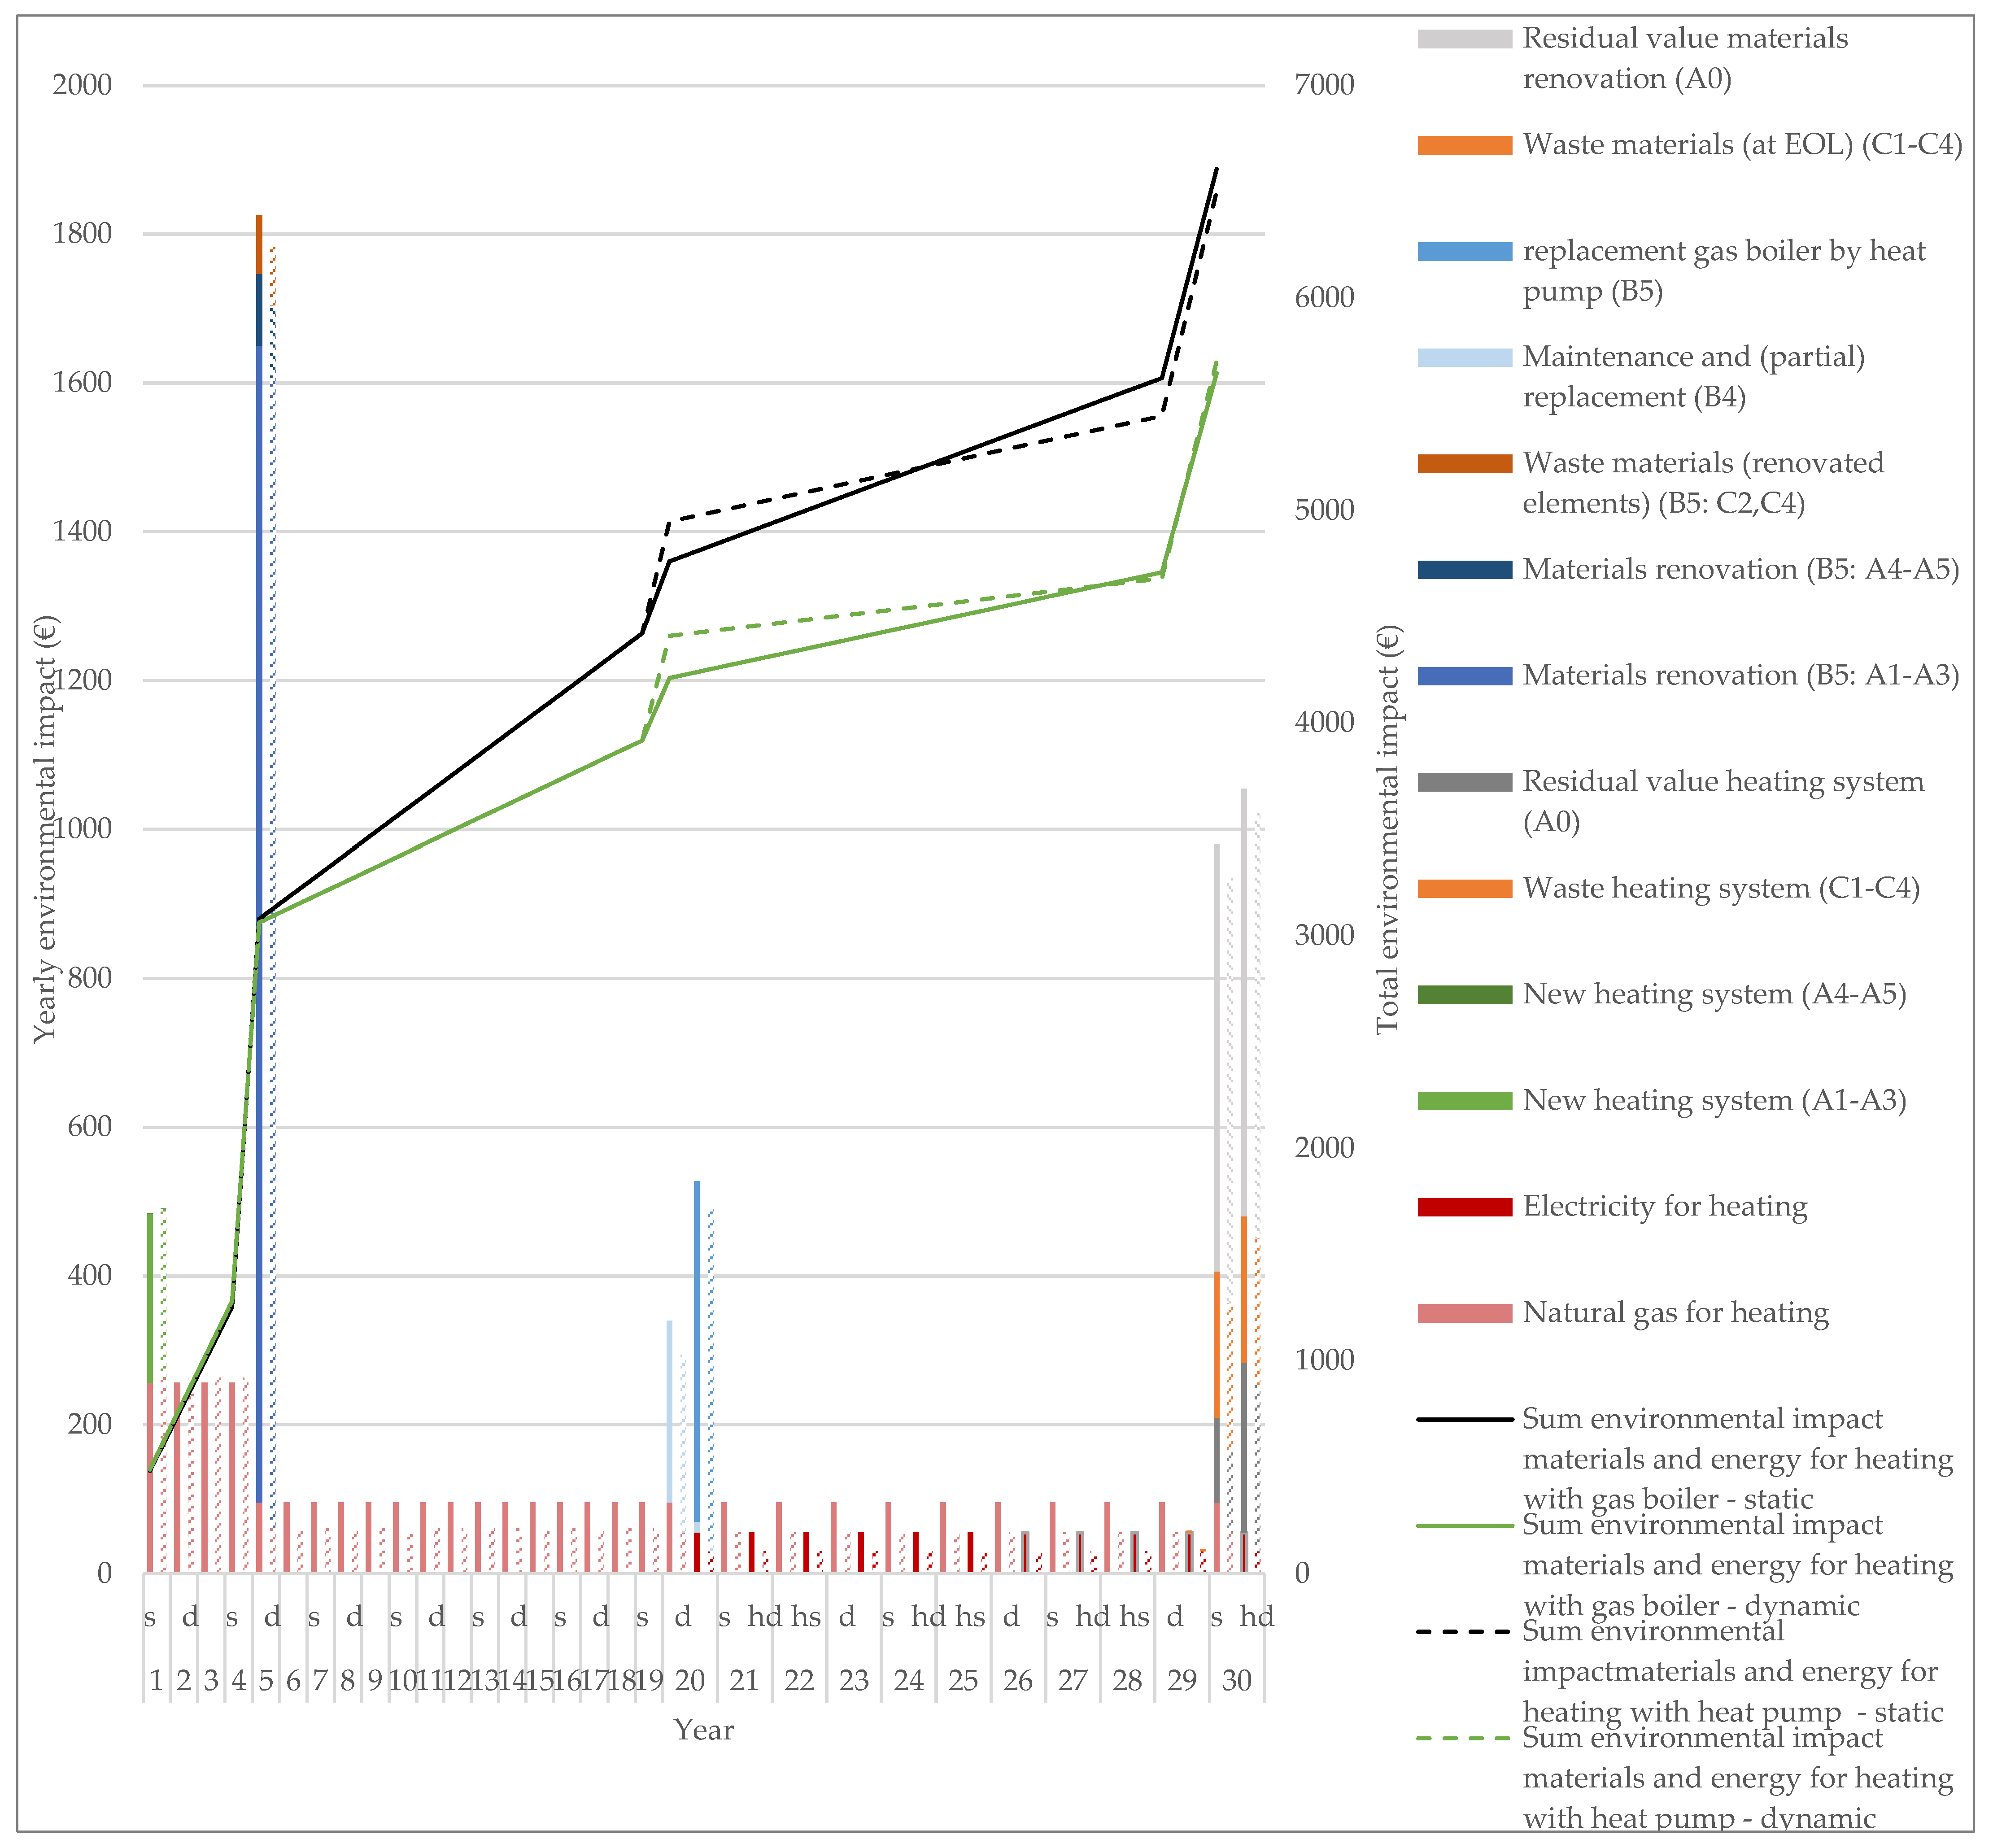
In Figure 10, the EI of the energy for heating, the heating system, and the materials for the NZEB renovation is presented. Firstly, the EI of the operational energy use is discussed. The pink columns in Figure 10 present the yearly EI, on the left Y-axis, of the natural gas used for space heating estimated with the static approach (s, full colours) and the dynamic approach (d, dashed colours). For better visualisation, only the EI occurring in the first 30 years is shown on the graph. As no changes in the characterization factors are included in this research, the EI for the use of 1 kWh of natural gas remains unchanged over time. This means that the EI of the energy used for heating and SHW production changes according to the gross energy use. The results with the dynamic approach are 36% lower in year 5 and 42% lower in year 30 compared to the static approach. This is due to including the increase in efficiency of the heating system and adapting the number of EHDDs after renovation in the dynamic approach.
To study the effect of a phase-out scenario for the use of natural gas, it was assumed that the gas boiler in year 20 would be replaced by a heat pump (hs for heat pump static, hd for heat pump dynamic). The efficiency of the heat pump is 286% in the static approach and 335% in the dynamic approach (286 × (1 + 0.00796)20). Although the EI of electricity (0.026 €/kWh) is higher than the impact of natural gas (0.013 €/kWh), the higher efficiency of the heat pump and the consequential lower gross energy use result in a decrease in the EI for the energy use for heating (i.e., a decrease of 42% in year 30 for the static approach and 46% in the dynamic approach). To check the difference between the static and the dynamic approach, the EI of the energy used for heating with a heat pump is estimated with the static and dynamic approaches. The result with the dynamic approach is 46% lower than the result estimated with the static approach.
Secondly, the EI of the heating system is discussed. As future cleaner production is included, the external environmental costs of the production of a new boiler (EUR 226.96) is 2% lower in year 20 (EUR 222.46) and 4% lower in year 40 (EUR 218.08) in the dynamic approach compared to the static approach. When the gas boiler is replaced by a heat pump in year 20, the external environmental cost of the production of the heat pump is EUR 456.80 in the static approach and EUR 447.75, −2%, in the dynamic approach.
Thirdly, the impact of the materials for the NZEB renovation is discussed. The dark blue bars at year 5 in Figure 10 represent the impacts of the stepwise renovation in life cycle stage B5. The production, transport, and installation of the materials for renovation are shown separately on the graph together with the EOL treatment of the existing materials that are removed from the building. The most important impact is due to the production of the materials for renovation. As in this study, a cautious growth rate for cleaner production is included, the result after five years calculated with the static and the dynamic approaches is very similar, −0.5% in the dynamic approach. In year 20, the impacts of the necessary replacements, i.e., replacement of the gas boiler and partial replacement of the finishing materials for the roof and wall, are presented by the light blue bars in Figure 10. When the gas boiler is replaced by a heat pump in year 20, this is assumed to be an improvement and is included in stage B5 as a stepwise renovation. To explain the concept of the residual value, it is assumed that the building will be demolished in year 30. For example, the heating systems are not yet at the end of their service lives, i.e., 20 years, as they were only replaced 10 years prior. Therefore, residual values are accounted for, represented by the dark grey bars in the graph. Likewise, residual values were included for the materials that were not yet at the end of their service lives. In case the heating system or the materials would be removed to be used elsewhere, no residual value would be accounted for. As the building is assumed to be demolished, the EI of the EOL treatment of the materials is included, represented by the orange bars in Figure 10.
The results for the total EI are presented by the lines in the graph and refer to the right Y-axis. After 30 years, the sum of the EI, including the energy use, the heating system, and the materials for the NZEB renovation, is 15% lower when estimated with the dynamic compared to the static approach for the scenario with a gas boiler and 12% lower for the scenario with the heat pump. The different assumptions in the static method (black lines) and dynamic method (green lines) are shown in Figure 10. Before the NZEB renovation in year 5, the inclination of the static and dynamic graphs is similar. After renovation, the inclination of the dynamic graph is less steep, due to the lower gross energy use assumed in the dynamic approach. When the gas boiler is replaced by a heat pump in year 20, the jump in the graph is bigger due to the higher EI of the heat pump. As the efficiency of the heat pump is higher, the inclination of the graph after the replacement with the heat pump is lower; however, in year 30, the total EI for the NZEB renovation with a heat pump is similar to the EI of the NZEB renovation with a gas boiler, due to the higher residual value of the heat pump. After 30 years, the results calculated with the dynamic approach are lower than the results calculated with the static approach. In the static approach, the EI of the NZEB renovation with a heat pump is slightly lower (−2%) than the EI of the NZEB renovation with the gas boiler, while in the dynamic approach, the result is the opposite (+1%).
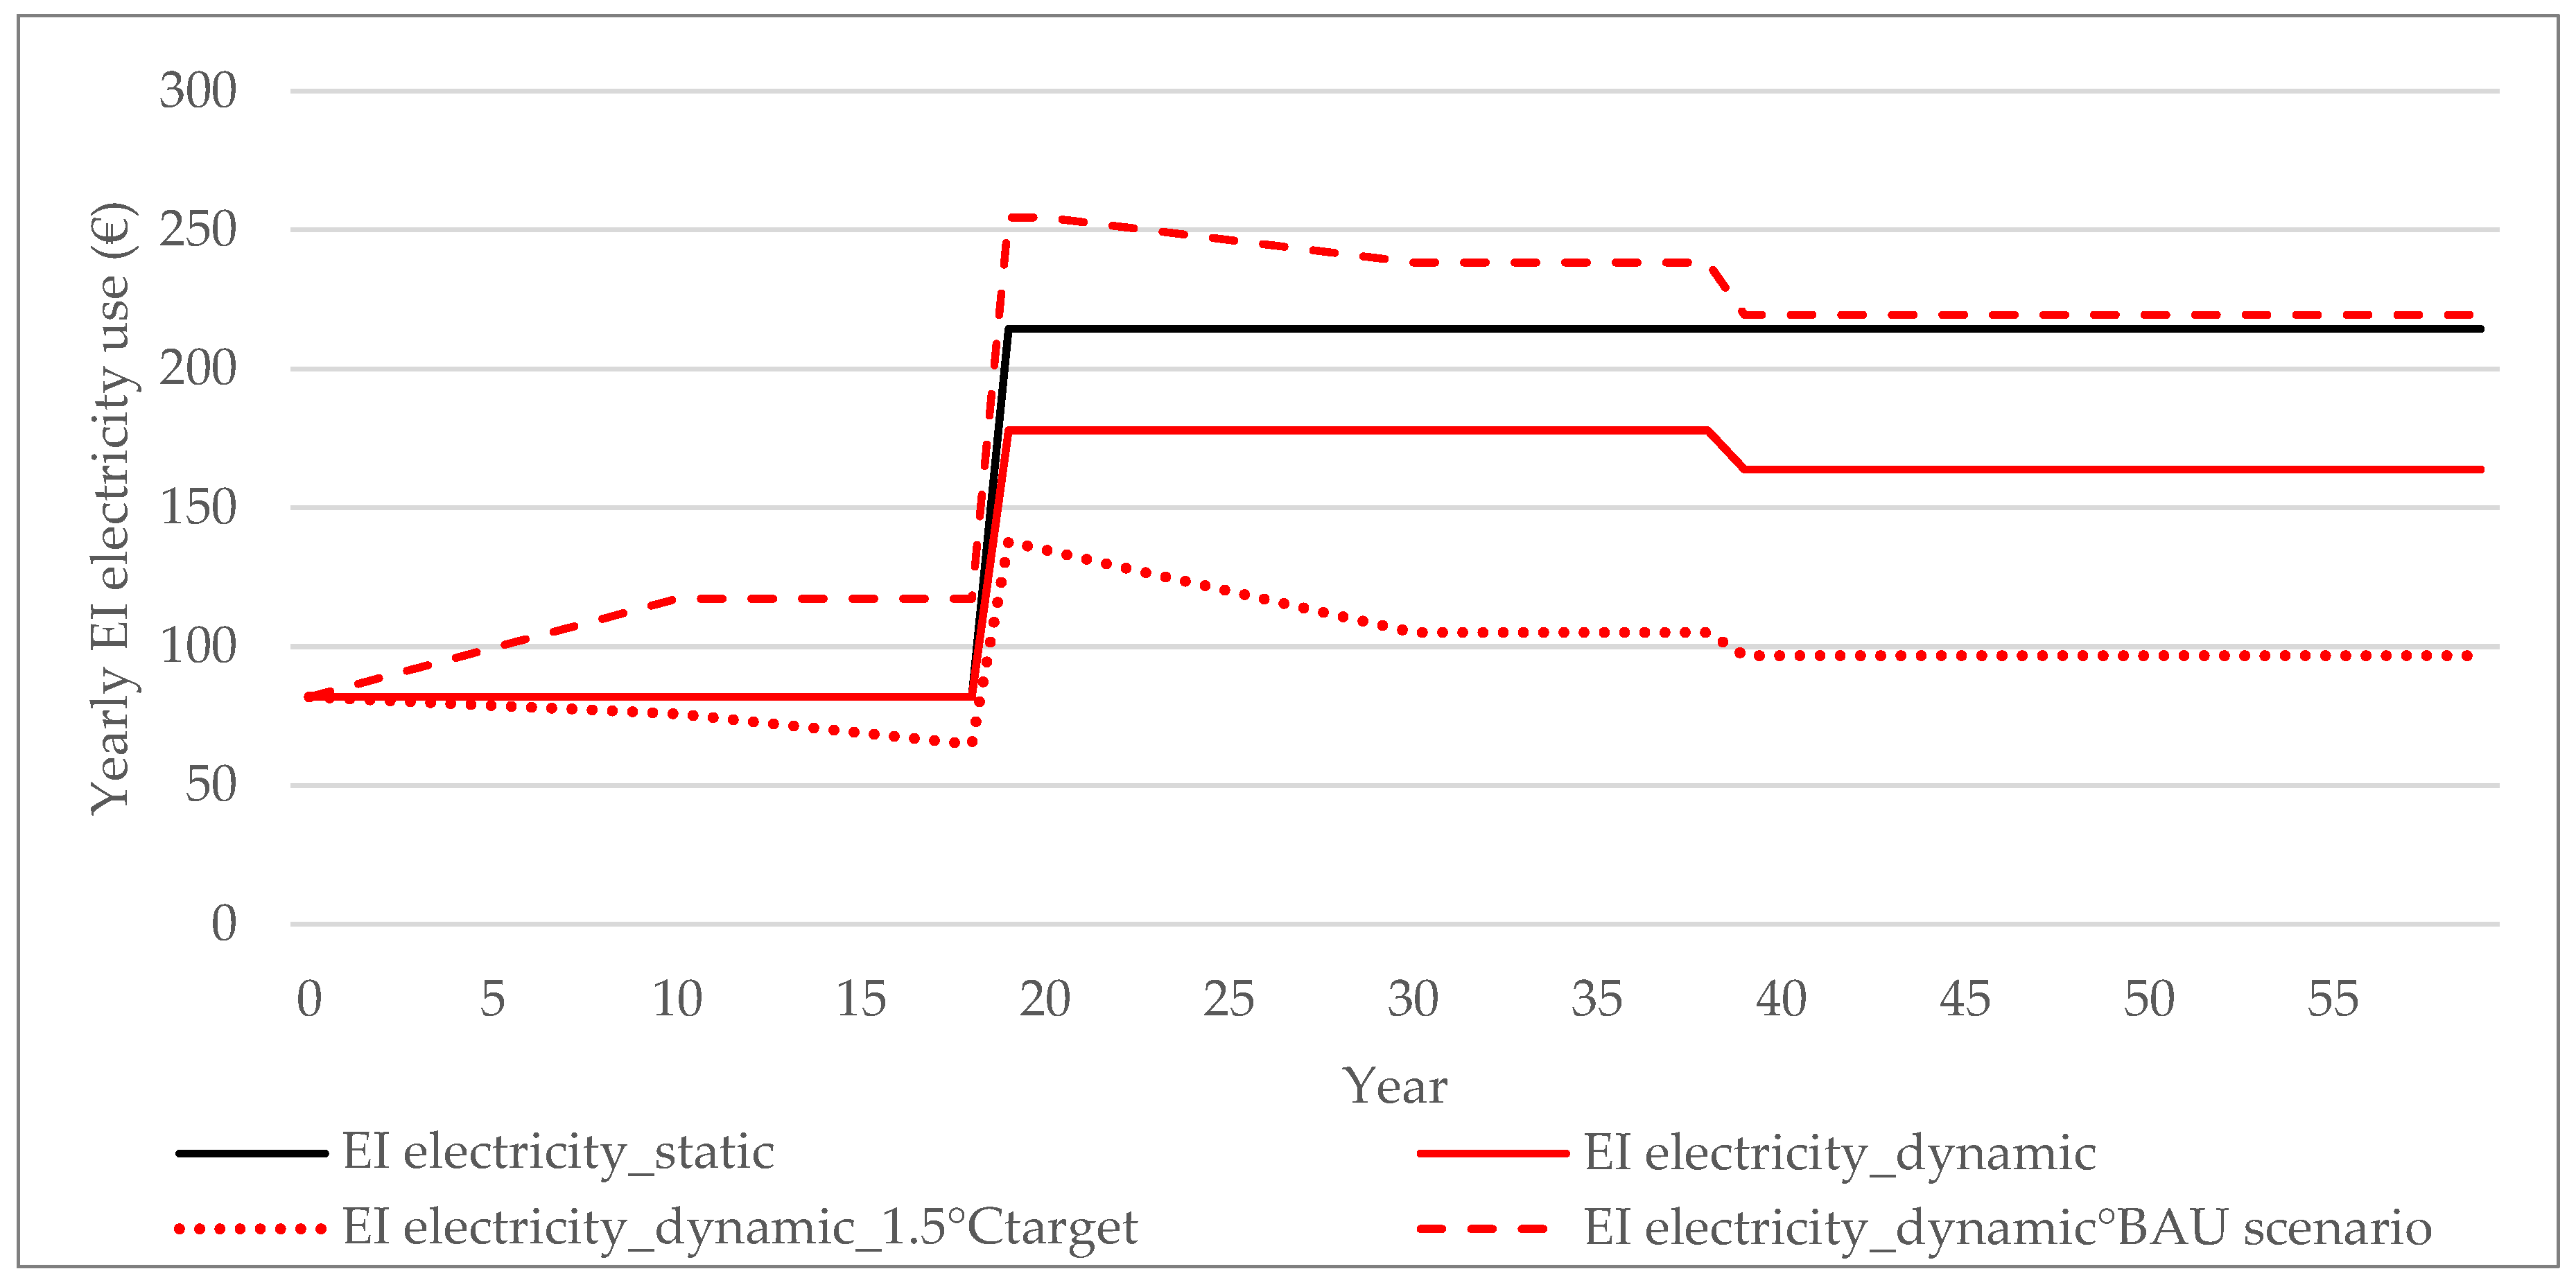
The effect of a change in the electricity mix on the impact of the NZEB renovation option with a heat pump was furthermore assessed. In Figure 11, the EI of the electricity used for lighting and appliances and heating with a heat pump from year 20 onwards is presented. The black line presents the results for the static approach (i.e., no change in the electricity mix over the building service life). The full red line presents the EI for the dynamic approach, where the EI of the production of electricity remains constant. The dotted red line presents the EI for the best-case scenario for electricity production, i.e., a 1.5 °C target scenario [67], while the dashed red line presents the results considering the worst-case scenario, i.e., the BAU scenario [67]. Including changes in the production process of electricity leads to an increase in the EI of 2% in the worst-case scenario and a decrease of 45% in the best-case scenario, compared to the static result.
In Figure 12, the EI over the total service life of the building for the NZEB renovation with the gas boiler is shown per life cycle stage. In year 1, the impact of the new heating system is shown (A1–A5). The impact of new materials for renovation in year 5 is clearly the most important (B5), followed by the impact of replacing the heating system (B4) in year 20 and year 40. The impacts of the partial replacement of the roof covering and facade tiles are included as necessary maintenance (B4) in years 20, 35, and 50. As a replacement of only 10% of these finishing materials is assumed, the impact is very small. However, in year 35, additionally, the windows need to be replaced as the service life is 30 years, leading to an important impact. In the dynamic approach, the EI of the replacement of the windows in year 35 is 3.4% smaller than in the static approach as the effect of cleaner production is included in the dynamic approach. The effect of including a growth rate for cleaner production seems important for materials with shorter service lives as they need to be replaced during the service life of the building. A residual value (A0) accounts for all materials that have not yet reached the end of their service lives when the building is demolished in year 60. As shown in Figure 12, this residual value is significant and shows the importance of the circular building. The impact of the waste treatment (C1–C4) is negligible at the moment of renovation but significant at the end of the service life of the building, as here, the impact of demolishing the whole building is included. The impact of energy use (B6) decreases after the replacement of the new heating system in year 20 and year 40.
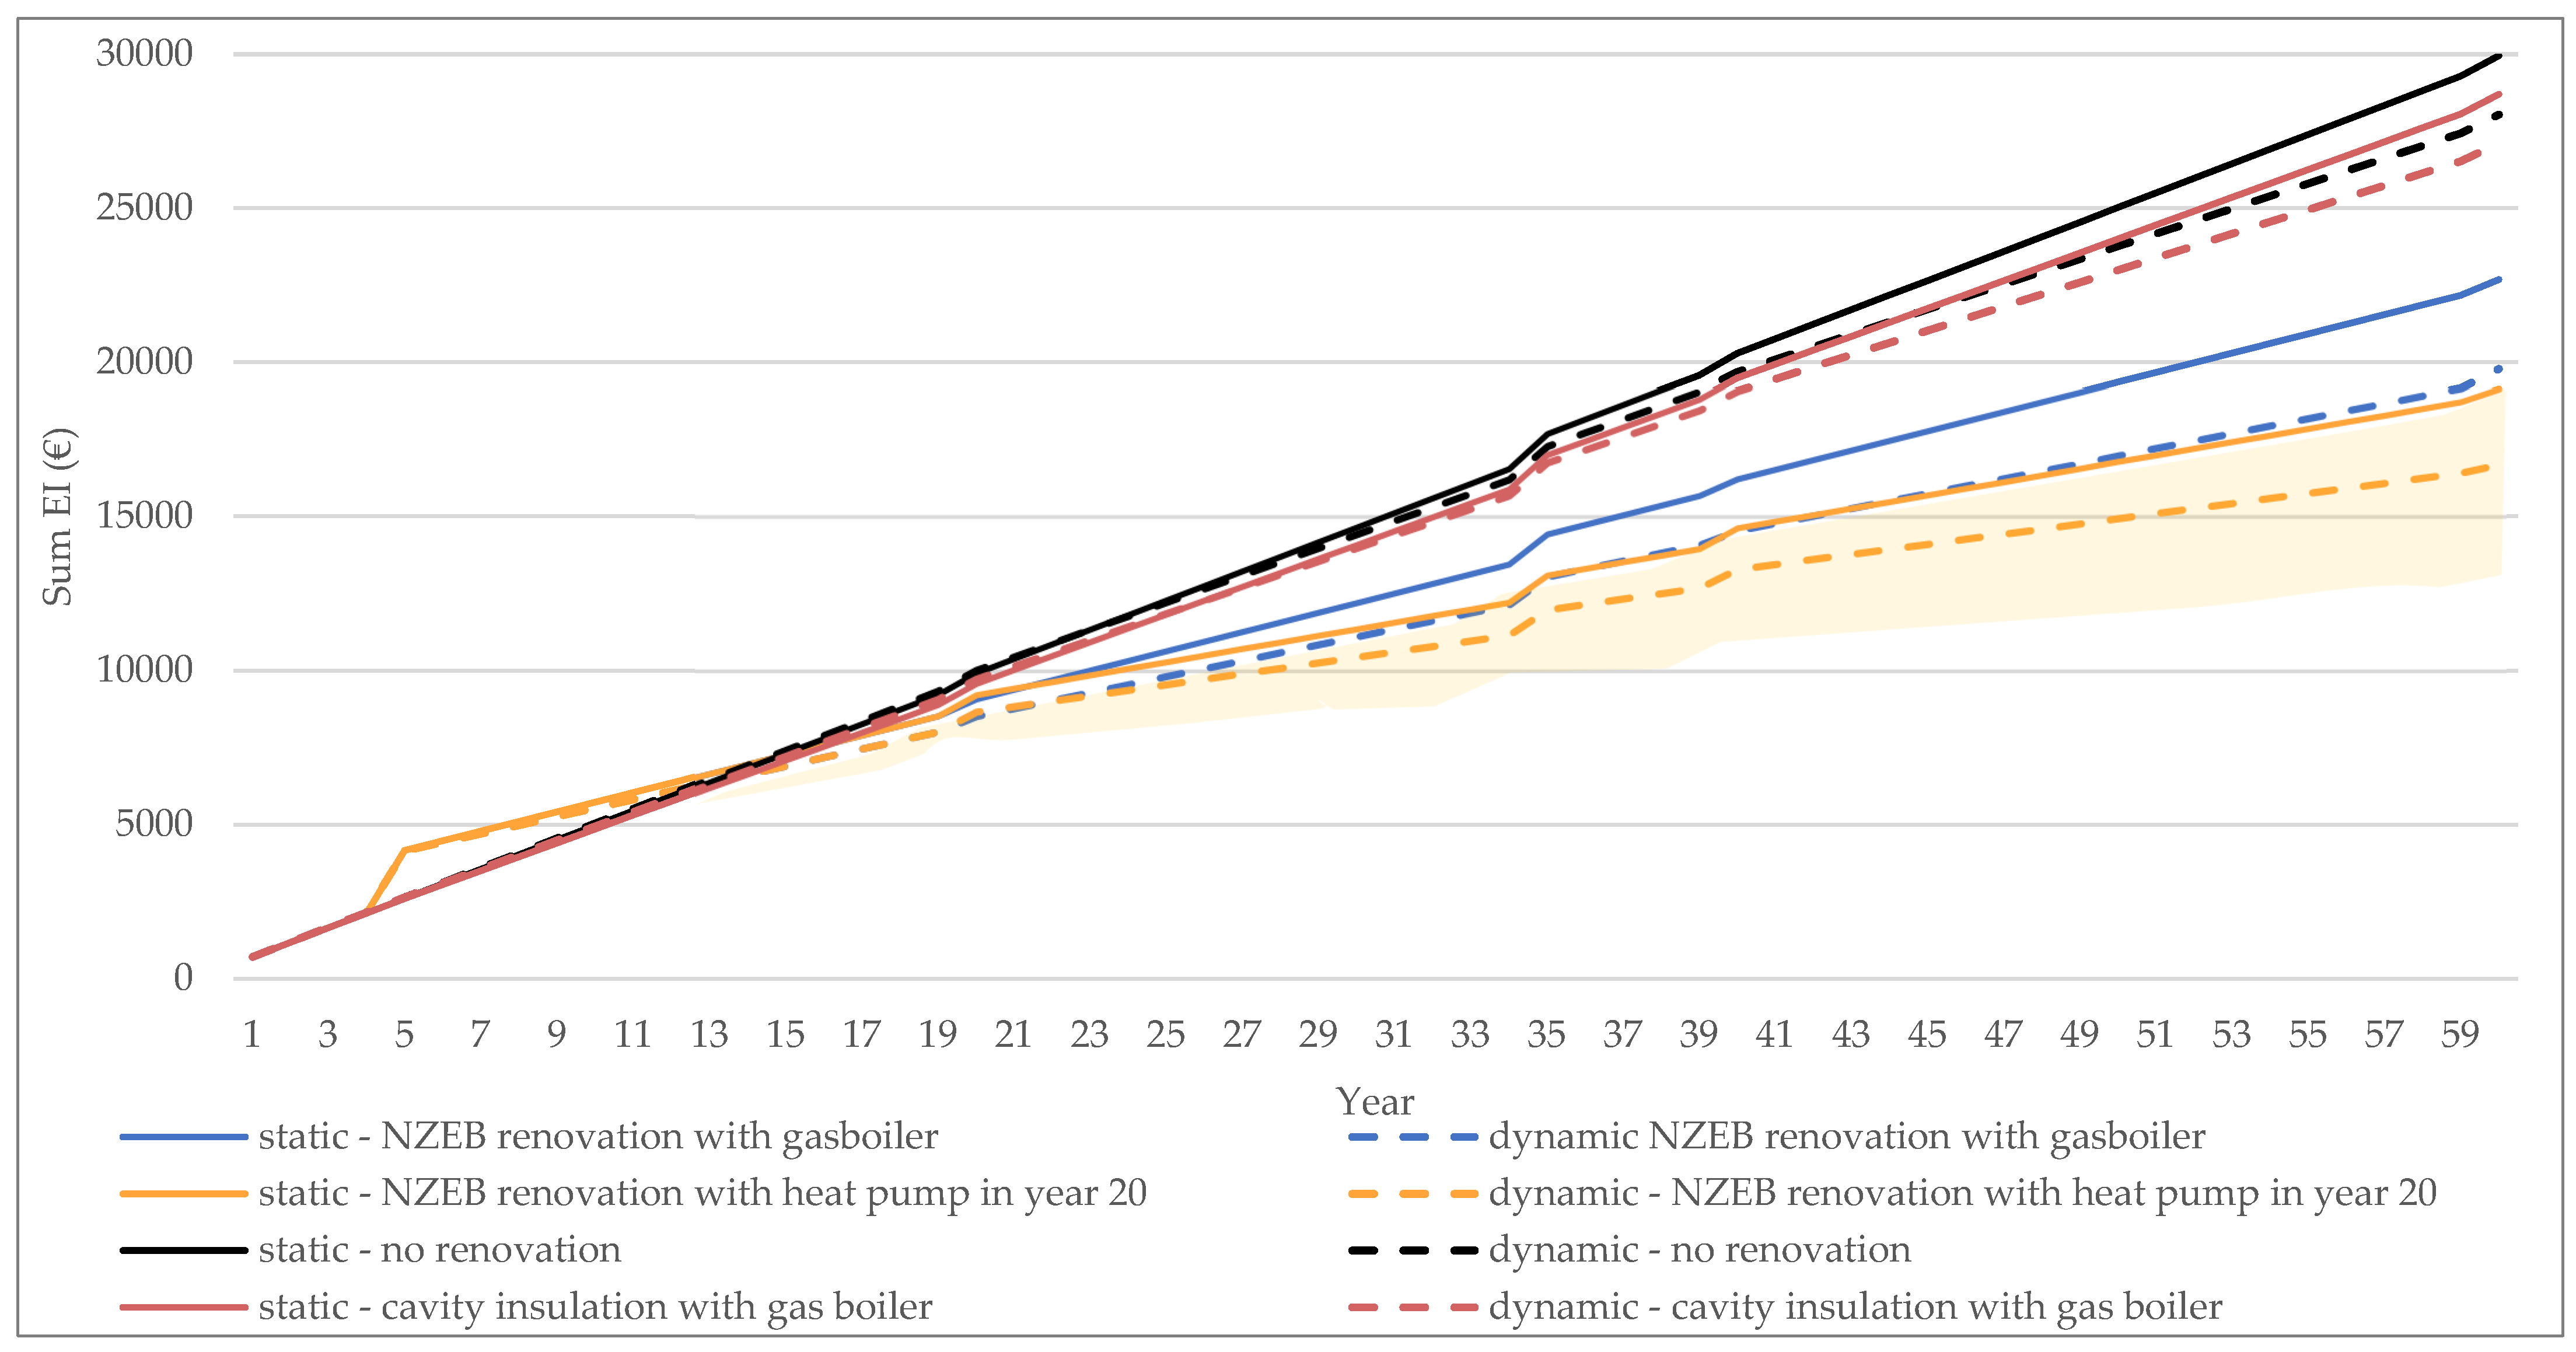
Figure 13 shows the results for the total accumulated EI over 60 years, including the EI of the energy used for heating, the production of SHW and electricity and production, maintenance, replacement, and the EOL of the materials needed for the renovation of the building envelope and heating system based on the static (full lines) and dynamic approaches (dashed lines). Firstly, in the scenario where no renovation occurs, the full black line in Figure 13 for the static approach and dashed black line for the dynamic approach, are discussed. In year 1, the impact of the new heating system is identical in the static and the dynamic approach. The impact of the replacement of the heating system is indicated by the small jumps in the graph in year 20 and year 50. The EI of the necessary replacements of the finishing materials in year 20, year 35, and year 50 is very small and hardly visible on the graph; however, the impact of replacing the windows in year 35 is significant and clearly visible on the graph. From year 20 onwards, the inclination of the graph representing the EI calculated with the dynamic approach is less steep, as here, the increased efficiency of the boiler is included, resulting in a smaller impact on the yearly energy use for heating and the production of SHW. As a result, the total EI after 60 years is 6% lower when calculated with the dynamic approach. The increase in the EI in year 60 is caused by the impact of the residual value. Secondly, the low-cost renovation option with cavity insulation is discussed, presented by the full (static) and dashed (dynamic) red line in Figure 13. The EI of the materials needed to insulate the cavity is very small and hardly visible on the graph. However, insulating the cavity wall affects the energy use for heating, which is represented by the less steep inclination of the graph compared to the option where no renovation occurs from year 5 onwards. As in the dynamic approach, an increase in the indoor temperature is included, resulting in a higher number of EHDDs and NYEUH; the EI is slightly higher in the dynamic approach than in the static approach between year 5 and year 20. On the other hand, in year 20, a better efficiency of the heating system is included in the dynamic approach, resulting in a smaller EI from year 20 onwards. After 60 years, the total EI calculated with the dynamic approach is 6% lower than the results calculated with the static approach. Thirdly, the NZEB renovation with the gas boiler, the full blue line for the static approach, and dashed blue line for the dynamic approach, are discussed. As only a small growth rate for cleaner production is included, the EI of the envelope renovation in year 5 is very similar in the static and the dynamic approaches. As in the dynamic approach, the number of EHDDs is reduced after renovation, and the EI of the NYEUH is smaller, resulting in a less steep inclination of the graph from year 5 onwards. Moreover, in year 20 and year 40, increased efficiency of the heating system is included in the dynamic approach, resulting in a 13% smaller EI after 60 years compared to the static approach.
Finally, the NZEB renovation with a shift to a heat pump in year 20, the full (static) and dashed (dynamic) yellow line in Figure 13 is discussed. The results for the NZEB renovation with the gas boiler, including a reduction of the number of EHDDs after renovation and the increased efficiency of the heating system when it is replaced, show a decrease in the EI of 13% at the end of the service life calculated with the dynamic approach compared to the result calculated with the static approach. However, when variations in the production of electricity are included in the estimations, presented by the light-yellow area in the graph, the EI after 60 years varies from 27% lower in the dynamic approach compared to the static approach with the 1.5 °C target scenario, up to 3% higher in the dynamic approach compared to the static approach with the BAU scenario. The impact of the production of electricity leads to a variation in the results of 30% in the dynamic approach. Therefore, it is recommended to include the expected changes in the electricity mix during the service life of the building, especially when assessing electricity-based heating systems. In both the static and dynamic approaches, low-cost renovation options result in a lower EI than no renovation in year 6. An NZEB renovation with a gas boiler results in a lower EI than no renovation in year 15 in the static approach, while in the dynamic approach—in year 13. The shift to a heat pump results in a lower EI compared to keeping the gas boiler in year 22, in both the static and dynamic approaches. Based on the results of the static approach, the NZEB renovation leads to a lower EI than the low-cost renovation in year 17, while this is shown in year 14 in the dynamic approach.

6. Discussion

In this section, first, the results of the sensitivity assessments are discussed to evaluate the robustness of the presented approach. Secondly, the practical application of the method is discussed, and finally, the limitations of the research are presented.
To study the robustness of the method, a sensitivity assessment was conducted on various parameters. An overview of the results is presented in Table 7. A first sensitivity assessment was conducted on the parameter referring to the increased efficiency of the heat pump. When the results are calculated with a growth rate of 0.5% (the same growth rate as for the condensing gas boiler), instead of 0.796%, a 2% difference is found in the results. However, this does not result in different decision-making. A second sensitivity assessment was conducted on the growth rate for cleaner production. This resulted in a higher reduction of the EI over 60 years; however, the impact is still very small and does not lead to other renovation decisions. The last sensitivity assessment was conducted on the SPF of the heat pump. The results for the heat pump with a higher SPF were similar to the results presented in the paper for the heat pump with a lower SPF.
The proposed dynamic approach was tested on a social housing case study; however, it can be applied to any LCA study on building renovation. A background in LCA is recommended to properly model the scenarios and interpret the results of the analyses. The assessment should be included in the early stages of the design process to better estimate the life cycle impact of the unrenovated building and to estimate the EI of the proposed renovation scenarios to avoid the renovated building resulting in a higher EI than the unrenovated building. Information on the type of heating and the building materials needed for the proposed renovation scenario should be available to conduct the assessment.
Finally, some limitations of the research are acknowledged. In the estimation of energy use, the solar gains are calculated based on the static approach defined by the EPBD standards. For that reason, no local renewable energy production was included in this research as the authors are convinced that the dynamic hourly simulation of solar gains will result in better correspondence with local renewable energy production and the use of smart appliances.
Moreover, in this research, the user behaviour was only briefly studied by increasing the indoor temperature by one degree Celsius. Again, a dynamic simulation would be interesting to learn more about the effects of user behaviours. As the research was conducted in a framework on renovation for social housing and a high turnover of tenants was expected, the average behaviour was assumed. A detailed study on user behaviour is not included in the research.
Furthermore, only a limited set of renovation options was considered in the research. The renovation options for floors and windows included the impacts of dismantling and waste treatment of the existing floor and windows. For the walls and roof, it was assumed that the existing structure was preserved. It should be noted that an additional EI should be accounted for when the wall or roof is demolished. Moreover, the effects of the connections between renovated elements of the building envelope were neglected.
One last limitation of the research involves the cautious estimation of the growth rate of cleaner production as only limited data are available on cleaner production. More research on this topic would be interesting.

7. Conclusions

In this paper, the effects of dynamic parameters on the long-term environmental impact (EI) of renovation measures were investigated. Dynamic parameters were proposed for actions related to (1) the renovation measures, such as increasing indoor temperature, thermal resistance, and airtightness of the building envelope, and higher efficiency of the heating system, and (2) changes in society, such as cleaner production processes and a shift to renewable energy production (change in electricity mix). In addition to studying the effects of these dynamic parameters, we investigated whether different design decisions would be taken when these temporal changes were considered compared to a static approach. To facilitate a more in-depth assessment of the renovation options and better identify the hotspots of the renovation measures, a shift of the reference study period in the life cycle assessment (LCA) study was proposed from the moment of the building construction to the moment of renovation. For the analysis, a single-family house was renovated according to a low-cost renovation option, i.e., insulating the cavity wall, and a renovation option according to the Nearly Zero Energy Building (NZEB) standard.
When assessing the life cycle environmental impact of a building of 60 years with both the static and dynamic approaches, it became clear that in the static approach, the NZEB renovation leads to a lower EI than the low-cost renovation in year 17, while in the dynamic approach, the EI of the NZEB renovation is lower than the EI of the low-cost renovation option in year 14. A shift to a heat pump when the existing heating system needs to be replaced results in a lower EI than replacing it with a new condensing gas boiler, both in the standard and in the dynamic approaches. However, when including a worst-case scenario for the production of electricity in the dynamic approach, the EI of the NZEB renovation with a heat pump is higher than the EI of the NZEB renovation with a gas boiler. Finally, the EI of the renovation measures was compared with a scenario where no renovation occurred. The results show that a low-cost renovation option results in a lower EI than no renovation in year 6, both in the static and in the dynamic approaches. The EI of the NZEB renovation option with a gas boiler is lower than the EI of no renovation in year 15 estimated with the static approach and in year 13 estimated with the dynamic approach. These results show that the additional impacts of the materials used in renovation are compensated by the reduction in energy use after several years. From that moment onwards, the EI of the renovation is lower, compared to if the building had not been renovated. The longer the building is used after renovation, the longer the benefits of the renovation are accounted for. The decision to renovate the building or further use the building as it depends on the remaining service life of the building. The moment where the impact of the materials for renovation is compensated by the reduced impact of energy use only differs a couple of years in the dynamic approach compared to the static approach; the approach used to estimate the EI of the renovation is thus less important in the decision making than the remaining service life. When considering the total remaining service life of the building, i.e., 60 years in this paper, calculating the EI with the dynamic approach would not lead to any other renovation decision than calculating the EI with the static approach. However, the absolute values of the EI calculated with the dynamic approach are lower than the EI calculated with the static approach, i.e., −6% in case no renovation occurs, and for the low-cost renovation option, and −13% for the NZEB renovation options with a gas boiler and heat pump. The analysis reveals that the EI of the energy used for heating represents an important share of the total EI of the building; hence, it is concluded that it is important to accurately estimate the energy use for heating before and after renovation. Dynamic parameters influencing the estimation of the gross yearly energy use for heating (GYEUH) before and after renovation and a dynamic parameter for the production of the electricity mix, especially when assessing electricity-based heating systems, seem to be the most important.
To avoid overestimating the energy reduction potential of renovation measures, it is important to correctly estimate the energy use before renovation. To do so, a lower average indoor temperature than the default 18 °C (in current Belgian energy performance standards) before the renovation is recommended. Moreover, it is advised to calibrate the calculated GYEUH with the actual energy use for the building. In case no data on the actual energy use are available, it is recommended to estimate the energy use before renovation with 1200 equivalent heating degree days (EHDDs), as confirmed in the RenoseeC project [72], or to estimate the number of EHDDs based on an average indoor temperature of 14 °C. This last recommendation should be confirmed in further research using a broader data set of case study buildings. The results show that considering the (expected) change in the average indoor temperature after renovation (+1 °C for well-insulated buildings) in the dynamic approach has an important effect on the estimated net yearly energy use for heating (NYEUH); therefore, it is recommended to include an increase of the indoor temperature after renovation in the assessment. In addition to the indoor temperature, the reduced average U-value of the building envelope after the renovation has an important effect (−21%) on the estimation of the net energy demand (and, hence, the EI), while the improved airtightness after the renovation has a smaller positive effect (−3%).
Considering a better efficiency of the heating system when it is replaced during the service life of the building has an important effect on the estimation of the GYEUH: −6% in year 20 and −12% in year 40 compared to the static approach for renovation options with a gas boiler and −10% in year 20 and −17% in year 40 for renovation options with a heat pump. Thus, it is recommended to include a growth rate for the efficiency of the heating system in the calculation.
Although a very cautious estimation was used for the decrease in the production impact of building materials, a difference between the static and dynamic approach was found, i.e., −2% in year 20 and −4% in year 40 for the replacement of the gas boiler and −3.4% in year 35 for the replacement of the windows. It is recommended to further investigate the effects of cleaner production on the EI of the future production of building materials, especially for materials with shorter service lives.
It is important to include changes in the electricity mix to accurately assess renovation measures with electricity-based heating systems, such as heat pumps, as approximately 30% (within the range) is identified between the best- and worst-case scenarios for the EI of the production of electricity. Based on the variations in the results and the uncertainty in the prediction of future electricity production, sensitivity analyses regarding the electricity mix are recommended, especially in renovation scenarios with heat pumps.

Supplementary Materials

The following supporting information can be downloaded at: https://www.mdpi.com/article/10.3390/su14116838/s1, Table S1: Overview of transport scenarios based on MMG method; Table S2: Ecoinvent records to model transport; Table S3: Overview of scenarios for waste transport and waste treatment based on MMG method.

Author Contributions

Conceptualization, E.V.d.m. and K.A.; methodology, E.V.d.m., K.A. and F.D.T.; validation, L.S. and E.S.; formal analysis, E.V.d.m.; resources, L.S. and E.S.; writing—original draft preparation, E.V.d.m.; writing—review and editing, K.A. and F.D.T.; visualization, E.V.d.m.; supervision, K.A.; project administration, E.V.d.m.; funding acquisition, E.V.d.m. and K.A. All authors have read and agreed to the published version of the manuscript.

Funding

This research was funded by Flanders Innovation & Entrepreneurship (VLAIO), grant number HBC.2016.0608.

Institutional Review Board Statement

Not applicable.

Informed Consent Statement

Not applicable.

Data Availability Statement

The data is in the Supplementary Materials.

Acknowledgments

We would like to thank Zonnige Kempen and Molse Bouwmaatschappij for providing important information on the social housing stock and data on real energy use for this study.

Conflicts of Interest

The authors declare no conflict of interest. The funders had no role in the design of the study; in the collection, analyses, or interpretation of data; in the writing of the manuscript, or in the decision to publish the results.

Abbreviations

BAUbusiness as usual scenario
DLCAdynamic life cycle assessment
DPWBDiensten voor Programmatie van het Wetenschapsbeleid (Service for Pragramming Scientific Policies)
EHDDequivalent heating degree days
EIenvironmental impact
EOLend of life
EPBEnergie, Prestatie & Binnenklimaat (Energy performance and indoor climate)
EPBDEnergy Performance of Buildings Directive
EPCenergy performance certificate
FPBFederal Planning Bureau
GHGgreenhouse gas
GWPglobal warming potential
GYEUHgross yearly energy use for heating
LCAlife cycle assessment
LCIlife cycle inventory
LCIAlife cycle impact assessment
MMGMilieugerelateerde Materiaalprestatie van Gebouwelementen (Environmental profile of building elements)
NYEUHnet yearly energy use for heating
NZEBNearly Zero Energy Building
PHPPPassivHaus Projektierungs Pakket
RESrenewable energy sources
SHWsanitary hot water
SPFseasonal performance factor
TNHtemperature of no more heating
TOTEMtool to optimise the total environmental impact of materials
TWHtemperature without heating

References

  1. French, D. Kyoto Protocol to the United Nations Framework Convention on Climate Change. J. Environ. Law 1998. [Google Scholar] [CrossRef]
  2. United Nations Adoption of the Paris Agreement. 2015. Available online: https://unfccc.int/resource/docs/2015/cop21/eng/l09r01.pdf (accessed on 22 April 2022).
  3. United Nations. Transforming Our World: The 2030 Agenda for Sustainable Development. United Nations Sustainable Knowledge Platform. Sustainable Development Goals. 2015. Available online: https://sustainabledevelopment.un.org/content/documents/21252030%20Agenda%20for%20Sustainable%20Development%20web.pdf (accessed on 22 April 2022).
  4. European Commission on Resource Efficiency Opportunities in the Building Sector. COM(2014) 445 Final. 2014. Available online: https://ec.europa.eu/environment/eussd/pdf/SustainableBuildingsCommunication.pdf (accessed on 22 April 2022).
  5. Heidorn, E.; Attivissimo, V.; Ganea, D.; da Silva, M.; Begolli, A.; Gengler, C.; Colantonio, M. Energy, Transport and Environment Statistics. Statistical Books/Eurostat: 2019 Edition; Publications Office of the European Union: Luxemburg, 2019; ISBN 9789276109716. [Google Scholar]
  6. VEA. Renovatiepact Eindverslag Fase 1|16 December 2014—29 June 2015 (Translated Title: Renovation Pact Final Report Fase 1). 2015. Available online: https://www.energiesparen.be/sites/default/files/atoms/files/Eindverslag_eerstefaseRenovatiepact_290615_0.pdf (accessed on 22 April 2022).
  7. VEA. Verslag Studiedag 5 Jaar Renovatiepact (Translated Title: Report Seminar 5 Years Renovation Pact); Vlaams Energie Agentschap: Brussels, Belgium, 2019. [Google Scholar]
  8. Federal Government. Nationaal Energie- en Klimaatplan 2021–2030 (translated title: National Energy and Climate Plan 2021–2030). 2019. Available online: https://www.nationaalenergieklimaatplan.be/admin/storage/nekp/nekp-finaal-plan.pdf (accessed on 30 May 2022).
  9. Röck, M.; Saade, M.R.M.; Balouktsi, M.; Rasmussen, F.N.; Birgisdottir, H.; Frischknecht, R.; Habert, G.; Lützkendorf, T.; Passer, A. Embodied GHG Emissions of Buildings—The Hidden Challenge for Effective Climate Change Mitigation. Appl. Energy 2020, 258, 114107. [Google Scholar] [CrossRef]
  10. SIA. SIA 2040: Effizienzpfad Energie; SIA: Silver Spring, MD, USA, 2017. [Google Scholar]
  11. CEN EN15978; Sustainability of Construction Works—Assessment of Environmental Performance of Buildings—Calculation Method. European Committee for Standardization (CEN): Brussels, Belgium, 2011.
  12. Wulf, C.; Werker, J.; Ball, C.; Zapp, P.; Kuckshinrichs, W. Review of Sustainability Assessment Approaches Based on Life Cycles. Sustainability 2019, 11, 5717. [Google Scholar] [CrossRef] [Green Version]
  13. Vilches, A.; Garcia-Martinez, A.; Sanchez-Montañes, B. Life Cycle Assessment (LCA) of Building Refurbishment: A Literature Review. Energy Build. 2017, 135, 286–301. [Google Scholar] [CrossRef]
  14. Gusbin, D.; Devogelaer, D. Het Belgische Energielandschap Tegen 2050 (Translated Title: The Belgian Energy Scene by 2050). 2017. Available online: https://www.plan.be/uploaded/documents/201710270928090.For_Energy_2017_11531_F.pdf (accessed on 22 April 2022).
  15. Devogelaer, D.; Gusbin, D. Cost-Benefit Analysis of a Selection of Policy Scenarios on an Adequate Future Belgian Power System Economic Insights on Different Capacity Portfolio and Import Scenarios. 2017. Available online: https://www.plan.be/uploaded/documents/201702231020450.CBA_2017.pdf (accessed on 22 April 2022).
  16. Su, S.; Zhang, H.; Zuo, J.; Li, X.; Yuan, J. Assessment Models and Dynamic Variables for Dynamic Life Cycle Assessment of Buildings: A Review. Environ. Sci. Pollut. Res. 2021, 28, 26199–26214. [Google Scholar] [CrossRef]
  17. Sohn, J.; Kalbar, P.; Goldstein, B.; Birkved, M. Defining Temporally Dynamic Life Cycle Assessment: A Review. Integr. Environ. Assess. Manag. 2020, 16, 314–323. [Google Scholar] [CrossRef]
  18. Pehnt, M. Dynamic Life Cycle Assessment (LCA) of Renewable Energy Technologies. Renew. Energy 2006, 31, 55–71. [Google Scholar] [CrossRef]
  19. Asdrubali, F.; Baggio, P.; Prada, A.; Grazieschi, G.; Guattari, C. Dynamic Life Cycle Assessment Modelling of a NZEB Building. Energy 2020, 191, 116489. [Google Scholar] [CrossRef]
  20. Reinert, C.; Deutz, S.; Minten, H.; Dörpinghaus, L.; von Pfingsten, S.; Baumgärtner, N.; Bardow, A. Environmental Impacts of the Future German Energy System from Integrated Energy Systems Optimization and Dynamic Life Cycle Assessment. Comput. Chem. Eng. 2021, 153, 107406. [Google Scholar] [CrossRef]
  21. Collinge, W.O.; Rickenbacker, H.J.; Landis, A.E.; Thiel, C.L.; Bilec, M.M. Dynamic Life Cycle Assessments of a Conventional Green Building and a Net Zero Energy Building: Exploration of Static, Dynamic, Attributional, and Consequential Electricity Grid Models. Environ. Sci. Technol. 2018, 52, 11429–11438. [Google Scholar] [CrossRef]
  22. Lueddeckens, S.; Saling, P.; Guenther, E. Temporal Issues in Life Cycle Assessment—A Systematic Review. Int. J. Life Cycle Assess. 2020, 25, 1385–1401. [Google Scholar] [CrossRef]
  23. Janjua, S.Y.; Sarker, P.K.; Biswas, W.K. Sustainability Implications of Service Life on Residential Buildings—An Application of Life Cycle Sustainability Assessment Framework. Environ. Sustain. Indic. 2021, 10, 100109. [Google Scholar] [CrossRef]
  24. Levasseur, A.; Lesage, P.; Margni, M.; Deschěnes, L.; Samson, R. Considering Time in LCA: Dynamic LCA and Its Application to Global Warming Impact Assessments. Environ. Sci. Technol. 2010, 44, 3169–3174. [Google Scholar] [CrossRef] [PubMed]
  25. Kendall, A. Time-Adjusted Global Warming Potentials for LCA and Carbon Footprints. Int. J. Life Cycle Assess. 2012, 17, 1042–1049. [Google Scholar] [CrossRef]
  26. Shah, V.P.; Ries, R.J. A Characterization Model with Spatial and Temporal Resolution for Life Cycle Impact Assessment of Photochemical Precursors in the United States. Int. J. Life Cycle Assess. 2009, 14, 313–327. [Google Scholar] [CrossRef]
  27. Lebailly, F.; Levasseur, A.; Samson, R.; Deschênes, L. Development of a Dynamic LCA Approach for the Freshwater Ecotoxicity Impact of Metals and Application to a Case Study Regarding Zinc Fertilization. Int. J. Life Cycle Assess. 2014, 19, 1745–1754. [Google Scholar] [CrossRef]
  28. Shimako, A.H.; Tiruta-Barna, L.; Ahmadi, A. Operational Integration of Time Dependent Toxicity Impact Category in Dynamic LCA. Sci. Total Environ. 2017, 599–600, 806–819. [Google Scholar] [CrossRef]
  29. ISO 14040; Environmental Management—Life Cycle Assessment—Principles and Framework 2006. ISO: Geneva, Switzerland, 2006; Volume 20.
  30. ISO 14044; Environmental Management—Life Cycle Assessment—Requirements and Guidelines. ISO: Geneva, Switzerland, 2006.
  31. NBN EN 15804+A1; Duurzaamheid van Bouwwerken—Milieuverklaringen van Producten—Basisregels Voor de Productgroep Bouwproducten. Bureau for Standardization (NBN): Brussels, Belgium, 2014. Available online: https://www.nbn.be/shop/nl/norm/nbn-en-15804-a1-2014_37370/ (accessed on 22 April 2022).
  32. Lam, W.; Trigaux, D. Environmental Profile of Buildings [Update 2021]. 2021. Available online: https://www.totem-building.be/services/rest/downloads/download?id=1&lang=EN&transId=1 (accessed on 22 April 2022).
  33. Moreno Ruiz, E.; Valsasina, L.; FitzGerald, D.; Brunner, F.; Symeonidis, A.; Bourgault, G.; Wernet, G. Documentation of Changes Implemented in the Ecoinvent Database v3.6. 2019. Available online: https://ecoinvent.org/wp-content/uploads/2021/09/change_report_v3_6_20190912.pdf (accessed on 22 April 2022).
  34. OVAM. Environmental Profile of Building Elements; Openbare Vlaamse Afvalstoffenmaatschappij (OVAM): Brussels, Belgium, 2018. [Google Scholar]
  35. Habert, G.; Röck, M.; Steininger, K.; Lupísek, A.; Birgisdottir, H.; Desing, H.; Chandrakumar, C.; Pittau, F.; Passer, A.; Rovers, R.; et al. Carbon Budgets for Buildings: Harmonising Temporal, Spatial and Sectoral Dimensions. Build. Cities 2020, 1, 429–452. [Google Scholar] [CrossRef]
  36. Rockström, J.; Steffen, W.; Noone, K.; Persson, Å.; Chapin, F.S.; Lambin, E.; Lenton, T.M.; Scheffer, M.; Folke, C.; Schellnhuber, H.J.; et al. Planetary Boundaries: Exploring the Safe Operating Space for Humanity. Ecol. Soc. 2009, 14, 32. [Google Scholar] [CrossRef]
  37. Desing, H.; Widmer, R.; Beloin-Saint-Pierre, D.; Hischier, R.; Wäger, P. Powering a Sustainable and Circular Economy—An Engineering Approach to Estimating Renewable Energy Potentials within Earth System Boundaries. Energies 2019, 12, 4723. [Google Scholar] [CrossRef] [Green Version]
  38. De Koning, A.; Kleijn, R.; Huppes, G.; Sprecher, B.; van Engelen, G.; Tukker, A. Metal Supply Constraints for a Low-Carbon Economy? Resour. Conserv. Recycl. 2018, 129, 202–208. [Google Scholar] [CrossRef]
  39. Nansai, K.; Nakajima, K.; Kagawa, S.; Kondo, Y.; Shigetomi, Y.; Suh, S. Global Mining Risk Footprint of Critical Metals Necessary for Low-Carbon Technologies: The Case of Neodymium, Cobalt, and Platinum in Japan. Environ. Sci. Technol. 2015, 49, 2022–2031. [Google Scholar] [CrossRef] [PubMed]
  40. De Nocker, L.; Debacker, W. Annex: Monetisation of the MMG Method (Update 2017). 2018. Available online: https://publicaties.vlaanderen.be/view-file/26888 (accessed on 22 April 2022).
  41. Trigaux, D. Elaboration of a Sustainability Assessment Method for Neighbourhoods. Ph.D. Thesis, KU Leuven—Faculty of Engineering Science, Leuven, Belgium, 2017. [Google Scholar]
  42. Allacker, K. Sustainable Building—the Development of an Evaluation Method. 2010. Available online: https://limo.libis.be/primo-explore/fulldisplay?docid=LIRIAS1713941&context=L&vid=Lirias&search_scope=Lirias&tab=default_tab&fromSitemap=1 (accessed on 22 April 2022).
  43. BSI EN 15643-1; Sustainability of Construction Works—Sustainability Assessment of Buildings—Part 1: General Framework. British Standards Institution: London, UK, 2010.
  44. DPWB. Ontwerp En Thermische Uitrusting van Gebouwen—Deel 1 (Translated Title: Design and Technical Equipment of Buildings—Part 1); DPWB: Brussels, Belgium, 1984; Volume 1. [Google Scholar]
  45. DPWB. Ontwerp En Thermische Uitrusting van Gebouwen—Deel 2 (Translated Title: Design and Technical Equipment of Buildings—Part 2); DPWB: Brussels, Belgium, 1984; Volume 1. [Google Scholar]
  46. Feist, W.; Schnieders, J.; Loga, T.; Bisanz, C.; Mangold, D.; Ebel, W. Energiebilanzen Mit Dem Passivhaus Projektierungs Paket (Translated Title: Energy Balance with the Passive House Project Package); Passive House Institute: Darmstadt, Germany, 2001. [Google Scholar]
  47. VREG. Cijfers En Statistieken: Evolutie Energieverbruik (Translated Title: Data and Statistics: Evolution Energy Use). 2021. Available online: https://www.vreg.be/nl/energiemarkt-cijfers (accessed on 22 April 2022).
  48. NBN EN 16627; Sustainability of Construction Works—Assessment of Economic Performance of Buildings—Calculation Methods. Bureau voor Normalisatie: Brussels, Belgium, 2015.
  49. Delghust, M.; Roelens, W.; Tanghe, T.; de Weerdt, Y.; Janssens, A. Regulatory Energy Calculations versus Real Energy Use in High-Performance Houses. Build. Res. Inf. 2015, 43, 675–690. [Google Scholar] [CrossRef]
  50. Hens, H.; Parijs, W.; Deurinck, M. Energy Consumption for Heating and Rebound Effects. Energy Build. 2010, 42, 105–110. [Google Scholar] [CrossRef] [Green Version]
  51. Brounen, D.; Kok, N.; Quigley, J.M. Residential Energy Use and Conservation: Economics and Demographics. Eur. Econ. Rev. 2012, 56, 931–945. [Google Scholar] [CrossRef]
  52. Deurinck, M.; Saelens, D.; Roels, S. Assessment of the Physical Part of the Temperature Takeback for Residential Retrofits. Energy Build. 2012, 52, 112–121. [Google Scholar] [CrossRef]
  53. Guerra-Santin, O.; Itard, L. Occupants’ Behaviour: Determinants and Effects on Residential Heating Consumption. Build. Res. Inf. 2010. [Google Scholar] [CrossRef]
  54. Lambie, E.; Saelens, D. Renoveren Resulteert in Een Verhoogd Comfort (Translated Title: Renovation Results in Better Comfort). 2020. Available online: https://www.kennisplatform-renovatie.be/wp-content/uploads/2020/09/6_Proeftuin-KUL-Comfort-A4-8.pdf (accessed on 22 April 2022).
  55. Lambie, E. Evaluation of the Impact of Energy Renovation Measures. Ph.D. Thesis, Faculty of Engineering Science, Leuven, Belgium, 2021. [Google Scholar]
  56. Lambie, E.; Senave, M.; van de Vyver, I.; Saelens, D. Experimental Analysis of Indoor Temperature of Residential Buildings as an Input for Building Simulation Tools. Energy Procedia 2017, 132, 123–128. [Google Scholar] [CrossRef]
  57. Hun, D.E.; Childs, P.W.; Atchley, J.A.; Desjarlais, A.O. Effects from the Reduction of Air Leakage on Energy and Durability; Office of Scientific and Technical Information: Oak Ridge, TN, USA, 2013. [Google Scholar]
  58. Stanton, D. Using Component Air Leakage Models to Predict the Post-Retrofit Airtightness of a High Rise Residential Building. Master’s Thesis, University of Toronto, Toronto, ON, Canada, 2018. [Google Scholar]
  59. Laverge, J.; Delghust, M.; van den Bossche, N.; Janssens, A. Airtightness Assessment of Single Family Houses in Belgium. Int. J. Vent. 2014, 4, 379–390. [Google Scholar] [CrossRef]
  60. Alfano, D.F.R.; Dell’Isola, M.; Ficco, G.; Tassini, F. Experimental Analysis of Air Tightness in Mediterranean Buildings Using the Fan Pressurization Method. Build. Environ. 2012, 53, 16–25. [Google Scholar] [CrossRef]
  61. VEA. EPB-Cijferrapport: Procedures, Resultaten En Energetische Karakteristieken van Het Vlaamse Gebouwbestand (Translated Title: EPB-Data Report: Procedures, Results and Energetic Characteristics of the Flemish Building Stock); Vlaams Energie Agentschap: Brussels, Belgium, 2019. [Google Scholar]
  62. Flemish Government. Bepalingsmethode van Het Peil van Primair Energieverbruik van Residentiële Eenheden. Bijlage V.—Bepalingsmethode EPW. 2019. Available online: https://energiesparen.login.kanooh.be/sites/default/files/atoms/files/Bijlage%20EPW%2020181130%20vergunningenNA2019.pdf (accessed on 22 April 2022).
  63. Van de moortel, E.; Allacker, K.; de Troyer, F.; Stijnen, L.; Schoofs, E. Improving the Energy Performance of Existing Buildings: Search for Opportunities for Social Housing Companies. In Proceedings of the Building Simulation 2019: 16th Conference of IBPSA, Rome, Italy, 2–4 September 2020; pp. 3803–3810. [Google Scholar]
  64. Collinge, W.O.; Landis, A.E.; Jones, A.K.; Schaefer, L.A.; Bilec, M.M. Dynamic Life Cycle Assessment: Framework and Application to an Institutional Building. Int. J. Life Cycle Assess. 2013, 18, 538–552. [Google Scholar] [CrossRef]
  65. Frischknecht, R.; Büsser, S.; Krewitt, W. Environmental Assessment of Future Technologies: How to Trim LCA to Fit This Goal? Int. J. Life Cycle Assess. 2009, 14, 584–588. [Google Scholar] [CrossRef]
  66. Ferrari, A.M.; Volpi, L.; Settembre-Blundo, D.; García-Muiña, F.E. Dynamic Life Cycle Assessment (LCA) Integrating Life Cycle Inventory (LCI) and Enterprise Resource Planning (ERP) in an Industry 4.0 Environment. J. Clean. Prod. 2021, 286, 125314. [Google Scholar] [CrossRef]
  67. Ramon, D.; Allacker, K. Integrating Long Term Temporal Changes in the Belgian Electricity Mix in Environmental Attributional Life Cycle Assessment of Buildings. J. Clean. Prod. 2021, 297, 126624. [Google Scholar] [CrossRef]
  68. Devogelaer, D.; Gusbin, D. Insights in a Clean Energy Future for Belgium—Impact Assessment of the 2030 Climate & Energy Framework. 2018. Available online: https://www.plan.be/uploaded/documents/201805171245060.WP_1805_11575.pdf (accessed on 22 April 2022).
  69. Molse Bouwmaatschappij. Average Energy Use Based on Data of the Energy Supplyer; Molse Bouwmaatschappij: Mol, Belgium, 2019. [Google Scholar]
  70. TOTEM. Levensduren Binnen TOTEM (Translated Title: Service Life in TOTEM). 2019. Available online: https://www.totem-building.be/ (accessed on 22 April 2022).
  71. Viessman. Brochure Warmtepompen (Translated Title Brochure Heat Pumps). 2020. Available online: https://www.viessmann.be/nl/services/brochures.html (accessed on 22 April 2022).
  72. Allacker, K.; Verellen, E. Renoseec Report Task 5.1.2; KU Leuven Technologiecampus: Ghent, Belgium, 2018. [Google Scholar]
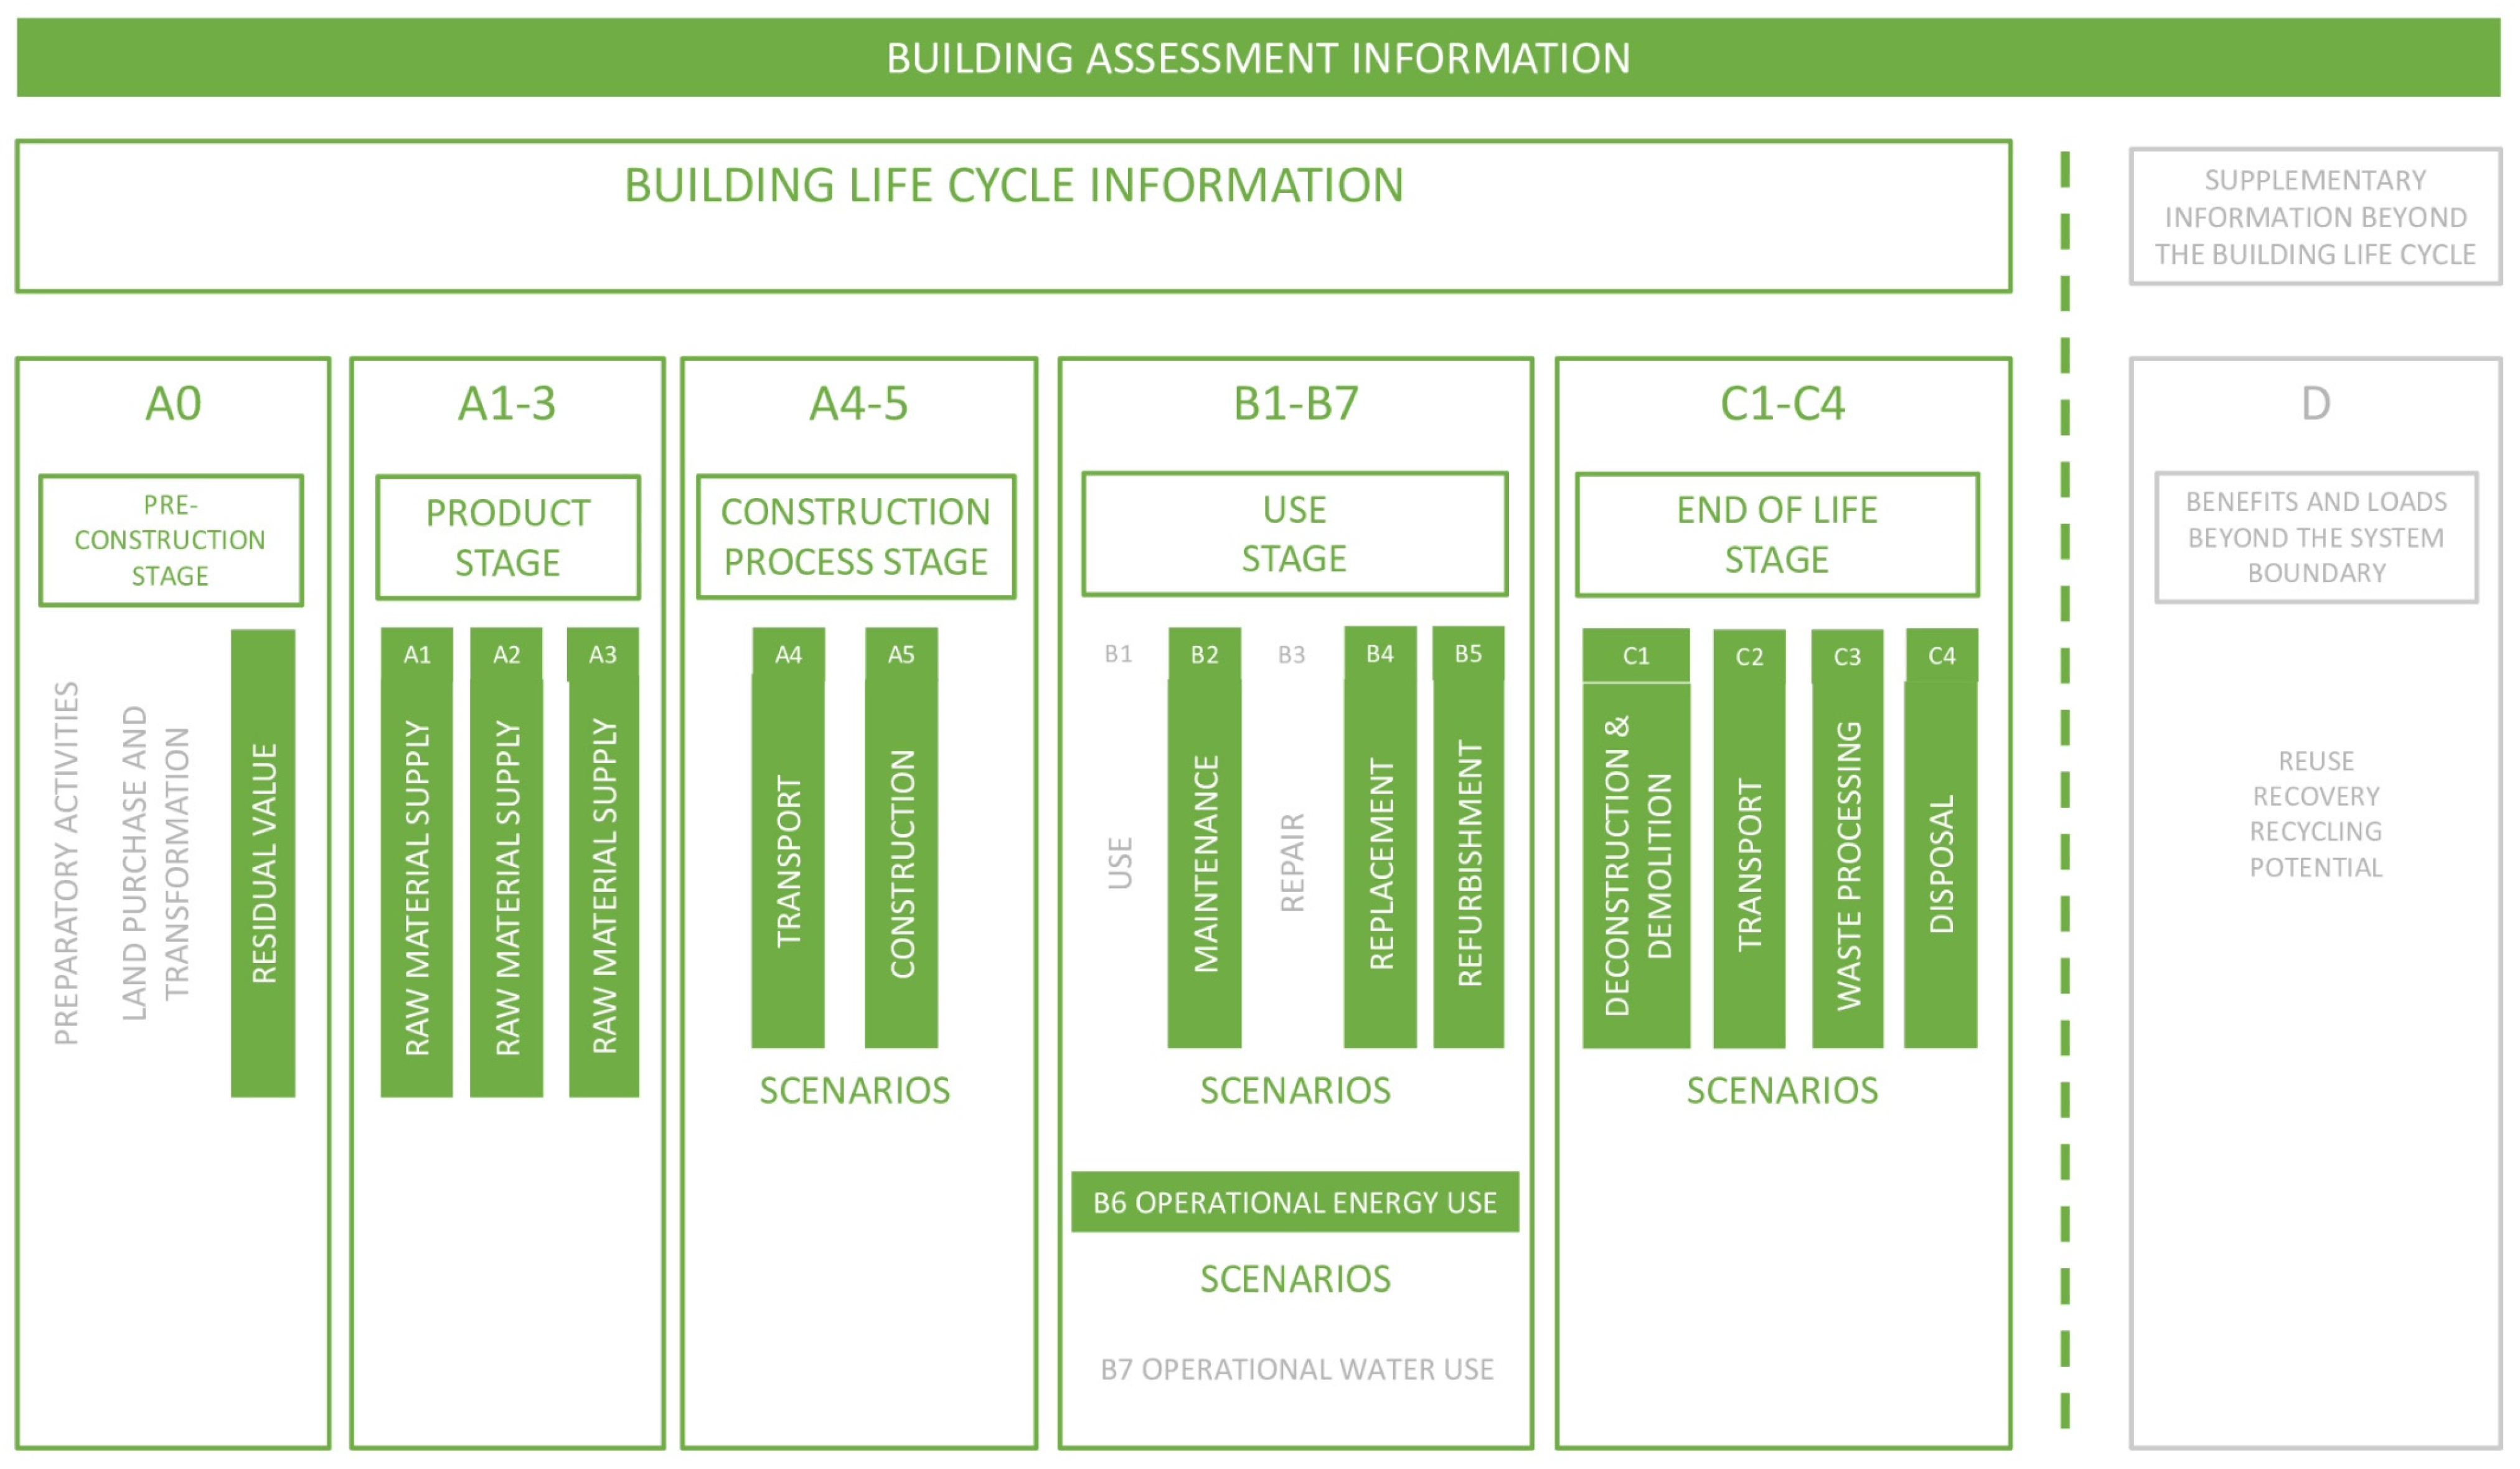
Figure 1. Schematic overview of the system boundaries based on the system boundaries presented in the TOTEM method [32] (p. 14).
Sustainability 14 06838 g001
Figure 2. Overview of the life cycle stages covered in the different timeframes.
Sustainability 14 06838 g002
Figure 3. Proposal for a shift of the reference study period.
Sustainability 14 06838 g003
Figure 4. Linear correlation between the average U-value of the building envelope and the temperature increase after renovation.
Sustainability 14 06838 g004
Figure 5. Overview of the mean air change rates at 50 Pa from different EU surveys (graph based on data from Laverge et al. [59] (Table 1, p. 380), Alfano et al. [60] (Table 5, p. 21), and the Belgian EPB repository [61]).
Sustainability 14 06838 g005
Figure 6. Overview of average U-values and n50 values based on data from the Belgian EPB repository [61] and our measurements in social housing.
Sustainability 14 06838 g006
Figure 7. Number of EHDDs after renovation in the dynamic approach.
Sustainability 14 06838 g007
Figure 8. Number of EHDDs and NYEUH before and after renovation with the static and dynamic approach.
Sustainability 14 06838 g008
Figure 9. The efficiency of the heating system and GYEUH of the case study building estimated with the static and dynamic approaches before and after renovation.
Sustainability 14 06838 g009
Figure 10. Effects of the dynamic approach on EI for heating, including energy and systems.
Sustainability 14 06838 g010
Figure 11. Effect of changes in the production of electricity.
Sustainability 14 06838 g011
Figure 12. Environmental impact per life cycle stage over the total service life of the building.
Sustainability 14 06838 g012
Figure 13. Total accumulated environmental impact over 60 years.
Sustainability 14 06838 g013
Table 1. Overview of central monetary values [40] (Tables 3 and 4, p. 12).
Environmental IndicatorUnitMonetary Value (€/Unit)
CENGlobal warmingkg CO2 eqv.0.050
Depletion of the stratospheric ozone layerkg CFC-11 eqv.49.10
Acidification of land and water sourceskg SO2 eqv.0.43
EutrophicationKg (PO4)3- eqv.20
Formation of tropospheric ozone
photochemical oxidants
kg ethene eqv.0.48
Abiotic depletion of non-fossil resourceskg Sb eqv.1.56
Abiotic depletion of fossil resourcesMJ, net caloric value0
CEN+Human toxicity
Cancer effectsCTUh665,109
Non-cancer effectsCTUh144,081
Particulate matterkg PM2.5 eqv.34
Ionising radiation, effect on human healthkg U235 eqv.9.7 × 10−4
Ecotoxicity: freshwaterCTUe3.70 × 10−5
Water scarcitym3 water eqv.0.067
Land use: occupation:
soil organic matterkg C deficit1.4 × 10−6
biodiversity
- urban: loss ESm2.a0.30
- agriculturalm2.a6.0 × 10−3
- forest: biodiversitym2.a2.2 × 10−4
Land use: transformation:
soil organic matterkg C deficit1.4 × 10−6
biodiversity
- urban:m2n.a.
- agriculturalm2n.a.
- forest, excl. tropicalm2n.a.
- tropical rainforestm227
Table 2. Overview of dynamic parameters considered.
ParametersStatic MMG MethodProposed Dynamic Parameter
Daily average indoor temperature18 °C before and after renovation+1 °C after renovation, (sensitivity analysis: +2 °C to model changes in user behaviour)
AirtightnessDefault v50 = 12 before and after renovationImprovement after renovation, depending on the mean U-value
Number of EHHD1200Depending on the mean U-value, airtightness, and average indoor temperature
Efficiency heating systemIdentical before and after renovationImprovement at the moment of replacement
Production process construction productsNo changes in the building service lifeReduced impact of materials due to cleaner production in the future
Electricity mixNo changes in the building service lifeChanges in the electricity mix due to the phase-out of nuclear electricity production
Energy source for space heatingNo changes in the building service lifeLast replacement heating system before 2050 with the heat pump due to the phase-out of natural gas
Table 3. Elements of the building envelope for the case study, from outside to inside.
ElementConstructionU Value (W/m2K)
Floor on grade
56 m2
-
Concrete slab 10 cm
-
Support layer for cement-based screed 5 cm
-
Tiles 1.2 cm
3.46
External walls
58 m2
-
Brick veneer 9 cm
-
Non-ventilated cavity 7 cm
-
Loadbearing brickwork 14 cm
-
Gypsum plaster 1.5 cm
1.10
Flat roof
56 m2
-
Bitumen roofing 0.2 cm
-
Mineral wool insulation 5 cm
-
Bitumen vapour barrier 0.2 cm
-
Concrete sloping layer 12 cm
-
Concrete slab 15 cm
-
Gypsum plaster 1.5 cm
0.60
Windows
18 m2
Aluminium frame with standard double glazing3.93
Doors
8 m2
Aluminium frame with standard double glazing and aluminium panels3.93
Table 4. Solar gains for the case study building.
MonthSolar Gains South Facade (MJ)Solar Gains North Facade (MJ)
January386.9082.57
February568.54136.98
March837.40259.29
April975.12380.98
May1099.51550.53
June1049.25597.80
July1062.68581.24
August1087.52476.20
September1027.32319.13
October815.47200.03
November481.8899.13
December314.2464.30
Table 5. Overview of NZEB renovation measures for the various building elements.
ElementRenovation MeasuresFinal U Value (W/m2K)
Floor on grade
56 m2
Remove existing tiles and screed,
New insulation: PUR 10 cm, ƛ 0.03 W/m2K
New cement-based screed and ceramic tiles
0.22
External walls
58 m2
Keep existing cavity wall
New external insulation: mineral wool 14 cm, ƛ 0,04 W/m2K, finished with façade tiles
0.23
Flat roof
56 m2
Keep existing insulation and roof covering
New insulation: mineral wool 10 cm,
ƛ 0,04 W/m2K
New EPDM roof covering
0.24
Windows
18 m2
Thermally-interrupted aluminium frame with improved double glazing1.5
Doors
8 m2
Thermally-interrupted aluminium frame with improved double glazing and insulated aluminium panels1.5
Table 6. Number of EHDDs for a range of U-values and indoor temperatures.
Um (W/m2K)
1657.681.241.050.850.650.40
Ti (°C)14123111691087981780
151443138112931167931
1616551593150513791102
1718911816171715911302
1821392059195318031514
1924122326220320421726
2027102611247622991938
2130472922277325722179
Table 7. Results sensitivity assessment.
Change in ParameterEffect on Result
Growth rate efficiency heat pump 0.5 instead
of 0.796%
EI for NZEB renovation with a heat pump over 60 years is 14% lower than the EI of the NZEB renovation with the gas boiler when a growth rate for the efficiency of the heat pump of 0.5% is assumed. The difference in the EI with the heat pump compared to a condensing gas boiler is 2% smaller than the originally assumed growth rate (0.796%). However, this does not result in a different decision on the renovation.
EI for NZEB renovation with a heat pump over 60 years in a dynamic approach is 11% lower than estimated with the static approach when a growth rate of 0.5% is assumed. When a growth rate of 0.796% is assumed, the EI estimated with the dynamic approach is 13% lower than estimated with the static approach.
Growth rate cleaner production −1% instead of −0.1%Increasing the growth rate for cleaner production results in a reduction of the EI over 60 years of 1% for the low-cost renovation and 2% for the NZEB renovation.
Growth rate cleaner production −10% tov −0.1%Reduction in EI over 60 years: −4% for no renovation and low impact renovation, −9% for NZEB renovation.
Change SPF heat pump to 3.27 instead of 2.86The EI for the NZEB renovation with a heat pump with an SPF of 3.27, assuming the 1.5 °C target scenario for electricity production is 26% lower than the EI estimated with the static approach. In the BAU scenario, an increase of the EI of 3% was found compared to the static approach. These results are comparable with results assuming an SPF of 2.86.
Publisher’s Note: MDPI stays neutral with regard to jurisdictional claims in published maps and institutional affiliations.