Article

GIS-Based Model for Constructing Ecological Efficiency Maps of Urban Green Areas: The Case Study of Western Naples, Italy

by
Valeria D’Ambrosio
,
Ferdinando Di Martino
* and
Marina Rigillo
Department of Architecture, University of Naples Federico II, 80134 Naples, Italy
*
Author to whom correspondence should be addressed.
Sustainability 2022, 14(11), 6830; https://doi.org/10.3390/su14116830
Submission received: 29 March 2022 / Revised: 26 May 2022 / Accepted: 31 May 2022 / Published: 2 June 2022
(This article belongs to the Special Issue Urban Landscape Ecology and Sustainability)

Abstract

:
This research implements a GIS framework model aimed at evaluating the ecological efficiency of urban green areas. The model classifies urban green areas by identifying those that can provide ecosystem services to sustain green infrastructure at an urban district level. This model can also guide decision makers in the proper placement of the green infrastructure. The model works on the interrelation of four indicators of size, shape, vegetation structure and vegetation diversity, and it was tested in the case study of the Western Urban Districts of Naples (Italy). The selection of this study area is because it presents four urban districts that are different for physiography, urban patterns, land use, land cover and for the existing building stock. The proposed GIS-based framework can be a useful tool for planning actions and measures to protect, implement and restore existing green areas through integration into urban green infrastructure.

1. Introduction

The increasing awareness of cities’ vulnerability to climate change calls for considering green infrastructure as an effective strategy to reduce climate risk and improve climate adaptation locally [1,2]. In fact, the capacity of vegetated areas in providing Ecosystem Services (ESs) makes urban green areas crucial for decreasing the impacts coming from heat waves and pluvial flooding, as well as for reducing CO2 emissions [3,4,5,6]. Over the past decade, many urban regeneration projects have included the design of green infrastructure, and many municipalities have implemented existing green areas to provide multi-objective public spaces for reducing climate risk and improving cities quality. (i.e., New York, Barcelona, London, to name a few) [7,8,9].
The European Union attributes a key role to green infrastructure, considering the latter as a win–win solution for achieving both climate adaptation and the EU’s commitments to sustainable cities [10,11,12,13,14]. EU strategies use the term “infrastructure” with an emphasis on the value of urban green networks as a common good able at generating a wide range of benefits (environmental, social and economic). This is found in the EU technical notes accompanying the Green Strategy for Infrastructure [15], and in other studies emphasizing the value of ES by considering both their use and non-use [16,17,18,19,20].
In addition, the importance of forecasting the environmental effects of the urban green networks underlines the need to properly place these infrastructures in the city. This is particularly relevant when urban green infrastructures are planned for reducing the impacts of heat waves [1,2,5,21]. In fact, the capacity of urban green spaces to provide cooling effects depends on both the types of ESs provided by and their placement in the green net [22]. This is because urban green areas differ each other for the capacity to contrast heat waves, and not all areas have the requirements to be part of a green infrastructure. Several studies have shown that the form of green areas (size and shape), as well as the vegetation diversity, greatly influence the capacity to provide cooling effects [23,24,25,26,27,28]. In the same way, areas featured by vegetation diversity are more resistant to climatic impacts, as well as those featured for having high NDVI values [27,28,29,30,31]. Further, compact green areas (corresponding to rectangular and circular shapes) are stronger than those with irregular shapes, and larger green areas are more resilient than smaller ones [24,25,29,30,31].
According to these remarks, the paper focuses on the need to detect within the existing stock of urban green spaces those which are more suitable to be part of a green infrastructure planned at urban district scale. This study assumes that the ability to reduce the impacts of heat waves is primarily dependent on the presence of well-vegetated areas in the city. This is because cooling effects and stormwater management are ensured by the synergistic action of various vegetation species, including trees [27,28,29,30]. As not all existing urban green areas are able to provide cooling effects, it is very important to distinguish those areas that have the physical and vegetational characteristics for being effective in ecological terms.
This study uses a GIS-based model to classify the ecological efficiency of urban greenspaces (patches as for landscape terminology). The model combines four indicators to recognize urban green areas capable of delivering cooling effects. This led to a patch-based approach to developing a district-scale urban green infrastructure. This approach seems to suit the features of urban landscapes where green spaces are scattered and rare [31].
The purpose of this model is to map the ecological potential of the existing urban green spaces, that is considered a primary requirement for planning green infrastructure at the local level. This map, called “Ecological Efficiency Map”, can facilitate the project of green infrastructure because it leads to improve the specific and analytic knowledge of the existing areas. In addition, the proposed model identifies the core elements of a green infrastructure at the urban district level and provide information to prioritize actions and measures in planning.
The specific aims of the research are listed below:
-
Implementation of a light hierarchical GIS model that can evaluate the ecological efficiency of urban green spaces. Based on their dimensional and vegetal characteristics, the model provides a map of the ecological potential of existing urban greenspaces.
-
Support urban green infrastructures design strategies by prioritizing the existing green areas that deliver evo-transpiring services. The GIS-based model aims to increase specific knowledge to recognize the ecological efficiency of urban green areas.
Apart from the introduction, the document consists of four sections. The first describes the main definitions and assumptions used in the research, particularly those of green infrastructure and ecological efficiency. Section 3 is dedicated to the explication of the methodology adopted. This illustrates the GIS-based model and the relationship between the selected indicators. Section 4 provides information on the results coming from the application of the model to the case study area in western Naples, Italy. Section 5 is devoted to discussing the results, Section 6 is focused on future developments of the research.

2. Definitions and Assumptions

2.1. Adopted Definition of Green Infrastructure

Green Infrastructure has had multiple definitions according to the areas of study interested in, and its references to scale [31,32,33,34,35,36]. In general terms, green infrastructure definitions range from nature-based engineering solutions—mainly at the technology level—to regional green networks [31,37]. To properly position the concept in the research, the paper assumes the definition of green infrastructure provided by the European Commission, that is a: “strategically planned net-work of natural and semi-natural areas with other environmental features designed and managed to deliver a wide range of ecosystem services” [12]. Further, the paper assumes the European Environmental Agency [10] definition by which “Green infrastructure is a concept addressing the connectivity of ecosystems, their protection and the provision of ecosystem services, while also addressing mitigation and adaptation to climate change. It contributes to minimizing natural disaster risks, by using ecosystem-based approaches […] while increasing the resilience of ecosystems”. Finally, the paper considers the definition provided by the EU Directorate-General for the Environment, stating “Green infrastructure is a concept addressing the connectivity of ecosystems, their protection and the provision of ecosystem services, while also addressing mitigation and adaptation to climate change […] (and) it also promotes integrated spatial planning by identifying multifunctional zones, and by incorporating habitat restoration measures and other connectivity elements into various land-use plans and policies” [11].
These definitions stress the role of “ecosystem connectivity” of the green infrastructures and their capacity in both coping with climate change effects and facilitating the physical adaptation of the urban environment [31,32,37,38]. Connecting spaces and services reinforces the idea that different zones provide different services according to their ecological character and specific location in the network [11,21,22,28,38]. Therefore, a green infrastructure is here defined as a network of ecosystems at the urban scale, where different typologies of green spaces support the production of ESs; they vary depending on their location in the network and their specific characteristics. These remarks have their roots in the theories of landscape ecology, and they identify some components of green infrastructure generally described as core areas, buffer zones, intermediate zones, hubs and corridors [1,3,28,37,39,40,41].
For the purposes of this study, the paper adopts the components under the green infrastructure framework and assumes the following definitions:
-
Core areas, with reference to the most robust and resilient areas of the system, whose efficiency supports the production of ES.
-
Intermediate zones, referring to small and medium-sized areas that represent important elements for improving connectivity in the network due to their strategic location and/or their ecological efficiency.
-
Hubs, consisting of small to very small zones acting as a point connection to support the production of ES locally in the network.

2.2. Adopted Definition of Ecological Efficiency

With the term “eco-efficiency”, the scientific literature generally defines the efficiency with which energy is transferred from one trophic level to another in an ecosystem [42,43]. In the context of studies on ecosystem services, the term efficiency has been related to the overall performance provided by ecosystems, comparing the distance between the services produced and the resources used (including economic ones) [44,45]. In addition, and more broadly, ecological efficiency is the capacity of an ecosystem to provide ecosystem services that can meet the sustainability goals for the cities [19].
Therefore, the paper uses the term “ecological efficiency” to indicate the capacity of the existing urban green areas to provide ESs with specific reference to climate regulation [3,16,17,46]. The term ecological efficiency is here used to put the attention to a set of dimensional and vegetational characteristics of the urban green areas to provide climate regulating services, and to be considered as a potential component of a green urban infrastructure. In the proposed model, we assess the ecological efficiency of an urban green area by defining two intermediate indicators: dimension efficiency and vegetation efficiency. The dimension efficiency is measured considering the dimensional characteristics of the urban green area through the indicators of size and compactness; the vegetation efficiency is measured by considering the vegetation characteristics through the indicators of vegetation structure (measuring the presence of photosynthetic activity) and vegetation diversity (measuring the biodiversity potential).
The model and its implementing process are discussed in the Section 3.1.

3. Material and Methods

3.1. The Proposed Model

As mentioned above, the study aims to identify potential local green infrastructure components, providing their provisional classification as core zones, intermediate zones and hubs. The study does not produce original data, but it rather uses existing datasets available for free. This study is based on a mapping approaches (physical and ecosystem based) consistent with the three key GI principles of connectivity, multifunctionality and spatial planning as stated in a recent EU funded report [47]. The GIS-based model responds to the need for replicability in different urban environments.
The research proposes a five (5) steps model:
  • Design of a GIS-based model in a hierarchical structure (Figure 1). To evaluate the ecological efficiency of urban green areas we have constructed a hierarchical model of indicators, following the approach presented in [48]. The final indicator, called ecological efficiency, is calculated in relation to two intermediate indicators, called dimension efficiency and vegetation efficiency. These latter give the contribute of the dimension and the shape of the green areas, and the contribute of the type and the diversity of the vegetation in the green areas.
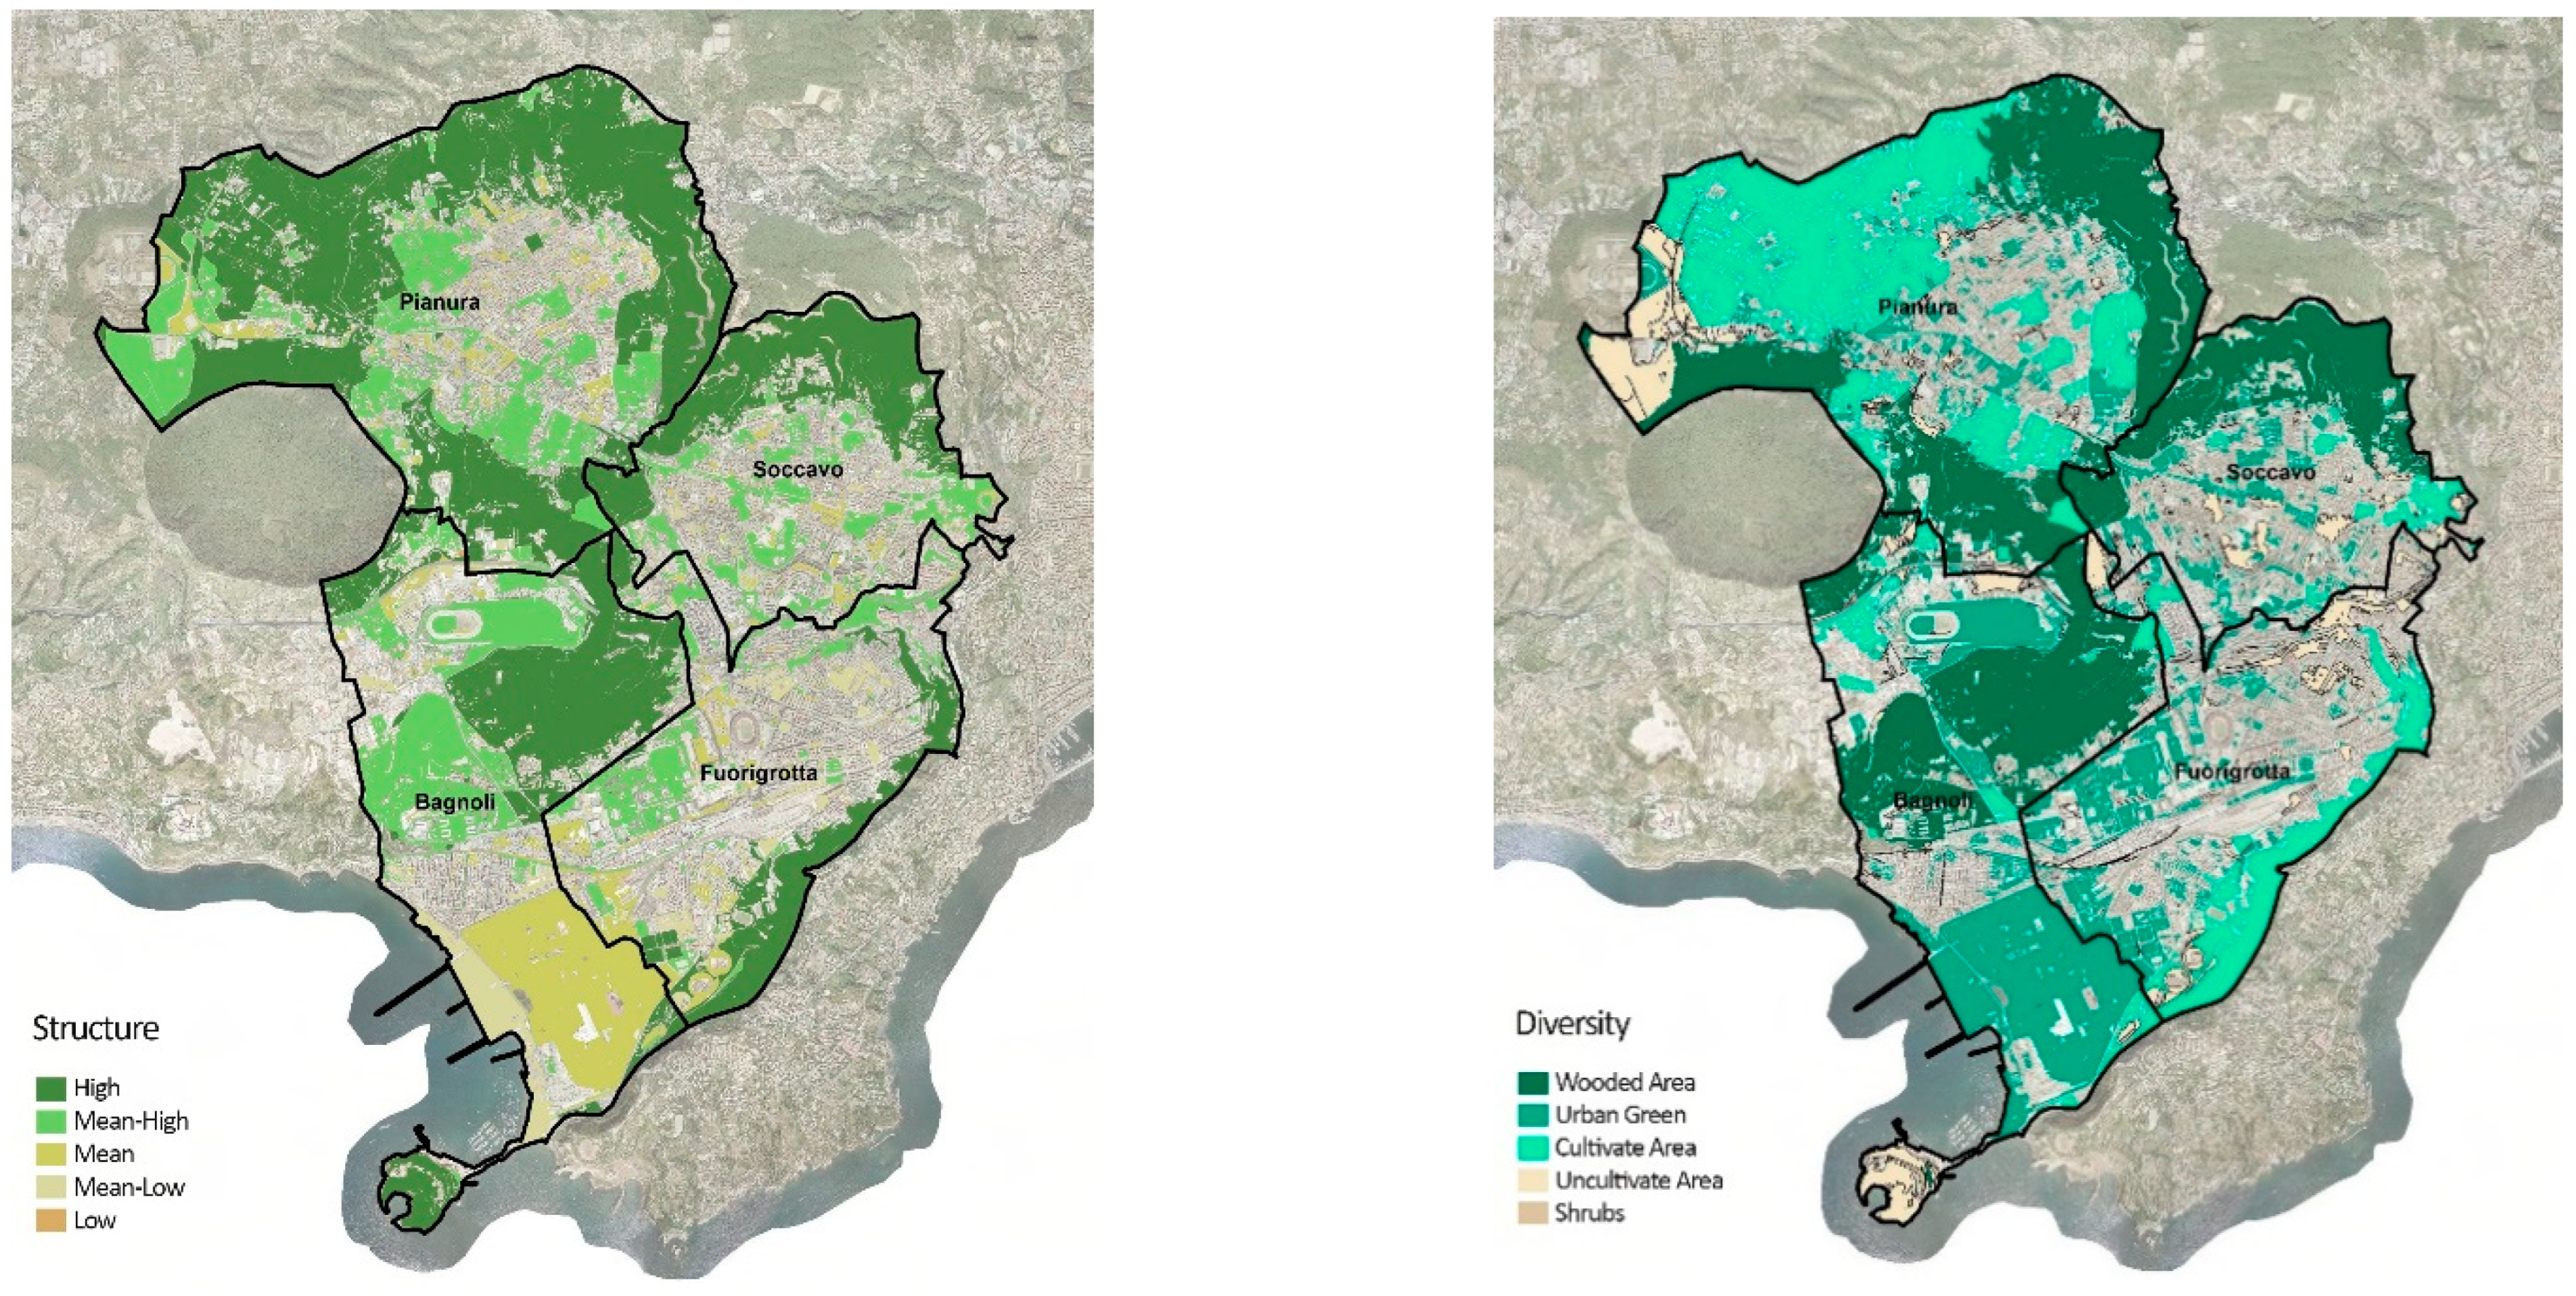
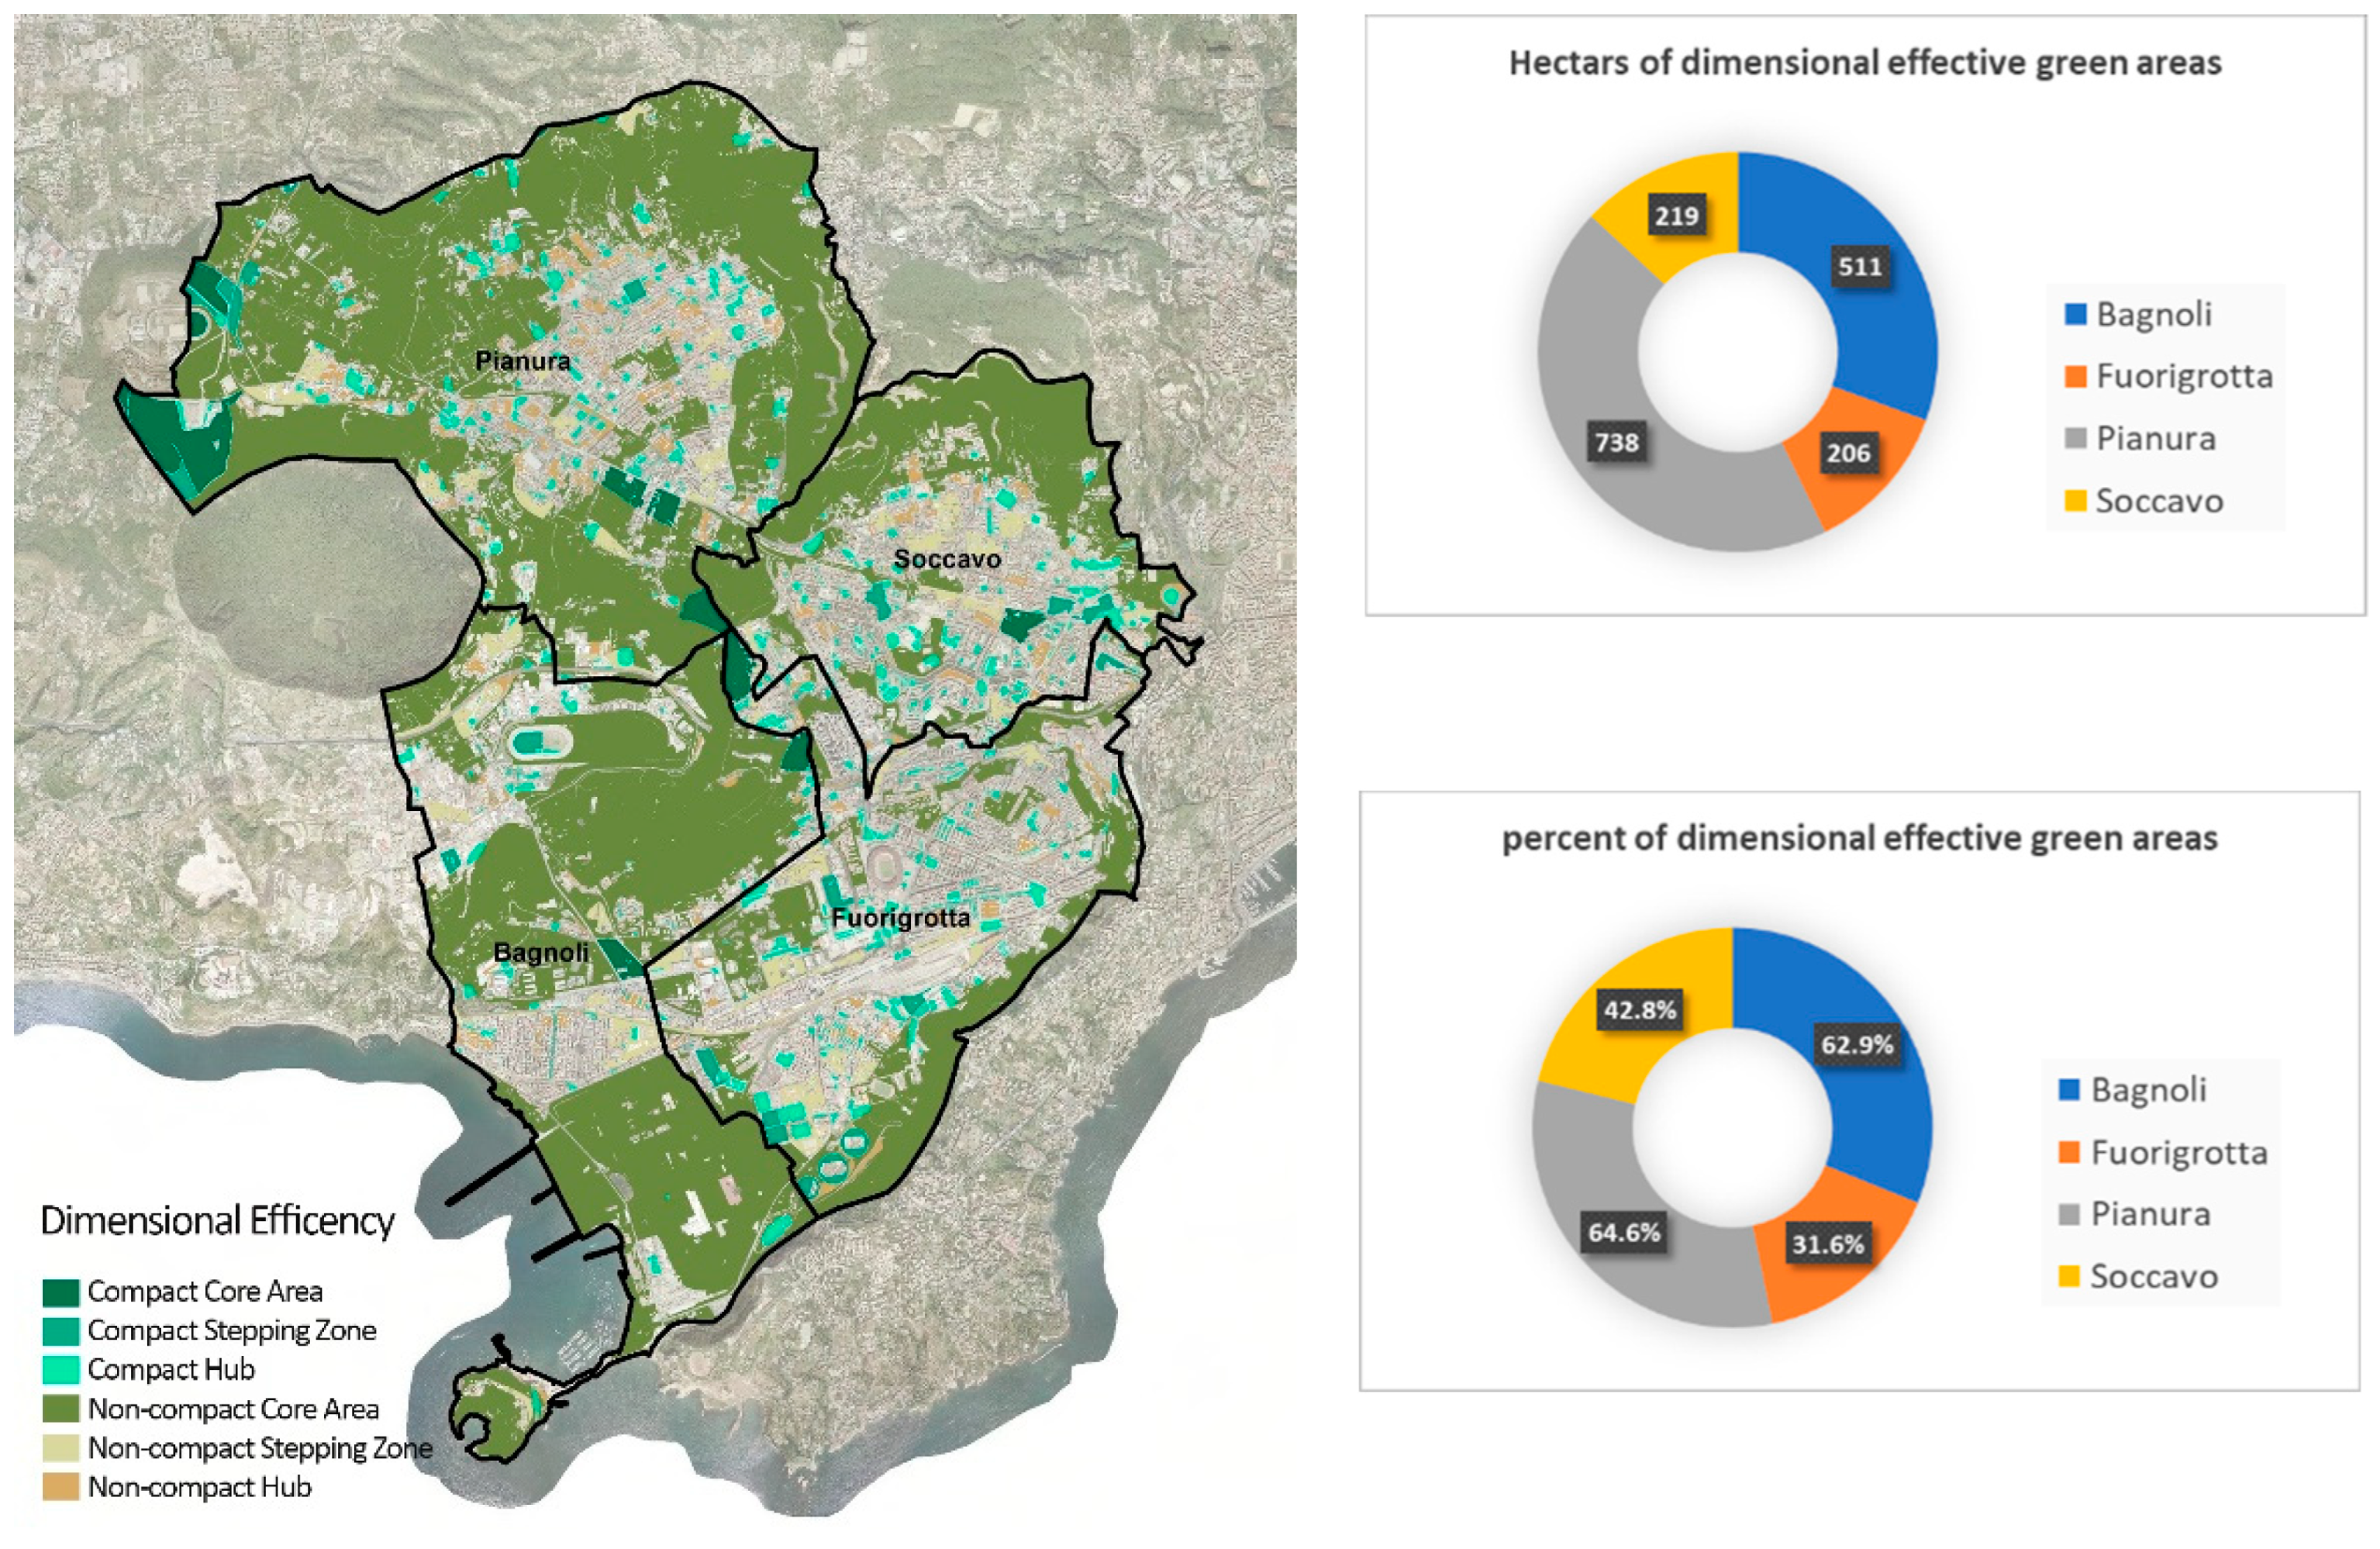
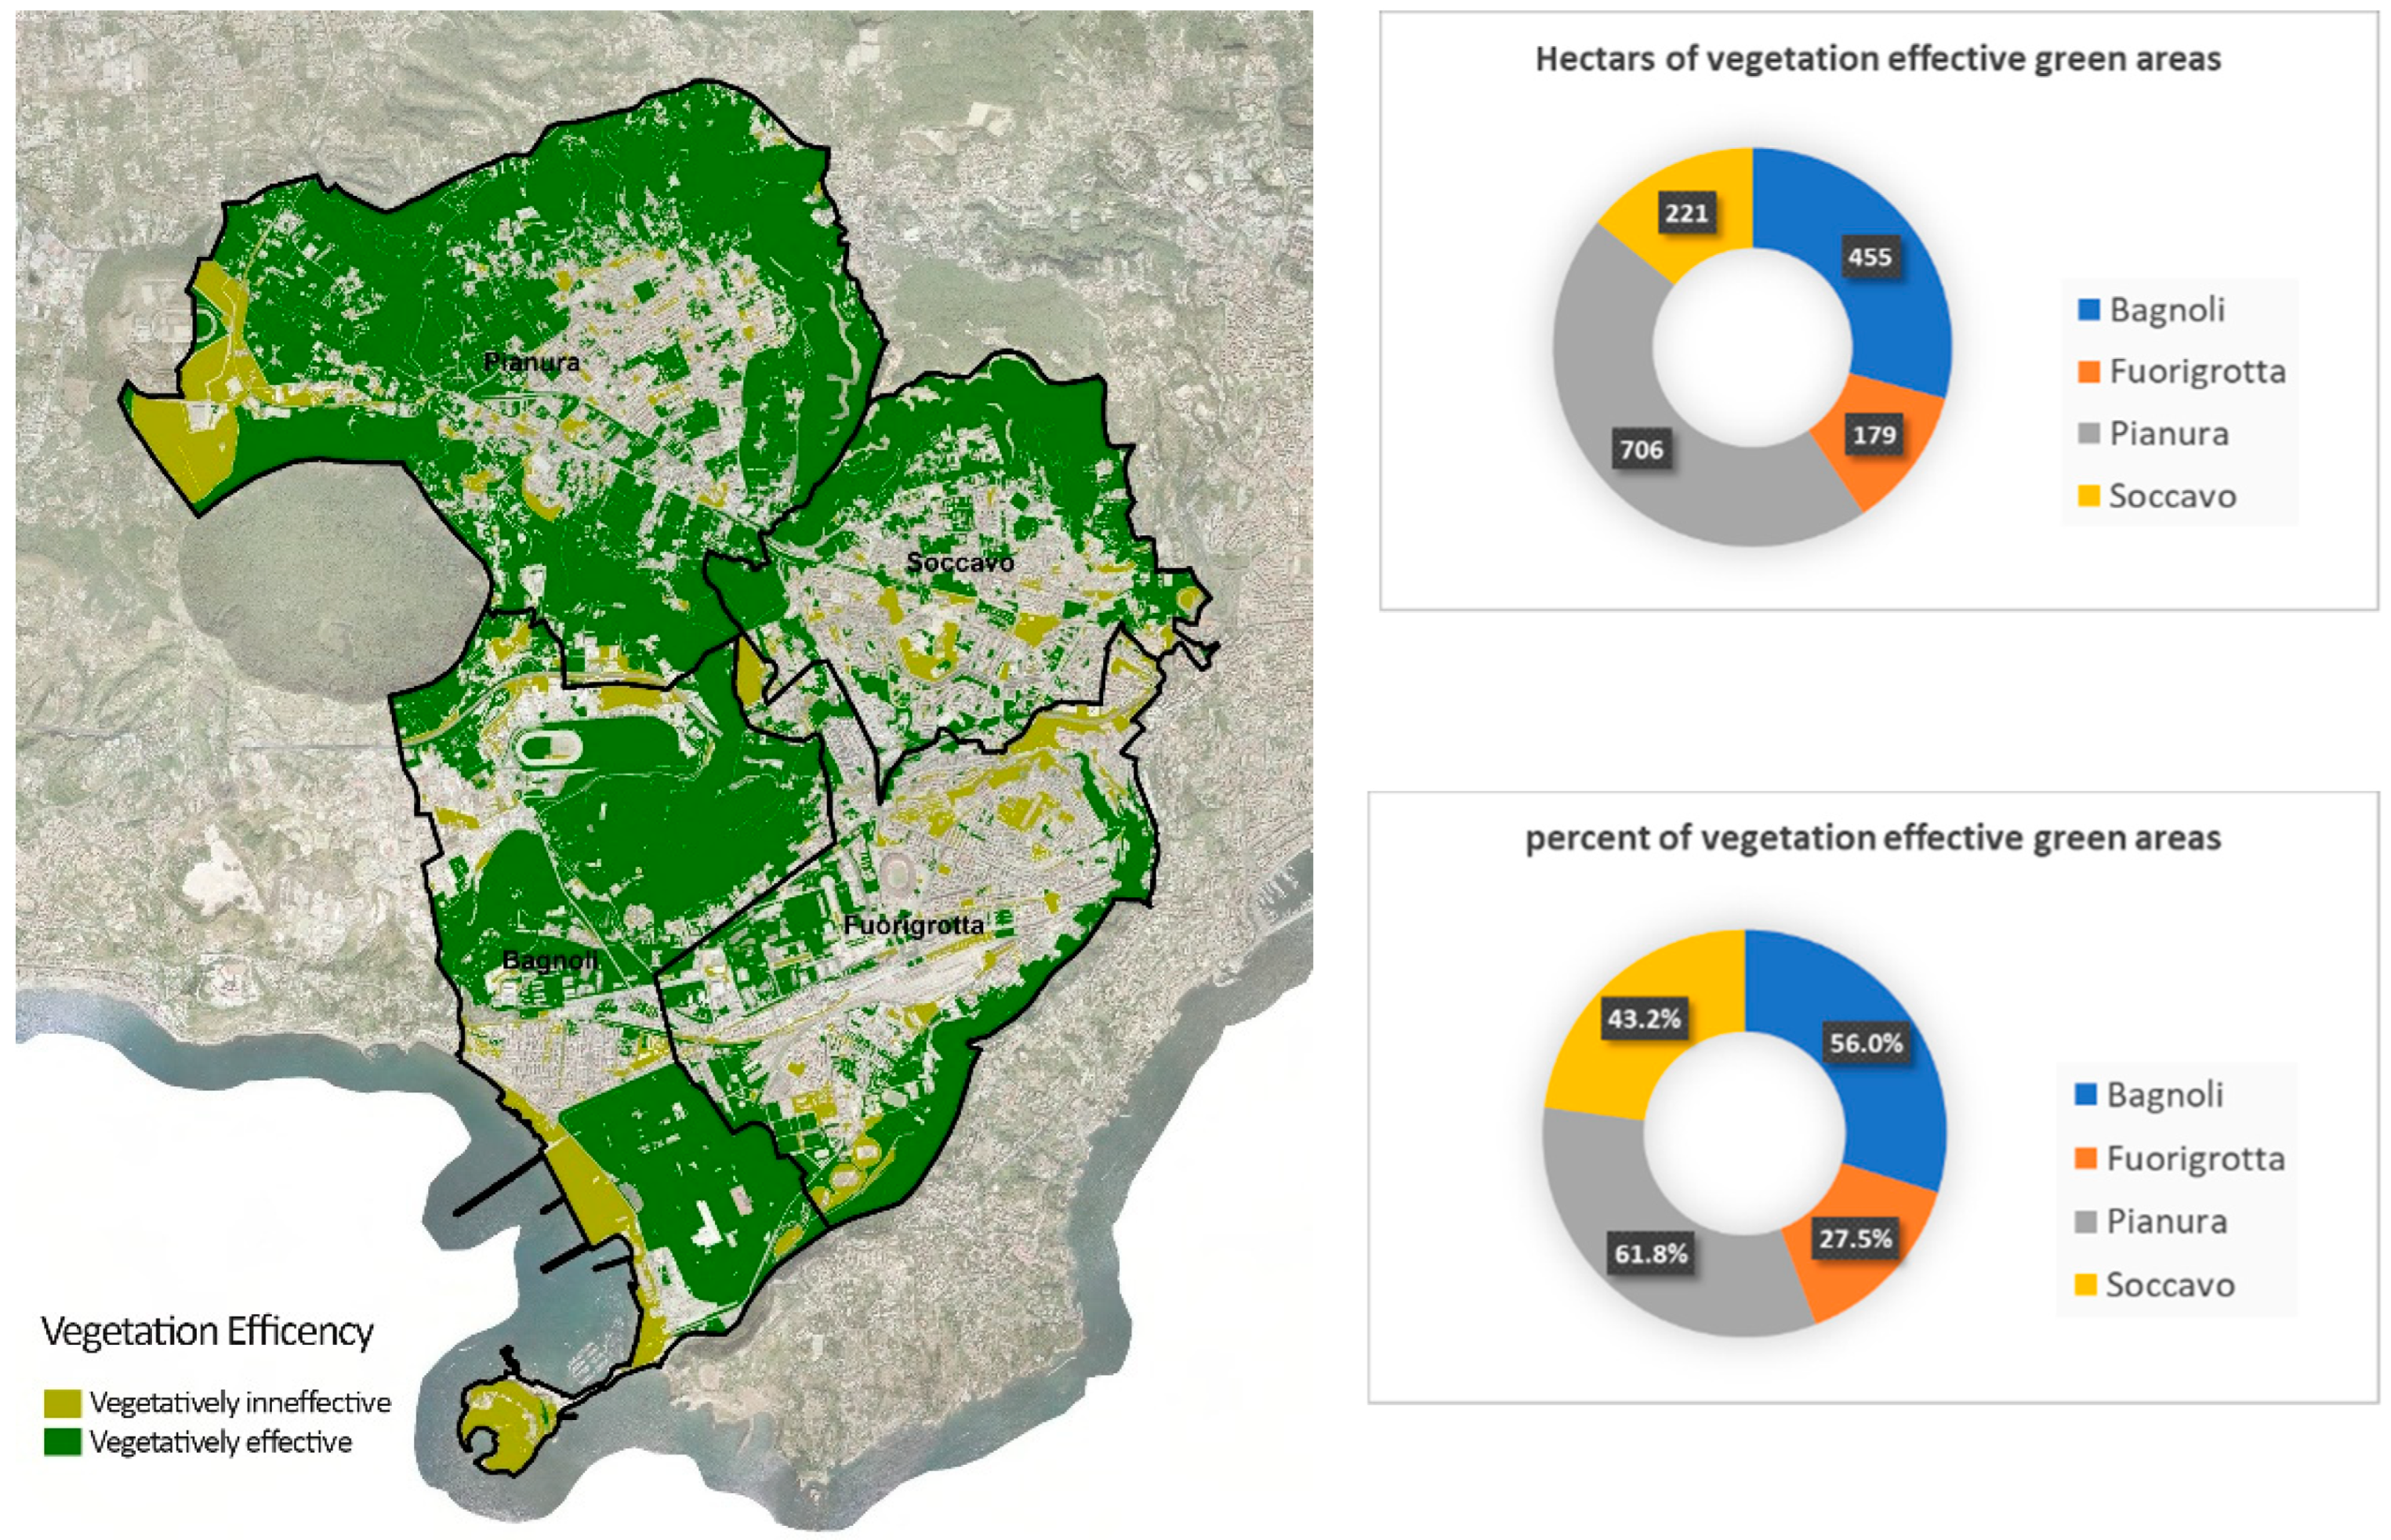
  • Identification of major indicators. For each intermediate indicator in the hierarchical model the urban green areas characteristics have been detected (Figure 2). The dimensional efficiency indicator is assessed by the size and compactness of the green area. The size indicator is assessed through the green area calculation, while compactness is estimated by comparing the shape of the green surface to a perfectly circular surface, according to the perimeter/area ratio [31]. The vegetation efficiency indicator is evaluated based on the Vegetative Structure and the Vegetative Diversity. The Vegetative Structure is measured through the values of the Normalized Difference Vegetation Index (NDVI). This is an index measuring the greening of the green surface biomes. The Vegetative Diversity indicator was measured by five diversity classes referred to the General Land Use (GLU). These indicators comply with the literature [21,31,33,39].
  • Develop criteria for standardization and measurement of the above-mentioned indicators. Each indicator is represented by a specific set of equivalence classes in which the green spaces are divided according to their characteristics. For each class the rule has been determined to assign a green space to this class.
  • Model implementation. The hierarchical model was implemented in a tool GIS platform. For each indicator, a thematic map was produced using geographic processing operators and spatial analysis features. We have implemented these features in the GIS ESRI ArcGIS 10.xtool. To implement the hierarchical model, we built a spatial database containing all the matrix and vector spatial entities needed to calculate the indicators. The output of this phase is the ecological efficiency map on the study area.
  • Patches identification. The ecologically efficient green areas (patches) are detected in the existing urban green areas as those consistent with the full set of indicators proposed by the model and partitioned by typology. Patches are classified according to their dimensional characteristics; add-on patches belonging to the same class are aggregated to form potential components of urban green infrastructure. Finally, a map of the patches potentially included in a green urban infrastructure is developed.
Figure 1 shows the hierarchy of the model applied in the GIS platform to realize the ecological efficiency map.
To identify potential components of urban green infrastructure, the thematic map of the ecological efficiency of green spaces is structured. The ecological efficiency indicator is derived from two intermediate indicators: Dimensional Efficiency and Vegetation Efficiency.
The dimensional efficiency indicator is computed from two indicators named Size and Compactness, respectively.
The Size indicator represents three classes of urban green area based on the surface dimension A. As for the above-mentioned definitions, the study assumes as Core Areas those are classified in the Size Class “very Wide”; as Intermediate Zones those classified in the Sufficiently Wide Class; and as Hub those areas classified as Not Wide.
Table 1 shows the labels of all three classes and the rules built to assign a green open space to a size class.
The Compactness indicator is obtained by evaluating the compactness of the green surface.
If we consider as perfectly compact geometric locus in the plane a circle of radius r, in which the area is πr2 and the ratio between the perimeter and the area is given by 2πr/πr2 = 2/r, we calculate the following parameters of a green area polygon with area A and perimeter P, called, respectively, optimal radius and equivalent radius:
r o t t = A π
r e q = 2 A P
where r o t t and r e q are expressed in the length units used for the area and perimeter (for example hectometers if the area is expressed in hectares). The more the equivalent radius is like the optimal radius, the more the geometric shape of the polygon is similar to a circular shape, therefore the more compact the polygon is.
Then, we evaluate the compactness of the polygon measuring the compactness ratio CR, given by
C R = | r o t t r e q r o t t |
The CR index is dimensionless; it is a number between 0 and 1. If CR is 0, the geometric shape of the polygon is circular; the more the shape of the polygon is elongated, the more req tends to zero and CR tends to 1.
The compactness indicator takes on two values: Compact area and Non-Compact area, based to the CR parameter. In Table 2 are shown the two compactness classes and the corresponding rules.
The compactness threshold of 0.60 was obtained by appropriate calibrations performed on a sample of the study, resulting in a drive set of compact and non-compact green areas. This training set was constructed by a sample of green areas. It consisted of a sample of over a hundred green areas of different compactness classified as compact or not by a panel of experts.
The dimension efficiency indicator is divided into six categories given by the six size and compactness combinations. In Table 3 are shown the six classes of dimension efficiency and the corresponding rules.
The vegetation efficiency indicator is computed based to two indicators called Vegetation Structure and Vegetation Diversity.
The Vegetation Structure refers to the qualities of the vegetation of each patch [31], so that this indicator is calculated by classing the Normalized Difference Vegetation Index (for short, NDVI). The NDVI is used to assess the occurrence of photosynthetic activity. This is a factor that contributes to the ecological health of the patch and, indirectly, to the capacity to provide cooling effects. It is extracted by remote sensing images from the presence of vegetation on the Earth’s surface and its development over time.
Starting from the source remote sensing data consisting of the NDVI raster that covers the study area, an aggregate mean value of the NDVI index in each open space green area is calculated, by using zonal statistics operators. Then, following the NDVI classification in terms of open spaces cooling capacity proposed in [49]. Each area is categorized as under Table 4.
The Vegetation Diversity indicator refers to the potential biodiversity of the area, i.e., the diversity of bio-organisms or ecosystems present in the urban green area. This indicator is based on the general land use (GLU), and is classified in five classes referring to the Copernicus nomenclature: Wooded area, Urban Green, Cultivate area, Uncultivated area and Shrubs.
To assign each urban green area to a GLU class a Detailed Land Use classification has been defined and each urban green area has been classified based to prevalent type of Detailed Land Use.
The DLU classes are grouped into GLU classes according to the following Table 5.
Table 6 shows the five diversity classes and synthetizes the rules applied to assign a green area to a GLU class.
Then, the Vegetation efficiency indicator is calculated based on the values of the structure and diversity indicators. The Vegetation efficiency indicator consists of only two classes: Vegetation efficient green area and Vegetation not efficient green area (Table 7).
Finally, the Ecological Efficiency indicator is calculated based on the values of the Dimensional efficiency and Vegetation efficiency indicators. The Ecological efficiency indicator consists of only two classes: Ecologically efficient green area and Not Ecologically efficient green area.
An urban green area is classified as ecologically efficient if it is a compact core area, stepping zone or hub, and if it is vegetationally efficient.
Table 8 shows the rules applied to classify the urban green areas in terms of Vegetation efficiency.
The detected ecologically efficient green areas form the patches; each patch is classified based on its dimensional characteristics and in accordance with the rules defined in Table 8 to classify a green area as Ecologically effective or Ecologically ineffective, as in Table 9.
Adjoint patches belonging to the same class are aggregated forming potential components of an urban green infrastructure.

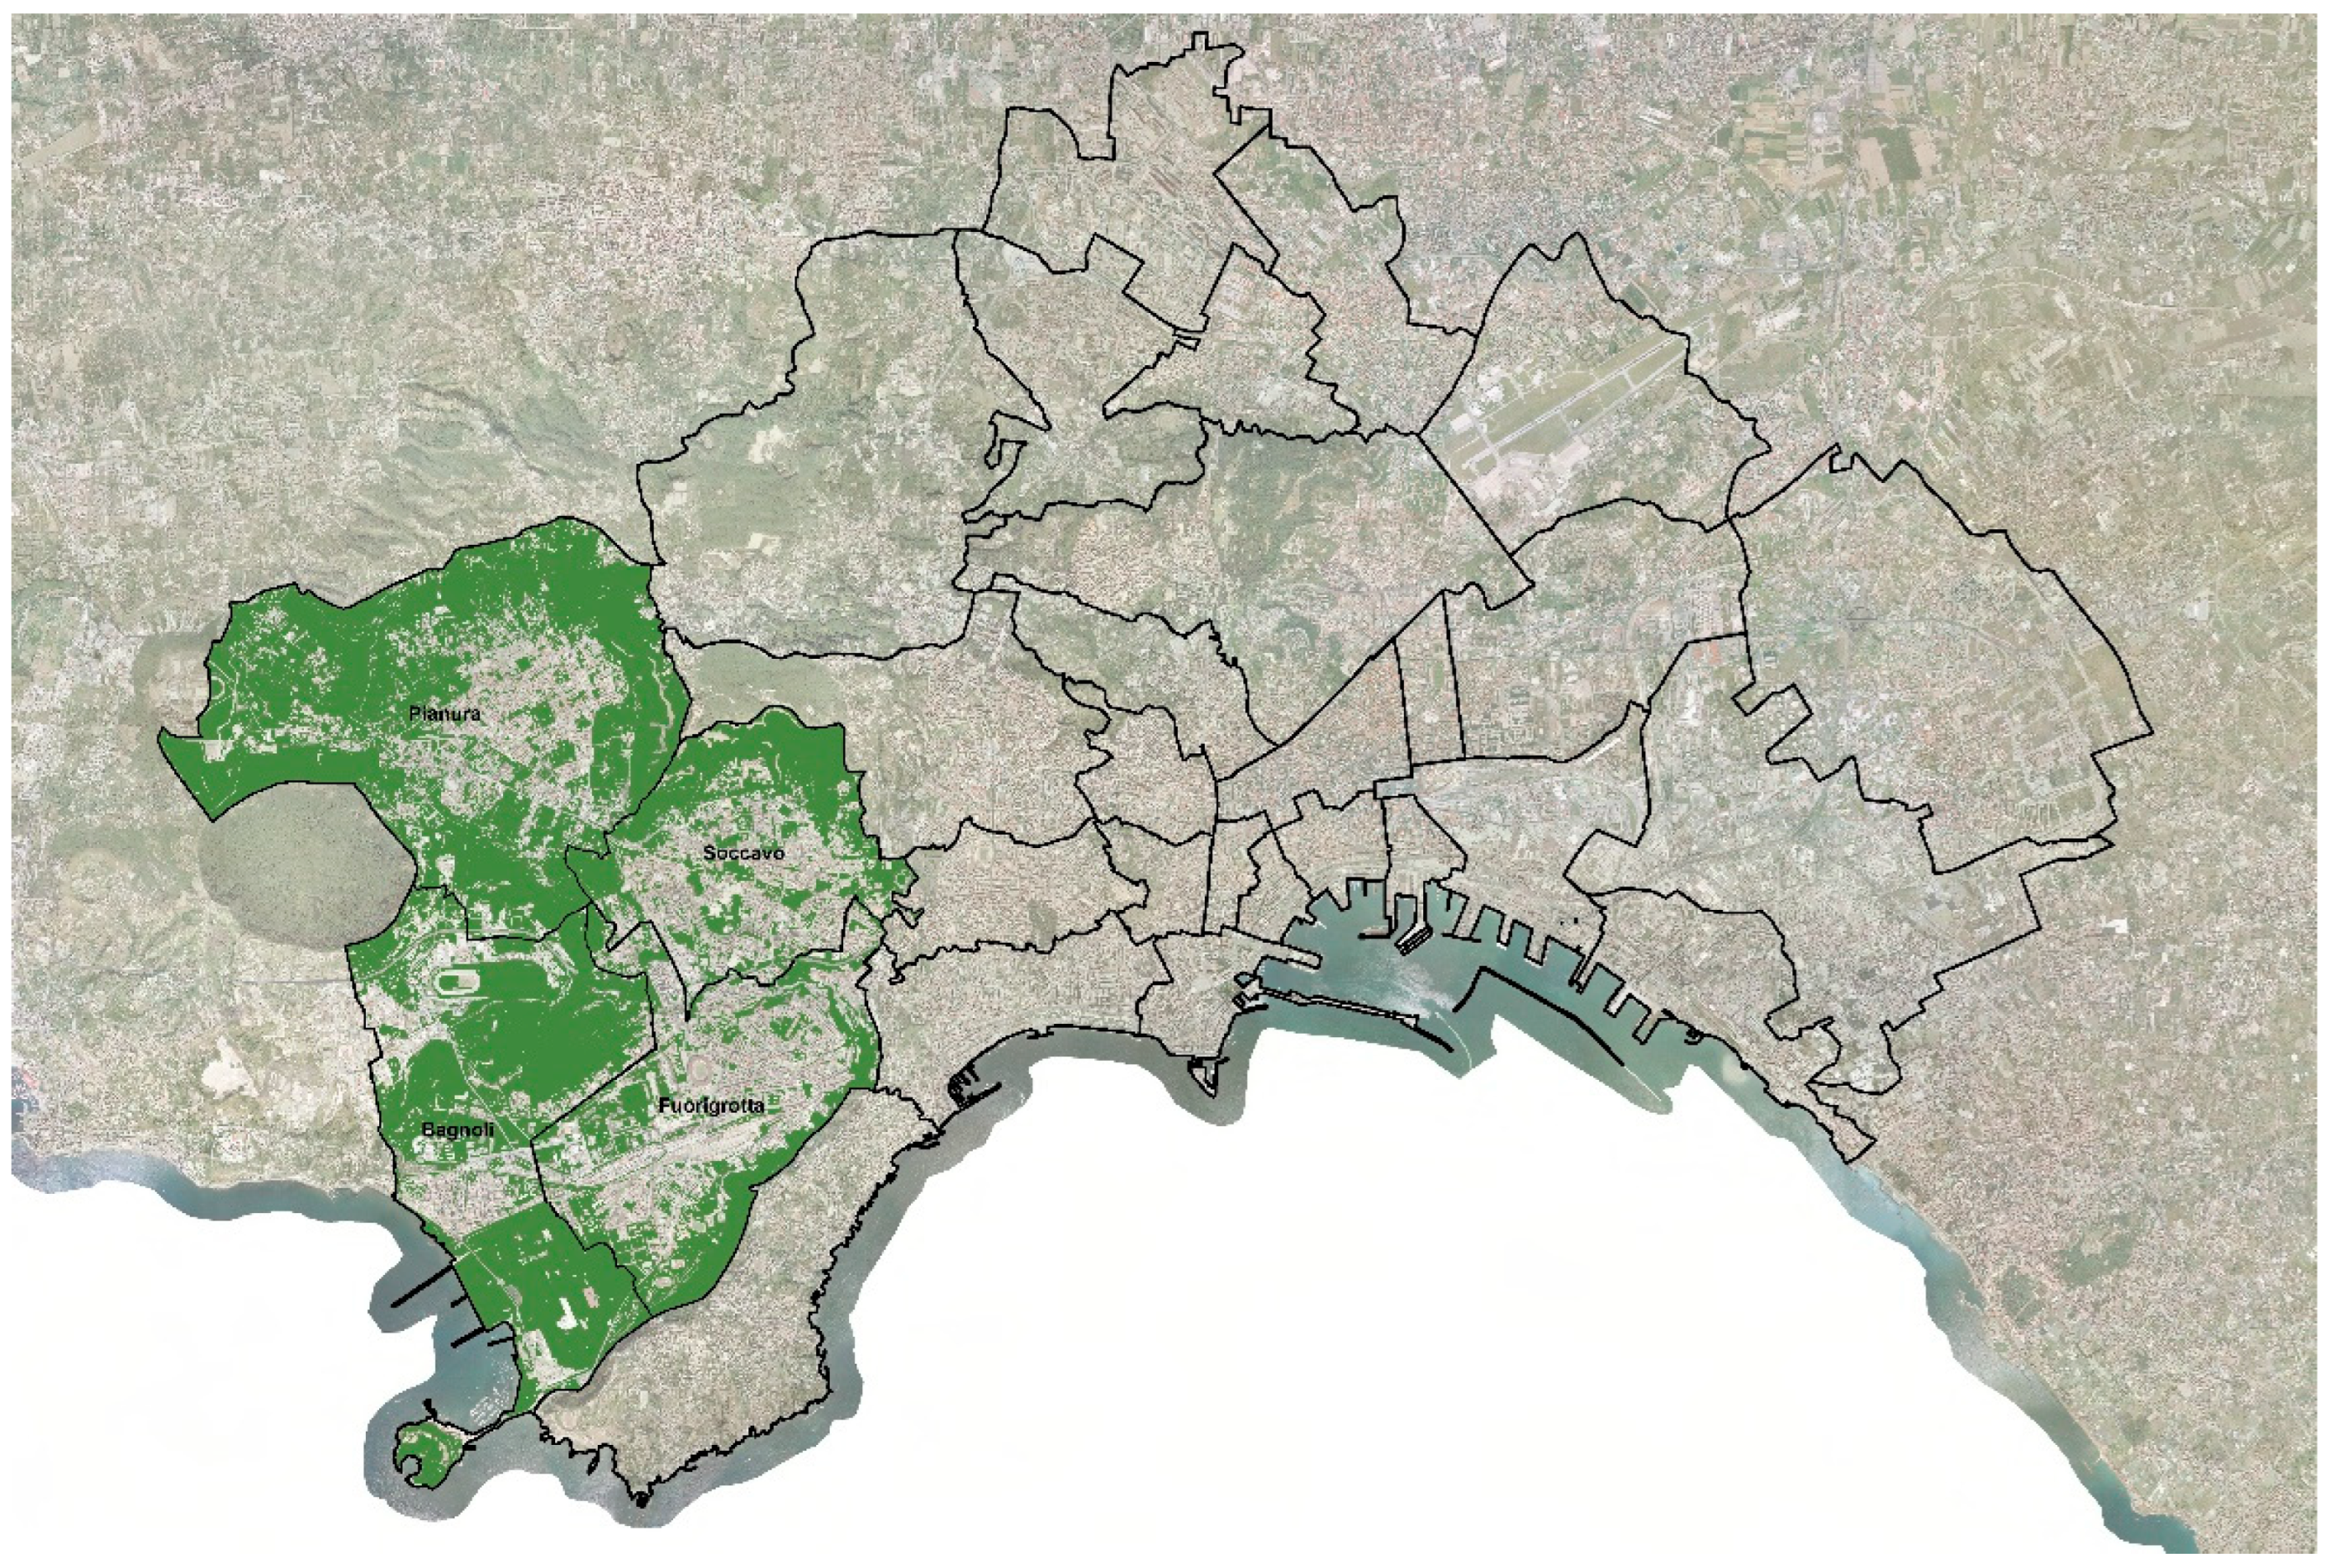
3.2. The Study Area: The Western Part of the Municipality of Naples (Italy)

The study area in which we have applied and tested the proposed model is the Western part of the city of Naples (Italy). It is a wide area that includes four urban districts (Bagnoli, Fuorigrotta, Cavalleggeri, Soccavo) featured by important diversities in their urban patterns, in land uses, and for the characteristics of the existing building stock as referred to both the age of construction and building typologies (Figure 2).
The physical description concentrates primarily on the geomorphological characteristics. The area is part of the Campi Flegrei geological complex and has originated from the same volcanic–tectonic collapse. Its evolution has been marked by further volcanic and tectonic events, sea-level rise, and the transport of alluvial materials. The study area is made up of parts that differ from each other in morphology and position, in which portions of dense urban fabric alternating with large non-built areas sometimes corresponding to the areas pertaining to large disused industrial plants or equipment public areas, sometimes with large natural spaces.
In the 19th century, the Bagnoli sub-district was intended for industrial uses, such as the huge Italsider steelworks. Due to the plants, new residential areas have been built around them, as well as new infrastructure. At present, the pre-existing natural environment is not recognizable except for its general morphology [50].
At the beginning of the twentieth century, the district of Fuorigrotta had a predominantly agricultural use that was completely modified as consequence of the many infrastructural interventions, the public equipment, as well as for the construction of several residential areas. The area now has a compact building fabric and is the most densely populated in the whole city of Naples with approximately 76,500 inhabitants. It develops as a vast plain bounded between the hills of Coroglio to the south and Monte Spina, Agnano, Soccavo and Camaldoli between the north and the west.
The Soccavo district is located at the foot of the Camaldoli hill, creating a residential continuum with the built-up area of Fuorigrotta. The district was formerly a valuable quarry used for extracting tuff, pozzolana and piperno. The Soccavo district, mainly with an agricultural vocation, has seen widespread and unregulated building development since the 1950s. To date, within the compact building fabric, it is possible to sporadically recognize some agricultural farms and various crops.
According to the physical characteristics described above, the borders of the study area is depicted by the sub-districts as mapped by the National Institute of Statistics—ISTAT.
The surface of the study area is about 30.72 km2 and it is inhabited by 211,015 people.
To test our model, we construct a spatial database on the study area importing the source datasets in Table 10.
In next section the thematic map of the indicators obtained executing the functions implementing our method is shown and analyzed.

4. Experimental Results

To test our model on the study area, we have implemented it in a geo-computational framework by using the ESRI ArcGIS Desktop 10.x suite. All the processes were constructed by using the ESRI ArcGIS Python environment.
The maps of all intermediate indicators and the final ecological efficiency indicator map obtained using the hierarchy model in Figure 1 are presented below.
In Figure 3 are shown, respectively, the Size and Compactness thematic maps.
The spatial distribution of the size indicator shows that the districts Pianura and Bagnoli are most covered by extensive green spaces (61% of the district extension); instead, in the districts Fuorigrotta and Soccavo there are fewer large green spaces (respectively 25% and 37% of the district extension). The Compactness thematic map shows a higher frequency of less compact green areas in the four districts. This frequency of non-compact green areas is very high for large green areas, which have mainly an elongated or complex geometric shape. The non-compact green areas cover, respectively, 63.5% of the extension of Bagnoli, 30% of that of Fuorigrotta, 61.5% of that of Pianura and 42% of that of Soccavo.
Green areas in the districts of Soccavo, Pianura and Fuorigrotta show a prevalence of a high or medium-high structure indicator, respectively, 45%, 60% and 30% of the district.
In Figure 4 are shown, respectively, the Structure and Diversity thematic maps.
This prevalence is also present in the northern area of the Bagnoli district, while in the south, in the former industrial area, the green areas have a mainly medium structure (16.5% of the district extension).
In the Bagnoli district, the green areas are mainly classified as Wooded Urban Green area, covering a total of 58% of the extension of the district. These diversity classes are also more present in the Soccavo district, covering, overall, 40% of the extension of the district. In the Fuorigrotta district, the green areas are mainly classified as Urban green and Cultivate Area, covering, respectively, 16% and 14% of the extension of the district. Finally, in the Pianura district the green areas are mainly classified as Wooded area and Cultivate area, covering, respectively, 28% and 29% of the extension of the district. In all districts, there are uncultivated green areas in a percentage between 4.5% and 7% of the extension of the district.
Figure 5 shows the Dimensional Efficiency thematic map. The two pie diagrams show the extension in hectares and the percent of dimensionally effective green areas in the four districts where the percentual is given with respect to the extension of the district. All core areas as well as the compact stepping zones and hubs are considered dimensionally effective green areas. Non-compact core areas are considered dimensionally efficient due to their high extension, even if not compact because of their mainly elongated shape.
The districts of Pianura and Bagnoli are those most covered by dimensionally efficient green areas (respectively, 738 and 511 hectares). Furthermore, over 60% of the extension of each of the two districts is covered by dimensionally effective green areas. Conversely, only 31% of the extension of the Fuorigrotta district is covered by dimensionally effective green areas.
Figure 6 show the Vegetation Efficiency thematic map. The two pie diagrams show the extension in hectares and the percentage of vegetation effective green areas in the four districts where the percentage is given with respect to the extension of the district.
As for the dimensional efficiency indicator, the districts of Pianura and Bagnoli are those with the greatest coverage of vegetation effective green areas. They have a total extension of 706 hectares in the plain and 455 hectares in Bagnoli. Furthermore, over 60% of the extension of the Pianura district and over 55% of the Bagnoli district are covered by vegetation effective green areas. Conversely, only 27% of the extension of the Fuorigrotta district is covered by vegetation effective green areas.
The final ecological efficiency map is shown in Figure 7. The distribution of ecologically efficient greenspace extension by district follows that observed for the two intermediate indicators of dimensional and vegetation efficiency. The Pianura and Bagnoli districts are covered by ecologically effective areas for 65% of their extension, while the Soccavo district for 45% and Fuorigrotta for only 33%.
To evaluate the relationship between the presence of ecologically effective green areas and the population densities, the density of residents per square kilometer and the square meters of ecologically effective green areas per district were extracted and reported in the two pie diagrams in Figure 8.
As the two graphs in Figure 8 shown, the Fuorigrotta district is the most densely inhabited, with over 12,000 inhabitants per square kilometer, and it is also the district with the smallest presence of ecologically effective green areas per inhabitant (33.95 square meters per inhabitant). On the contrary, the Bagnoli and Pianura districts are those with lower population density (respectively about 3000 and 5100 inhabitants) and with a greater presence of ecologically effective green areas per inhabitant (respectively, 231 and 136 square meters per inhabitant).

5. Discussion of the Results

The results of our tests show that in two districts, Fuorigrotta and Soccavo, the extension of ecologically effective green areas is reduced compared to the extension of the district. In particular, the district in which there is a minor presence of ecologically effective green areas is Fuorigrotta, in which the extension of ecologically efficient green areas is equal to only about 30% of the extension of the district. This condition is aggravated by the high population density in the district of over 12,000 residents per square kilometer.
Conversely, the Bagnoli and Pianura districts are covered for about 65% of their extension by ecologically effective green areas, as well as having a population density much lower than that of the other two districts (about 3000 and 5000 residents per square kilometer, respectively). This suggests the need to implement in these two districts mainly conservation interventions of the ecologically effective green areas aimed at maintaining the contribution of ecosystem services provided by the areas unchanged, by encouraging maintenance and protection activities of the existing plant resources.
The results highlight that the two districts Fuorigrotta and Soccavo are the most critical due to the lower concentration of ecologically effective green areas and the high population density; in particular, the Fuorigrotta district is the one with the highest criticality and for which recovery projects of not ecologically effective green areas and the enhancement of ecologically effective green areas should be envisaged through the preparation of a specific local green infrastructure plan aimed at recovering existing green areas in the district and their enhancement. In addition, given the scarcity of pre-existing green areas in the district, it is necessary to provide for the design from scratch of ecologically effective green areas especially in the vicinity of highly populated areas of the district.
In the light of these remarks, it is possible to conclude that the application of our GIS-based model allows to recognize the existing urban areas that could potentially implement an urban green infrastructure. Furthermore, the framework makes it possible to detect which are the most critical areas of the urban study area, whose extension is not sufficiently covered by ecologically effective green areas and with a high population density; they are those urban areas for which it may be necessary to plan interventions to enhance ecologically effective urban green areas as a priority.
Despite the model runs on four indicators only, there is a quite significant confidence that it is able at depicting differences among the existing green areas to enhance specific ecological characteristics. Such distinction allows us to specify different roles and functions of the patches within a green network. By this perspective, the model can support planning decisions, and makes it possible to select the most appropriate measures and interventions according to the green area specific.

6. Conclusions

In this research, we proposed a GIS-based framework in which a hierarchical model has been implemented for the detection of ecologically effective urban green areas.
The hierarchical model evaluates the ecological efficiency of an urban green area measuring its dimensional and vegetation efficiency. The dimensional efficiency is measured considering the size and the compactness of the green area, the vegetation efficiency is measured considering the quality and the diversity of vegetation.
The framework was tested to produce the thematic map of the ecological efficiency of the urban green areas of the districts located in the western area of the municipality of Naples. These results show that the proposed GIS-based framework can prove to be a valid support for designing green infrastructures towards oriented at: (1) prioritizing conservation green areas; (2) increase connectivity; and (3) preventing impacts.
Looking that way, more implementation of the GIS model seems to be possible according to the assumption made by the research, and to the scientific advances on this topic. Notably, the opportunity of increasing the number and types of ecological indicators leads toward more complex GIS models. The latter has already been planned by the aim of integrating the assessment of the existing urban green area within a wider set of requirements.
More implementation of the GIS model can also be provided by the addition of more indicators specifically calibrated for deepening further parameters related to the capacity of the green areas in coping heat wave hazard. To do so, other studies could include indicators and indexes to evaluate urban constraints and urban vulnerability in particular. Both implementations are part of current search lines for authors.

Author Contributions

Conceptualization, V.D., F.D.M. and M.R.; methodology, V.D., F.D.M. and M.R.; software, V.D., F.D.M. and M.R.; validation, V.D., F.D.M. and M.R.; formal analysis, V.D., F.D.M. and M.R.; investigation, V.D., F.D.M. and M.R.; resources, V.D., F.D.M. and M.R.; data curation, V.D., F.D.M. and M.R.; writing—original draft preparation, V.D., F.D.M. and M.R.; writing—review and editing, V.D., F.D.M. and M.R.; visualization, V.D., F.D.M. and M.R.; supervision, V.D., F.D.M. and M.R. All authors have read and agreed to the published version of the manuscript.

Funding

The study works under the Italian National Research Project (PRIN) titled “TECH-START—key enabling TECHnologies and Smart environmenT in the Age of gReen economy. convergent innovations in the open space/building system for climaTe mitigation”. funder: Italian Ministry of University and Research (MUR), funding number: 20177JHMLA_001. (2020–2023).

Institutional Review Board Statement

Not applicable.

Informed Consent Statement

Not applicable.

Data Availability Statement

Not applicable.

Acknowledgments

The paper presents part of the findings of the Federico II University Research Unit, headed by Mario Losasso. Further, we want to express our grateful appreciation Vittorio Miraglia for supporting the study by operating on data collection and mapping.

Conflicts of Interest

The authors declare no conflict of interest.

References

  1. Ahern, J. Urban landscape sustainability and resilience: The promise and challenges of integrating ecology with urban planning and design. Landsc. Ecol. 2013, 28, 1203–1212. [Google Scholar] [CrossRef]
  2. Kershaw, T. Climate Change Resilience in Urban Environments; IOP Publishing: Bristol, UK, 2017. [Google Scholar] [CrossRef]
  3. Millennium Ecosystem Assessment (MEA). Ecosystems and Human Well-Being: Synthesis; Island Press: Washington, DC, USA, 2005; ISBN 1-59726-040-1. [Google Scholar]
  4. Herberg, A.; Kube, A. Klimawandel und Städte: Naturschutz und Lebensqualität. In Biodiversität und Klimawandel; Essl, F., Rabitsch, W., Eds.; Springer Spektrum: Berlin/Heidelberg, Germany, 2013; pp. 254–263. ISBN 13:9783642296925. [Google Scholar]
  5. Demuzere, M.; Orru, K.; Heidrich, O.; Olazabal, E.; Geneletti, D.; Orru, H.; Bhave, A.G.; Mittal, N.; Feliú, E.; Faehnle, M. Mitigating and adapting to climate change: Multi-functional and multi-scale assessment of green urban infrastructure. J. Environ. Manag. 2014, 146, 107–115. [Google Scholar] [CrossRef] [PubMed]
  6. Tzoulas, K.; Korpela, K.; Venn, S.; Yli-Pelkonen, V.; Ka´zmierczak, A.; Niemela, J.; James, P. Promoting ecosystem and human health in urban areas using green infrastructure: A literature review. Landsc. Urban Plan. 2007, 81, 167–178. [Google Scholar] [CrossRef] [Green Version]
  7. Valente, R. Multi-scale Environmental design experiences. In Adapting to the Changing Climate. Knowledge Innovation for Environmental Design; Losasso, M., Lucarelli, M.T., Rigillo, M., Valente, R., Eds.; Maggioli: Rimini, Italia, 2020. [Google Scholar]
  8. Ajuntamiento de Barcelona. Barcelona Green Infrastructure and Biodiversity Plan. 2013. Available online: https://ajuntament.barcelona.cat/ecologiaurbana/sites/ (accessed on 1 January 2013).
  9. NYC Department of Environmental Protection (DEP). NYC Green Infrastructure Plan: A Sustainable Strategy for Clean Waterways, New York City. 2012. Available online: https://www1.nyc.gov/assets/dep/downloads/pdf/water/stormwater/green-infrastructure/nyc-green-infrastructure-plan-2010.pdf (accessed on 1 January 2012).
  10. European Environmental Agency, Green Infrastructure and Territorial Cohesion. The Concept of Green Infrastructure and Its Integration into Policies Using Monitoring Systems; Technical Report No 18/2011; Publications Office of the European Union: Luxembourg, 2011; ISBN 978-92-9213-242-2. [Google Scholar]
  11. Science for Environment Policy. The Multifunctionality of Green Infrastructure; In-Depth Reports; Directorate-General for the Environment, Science for Environment Policy, European Commission: Brussels, Belgium, 2012. [Google Scholar]
  12. European Commission Communication from the Commission to the European Parliament, the Council, the European Economic and Social Committee and the Committee of the Regions. Green Infrastructure (GI)—Enhancing Europe’s Natural Capital; COM/2013/0249 Final. Available online: http://eur-lex.europa.eu/legal-content/EN/TXT/?uri=CELEX:52013DC0249 (accessed on 6 May 2013).
  13. European Commission, Report from the Commission to the European Parliament, the Council, the European Economic and Social Committee and the Committee of the Regions, Review of progress on implementation of the EU green infrastructure strategy, COM (2019) 236 Final. Available online: https://eur-lex.europa.eu/legal-content/EN/TXT/PDF/?uri=CELEX:52019DC0236&qid=1562053537296 (accessed on 24 May 2019).
  14. European Commission, Commission Staff Working Document Additional Information on the Review of Implementation of the Green Infrastructure Strategy, SWD (2019) 184 Final. Available online: https://eur-lex.europa.eu/legal-content/EN/TXT/PDF/?uri=CELEX:52019DC0236&qid=1562053537296 (accessed on 24 May 2019).
  15. European Commission, Commission Staff Working Document, Technical Information on Green Infrastructure (GI), COM/2013/0249 Final. Available online: https://ec.europa.eu/environment/nature/ecosystems/docs/green_infrastructures/1_EN_ACT_part1_v5.pdf (accessed on 6 May 2013).
  16. Costanza, R.; d’Arge, R.; de Groot, R.; Farber, S.; Grasso, M.; Hannon, B.; Limburg, K.; Naeem, S.; O’Neill, R.V.; Paruelo, J.; et al. The Value of the World’s Ecosystem Services and Natural Capital. Nature 1997, 387, 253–260. [Google Scholar] [CrossRef]
  17. Potschin, M.; Haines-Young, R. Ecosystem services. Exploring a geographical perspective. Physical. Geogr. 2011, 35, 575–594. [Google Scholar] [CrossRef]
  18. Naumann, S.; McKenna, D.; Kaphengst, T.; Pieterse, M.; Rayment, M. Design, Implementation and Cost Elements of Green Infrastructure Projects; Final Report to the European Commission; Ecologic Institute and GHK Consulting: Overland Park, KS, USA, 2011; Available online: https://ec.europa.eu/environment/enveco/biodiversity/pdf/GI_DICE_FinalReport.pdf (accessed on 19 January 2019).
  19. Costanza, R.; de Groot, R.; Sutton, P.; van der Ploeg, S.; Anderson, S.J.; Kubiszewski, I.; Farber, S.; Turner, R.K. Changes in the global value of ecosystem services. Glob. Environ. Change 2014, 26, 152–158. [Google Scholar] [CrossRef]
  20. United Nations, System of Environmental-Economic Accounting—Ecosystem Accounting (SEEA EA). White Cover Publica-tion, Pre-Edited Text Subject to Official Editing. December 2021. Available online: https://seea.un.org/ecosystem-accounting (accessed on 1 January 2022).
  21. Sun, R.; Liu, S. Effects of green space dynamics on urban heat islands: Mitigation and diversification. Ecosyst. Serv. 2017, 23, 38–46. [Google Scholar] [CrossRef]
  22. Meerow, S.; Newell, J.P. Spatial planning for multifunctional green infrastructure: Growing resilience in Detroit. Landsc. Urban Plan. 2017, 159, 62–75. [Google Scholar] [CrossRef]
  23. Yu, Z.; Yang, G.; Zuo, S.; Jørgensen, G.; Koga, M.; Vejre, H. Critical review on the cooling effect of urban blue-green space: A threshold-size perspective. Urban For. Urban Green. 2020, 49, 126630. [Google Scholar] [CrossRef]
  24. Jaganmohan, M.; Knapp, S.; Buchmann, C.M.; Schwarz, N. The Bigger, the Better? The Influence of Urban Green Space Design on Cooling Effects for Residential Areas. J. Environ. Qual. 2016, 45, 134–145. [Google Scholar] [CrossRef]
  25. Monteiro, M.V.; Doick, K.J.; Handley, P.; Peace, A. The impact of greenspace size on the extent of local nocturnal air temperature cooling in London. Urban For. Urban Green. 2016, 16, 160–169. [Google Scholar] [CrossRef]
  26. Hathway, E.; Sharples, S. The interaction of rivers and urban form in mitigating the Urban Heat Island effect: A UK case study. Build. Environ. 2012, 58, 14–22. [Google Scholar] [CrossRef] [Green Version]
  27. Skelhorn, C.; Lindley, S.; Levermore, G. The impact of vegetation types on air and surface temperatures in a temperate city: A fine scale assessment in Manchester, UK. Landsc. Urban. Plan. 2014, 121, 129–140. [Google Scholar] [CrossRef]
  28. Jiang, Y.; Jiang, S.; Shi, T. Comparative Study on the Cooling Effects of Green Space Patterns in Waterfront Build-Up Blocks: An Experience from Shanghai. Int. J. Environ. Res. Public Health 2020, 17, 8684. [Google Scholar] [CrossRef] [PubMed]
  29. Liao, W.; Hong, T.; Heo, Y. The effect of spatial heterogeneity in urban morphology on surface urban heat islands. Energy and Buildings 2021, 244, 112027. [Google Scholar] [CrossRef]
  30. Tan, Z.; Lau, K.K.-L.; Ng, E. Urban tree design approaches for mitigating daytime urban heat island effects in a high-density urban environment. Energy Build. 2016, 114, 265–274. [Google Scholar] [CrossRef]
  31. Cook, E.A. Landscape structure indices for assessing urban ecological networks. Landsc. Urban Plan. 2002, 58, 269–280. [Google Scholar] [CrossRef]
  32. Benedict, M.A.; McMahon, E.T. Green Infrastructure: Linking Landscapes and Communities; Island Press: Washington, DC, USA, 2006; p. 299. ISBN 978-1559635585. [Google Scholar]
  33. Parker, J.; Zingoni de Baro, M.E. Green Infrastructure in the Urban Environment: A Systematic Quantitative Review. Sustainability 2019, 11, 3182. [Google Scholar] [CrossRef] [Green Version]
  34. Ying, J.; Zhang, X.; Zhang, Y.; Bilan, S. Green infrastructure: Systematic literature review. Econ. Res. Ekon. Istraživanja 2021, 23, 1–22. [Google Scholar] [CrossRef]
  35. Wang, J.; Banzhaf, E. Towards a better understanding of Green Infrastructure: A critical review. Ecol. Indic. 2018, 85, 758–772. [Google Scholar] [CrossRef]
  36. Mussinelli, E.; Tartaglia, A.; Bisogni, L.; Malcevschi, S. The role of Nature-Based Solutions in architectural and urban design. Techne J. Technol. Environ. 2019, 15, 116–123. [Google Scholar] [CrossRef]
  37. Staccione, A.; Candiago, S.; Mysiak, J. Mapping a Green Infrastructure Network: A framework for spatial connectivity applied in Northern Italy. Environ. Sci. Policy 2022, 131, 57–67. [Google Scholar] [CrossRef]
  38. Liquete, C.; Kleeshulte, S.; Dige, G.; Maes, J.; Grizzetti, B.; Olah, B.; Zulian, G. Mapping Green Infrastructure based on ecosystem services and ecological networks: A Pan-European Case Study. Environ. Sci. Policy 2015, 54, 268–280. [Google Scholar] [CrossRef]
  39. Forman, R.; Godron, M. Patches and structural components for a landscape ecology. BioScience 1981, 31, 733–740. [Google Scholar]
  40. European Commission. Building a Green Infrastructure for Europe; Publications Office of the EU: Luxembourg, 2013; Available online: https://op.europa.eu/en/publication-detail/-/publication/738d80bb-7d10-47bc-b131-ba8110e7c2d6 (accessed on 1 October 2021).
  41. Fenu, G.; Pau, P.L. Connectivity analysis of ecological landscape networks by cutnode ranking. Appl. Netw. Sci. 2018, 3, 1–15. [Google Scholar] [CrossRef] [Green Version]
  42. Lindeman, R.L. The trophic-dynamic aspect of ecology. Ecology 1942, 23, 399–418. [Google Scholar] [CrossRef]
  43. Ricklefs, R.E.; Miller, G.; Miller, G.L. Ecology; W H Freeman & Co.: New York, NY, USA, 2000; p. 822. ISBN 9780716728290. [Google Scholar]
  44. Jiadai, Y.; Pengpeng, X.; Zhijin, H. Impact of urbanization on ecological efficiency in China: An empirical analysis based on provincial panel data. Ecol. Indic. 2021, 129, 107827. [Google Scholar] [CrossRef]
  45. Yan, L.; Jinning, Z.; Xiaodong, Y.; Weilong, W.; Haitao, W.; Qiying, R.; Rundong, L. The impact of innovative city construction on ecological efficiency: A quasi-natural experiment from China. Sustain. Prod. Consum. 2021, 28, 1724–1735. [Google Scholar] [CrossRef]
  46. Haase, D.; Larondelle, N.; Andersson, E.; Artmann, M.; Borgström, S.; Breuste, J.; Gomez-Baggethun, E.; Gren, Å.; Hamstead, Z.; Hansen, R.; et al. A Quantitative Review of Urban Ecosystem Service Assessments: Concepts, Models, and Implementation. AMBIO 2014, 43, 413–433. [Google Scholar] [CrossRef] [Green Version]
  47. Estreguil, C.; Dige, G.; Kleeschulte, S.; Carrao, H.; Raynal, J.; Teller, A. Strategic Green Infrastructure and Ecosystem Restoration: Geospatial Methods, Data and Tools; EUR 29449 EN; Publications Office of the European Union: Luxembourg, 2019; ISBN 978-92-79-97294-2. JRC113815. [Google Scholar] [CrossRef]
  48. Di Martino, F.; Sessa, S. Methodology and hierarchical model for the assessment of the climatic vulnerability of the urban system. In Environmental Design for Climate Change adaptation. 2. Tools and Guidelines for Climate Risk Reduction; D’Ambrosio, V., Leone, M., Eds.; CLEAN: Napoli, Italy, 2019; pp. 46–57. ISBN 978-88-8497-731-1. [Google Scholar]
  49. Apreda, C.; D’Ambrosio, V.; Di Martino, F. A climate vulnerability and impact assessment model for complex urban systems. Environ. Sci. Policy 2019, 93, 11–26. [Google Scholar] [CrossRef]
  50. Russo, F.; Calderoni, G. The geomorphological evolution of the outskirts of Naples during the Holocene: A case study of the Bagnoli-Fuorigrotta depression. Holocene 1998, 8, 581–588. [Google Scholar] [CrossRef]
Figure 1. Hierarchical model applied to the GIS platform to realize the eco-efficiency map and extract potential components of urban green infrastructure.
Sustainability 14 06830 g001
Figure 2. Case study area: The four urban districts in western area of Naples (Italy).
Sustainability 14 06830 g002
Figure 3. Thematic maps of Size and Compactness indicators.
Sustainability 14 06830 g003
Figure 4. Thematic maps of Structure and Diversity indicators.
Sustainability 14 06830 g004
Figure 5. Thematic maps of the Dimensional Efficiency indicator.
Sustainability 14 06830 g005
Figure 6. Thematic maps of the Vegetation Efficiency indicator.
Sustainability 14 06830 g006
Figure 7. Ecological Efficiency indicator.
Sustainability 14 06830 g007
Figure 8. Population density and square meter for resident.
Sustainability 14 06830 g008
Table 1. Classes of the indicator Size.
Size ClassRule
Very WideA > 3 Hectares
Sufficiently Wide1 Hectare < A ≤ 3 Hectares
Not WideA ≤ 1 Hectares
Table 2. Classes of the indicator Compactness.
Compactness ClassRule
CompactCR < 0.60
Non-compact CR ≥ 0.60
Table 3. Classes of the indicator Dimensional efficiency.
Dimensional Efficiency ClassRule
Compact Core areaSize = Very wide, Compactness = Compact
Compact Stepping zoneSize = Sufficiently wide, Compactness = Compact
Compact HubSize = Not wide, Compactness = Compact
Non-compact Core areaSize = Very wide, Compactness = Non-compact
Non-compact Stepping zoneSize = Sufficiently wide, Compactness = Non-compact
Non-compact HubSize = Not wide, Compactness = Non-compact
Table 4. Values of the indicator Vegetation Structure.
Structure ClassRule
Low0.00 ≤ NDVI < 0.10
Mean-Low0.10 ≤ NDVI < 0.20
Mean0.20 ≤ NDVI < 0.30
Mean-High0.30 ≤ NDVI < 0.50
High0.50 ≤ NDVI ≤ 1.00
Table 5. Grouping of DLU classes into GLU classes.
General Land Use (GLU) ClassDetailed Land Use (DLU) Class
Wooded areaDecayed deciduous forests
Chestnut groves
Degraded chestnut groves
Holm oak woods
Pine forests
Robinia woods
Robinia thickets
Mixed arboretums of varying structural complexity and vineyards
Specialized arborets
Arboretums and tree gardens
Urban GreenMeadows and grassy slopes
Bushes of the ruderal areas
Herbaceous vegetation of the ruderal areas
Urban green areas
Cultivate areaArborate gardens with high structural complexity
Horticultural crops on large ridged or sub-flat surfaces
Horticultural, floricultural and arable crops
Vegetable gardens and arable land of areas on hydromorphic soils
Uncultivated areaFormer farm
Former terraced farms
Uncultivated areas
ShrubsHigh stain
Low stain
Sparse bushes
Table 6. Values of the indicator Vegetative Diversity.
Diversity ClassRule
WoodGLU = Wooded area
Urban Green GLU = Urban Green
Cultivate areaGLU = Cultivate area
Uncultivated areaGLU = Uncultivated area 0.50
ShrubsGLU = Shrubs
Table 7. Classes of the indicator Vegetation efficiency.
Vegetation Efficiency ClassRule
Vegetation effective(Structure = Mean) OR (Structure = Mean-High) OR (Structure = High)
AND
(Diversity = Wooded Area) OR (Diversity = Urban green) OR (Diversity = Cultivate Area)
Vegetation ineffectiveOtherwise
Table 8. Classes of the Ecological efficiency indicator.
Ecological Efficiency ClassRule
Ecologically effectiveDimensional efficiency = Compact or not compact Core area) OR (Dimensional efficiency = Compact Stepping zone) OR (Dimensional efficiency = Compact Hub)
AND
(Vegetation efficiency = Vegetation effective)
Ecologically ineffectiveOtherwise
Table 9. Classes used to typize a patch.
Patch ClassRule
Core area(Ecological efficiency = Ecologically effective) AND (Dimensional efficiency = Compact or not compact Core area)
Stepping zone(Ecological efficiency = Ecologically effective) AND (Dimensional efficiency = Compact Stepping zone)
Hub(Ecological efficiency = Ecologically effective) AND (Dimensional efficiency = Compact Hub)
Table 10. Source datasets used in the experimental tests.
SourceSource DatasetFormat
ISTATPartitioning of the municipality into census areasPolygons census areas in scale 1:10,000 in ESRI shape format
ISTATDataset of the population and building census aggregated by census zonesCensus population and buildings data in csv format
Campania regionLast recent topographic databasePoints, polylines and polygons of the topographic database in scale 1:5000 in ESRI shape format
Municipality of NaplesPartitioning of the municipal area in districtsPolygons districts in scale 1:5000 in ESRI shape format
Sentinel 2 satelliteNDVI Index evaluates the presence of photosynthetic activityRaster of the NDVI index in Geo-Tiff format
Copernicus land use dataLand Use classificationPolygons Land Use in scale 1:10,000 in Esri shape format
Publisher’s Note: MDPI stays neutral with regard to jurisdictional claims in published maps and institutional affiliations.

