Abstract
Few studies currently examine the effect of different disaster informational programmes because conducting such intervention studies is challenging. By providing two types of online disaster learning programmes, this intervention study measured changes made to three different perspectives: (1) disaster preventive awareness scores, (2) willingness to pay for disaster information (WTP), and (3) settlement preferences (preferences for post-disaster recovery goals). The participants engaged with one of two different types of 45-min learning programmes—one created as a narrative-based disaster learning programme (N = 218) and the other presented as a collective information disaster learning programme (N = 201). Consequently, both disaster preparedness scores and WTP increased statistically after both styles of disaster preparedness programmes. Furthermore, the increase generated by the narrative programme was greater (2.2 times higher for WTP value and 1.72 times higher in WTP value-increased probability). In their preprogramme answer, people who selected safety and nature conservation for post-disaster recovery goals improved their awareness scores. Despite both programmes having the same theme and length, only the narrative learning programme had a beneficial—improvement odds ratio for all three perspectives. Thus, the narrative-based disaster learning (vicarious) experience simultaneously improved people’s disaster awareness scores, willingness to pay for disaster information, and settlement preferences for disaster prevention.
1. Introduction
Although it is most cost-effective to develop disaster prevention awareness and take preventive actions prior to a disaster strike, it is challenging to do so [1]. For example, daily convenience is usually a higher priority than hazard risk maps [2]. Furthermore, local governments do not always want to assume responsibility for disclosing hazards or compensating victims, especially if a tragedy may proclaim an extensive range of dangers [3]. Additionally, people living in designated hazardous areas might ignore an updated risk map, considering it unacceptable information [4]. Such conflicts between governments and residents [5] and disparities in how people respond to information about potential catastrophes [6] are serious issues.
Studies have been conducted using a willingness to pay (WTP) survey to measure people’s interest in information regarding catastrophic risk [7,8,9,10]. According to the findings, income level frequently accompanies a higher WTP for disaster insurance or information [8,10]. In addition, a large percentage of residents (homeowners) lack adequate awareness of potential calamities. From a different standpoint, there is unique research that tested the behavioral effects of a narrative compared with scientific facts from a online experiment in a polluted urban watershed [11]. Another study indicates a necessity for considering both disaster risk and the value of the natural environment during stable times, such as the scenic value and recreational value [12]. Association between flood risk and housing choice addresses the link between examining the danger and the preference for a certain location [13]. The impact of negative attributes and the topic of non-participation have also been highlighted [14,15]. Considering these studies together, it is critical to assess what kinds of disaster risk information should be provided ahead of time to raise disaster prevention knowledge and interest. However, no intervention studies examine changes in disaster awareness and WTP across different ways of disseminating disaster information.
Next, recent studies on improving disaster preparedness awareness were divided into three categories: 1. Organising the issues pertinent to improving disaster awareness [16,17]. 2. Questionnaire survey on difficulties in increasing disaster awareness [18,19,20,21,22]. 3. Focusing on inherited disaster memories (monuments and stone monuments) [23,24].
The following two points pertain to the outcome of category 1: (1) disaster edu-cation is enhanced in countries with frequent disasters [16] and (2) direct experience of disasters enhances disaster awareness (however, most people do not experience dis-asters directly; therefore, vicarious experiences are important) [17]. The results from category 2 show a diversity of preferences and types of disaster education based on nationality [21]. Category 3 suggests a growing interest in the role of disaster memories (e.g., monuments and matters to be conveyed) [23,24]. In addition, most of the studies on disaster awareness use questionnaires, but only a few have conducted intervention surveys [22].
While previous reviews indicate the importance of the direct experience of disasters, vicarious experiences are also important because most people rarely experience disasters directly. In addition, there are few studies on the vicarious experience of disasters as intervention study. There is also no study collectively analyzing both people’s interest in disaster information (WTP) and disaster awareness (Figure 1).
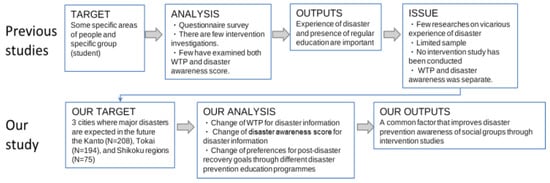
Figure 1.
Diagram of theoretical model of existing studies and the current study’s research.
Consequently, there are few intervention studies on the quantitative effects in cases in which subjects—including those with various backgrounds—vicariously engage with different types of disaster information. Therefore, this study aims to challenge this issue (Figure 1).
This study aims to quantify the effects of different information styles on disaster awareness and interest as it pertains to catastrophe information. Because the effect of such information varies significantly among people, this study conducted experiments to quantify this impact and investigate the effects of programme style. In addition, this research explored people’s fears about disasters and their preferences for post-disaster living locations and recovery goals. This study also scrutinized the association between gender and residential variables and social value orientation, which assesses how people wish to distribute rewards among themselves and others.
2. Materials and Methods
2.1. Overview of the Procedures
Our purpose is to assess whether there is a difference in the disaster prevention awareness scores, disaster information evaluations (WTP), and preferences for settlement after a disaster between participants engaged in two different types of online learning programmes covering the 2011 Tohoku earthquake and tsunami. The 2011 Great East Japan Earthquake was the most severe disaster to hit Japan in modern times, as it was a combination of three disasters: earthquake, tsunami, and nuclear accident. A magnitude 9.0 (Mw) earthquake occurred at 2:46 p.m. on 11 March, which caused a tsunami that reached more than 40 m. This disaster killed 19,759 people, cost USD 235 billion, and destroyed houses and facilities, including a nuclear plant [25,26]. This study used two different programmes to examine how the knowledge of those living outside the 2011 Tohoku disaster area influences disaster awareness and WTP for disaster information.
One was a narrative-based disaster learning programme (narrative-based programme) based on the 10-year experience of the victims affected by the reconstruction plan and those involved in developing the reconstruction plan (Table 1). The other programme was comprised of a collection of fragmented pieces of information from several public sectors and individual sources on the 2011 Tohoku disaster [27] (Table 2). These two programs can be experienced at the following URL (seeing in Appendix A) [28].

Table 1.
Components of the arrative-based disaster learning programme.
Table 2.
Components of the collective information disaster learning programme (National Diet Library Great East Japan Earthquake Archive, https://kn.ndl.go.jp/#/movie?searchPattern=simple, accessed on 23 May 2022).
Four hundred seventy-seven participants in this study were from the Kanto (N = 208), Tokai (N = 194), and Shikoku regions (N = 75) who registered with Yahoo Crowd Sourcing between December 2021 and January 2022. The Headquarters for Earthquake Research Promotion updated the probability of an earthquake in Japan. According to the announcement, tsunamis triggered by large earthquakes are likely to hit the three regions of Shikoku, Kanto, and Tokai in the not-too-distant future (Figure 2). Figure 3 shows this study’s materials and programme flow.
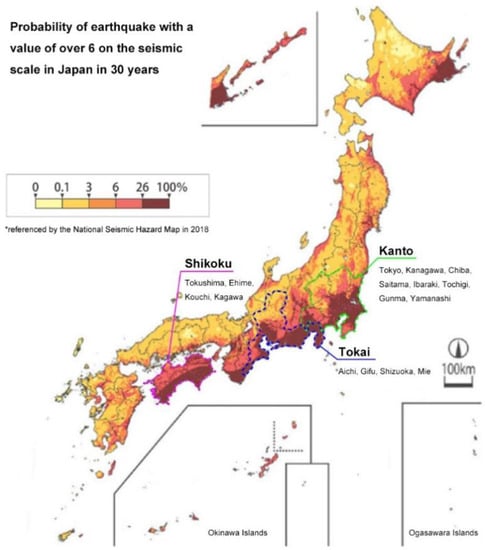
Figure 2.
Target region of survey respondents and earthquake probability forecasts (The Headquarters for Earthquake Research Promotion (https://www.jishin.go.jp/evaluation/evaluation_summary/#yosokuchizu, accessed on 23 May 2022) and disaster risk probability prediction map partially modified by quotations.
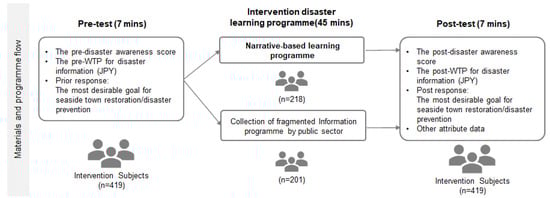
Figure 3.
Our study materials and programme flow.
2.2. Participants
Having voluntarily applied to the Yahoo Crowd questionnaire platform, the participants (n = 477) applied willingly to the catastrophe experience learning programme. They provided their disaster awareness scores and the quantity of WTP for disaster information in advance, after first giving their informed consent within 7 min. For roughly 45 min, half of the participants watched a narrative-based learning programme, while the other half viewed a collective information disaster learning programme (collective information programme). Within last 7 min, the participants were then asked to re-enter their disaster awareness scores and the quantity of WTP for disaster information. They were given one hour to complete the entire survey. This study eliminated the responses of those who repeated the same alternatives and those who did not watch the programme contents correctly, based on the confirmation questions they answered after watching the video. The total number of legitimate responses was 419; the valid response rate was 88%.
As shown in Table 3, there is no bias in the age, gender, number of family members living together, housing type, or disaster experience of the full sample of all participants, indicating that both the pool of subjects and the intervention study were sound.
Table 3.
Descriptive statistics of the full sample and of each programme branch.
2.3. Experimental Treatment
This study continued to carry out the survey until a near-equal number of males and females had completed the task. The respondents were limited to one response per Yahoo ID so that each person could complete the poll only once.
2.4. The Content of the Two Different Disaster Learning Programmes
A narrative-based learning programme provided participants with stories of people who experienced the 2011 Tohoku disaster. In March 2019, Dr. Misato Uehara of Shinshu University organised a three-day event with researchers from Singapore and Taiwan, urban engineering researchers from Tohoku University, the Reconstruction Agency, Shinchi Town (Fukushima Prefecture) officials overseeing reconstruction, and disaster victims. During the event, people shared what happened in the aftermath of the Great East Japan Earthquake in the affected areas. Data collected from the event enabled these contents to be gathered in a 10-year overview of the challenges from the perspective of each stakeholder. In other words, the narrative-based learning programme was comprised of seven stories spanning a decade’s worth of experiences, from the individual standpoints of people in various positions (e.g., citizens, Reconstruction Agency officials, reconstruction managers in affected areas, fishermen, and researchers who participated in reconstruction plans) (Table 1). Those who participated in this narrative-based programme watched animations or viedoes based on these stories.
Conversely, the collective information programmes provided participants with content from several public sectors and individuals, including actual video footage of the disaster. The collective information programme utilized Japan’s official portal site of the Great East Japan Earthquake archives. The Japanese National Diet Library and the Ministry of Internal Affairs and Japanese Communications (MIC) collaborated to develop and launch the “National Diet Library Great East Japan Earthquake Archive”, which is a portal allowing users to search and use digital data related to the 2011 disaster [27]. There are videos, audio recordings, and documentary materials provided by government agencies, the Nuclear Regulatory Commission, and groups and individuals affiliated with various municipal governments. There are also 107 documents and 20,049 audio recordings and videos; new content has also been uploaded every year since 2011 [27]. In other words, there is a lot of content from government agencies, local governments, and national government offices. The participants could watch any content they wanted to for the same length of time as that provided in the narrative-based programme (i.e., 45 min) (Table 2).
2.5. Explanatory Variables
This study considered participants’ personal characteristics, such as gender, place of residence, age, and whether the user had experienced a disaster. Then, this study analysed the relationship alongside the degree of change in disaster awareness scores and WTP between the two types of learning programmes.
2.6. Statistical Analysis
To examine the relationship between the degree of change in stress and explanatory variables, this study performed the following two steps:
- (1)
- considered the differences of the objective variables (WTP and disaster awareness scores) according to each explanatory variable; and
- (2)
- performed explanatory modeling of the change in the objective variables (WTP, disaster awareness scores, and settlement preferences).
Categorical data are expressed as frequencies and percentages; continuous data are expressed as means ± standard deviations (SDs). Additionally, this study performed all statistical analyses using R version 4.0.2.
Figure 4 shows the study materials and programme flow.
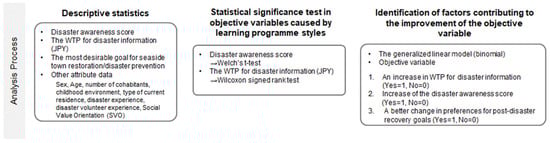
Figure 4.
The study’s analytical process.
3. Results
The average pre-disaster score of all participants was 75.86 (SD: 7.99); the average pre-WTP for disaster information was JPY 731.92 (SD: 1604.92) Table 3.
After 45 min of exposure to the two types of disaster learning programmes, the mean post-disaster score was 77.84 (SD: 9.10); the average WTP for disaster knowledge was JPY 1216.67 (SD: 4872.12) Table 3.
Overall, 354 (84.49%) of the 419 participants claimed, before going through the learning programme, that they would pay for disaster information; 357 (85.20%) said they would pay after participating in the programme.
3.1. Differences in Disaster Awareness and WTP for Disasters as a Result of Learning Programme Style
3.1.1. Disaster Awareness Score
This study examined the differences between the before- and after-disaster awareness scores using Welch’s t-test, given that the scores before and after participating in the two learning programmes were normally distributed. The participants’ average disaster awareness score rose statistically due to the collective information programme (Figure 5). The pre-disaster awareness score was 75.11 (SE: 0.56) and the post-disaster awareness score was 76.99 (SE: 0.68). In addition, the narrative-based learning programme caused the participants’ mean disaster awareness score to increase statistically (Figure 5). The pre-disaster awareness score was 76.67 (SE: 0.54); the post-disaster awareness score was 78.76 (SE: 0.55).
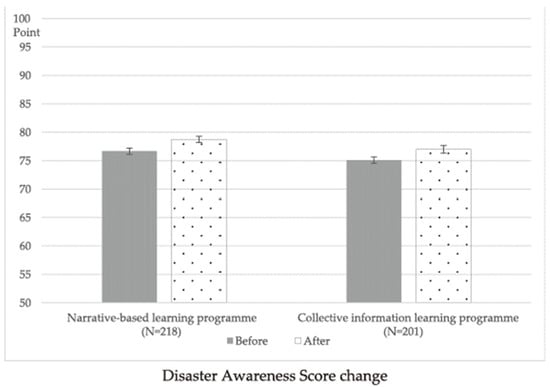
Figure 5.
This figure depicts the average disaster awareness score before and after participation in the two different disaster learning programmes concerning the 2011 Japan earthquake and tsunami disaster: the narrative-based programme (gray; n = 218) and the collective information learning programme (white; n = 201). The error bars represent standard deviations from the mean. The mean and standard error values originate from the ordinary least squares (OLS) regression model with covariates.
Although both programmes favorably influenced participants’ average disaster awareness scores, the narrative-based learning programme significantly more increased this score.
3.1.2. WTP for Disaster Information
This study assessed the difference between the before and after values of WTP for disaster information using the Wilcoxon signed-rank test, given that the values before and after experiencing the learning programme were non-normally distributed for all.
The WTP for disaster information grew statistically as a result of the collective information programme (Figure 6); WTP prior to taking the programme was JPY 733.51 (SE: 110.71); WTP afterward was JPY 886.86 (SE: 139.42).
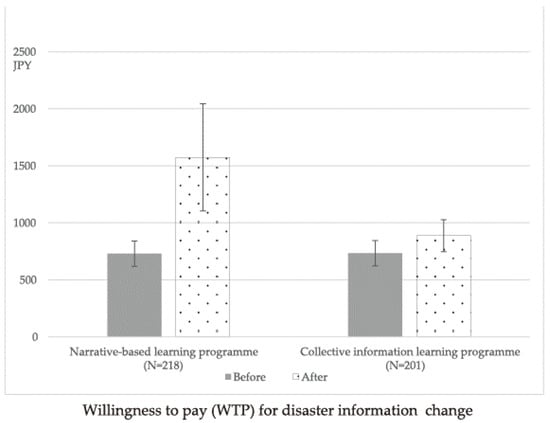
Figure 6.
This figure shows the average WTP for disaster information before and after subjects participated in two different disaster learning programmes concerning the 2011 Japan earthquake and tsunami disaster: a narrative-based programme (gray; n = 218) and a collective information learning programme (white; n = 201). The error bars represent standard deviations from the mean. The mean and standard error values originate from the ordinary least squares (OLS) regression model with covariates.
In addition, the narrative-based programme significantly boosted participants’ WTP for disaster information (Figure 6); WTP prior to taking the programme was JPY 730.20 (SE: 110.89); WTP afterward was JPY 1574.37 (SE: 471.27).
Both programmes considerably increased the participants’ disaster awareness scores. Particularly, after participating in the narrative-based programme, the price of WTP more than doubled, resulting in a meaningful shift in interest in disaster prevention.
3.2. The Generalized Linear Model Analysis
This study performed a comprehensive model analysis of the effects of the disaster prevention learning programme, including participant attributes. Two of the objective variables (i.e., the disaster awareness score and the WTP for disaster information) were quantitative data, although the disaster prevention score had a normal distribution and the WTP did not. The generalized linear model (GLM) allowed this study to examine the objective var-iables in terms of qualitative data. The GLM can also be used to predict with an explanatory variable, which follows a distribution other than the normal distribution (e.g., binomial distribution, Poisson distribution, etc.). Thus, this study defined the improvement of desirable recovery goals, both before and after the survey, as objective variables. The objective varia-bles were converted into qualitative data: the disaster awareness score rose (yes = 1, no = 0) after participating in a learning programme (yes = 1, no = 0); WTP rose after participating in a learning programme (yes = 1, no = 0); and settlement preferences (desirable recovery goals) improved after participating in a learning programme (yes = 1, no = 0).
There is a considerable problem, namely, that while a JPY 32 trillion (approximately USD 270 billion) reconstruction budget was spent on the region, the population nonetheless decreased by 380,000 people (except for the following number of 15,899 deaths and 2527 missing) in the affected areas of Tohoku [29]. The reconstruction budget was not cost-effective. From this perspective, when choosing settlement as post-disaster reconstruction goals as follow three options, we assumed that it was better for society to remain within the region and opt for disaster prevention (2) and rebuild an attractive environment (3) than for residents to relocate (1).
- (1)
- migrate to non-seaside areas with no tsunami risk;
- (2)
- build high levees, relocate to higher ground, and raise the land;
- (3)
- migrate to a safer area within the district, restore tide-protection forests, and convert flooded areas into natural parks.
3.2.1. The Improvement in WTP for Disaster Information
The results indicated that the variables significantly contributing to whether one’s WTP increased (yes = 1, no = 0) were the following: (1) the type of programme (narrative-based learning programme = 1, collective information programme = 0) and (2) the number of cohabitants. The odds ratio of WTP increased (yes = 1, no = 0) and was 1.72 times higher for the narrative-based learning programme, indicating that consumers would willingly pay more for disaster information than those who participated in the collective information programme (Table 4). In addition, when the number of participants’ cohabitants rose, the odds ratio of WTP increased (yes = 1, no = 0) and was 1.26 times higher for each numerical increase in cohabitants (Table 4).
Table 4.
Prediction using logistic regression, with an increase in WTP for disaster information.
3.2.2. Improvement in the Disaster Awareness Score
The following variables substantially contributed to whether subjects’ disaster awareness scores improved (yes = 1, no = 0) after participating in the learning programme, specifically regarding category variable of preferences for post-disaster dwelling options:
- (1)
- migrate to non-seaside areas with no tsunami risk;
- (2)
- build high levees, relocate to higher ground, and raise the land;
- (3)
- migrate to a safer area within the district, restore tide-protection forests, and convert flooded areas into natural parks.
Other variables included the reward share preference preference: someone who gives more to others to themselves (yes = 1, no = 0), and of someone who resides in the Kanto region (yes = 1, no = 0).
Compared to those who prefer to migrate to another site after a disaster, individuals who prefer safety and nature conservation for their post-disaster housing improved their disaster awareness scores by an odds ratio of 1.63 times (Table 4).
In terms of the preference reward share ratio, people who maximized their own profits versus those who wanted to share more earnings with others improved their score of disaster awareness by an odds ratio of 1.10 times (Table 5).
Table 5.
Predictions using logistic regression increase of the disaster awareness score.
3.2.3. Changing preferences for post-disaster recovery goals
The results indicated that the variables which significantly contributed to whether there was a positive change in preferences for post-disaster recovery goals (yes = 1, no = 0) were the type of programme (narrative-based learning programme = 1, collective information programme = 0), and the number of cohabitants. The odds ratio of the change to a better preference for a recovery goal (yes = 1, no = 0) was 3.44 times higher for the narrative-based learning programme than for the collective information programme (Table 6). Conversely, the collective information programme, which included a wealth of information in the tragedy’s early aftermath, might be unlikely to inspire people to rebuild and stay in their damaged hometowns. In addition, when the number of participants’ cohabitants rose, the odds ratio change pertaining to a better preference for recovery goal (yes = 1, no = 0) was 1.69 times higher for each additional cohabitant (Table 6).
Table 6.
Predictions using the logistic regression of settlement preferences improvement in post-answer goal for seaside town rehabilitation/disaster prevention.
4. Discussion
When compared to the collective learning programme of the National Diet Library’s aggregated government and public agency information on the damage caused by the Great East Japan Earthquake in Japan in 2011, the narrative-based learning disaster programme—comprised of a narrative spanning 10 years, told from stakeholders’ perspectives—showed a statistically significant improvement inx terms of participants’ WTP for disaster information and their disaster awareness score.
Studies of disaster education evaluations that do not use numerical indicators (e.g., WTP or disaster scores) demonstrate the necessity of addressing the impact of disaster causes, prevention and response, management, and recovery [30]. Previous studies also revealed the difficulty of translating and communicating available information in fitting one area with another [31]. Furthermore, there is a lack of evidence for the effectiveness of disaster education programmes [32]; indeed, post-disaster external education and training are needed [33]. What is more, there has been a pushback against advocacy [33]. In this regard, this study’s modeling analysis highlights relevant variables for the quantitative impact of the 2011 crisis on disaster consciousness among inhabitants throughout different regions.
Furthermore, in evaluations of disaster education that are independent of numerical indicators (WTP or disaster reduction scores), the value of formal education has been evaluated [34,35]. In addition, this study demonstrated that a narrative-based learning programme more significantly impacted a group of respondents comprised of different genders, ages, and places of residence than a programme based on a collection of disparate pieces of information. In addition, this study showed that people who preferred to stay in the area rather than migrate after a disaster were likely to increase their disaster awareness score, regardless of the type of disaster information they received.
As a result, the findings suggest that when provided in narrative form, disaster information can boost interest in disaster information and disaster preparedness via quantitative evidence. Therefore, this could work as a suggestion to raise awareness among residents who were unaffected by the disaster. This is helpful in solving problems identified in previous studies as the most cost-effective yet simultaneously the hardest to improve. Furthermore, respondents who lived in the Kanto region (including the Tokyo metropolitan area) were more likely to have lower disaster awareness scores than those in the Shikoku and Tokai regions. This could result from Tokyo having a large population of residents who live alone.
As for reconstruction goals after a disaster, the WTP for disaster information was significantly lower among those who preferred to leave affected areas and relocate elsewhere than those who preferred to stay in the same area with disaster prevention and environmental conservation.
Notably, despite having the same viewing time as the collective information programme, the narrative learning programme increased WTP for disaster information by 1.7 times and the desire to balance the environment and disaster prevention by staying the area in post-disaster recovery goals. In addition, although disaster awareness scores im-proved in both programmes, the score was much improved in the narrative-based programme in comparison to the collective information programme.
This outcome is significant because the National Diet Library’s collaborative information learning programme has much content: 20,055 videos and 1,134,665 photographs are available. One explanation may be that perhaps it was difficult for participants to know where to begin with the extensive archives. Another reason may be that personalization may have been difficult because the information is not arranged chronologically.
In contrast, participants using the narrative-based learning programme may have interpreted the information they received as if they had experienced the complex calamity of the actual 2011 Tohoku earthquake and tsunami.
One of the latest studies suggests that the immediate aftermath of a disaster (e.g., the earthquake) presented an opportunity for increasing awareness of disaster prevention, such as the purchase of insurance. Therefore, this study also assumed that the collection of fragmented information compiled by the public sector, which is greater during the immediate aftermath, is effective for improving disaster awareness. However, this intervention study found that narrative-based learning programmes were statistically and significantly more likely to increase disaster awareness and WTP among people from different demographics than a collection of disparate information gathered by the public sector.
Conversely, vicariously experiencing a disaster through exposure to information from the immediate aftermath may increase the proportion of residents who leave their hometowns and prefer excessive levees and land-development work. This may lead to a considerable increase in social cost.
Previous studies have also highlighted the need to integrate and share interdisciplinary tools, concepts, and knowledge to improve children and the younger generation’s global perspective on resilience [36]. Yet another study suggests that in addition to being susceptible to material catastrophes, such as damage to buildings and infrastructure, community and social vulnerability should likewise be investigated [37]. In this sense, the content communicated via narrative has the potential both to integrate and to convey the vital issues and important aspects with regard to a disaster. Narrative-based learning is also well-suited for sharing changing issues, such as the changing feelings of both communities and individuals after disasters, rather than simple individual facts.
5. Conclusions
This study provides causal evidence, through objective measures, of the extent to which information provided by an unspecified number of people—and stories of those suffering because of a disaster—can effectively change people’s awareness of disaster prevention.
To this end, this study asked participants not just about their willingness to cope with future disasters, but also their preferences for post-disaster living locations and recovery aims. This study also examined social value orientation, which assesses how people wish to distribute rewards among themselves and others, and the association between gender and residential variables.
As a result, this study was able to provide quantitative evidence of the following key themes. A story that covers a 10-year period, from an integrated perspective, rather than a large amount of individual knowledge, may improve people’s willingness to cope with future disasters. In the collective information programme comprised of approximately 20,000 videos, most of the participants viewed the initial issues arising from the immediate aftermath of a disaster (e.g., material damage, radioactive contamination, and decontamination) In contrast, the narrative-based information, which organized people’s experiences in the 10 years after the disaster from each side’s perspective, could reveal the residents’ frustration immediately after the disaster and the difficulty of reaching a consensus.
Possibly, the narrative-based programme may share the long-term and significant mismatch decision problem, which was decided by the majority of votes immediately after the disaster. This mismatch decision is due to focus on only disaster preveantion, such as levees and landfills, and took a long time to developde; as a result, there were many towns to which survivors of the disaster did not return. In contrast to the collective programme, the narrative-based programme might allow participants to feel a reason of above dcision mismatch factors.
This study yielded a set of factors that contributed to improvements in both WTP and disaster awareness scores due to its quantitative experiment. This experiment consisted of 419 subjects, each of whom participated in a one-hour intervention exercise online. The results demonstrated which ways of delivering disaster-related information would be more effective for people who cannot directly experience a disaster (which was also the case for disaster survivors until that time).
In addition, this study hypothesized that the collection of fragmented information programmes by the public sector might be effective because the collective programme mainly includes information on the immediate aftermath of a disaster. However, the narrative-based learning programme improved disaster awareness, WTP for disaster information, and response choices in the event of a disaster to a greater degree.
6. Limitations
This study also found that people living alone or without family have difficulty increasing their awareness of disaster preparedness or interest in disaster information (WTP). Those who prefer moving to a different location in the event of a disaster may have less motivation to raise their awareness. Therefore, additional research is needed to explore the impact of disasters on these individuals and the younger generation of children who could not be surveyed at this time.
Moreover, follow-up studies will be necessary to determine whether the observed effects can be sustained in the long term.
Author Contributions
M.U. conducted the literature review and conceived of the study. K.K. and M.U. built the data extraction file, while M.U. performed data extraction. M.F. and M.U. analyzed the data. K.S. advised on WTP questions and analytical approaches. M.U. supervised the all process. All authors contributed extensively to this work, interpreted the data, contributed substantially to the writing and revision of the manuscript, and read and approved the final version. All authors have read and agreed to the published version of the manuscript.
Funding
This work was mainly supported by funds from the 2021 Japan Prize Heisei Memorial Research Grant. This work is also supported by funds from JST Grant Number JPMJPF2109, Research Institute for Humanity and Nature, Project No. RIHN 14200103.
Institutional Review Board Statement
This study was conducted according to the guidelines of the Declaration of Helsinki and approved by Shinshu University’s Human Ethics Sub-Committee of the Faculty of Economics and Law (date of approval: 8 December 2022). All participants gave informed consent for the survey. The participants were informed about the incentives via an online Google form. The participants received JPY 500 as compensation for their time (1 h).
Informed Consent Statement
Informed consent was obtained from all participants involved in the study. These incentives were explained to them in an online Google form.
Data Availability Statement
The data are not publicly available as they were obtained under conditions that are not intended to be published.
Acknowledgments
The authors thank the respondents for their participation in the study. We also thank Yuta Masakane, Hiroaki Masuhara, Yuki Arai, Shunsuke Yamamoto, Shinshu University, and Naoya Furuta.
Conflicts of Interest
The authors declare no conflict of interest.
Appendix A
A disaster information sharing programme using the findings of this study. The results of this study have been incorporated into a disaster information sharing programme, which can be found online: https://living-with-disaster-misato-uehara-s-school.teachable.com/p/home (accessed on 5 November 2021). In addition to narrative-based information, connections to the Japanese National Diet Library Great East Japan Earthquake Archive and a list of pertinent previous studies are available in one convenient location.
References
- Henstra, D. Federal emergency management in Canada and the United States after September 11 2001. Can. Public Adm. 2003, 46, 103–116. [Google Scholar] [CrossRef]
- Katada, T.; Oikawa, Y.; Mimura, K. Kouzui Hazaadomappu No Sakusei Joukyo to Sakusei Jichitai Niyoru Jigo Hyouka. (Flood Hazard Map: Composition and Evaluation in Local Governments in Japan). In Proceedings of the Hydraulic Engineering; Japan Society of Civil Engineers: Tokyo, Japan, 2001; Volume 45, pp. 31–36. [Google Scholar] [CrossRef][Green Version]
- Nakasuji, A. Naze “Dosha saigai hazaad map” wa dekinai noka? (Why is it difficult to develop a “landslide disaster hazard map”?). J. Jpn. Soc. Eng. Geol. 2005, 46, 250–255. [Google Scholar] [CrossRef]
- Katada, T.; Kodama, M.; Saeki, H. Study on residents’ recognition of a flood hazard map and promotion measures of its recognition. In Proceedings of the Hydraulic Engineering; Japan Society of Civil Engineers: Tokyo, Japan, 2004; Volume 48, pp. 433–438. [Google Scholar] [CrossRef][Green Version]
- Siqueira, A.M.D.; Mendes, J.N.; Lemos, A.J. Environmental disasters and socio-spatial conflicts in brazil. Geografares 2016, 1, 109–121. [Google Scholar]
- Renn, O. Risk communication: Towards a rational discourse with the public. J. Hazard. Mater. 1992, 29, 465–519. [Google Scholar] [CrossRef]
- Chorus, C.G.; Timmermans, H.J.P. Determinants of stated and revealed mental map quality: An empirical study. J. Urban Des. 2010, 15, 211–226. [Google Scholar] [CrossRef]
- Moon, J.W.; Hwang, H.; Chung, J.B. Factors affecting awareness of preparedness after moderate earthquakes: An analysis of the Pohang earthquake in Korea. Disaster Prev. Manag. Int. J. 2019, 29, 405–420. [Google Scholar] [CrossRef]
- Botzen, W.J.W.; van den Bergh, J.C.J.M. Risk attitudes to low-probability climate change risks: WTP for flood insurance. J. Econ. Behav. Organ. 2012, 82, 151–166. [Google Scholar] [CrossRef]
- Suryanto, S.; Kuncoro, M. Risk perception and economic value of disaster mitigation case of Bantul post earthquake May 2006. South East Asian J. Manag. 2012, 6, 81–99. [Google Scholar] [CrossRef]
- Byerly, H.; Ferraro, P.J.; Li, T.; Messer, K.D.; Weigel, C. A story induces greater environmental contributions than scientific information among liberals but not conservatives. One Earth 2021, 4, 545–552. [Google Scholar] [CrossRef]
- Becken, S.; Hughey, K.F.D. Linking tourism into emergency management structures to enhance disaster risk reduction. Tour. Manag. 2013, 36, 77–85. [Google Scholar] [CrossRef]
- Fan, Q.; Davlasheridze, M. Flood risk, flood mitigation, and location choice: Evaluating the National Flood Insurance Program’s Community Rating System. Risk Anal. 2016, 36, 1125–1147. [Google Scholar] [CrossRef] [PubMed]
- Su, H.Y.; Li, J.M. Attribute non-attendance in choice experiments: A study of residents’ willingness-to-pay for the disposal of Enteromorpha prolifera in Qingdao, China. Ocean. Coast. Manag. 2020, 191, 105184. [Google Scholar] [CrossRef]
- Freeman, D.; Garety, P.A.; Bebbington, P.E.; Smith, B.; Rollinson, R.; Fowler, D.; Kuipers, E.; Ray, K.; Dunn, G. Psychological investigation of the structure of paranoia in a non-clinical population. Br. J. Psychiatry 2005, 186, 427–435. [Google Scholar] [CrossRef] [PubMed]
- Zhang, M.; Wang, J. Trend Analysis of Global Disaster Education Research Based on Scientific Knowledge Graphs. Sustainability 2022, 14, 1492. [Google Scholar] [CrossRef]
- Becker, J.; Paton, D.; Johnston, D.; Ronan, K.; McClure, J. The role of prior experience in informing and motivating earthquake preparedness. Int. J. Disaster Risk Reduct. 2017, 22, 179–193. [Google Scholar] [CrossRef]
- Titko, M.; Ristvej, J.; Zamiar, Z. Population preparedness for disasters and extreme weather events as a predictor of building a resilient society: The Slovak Republic. Int. J. Environ. Res. Public Health 2021, 18, 2311. [Google Scholar] [CrossRef]
- Gizzi, F.T.; Kam, J.; Porrini, D. Time windows of opportunities to fight earthquake under-insurance: Evidence from Google Trends. Humanit. Soc. Sci. Commun. 2020, 7, 61. [Google Scholar] [CrossRef]
- Bronfman, N.C.; Cisternas, P.C.; Repetto, P.B.; Castañeda, J.V. Natural disaster preparedness in a multi-hazard environment: Characterizing the sociodemographic profile of those better (worse) prepared. PloS ONE 2019, 14, e0214249. [Google Scholar] [CrossRef]
- Adu-Gyamfi, B.; Shaw, R. Characterizing Risk Communication and Awareness for Sustainable Society: The Case of Foreign Residents in the Tokyo Metropolitan Area of Japan. Sustainability 2021, 13, 5786. [Google Scholar] [CrossRef]
- Azmi, E.S.; How, V.; Rahman, H.A. Effect of health belief model on flood-risk educational approach among elementary school children in Malaysia. Jàmbá J. Disaster Risk Stud. 2021, 13, 1–6. [Google Scholar] [CrossRef]
- Garnier, E.; Lahournat, F. Japanese stone monuments and disaster memory–perspectives for DRR. Disaster Prev. Manag. Int. J. 2022, 31. [Google Scholar] [CrossRef]
- de Guttry, C.; Ratter, B. Expiry date of a disaster: Memory anchoring and the storm surge 1962 in Hamburg, Germany. Int. J. Disaster Risk Reduct. 2021, 70, 102719. [Google Scholar] [CrossRef]
- The Mystery of the 40-Meter Tsunami: The Great East Japan Disaster. Available online: https://www3.nhk.or.jp/nhkworld/en/tv/documentary/20200405/4001352/ (accessed on 27 April 2022).
- 3 Nuclear Reactors Melted Down after Quake, Japan Confirms. Available online: http://edition.cnn.com/2011/WORLD/asiapcf/06/06/japan.nuclear.meltdown/index (accessed on 27 April 2022).
- National Diet Library Great East Japan Earthquake Archive. Available online: https://kn.ndl.go.jp/#/movie?searchPattern=simple (accessed on 15 November 2021).
- Global Platform Project to Share Natural Disaster Experiences Based on 10 Years Research in Fukushima by “Japan Prize Heisei Memorial Research Grant”. Available online: https://living-with-disaster-misato-uehara-s-school.teachable.com/p/home (accessed on 5 November 2021).
- Per Capita Burden: 250,000 Yen. The Reconstruction Budget Was Used Like This Disaster Recovery in the Era of Depopulation. Available online: https://www.nhk.or.jp/gendai/articles/4520/index.html (accessed on 30 April 2022).
- Apronti, P.T.; Osamu, S.; Otsuki, K.; Kranjac-Berisavljevic, G. Education for disaster risk reduction (DRR): Linking theory with practice in Ghana’s basic schools. Sustainability 2015, 7, 9160–9186. [Google Scholar] [CrossRef]
- Saizen, I.; Sasi, P.K. Awareness workshop as an effective tool and approach for education in disaster risk reduction: A case study from Tamil Nadu, India. Sustainability 2015, 7, 8965–8984. [Google Scholar]
- Johnson, V.A.; Ronan, K.R.; Johnston, D.M.; Peace, R. Evaluations of disaster education programs for children: A methodological review. Int. J. Disaster Risk Reduc. 2014, 9, 107–123. [Google Scholar] [CrossRef]
- Blackburn, S. What does transformation look like? Post-disaster politics and the case for progressive rehabilitation. Sustainability 2018, 10, 2317. [Google Scholar] [CrossRef]
- Hoffmann, R.; Muttarak, R. Learn from the past, prepare for the future: Impacts of education and experience on disaster preparedness in the Philippines and Thailand. World Dev. 2017, 96, 32–51. [Google Scholar] [CrossRef]
- Frankenberg, E.; Sikoki, B.; Sumantri, C.; Suriastini, W.; Thomas, D. Education, vulnerability, and resilience after a natural disaster. Ecol. Soc. 2013, 18, 16. [Google Scholar] [CrossRef]
- Masten, A.S. Global perspectives on resilience in children and youth. Child Dev. 2014, 85, 6–20. [Google Scholar] [CrossRef]
- Dormady, N.C.; Greenbaum, R.T.; Young, K.A. Value of information on resilience decision-making in repeated disaster environments. Nat. Hazards Rev. 2021, 22, 04020048. [Google Scholar] [CrossRef]
Publisher’s Note: MDPI stays neutral with regard to jurisdictional claims in published maps and institutional affiliations. |
© 2022 by the authors. Licensee MDPI, Basel, Switzerland. This article is an open access article distributed under the terms and conditions of the Creative Commons Attribution (CC BY) license (https://creativecommons.org/licenses/by/4.0/).