Abstract
Cities play a pivotal role in climate change mitigation; however, the methodology to quantify actual emission reduction potential of climate interventions implemented by cities and regions has been lacking. The aim of this study is to create a framework to assess positive climate impacts of cities and regions by modifying the life-cycle assessment (LCA)-based carbon handprint framework. Additionally, a step-by-step guidance to perform calculations is presented. A case study of the Finnish city of Espoo is used to further develop and test the regional handprint approach both qualitatively and quantitatively. According to our research, a city′s carbon handprint can be determined through the three main mechanism categories of ownership, operating environment and projects. In the case of Espoo, the carbon handprint of building public electric vehicle charging stations on city-owned land from the mechanism category of ownership showed to be up to 110 tCO2eq/a for 18 charging stations. However, the overall handprint of a city consists of several actions, to be calculated separately. The regional carbon handprint approach provides a useful instrument to reliable quantify and communicate the innovative climate actions implemented by a city and it can be used in cities′ climate work as well as in marketing and branding purposes. Handprint turns the focus on possibilities for increasing a city vitality. As a provider of climate solutions, a city can attract new taxpayers and by focusing efforts to a certain sector, a city can help companies to reach synergies in fields essential from the climate point of view.
1. Introduction
Urban areas play a significant role in global climate change mitigation and the implementation of low carbon solutions. Due to the current trend towards ever greater urbanisation, more than half the world′s population live in cities, and this share is constantly increasing [1]. Urbanisation is also a major contributor to global climate change. In 2020, cities were responsible for two thirds of global energy consumption and over 70% of greenhouse gas (GHG) emissions [2]. Various actions to cut urban emissions and achieve carbon neutrality have already been implemented. These are based on city-level GHG inventories and voluntary frameworks and share a focus on reducing GHG emissions from the key sectors of energy and transportation [3].
A community-level GHG inventory, that is, a carbon footprint calculation, is the main tool used to support the carbon neutrality of cities and communities [4]. A city′s carbon footprint assessment gives an understanding of emission sources and quantities [5]. Thus, transparent and consistent inventories form the basis of cities′ climate action plans. Several international voluntary frameworks for calculating cities′ carbon footprints have been developed, such as the GHG Protocol for Cities [5] and PAS 2070 [6]. City-level carbon emission inventories based on different frameworks have been shown to be useful in lowering local emissions and increasing the effectiveness of local climate work [7]. Additionally, different city emission accounting systems, such as territorial-, production-, and consumption-based calculations, have been developed to deepen awareness of climate change mitigation in cities [8]. Cities′ climate plans may also be linked to a national regulatory process, as in Sweden, Italy and France [9]. Additionally, cities may have made national (e.g., carbon neutrality communities in Finland (Hinku) [10]) and international (e.g., Covenant of Mayors (CoM) [11], C40 Cities Climate Leadership Group [12]) commitments to climate actions aimed at achieving carbon neutrality. However, it has been recognised that cities struggle to achieve carbon neutrality when regional targets are more ambitious than national ones [13]. In contrast, cities are better enabled to achieve carbon neutrality targets through commitment on the local level, a shared understanding between the city, its citizens and stakeholders in the vision and goals of climate action, and a high level of local activities [4].
Alongside footprint approaches, which mainly measure environmental burden, ‘handprint’ thinking has recently emerged, which assesses the positive environmental impacts of actions [14]. Norris et al. [15] introduced a framework to quantify the positive environmental, economic and social changes caused by an actor when compared to a business-as-usual situation. Biemer [16] highlighted the importance of concentrating on the positive point of view when promoting sustainability. The carbon handprint framework proposed by Grönman et al. [14] and Pajula et al. [17] provides an approach to quantify and communicate the positive climate impacts that solutions can achieve compared to a baseline practice. The fundamental characteristic of the carbon handprint approach is that the handprint can be achieved by improving the performance of other actors and reducing their carbon footprint. As centres of education, research, economic activities, innovation and new technologies [18], cities influence private and public actors as well as other cities and regions [19]. Thus, a city′s potential to implement climate change mitigation actions is broader than simply reducing its own carbon footprint. For example, Mohareb et al. [20] considered cities′ role in mitigating life-cycle GHG emissions from the food system in the United States through selected measures. The authors concluded that the actions implemented by cities, such as waste management practices or reduction of post-distribution food waste, have the potential to reduce total food sector emissions when compared with the baseline situation. Such findings suggest that cities have the potential to positively influence emissions on a large scale.
Community-level GHG inventory frameworks focus on the identification of emission sources and quantities [5]. However, cities lack a more systematic understanding of how to estimate and quantify the emission reduction potential of different climate interventions [21]. Recent research has also underlined the effectiveness of using life-cycle assessment (LCA) methodology to bring about GHG emission reductions locally and globally, as it accounts for emissions at a systemic level [22]. Furthermore, there have been calls for reliable information to support decision-making for future actions to ensure the effectiveness, continuity and development of climate work [23]. Besides sustainability and climate aspects, cities need to ensure their viability and livability in the face of changeable conditions. Adopting a pioneering role in climate actions may also promote the vitality and prosperity of a city.
To date, the assessment and quantification of positive climate impacts and avoided emissions has concentrated on product level, such as in the framework for estimating and reporting the comparative emissions impacts of products by the World Resources Institute (WRI) [24] and Kawasaki Mechanism Certification System [25]. The carbon handprint framework is applicable at product, service and project levels, as well as that of organisations, through a product or service portfolio [26]. However, a regional-level carbon handprint assessment has been lacking even though cities and regions also need tools to define, quantify and communicate the positive impacts of climate actions. In this paper, we present a novel approach to recognise and quantify the innovative climate actions implemented by a city or region. Our study responds to the need for a systematic, LCA-based framework to evaluate and quantify emission reduction potential of climate actions done by cities and regions also when aimed at carbon footprint reductions of other actors than city itself. The proposed approach is based on the carbon handprint framework [26], which provides guidelines to assess positive climate impacts.
2. Materials and Methods
This section briefly describes the methodological development of the regional carbon handprint approach and then introduces the case study. The framework for assessing the carbon handprint for cities and regions is presented in Section 3, ‘Results’, as is the outcome of the case study.
2.1. Methodology Development
This study applies the LCA-based carbon handprint approach introduced by Grönman et al. [14] and Pajula et al. [17]. The carbon handprint refers to the positive climate impacts that a product or service may yield when compared with a business-as-usual solution. Thus, the carbon handprint equates to the reduction in the carbon footprint of a product or service user. The carbon handprint approach has been modified recently to cover other elements besides products and services, such as projects and organisations through their product portfolios as well as other environmental categories beyond climate change [27]. In Lakanen et al., the carbon handprint was applied in the context of air quality [28].
Figure 1 presents the development stages of the regional carbon handprint approach. The starting point for the approach is the existing ISO standards for LCA [29,30] and carbon footprinting [31]. Moreover, the basis for carbon handprint thinking is derived from the work carried out by LUT University and the research institution VTT.
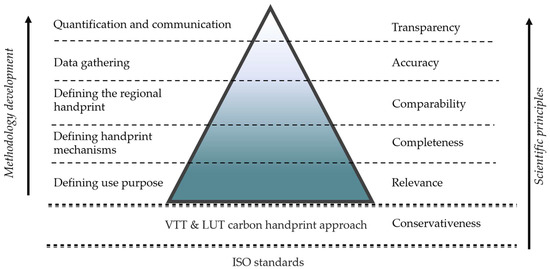
Figure 1.
The process of methodology development.
The methodology development for the carbon handprint of cities and regions followed the scientific principles of relevance, completeness, comparability, accuracy and transparency. Firstly, the purpose of the regional-level carbon handprint was defined with regard to relevancy. The need and use purpose of this approach were clarified according to recent literature as well as discussions with several city, regional council and voluntary sector representatives. Consequently, the use purpose of the city carbon handprint framework was built upon three main points:
1. Bringing the focus onto opportunities for a city to be a beneficial actor in climate-related issues. The opportunities cities have to mitigate climate change are not limited to reducing city GHG emissions or achieving carbon neutrality, but comprehend reducing GHG emissions more widely. In addition to reducing emissions, innovative actions with wide-reaching impacts serve as examples to others and help to reinforce a city′s continued viability.
2. Unveiling the significant potential of cities to act as solution providers for actors such as citizens and organisations both within and outside the city′s boundaries. Cities are important platforms for innovation and novel solutions. In cities, the cooperation between different actors, such as the city, educational institutions, companies and research facilities, provides a setting for developing innovations that benefit different stakeholders both within and outside the city.
3. Assisting a city to increase its handprint systematically so that benefits for the city can be maximised. One of the main aims of determining a city′s carbon handprint is to increase its handprint, year by year, which can only be achieved by systematic planning and establishing clear development targets in specific sectors which are important in the city.
In the second step of the methodology development process, the handprint mechanism categories for cities were identified following the principle of completeness. Versatile mechanisms were identified to guarantee that the complete set of contributors that reduce the footprint of others, and thus create the handprint in the regional setting, is considered. The third step involved ensuring that the regional handprint was defined in such a way that it could be compared with existing handprint frameworks and ISO standards. For the fourth step, the novel carbon handprint approach for cities and regions was applied to the case study, which began by gathering data in cooperation with the city of Espoo. The accuracy of the data used is vital to acquire reliable and useful results from the handprint assessment. Finally, the results of the case study were summarised and communicated transparently. This paper presents an exemplary calculation from the Espoo case and qualitatively describes other actions carried out in Espoo which may contribute to its carbon handprint.
Based on the methodology development, a systematic four-stage framework adapted from previous carbon handprint work [26] was compiled to define and guide regional carbon handprint assessments.
2.2. Case Study: The Carbon Handprint of the City of Espoo
To demonstrate the carbon handprint approach for cities, a case study of the city of Espoo, Finland, was conducted. Espoo is located in Southern Finland, in the region of Uusimaa, and is the second-largest Finnish city by population, with approximately 300,000 residents and a population density of 950/km2 [32]. Espoo is a hub for many major international technology companies and home to the Aalto University and Technical Research Center of Finland. The city of Espoo joined the CoM in 2010. In the same year, the city set a goal of reducing its GHG emissions by 28% from the 1990 level by the year 2020. Having reached this goal in 2016, the city set a further goal of reaching carbon neutrality by 2030, defined as an 80% reduction in emissions compared with the 1990 level. Espoo is also engaged in Sustainable Energy and Climate Action Plan (SECAP) submission, which consists of several measures aimed at GHG reductions in different sectors. To date, Espoo has, for example, executed emission-free and carbon-neutral district heating projects, increased the utilisation of renewable energy sources in city-owned buildings and advanced smart-home solutions within the city. Many of the actions have been carried out in collaboration with public and private organisations [33].
The case study was conducted primarily as a literature review to identify potential carbon handprint-producing activities associated with the city. Discussions with city representatives were also held to gather data. No exhaustive list of handprint contributors was composed, but relevant examples were identified and applied to the city carbon handprint framework. Although the total carbon handprint of a city is the sum of the effects of many activities, as an instance the handprint of a single activity was calculated.
3. Results and Discussion
The carbon handprint of a city or region is a means to recognise the climate leadership initiatives of a city and thereby maximise their positive impact, both in and outside the city. In addition to communicating the current climate actions taken by a city, the carbon handprint framework provides a tool to develop future climate actions.
3.1. The Framework for Assessing the Carbon Handprint of Cities and Regions
Figure 2 presents the framework for defining and assessing the carbon handprint of cities and regions. The framework consists of four stages, each including multiple steps, and thus provides detailed guidance for conducting regional-level carbon handprint assessments. In the following sections, every step of the first stage is explained. Instructions for stages 2–4 are available for review in the carbon handprint guide [26].
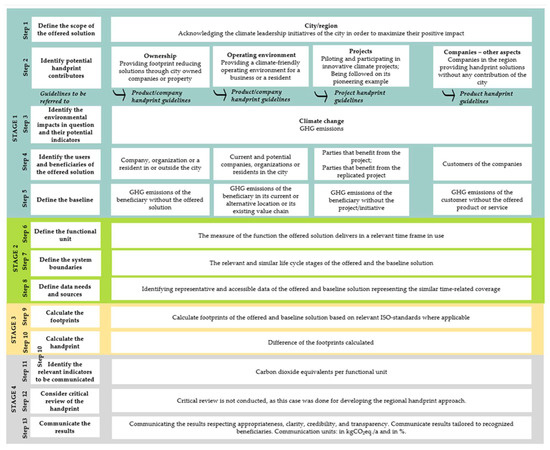
Figure 2.
The framework for assessing the carbon handprint of cities and regions.
The framework consists of four main stages: Stage 1. Handprint requirements; Stage 2. Additional LCA requirements; Stage 3. Quantification; and Stage 4. Communication. The first stage, handprint requirements, is specific to handprint assessments and the foundation of further quantification. The first step is to define the scope of the study, which in the case of regional carbon handprints refers to the city or region under review. In the next step, the actions which may generate or contribute to a handprint are identified and classified into mechanism categories. In our study, three main mechanism categories were identified:
- Ownership refers to the GHG-reduction actions that can be implemented through city-owned property or companies. For example, city-owned companies may provide products or services that reduce the carbon footprints of their customers or a city may provide real estate or land for climate-friendly initiatives.
- Operating environment refers to whether a city or a region offers a climate-friendly operating environment for a company or resident. For instance, through urban planning and construction, traffic, energy, waste management, implementation of a circular economy and public procurement processes, cities and regions may provide an operating environment that enables reductions in the carbon footprints of other actors.
- Projects refers to the innovative climate projects or other initiatives in which the city plays an important role. A city can achieve direct benefits by participating in projects that reduce the GHG emissions of beneficiaries or indirect benefits if some other actor follows its pioneering example and the climate-friendly initiate is replicated elsewhere.
In addition to the three main mechanism categories, handprint contributors can be classified as companies—other aspects; however, these contributors should be reported separately. This category includes companies providing carbon handprint solutions through products or services where a city or region has no connection to that company′s operations except offering them a location in which to function. However, for marketing and branding purposes, it might be advisable to communicate the carbon handprints of companies that operate in the area.
In the case of the mechanism categories of ownership and operating environment, the assessor is advised to refer to the product [26] or company handprint guidelines [34]. The mechanism category of projects follows the guidelines for project handprint assessment, which are elaborated upon by Vatanen et al. [34]. Additionally, in the context of companies—other aspects, the product handprint guidelines [26] should, again, be referred to.
The third step involves selecting the environmental impact categories and their indicators. Currently, the regional-level handprint only covers the impact category of climate change; thus, it is advised that GHG emissions and removals be included in the assessment.
Identifying the beneficiaries of the actions included in the carbon handprint assessment is crucial since the fundamental function of handprinting is to facilitate emission reductions by others. Step four is to identify the users or beneficiaries of the city′s climate actions identified in the previous steps. In the context of cities, beneficiaries may include the city′s current and potential residents, companies and organisations as well as actors outside the city borders. However, depending on the situation, several beneficiaries may be identified, or no beneficiaries may be precisely identified. Then, an examination can be conducted at the system level by considering the case from a wider point of view. For example, the carbon handprint assessment of climate change mitigation projects may require system-level examination when society as a whole is identified as a beneficiary.
The final step of Stage 1 concerns establishing baseline conditions, which creates a point of comparison in the handprint assessment. Choosing a baseline depends on the mechanism category, as presented in Figure 2. However, generally, in each case, a baseline represents the conditions as they would be without the relevant climate leadership initiative provided by the city. The baseline should be chosen based on the current practices and conditions that the beneficiary is facing. For more detailed instructions and additional information on the baseline determination procedure, the reader is advised to refer to the Carbon Handprint Guide v. 2.0 [26]. The guide also provides instructions for following Stages 2–4 of the handprint assessment.
3.2. Separating a Carbon Footprint from a Carbon Handprint
The carbon footprint of a city or region is an absolute measure of the total GHG emissions a city causes and removes [5]. In contrast, its carbon handprint defines and quantifies the emission reductions achieved in the carbon footprints of other actors due to the actions it performs.
The core of climate change mitigation activities in cities is the minimisation of the carbon emissions within a city, that is, the reduction of its carbon footprint. However, an even higher potential to reduce emissions exists in taking measures that affect the carbon footprint of others. Residents, other stakeholders and companies within and beyond a city might benefit from climate actions implemented by the city in terms of GHG reductions. For instance, by spreading good GHG-reduction practices, the impact of a city may reach even national and global levels. Hence, there is no upper limit when reducing the carbon footprint of others and, in contrast to its carbon footprint, a city′s carbon handprint should be extended to cover as many beneficiaries and areas as possible.
City-level assessments must consider separating the city as a geographical area from the city as an organisation. Generally, a city as an organisation is an executive organ of actions. Nevertheless, in a carbon footprint context, an emission inventory is performed according to activities occurring within the geographical boundaries of a city and reducing its carbon footprint requires the cutting of emissions or consumption within these predetermined boundaries. In contrast, in a carbon handprint assessment, geographical boundaries do not necessarily reflect the city′s boundaries because emission reductions may occur anywhere. Hence, geographical boundaries are defined for each case individually. However, handprint activities may also occur in the city and reduce the city′s carbon footprint. Importantly, the carbon handprint of a city cannot be subtracted from its carbon footprint. Figure 3 illustrates the relationship between the city as an organisation and the geographical boundaries of the footprint and handprint assessments of a city.
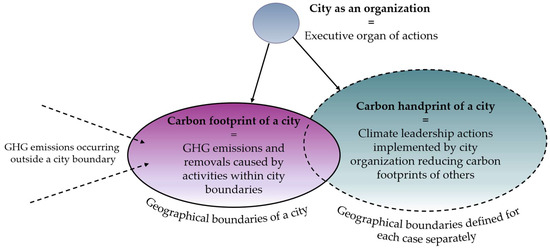
Figure 3.
Relationship between the city as an organisation and the geographical boundaries of the footprint and handprint assessments.
3.3. The Results of the Espoo Case Study
In the case study, the carbon handprint contributors in the city of Espoo were divided according to the three main mechanism categories: ownership, operating environment and projects. Additionally, the actions that fall within the mechanism category of companies—other aspects were identified, but they should be reported separately. As the case study was conducted to support methodology development, no exhaustive list of handprint contributors was composed; rather, one example of each mechanism category was selected to be applied to the framework. Some additional examples of handprint contributors in Espoo are also mentioned in the text, but not in the framework.
Figure 4 illustrates three identified handprint contributors in the city of Espoo applied to the framework of the city′s carbon handprint. Only the first two stages are represented as they are the most central, as well as being unique to case assessments. Stages 3 and 4 follow the general framework represented in Figure 2.
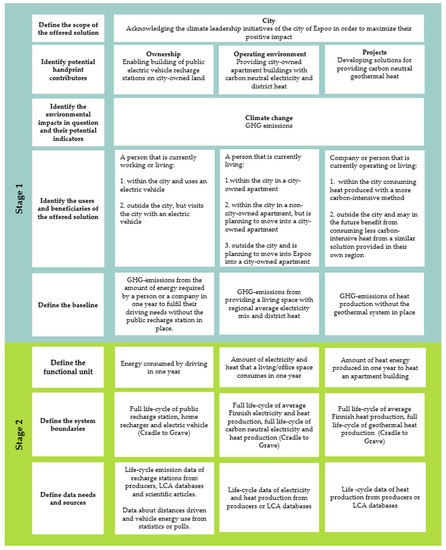
Figure 4.
The framework for assessing the carbon handprint in the case of Espoo.
The mechanism category of ownership refers to city-owned companies or property through which the city can provide carbon footprint-reducing solutions to users. In the case of Espoo, a potential footprint-reducing activity related to city-owned property is enabling the placement of market-based electric vehicle (EV) charging stations on city-owned land. Although policies allowing the installation of charging stations on city-owned land or property do not directly reduce the carbon footprint of the city, the existence of an expanding charge station network may encourage the phasing out of fossil fuel vehicles, thus contributing to the city′s carbon handprint. Additionally, the availability of public EV chargers has the potential to create a carbon handprint when the charger uses renewable electricity instead of average grid mix [33].
The second handprint mechanism category is related to providing a climate-friendly operating environment for a business or resident. This category includes activities such as promoting carbon-neutral electricity production through solar electricity bidding, actions to increase the efficiency and diversity of transport and the provision of local ecosystems for green business [33]. The activity of providing city-owned apartment buildings with carbon neutral electricity and district heat is selected as an example in Figure 4.
The third mechanism category relates to the pioneering of novel footprint-reducing solutions. Espoo has been a pioneer in electrifying the public bus network. Currently, the city is participating in a geothermal energy project aiming at carbon neutrality. Successful projects may be replicated by other cities in the future and thus contribute to increasing Espoo′s carbon handprint [33].
The fourth and final mechanism category is related to the many ways in which non-city-owned companies can increase a city′s carbon handprint. Example activities within this category are the implementation of a virtual power plant within a shopping centre in the city and cleantech companies in the city providing footprint-reducing solutions to their customers [33]. However, the fourth mechanism category is excluded from Figure 4 as the city of Espoo has no immediate connection to these handprint activities. At the same time, they might increase the city′s attractiveness and viability.
The total carbon handprint of a city is the sum of the effects of many activities. To demonstrate the quantitative assessment, the carbon handprint of building public EV charge stations on city-owned land from the mechanism category of ownership was calculated. The hypothesis was that the availability of public EV chargers has the potential to create a carbon handprint if the charger uses renewable electricity. The handprint is created by the difference in carbon footprint when compared to charging the vehicle using an electricity mix containing energy produced with fossil fuels. In the calculation, the user of an offered solution is a person who already lives within the city and owns an EV.
EV charging at home with the national Finnish electricity mix is used as a baseline, whereas the offered solution includes the use of public charging stations in Espoo operating with electricity from wind power. The system boundaries of the solutions are presented in Figure 5. Calculations about the life cycle GHG emissions of an EV are not included in the assessment, as the life cycle is included in both solutions. The difference in the carbon footprints of the solutions is represented by the differences in life-cycle emissions between a home charger using mixed electricity and a public charger using renewable energy. The functional unit is the amount of energy consumed by driving an EV in one year.
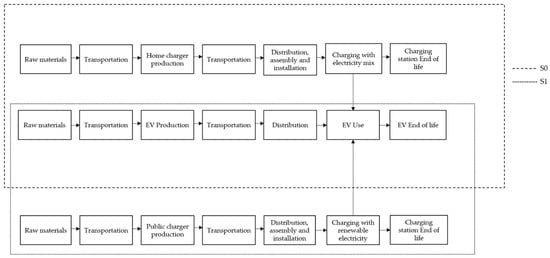
Figure 5.
System boundaries of the baseline solution (S0) and the offered solution (S1).
The national Finnish average distance driven using a vehicle powered by a method of propulsion other than petrol or diesel was 15,062 km in 2018 [35]. The energy consumption of an EV is generally between 0.15 kWh/km and 0.30 kWh/km [36]. In the assessment, the average value 0.225 kWh/km is used. The GWP100 values for the Finnish electricity grid mix and electricity from wind power were derived from the GaBi LCA modelling software database [37]. The public chargers in Espoo are alternative current (AC) chargers. In its use stage, a public AC charger produces 9.62 gCO2eq/kWh more emissions than a home charging device, due to greater use of material and energy during the material acquisition and manufacturing stages and to greater electricity loss in the use stage. The lifetime of both charger types is assumed to be eight years [38].
Maximum carbon footprint from the use of each charger type is produced when 100% of charging is carried out with a specific charger. For one EV vehicle, the carbon footprints for home charging and public charging are shown to be 671 kgCO2eq/a and 62 kgCO2eq/a, respectively. The maximum carbon handprint for a public charger can be calculated as the difference of the carbon footprints. Consequently, the maximum carbon handprint for a public charger is 609 kgCO2eq/a for the one EV vehicle. In 2021, 18 new public charging stations were installed in Espoo [39]. As the European Union suggests that there should be, on average, one charging point per 10 cars [40], the potential to charge 180 EVs is created. In that case, maximum carbon footprints for home charging and public charging are 121 tCO2eq/a and 11 tCO2eq/a, respectively. The carbon handprint potential of installed public charging stations corresponds to up to 110 tCO2eq/a, as visualised in Figure 6. This equals 91% emission reduction potential.
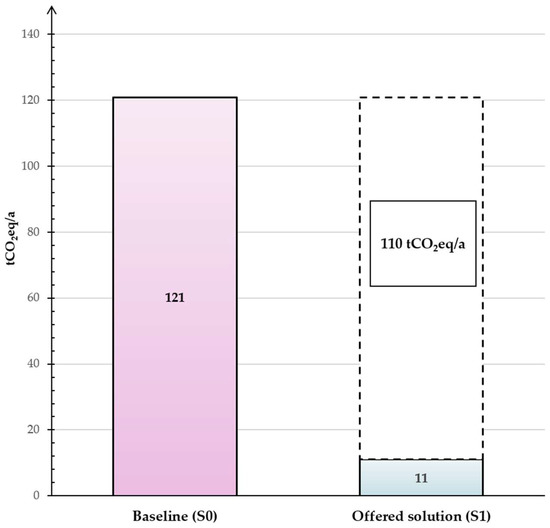
Figure 6.
Carbon footprint and handprint of different solutions.
In reality, it is unlikely that 100% of EV charging is carried out in public charging stations. The more plausible scenario is one where the vehicle is charged both at home and at a public charging station during the year. In such a scenario, the handprint of EV charging in 18 new public charging stations will be between 0 and 110 tCO2eq/a, where the numbers correspond to 0% and 100% of charging carried out at a public station, respectively.
3.4. Utility of the Carbon Handprint Approach for Cities
Whereas community-scale GHG inventories form the basis for understanding emission sources and reduction potential within a city′s boundaries [5], the carbon handprint communicates the emission reduction potential which cities and regions may be able to achieve at global level.
Previous studies have indicated that cities′ potential to reduce the GHG emissions originating from the activities that take place within their boundaries are limited [13]. Additionally, community-level GHG accounting contains several uncertainties, which may further restrict climate change mitigation activities. For example, climate neutrality may be achieved more readily when convenient system boundaries are set in GHG inventory [41]. Thus, besides developing and harmonising present GHG accounting frameworks, the recognition and implementation of more widespread GHG-reduction activities are needed for cities to reach their full potential as mitigators of climate change. The regional carbon handprint approach presented in this paper provides a scientific and coherent framework by describing guidelines for assessing, as well as developing, large-scale mitigation activities in cities from a positive point of view. As the handprint framework provides an important extension to the existing climate work being done in cities, in the future, it would be interesting to consider integrating it into voluntary frameworks such as CoM commitments.
Besides providing an instrument to enhance climate change mitigation work, a carbon handprint can be used as a communication tool in cities′ marketing and branding. It provides a reliable indicator when communicating and promoting the actions a city is taking in the battle against climate change to attract new residents, businesses and initiatives to the area. With a systematic strategy, cities can maximise their handprint potential in the years to come. Additionally, especially given that recent research has underlined the need to transition from resource-dependent industrialisation to innovation-driven sustainable development in urban areas [42] and to avoid locking ourselves into high-emission pathways in the future [43], a systematic handprint strategy will promote and support cities′ development of novel, innovative solutions to combat climate change. For example, decisions concerning land use and infrastructure can significantly affect the future direction of emissions.
In the carbon handprint approach, identifying beneficiaries, users or clients is essential as the fundamental purpose of this approach is to reduce the carbon footprint of others. In the case of cities, a large number of diverse beneficiaries can be identified, such as residents, companies and other cities. One beneficiary group, companies, may gain considerable benefits from the climate actions implemented by cities. As companies strive for carbon neutrality and fewer emissions, cities can help to reduce their emissions, which may, in turn, reduce the need to compensate for emissions in companies. For example, cities may provide renewable fuels for companies, energy-efficient facilities or products that reduce the carbon footprint of the supply chain. Thus, the carbon handprint of cities also supports the work companies are doing to mitigate climate change as well as emission reductions on a larger scale.
Whereas community-level GHG accounting is based on the absolute emissions caused by a city, the carbon handprint concentrates on acknowledging and quantifying the emission-reduction potential of city-driven climate actions. In this paper, the carbon handprint approach for cities and regions was applied to the city of Espoo by identifying handprint contributors and calculating the carbon handprint for public EV charging stations built on city-owned land from the mechanism category of ownership. The results show that the city′s climate leadership actions can be recognised and classified according to the guidelines, and the carbon handprint of different contributors can be quantified. However, future research is needed, particularly in terms of data gathering, quantification and communication. For instance, it should be studied whether it is feasible to compare cities′ handprints with each other.
4. Conclusions
This study modifies previous carbon handprint framework to be applicable in the scope of cities and regions. Presented framework provides guidelines to quantify and communicate GHG emission reduction potential of actions launched by a city, which also reduce carbon footprints of other actors. By following step-by-step guidelines, GHG-reductive climate activities of cities can be recognised, categorised and quantified, as shown in the case study of Espoo.
For wider adaptation of the carbon handprint framework of cities and regions, the following policy recommendations are given. The carbon handprint should be included in the climate work of cities to reliably show the life-time emission reduction potential of climate interventions. Cities and regions should develop the carbon handprint potential through long-term strategic planning to systematically increase the efficiency of their climate actions. The carbon handprint of cities and regions could be used as communication tool in cities′ marketing and branding to enhance the viability and attractiveness of a city or region. In future, the carbon handprint assessment could be integrated into international commitment frameworks such as CoM and C40 Cities.
The aim is that the carbon handprint framework for cities and regions would encourage cities and regions to develop and assess novel, innovative and widespread solutions in their climate work. As the main purpose of this study is to introduce and briefly test the novel framework for assessing regional-level carbon handprints, additional qualitative and quantitative case studies are suggested.
Author Contributions
Conceptualization, L.L., O.H., K.G. and R.S.; methodology, L.L., O.H., K.G. and R.S.; software, L.L. and O.H.; validation, L.L., H.K., O.H., K.G. and R.S.; formal analysis, L.L., O.H. and K.G.; investigation, L.L., O.H., K.G. and R.S.; resources, L.L., O.H., K.G. and R.S.; data curation, L.L., O.H., K.G. and R.S.; writing—original draft preparation, L.L., H.K. and O.H.; writing—review and editing, L.L., H.K., O.H., K.G. and R.S.; visualization, L.L., O.H. and K.G.; supervision, K.G. and R.S.; project administration, K.G. and R.S.; funding acquisition, K.G. and R.S. All authors have read and agreed to the published version of the manuscript.
Funding
This research was funded by Helsinki-Uusimaa Regional Council, grant number 307/07.00.03.02/2021.
Institutional Review Board Statement
Not applicable.
Informed Consent Statement
Not applicable.
Data Availability Statement
Not applicable.
Acknowledgments
The authors acknowledge Helsinki-Uusimaa Regional Council for funding and cooperation. The authors would also like to thank Climate Leadership Coalition (CLC) and city of Espoo for the support and case related discussions.
Conflicts of Interest
The authors declare no conflict of interest.
References
- United Nations, Department of Economic and Social Affairs, Population Division. The World ’s Cities in 2018: Data Booklet; ST/ESA/SER.A/417; UN: New York, NY, USA, 2018. [Google Scholar]
- International Energy Agency IEA. World Energy Outlook 2021; IEA: Paris, France, 2021. [Google Scholar]
- Mi, Z.; Guan, D.; Liu, Z.; Liu, J.; Viguié, V.; Fromer, N.; Wang, Y. Cities: The core of climate change mitigation. J. Clean. Prod. 2019, 207, 582–589. [Google Scholar] [CrossRef]
- Pulselli, R.M.; Broersma, S.; Martin, C.L.; Keeffe, G.; Bastianoni, S.; van den Dobbelsteen, A. Future city visions. The energy transition towards carbon-neutrality: Lessons learned from the case of Roeselare, Belgium. Renew. Sustain. Energy Rev. 2021, 137, 110612. [Google Scholar] [CrossRef]
- WRI. C40—ICLEI Global Protocol for Community-Scale Greenhouse Gas Inventories. An Accounting and Reporting Standard for Cities; WRI: Washington, DC, USA, 2014; ISBN 1-56973-846-7. [Google Scholar]
- British Standards Institution BSI. PAS 2070:2013—Specification for the Assessment of Greenhouse Gas Emissions of a City; BSI Standards Limited: London, UK, 2013; ISBN 978-0-580-77402-7. [Google Scholar]
- Karhinen, S.; Peltomaa, J.; Riekkinen, V.; Saikku, L. Impact of a climate network: The role of intermediaries in local level climate action. Glob. Environ. Chang. 2021, 67, 102225. [Google Scholar] [CrossRef]
- Dahal, K.; Niemelä, J. Cities’ greenhouse gas accounting methods: A study of Helsinki, Stockholm, and Copenhagen. Climate 2017, 5, 31. [Google Scholar] [CrossRef] [Green Version]
- Salvia, M.; Reckien, D.; Pietrapertosa, F.; Eckersley, P.; Spyridaki, N.A.; Krook-Riekkola, A.; Olazabal, M.; De Gregorio Hurtado, S.; Simoes, S.G.; Geneletti, D.; et al. Will climate mitigation ambitions lead to carbon neutrality? An analysis of the local-level plans of 327 cities in the EU. Renew. Sustain. Energy Rev. 2021, 135, 110253. [Google Scholar] [CrossRef]
- Carbon Neutral Finland Hinku Network—Towards Carbon Neutral Municipalities. Available online: https://www.hiilineutraalisuomi.fi/en-US/Hinku (accessed on 17 March 2022).
- Covenant of Mayors. Reporting Guidelines. Available online: https://www.covenantofmayors.eu/IMG/pdf/Covenant_ReportingGuidelines.pdf (accessed on 21 March 2022).
- C40 Cities: C40 Annual Report. 2020. Available online: https://www.c40.org/wp-content/uploads/2021/11/C40_Annual_Report_2020_vMay2021_lightfile.pdf (accessed on 22 February 2022).
- Laine, J.; Heinonen, J.; Junnila, S. Pathways to carbon-neutral cities prior to a national policy. Sustainability 2020, 12, 2445. [Google Scholar] [CrossRef] [Green Version]
- Grönman, K.; Pajula, T.; Sillman, J.; Leino, M.; Vatanen, S.; Kasurinen, H.; Soininen, A.; Soukka, R. Carbon handprint—An approach to assess the positive climate impacts of products demonstrated via renewable diesel case. J. Clean. Prod. 2019, 206, 1059–1072. [Google Scholar] [CrossRef]
- Norris, G.A.; Burek, J.; Moore, E.A.; Kirchain, R.E.; Gregory, J. Sustainability Health Initiative for NetPositive Enterprise handprint methodological framework. Int. J. Life Cycle Assess. 2021, 26, 528–542. [Google Scholar] [CrossRef]
- Biemer, J.R. Our Environmental Handprints. Recover the Land, Reverse Global Warming, Reclaim the Future; Rowman & Littlefield Publishers: London, UK, 2021; ISBN 9781538140666. [Google Scholar]
- Pajula, T.; Vatanen, S.; Pihkola, H.; Grönman, K.; Kasurinen, H.; Soukka, R. Carbon Handprint Guide; VTT Technical Research Centre of Finland: Espoo, Finland, 2018. [Google Scholar]
- Rosenzweig, C.; Solecki, W.; Hammer, S.A.; Mehrotra, S. Cities Lead the Way in Climate-Change Action. Nature 2010, 467, 909–911. [Google Scholar] [CrossRef] [PubMed]
- Kern, K. Cities as leaders in EU multilevel climate governance: Embedded upscaling of local experiments in Europe. Environ. Polit. 2019, 28, 125–145. [Google Scholar] [CrossRef]
- Mohareb, E.A.; Heller, M.C.; Guthrie, P.M. Cities’ Role in Mitigating United States Food System Greenhouse Gas Emissions. Environ. Sci. Technol. 2018, 52, 5545–5554. [Google Scholar] [CrossRef] [PubMed]
- Sethi, M.; Lamb, W.; Minx, J.; Creutzig, F. Climate change mitigation in cities: A systematic scoping of case studies. Environ. Res. Lett. 2020, 15, 93008. [Google Scholar] [CrossRef]
- Cellura, M.; Cusenza, M.A.; Longo, S. Energy-related GHG emissions balances: IPCC versus LCA. Sci. Total Environ. 2018, 628–629, 1328–1339. [Google Scholar] [CrossRef] [PubMed]
- Bai, X.; Dawson, R.J.; Ürge-Vorsatz, D.; Delgado, G.C.; Salisu Barau, A.; Dhakal, S.; Dodman, D.; Leonardsen, L.; Masson-Delmotte, V.; Roberts, D.C.; et al. Six research priorities for cities and climate change. Nature 2018, 555, 23–25. [Google Scholar] [CrossRef] [PubMed]
- Russell, S. Estimating and Reporting the Comparative Emissions Impacts of Products. Available online: https://files.wri.org/d8/s3fs-public/estimating-and-reporting-comparative-emissions-impacts-products_0.pdf (accessed on 17 April 2022).
- Kawasaki City. Kawasaki Mechanism Certification System. Available online: http://www.k-co2brand.com/mechanism/en/ (accessed on 17 April 2022).
- Pajula, T.; Vatanen, S.; Behm, K.; Grönman, K.; Lakanen, L.; Kasurinen, H.; Soukka, R. Carbon Handprint Guide V. 2.0. In Applicable for Environmental Handprint; VTT Technical Research Centre of Finland: Espoo, Finland, 2021. [Google Scholar]
- Lakanen, L.; Grönman, K.; Kasurinen, H.; Vatanen, S.; Pajula, T.; Behm, K.; Soukka, R. Approach for assessing environmental handprints. E3S Web Conf. 2022, 349, 12001. [Google Scholar] [CrossRef]
- Lakanen, L.; Grönman, K.; Väisänen, S.; Kasurinen, H.; Soininen, A.; Soukka, R. Applying the handprint approach to assess the air pollutant reduction potential of paraffinic renewable diesel fuel in the car fleet of the city of Helsinki. J. Clean. Prod. 2021, 290, 125786. [Google Scholar] [CrossRef]
- ISO 14040; Environmental Management—Life Cycle Assessment—Principles and Framework. ISO: Geneva, Switzerland, 2006.
- ISO 14044; Environmental Management—Life Cycle Assessment—Requirements and Guidelines. ISO: Geneva, Switzerland, 2006.
- ISO 14067; Greenhouse Gases. Carbon Footprint of Products. Requirements and Guidelines for Quantification. ISO: Geneva, Switzerland, 2018.
- Statistics Finland. Data by Municipality. Available online: https://www.stat.fi/tup/alue/tietoakunnittain_en.html (accessed on 12 April 2022).
- Sjöblom, L.; Stambej, T.; Olsen, S. Espoon Kaupungin Kestävän Energian ja Ilmaston Toimintasuunnitelma (SECAP); Espoon kaupunki: Espoo, Finland, 2019. [Google Scholar]
- Vatanen, S.; Grönman, K.; Behm, K.; Pajula, T.; Lakanen, L.; Kasurinen, H.; Soukka, R.; Hepo-oja, L.; Lindfors, K.; Alarotu, M. The Environmental Handprint Approach to Assessing and Communicating the Positive Environmental Impacts. Final Report of the Environmental Handprint Project; VTT Technology: Espoo, Finland, 2021; p. 392. ISBN 978-951-38-8752-0. [Google Scholar]
- Statistics Finland. Tieliikenteen Ajokilometreissä Edelleen Hienoista Kasvua. Available online: https://www.stat.fi/tietotrendit/artikkelit/2019/tieliikenteen-ajokilometreissa-edelleen-hienoista-kasvua/?listing=simple (accessed on 12 April 2022).
- Motiva. Sähköautot. Available online: https://www.motiva.fi/ratkaisut/kestava_liikenne_ja_liikkuminen/valitse_auto_viisaasti/ajoneuvotekniikka/moottoritekniikka/sahkoautot (accessed on 12 April 2022).
- Sphera GaBi Ts—Software-System and Database for the Life Cycle Engineering. 2019. Available online: https://gabi.sphera.com/nw-eu-english/index/ (accessed on 12 April 2022).
- Zhang, Z.; Sun, X.; Ding, N.; Yang, J. Life cycle environmental assessment of charging infrastructure for electric vehicles in China. J. Clean. Prod. 2019, 227, 932–941. [Google Scholar] [CrossRef]
- Espoon Kaupunki Lisää Julkisia Sähköautojen Latauspisteitä Helenin Kanssa—Tuulisähköä Hyödyntävät Latauspisteet Yleistyvät Koko Suomessa. Available online: https://www.helen.fi/uutiset/2021/espoon-kaupunki-lisää-julkisia-sähköautojen-latauspisteitä-helenin-kanssa-tuulisähköä-hyödyntävät-latauspisteet-yleistyvät-koko-suomessa (accessed on 12 April 2022).
- European Commission Directive 2014/94/EU—Deployment of alternative fuels infrastructure. Off. J. Eur. Union 2014, L307, 20.
- Heinonen, J.; Ottelin, J. Carbon Accounting for Regenerative Cities. In Rethinking Sustainability towards a Regenarative Economy; Andreucci, M., Marvuglia, A., Baltov, M., Hansen, P., Eds.; Springer: Cham, Switzerland, 2021; p. 15. [Google Scholar] [CrossRef]
- Wei, T.; Wu, J.; Chen, S. Keeping Track of Greenhouse Gas Emission Reduction Progress and Targets in 167 Cities Worldwide. Front. Sustain. Cities 2021, 3, 696381. [Google Scholar] [CrossRef]
- Ürge-Vorsatz, D.; Rosenzweig, C.; Dawson, R.J.; Sanchez Rodriguez, R.; Bai, X.; Barau, A.S.; Seto, K.C.; Dhakal, S. Locking in positive climate responses in cities. Nat. Clim. Chang. 2018, 8, 174–177. [Google Scholar] [CrossRef] [Green Version]
Publisher’s Note: MDPI stays neutral with regard to jurisdictional claims in published maps and institutional affiliations. |
© 2022 by the authors. Licensee MDPI, Basel, Switzerland. This article is an open access article distributed under the terms and conditions of the Creative Commons Attribution (CC BY) license (https://creativecommons.org/licenses/by/4.0/).